
Beyond Operational Energy Efficiency: A Balanced Sustainability Index from a Life Cycle Consideration


1
School of Architecture, Planning & Preservation, University of Maryland, College Park, MD 20742, USA
2
Faculty of Architecture, Civil Engineering and Applied Arts, University of Technology, Rolna 43, 40-555 Katowice, Poland
Sustainability 2021, 13(20), 11263; https://doi.org/10.3390/su132011263
Submission received: 31 August 2021
/
Revised: 29 September 2021
/
Accepted: 5 October 2021
/
Published: 13 October 2021
(This article belongs to the Topic Sustainability in Buildings: New Trends in the Management of Construction and Demolition Waste)
Abstract
:Most deep energy renovation projects focus only on an operating energy reduction and disregard the added embodied energy derived from adding insulation, window/door replacement, and mechanical system replacement or upgrades. It is important to study and address the balance and trade-offs between reduced operating energy and added embodied energy from a whole life cycle perspective to reduce the overall building carbon footprint. However, the added embodied energy and related environmental impact have not been studied extensively. In response to this need, this paper proposes a holistic sustainability index that balances the trade-off between reduced operating energy and added embodied energy. Eight case projects are used to validate the proposed method and calculation. The findings demonstrate that using a balanced sustainability index can reveal results different from a conventional operating energy-centric approach: (a) operating energy savings can be offset by the embodied energy gain, (b) the operating energy savings do not always result in a life cycle emissions reduction, and (c) the sustainability index can vary depending on the priorities the decision makers give to operating carbon, embodied carbon, and operating cost. Overall, the proposed sustainability score can provide us with a more comprehensive understanding of how sustainable the renovation works are from a life cycle carbon emissions perspective, providing a more robust estimation of global warming potential related to building renovation.
1. Introduction
In Europe, the existing building stock is more than 50 years old, and about 40% of the existing residential buildings were constructed before the 1960s, when building regulations for energy consumption were limited [1]. Consequently, around 75% of the existing building stock in the European Union (EU) is energy inefficient [2]. In the United States, most existing houses were built before the establishment of the Building Energy Codes Program in 1992 by the U.S. Department of Energy, Washington, DC, United States [3]. These older buildings represent about 68% of the national residential building stock and are typically energy inefficient due to air leakage and inadequate insulation [2]. The National Renewable Energy Laboratory has identified approximately 34.5 million homes with wood studs that have no wall insulation [4]. Overall, in both the United States and Europe, a large portion of residential buildings will need some type of renovation, retrofit, or upgrade in the next five to 10 years.
There have been large investments in energy efficiency-related renovation in the global market. In the period 2012–2016, in the EU, more than EUR 200 billion were invested in energy renovations for residential buildings. In the next decades, energy renovation will become the key determiner for achieving the carbon-neutral goal. The European Climate Foundation has outlined three key areas for the building industry to maintain its trajectory toward zero emissions. One of the areas is reducing energy demand—specifically the operating energy demand—through renovation of the building stock [5]. In the United Sates, more than USD 279 billion could be invested in building retrofits, resulting in more than USD 1 trillion in energy savings over 10 years, equal to a savings of about 30% of the annual electricity used in the United States (Rockefeller Foundation 2012, New York City, NK, The United States) [6]. The above figures highlight the significant impact building retrofits already have within the EU and American economies. There is space for tremendous potential and growth in both the European Union and the United States.
Currently, the building sector responds to the need for energy retrofits by focusing on an operating energy use reduction. Increasing numbers of companies have announced their commitment to the net zero carbon goal, based on the assumption that operating energy savings leads to an overall carbon emissions reduction and a healthy environment. However, the question remains: Is the current energy-centric renovation approach sustainable? Several studies have looked at the relation between operating energy and embodied energy. Dodoo et al. [7] found that an increase in the thermal mass in the building envelope reduced the cooling load, and hence the operating energy demand; however, such a renovation increases embodied energy considerably. Ellura et al. [8] adopted a life cycle approach for studying net zero energy building, and results showed that when the addition of embodied energy was included in the whole life cycle emission count, the net zero building performance largely shifted away from the nearly zero energy goal. Hu studied energy-efficient renovations in comparison to existing buildings, and showed that the new construction had greater environmental impact potential due to the new building materials added. Such results raised concerns of focusing only on an operating energy reduction while overlooking the added environmental impact [9].
In recent years, there have been studies focusing on the trade-off between embodied and operating carbon. Crawford et al. [10] studied the impact of different building materials of eight residential construction assemblies; a theoretical generic building was used as a base building. Rossello-Batel et al. [11] studied the relation between reduced heating demand and the embodied energy of different building typologies and building envelope options. They found that adding additional insulation in the façade can reduce energy demand to one third of the existing condition while having the highest increase in embodied energy. Stephan et al. [12] also found an increase in insulation in passive houses could reduce the heating demand in the winter, but such a decrease was offset by the higher embodied energy embedded in the insulation materials. With the increase in research on the relation between embodied and operating carbon, most studies were conducted on theoretical conditions using simulated data. Studies using data from actual renovated buildings are limited due to inaccessibility of the data.
The importance of understanding the trade-off between operating and embodied energies and their related carbon emissions has been gradually recognized by practitioners and researchers. Consequently, creating a comprehensive and holistic measurement of sustainability for building energy retrofits has become an emerging research topic. However, there have been very few studies and efforts on this topic, and proposed measurements vary greatly. For example, Bakar et al. [13] proposed using an energy efficiency index as an indicator for measuring building energy performance. Such an index is calculated as the ratio of the energy input to the factor related to the energy-using component. The embodied energy was included as one related factor and measured by the weight of the raw material used. Varusha et al. [14] suggested using the EE factor to quantify the trade-off between the embodied and operating energies of a building. The EE factor is calculated as the ratio of operating energy to embodied energy of a proposed building design against the ratio of a base building based on the ASHRAE 2016 benchmark. Triana et al. [15] proposed a sustainability index in the building life cycle energy use that includes life cycle energy consumption, life cycle carbon emissions, thermal comfort hours, and cost of the building energy life cycle. Those four values are added together and then divided by four to get the sustainability index. However, there is no sustainability index proposed especially for a building retrofit yet.
To respond to such a research gap, the aim of this study is to reveal the importance of considering embodied energy in current energy retrofit practices since the most energy-efficient building is not necessarily the most sustainable building. Consequently, a comprehensive measure of the sustainability of a renovation project is proposed to measure the effectiveness of a building energy retrofit by integrating the life cycle assessment. This paper uses eight actual energy retrofit projects to demonstrate the trade-off between operating energy and embodied energy. The renovation techniques applied to the eight buildings include a building envelope retrofit, a building heating and ventilation system renovation and upgrades, a lighting system upgrade, and other renovation techniques. This study contributes mainly to the body of knowledge of sustainability by (1) highlighting the importance of embodied energy consideration in energy retrofit projects, (2) presenting a new measure for a sustainability index for renovation projects, and (3) testing the proposed sustainability index and evaluating the sensitivity of the results by applying them to real projects.
2. Method
2.1. Studied Buildings
2.1.1. Selection of Buildings
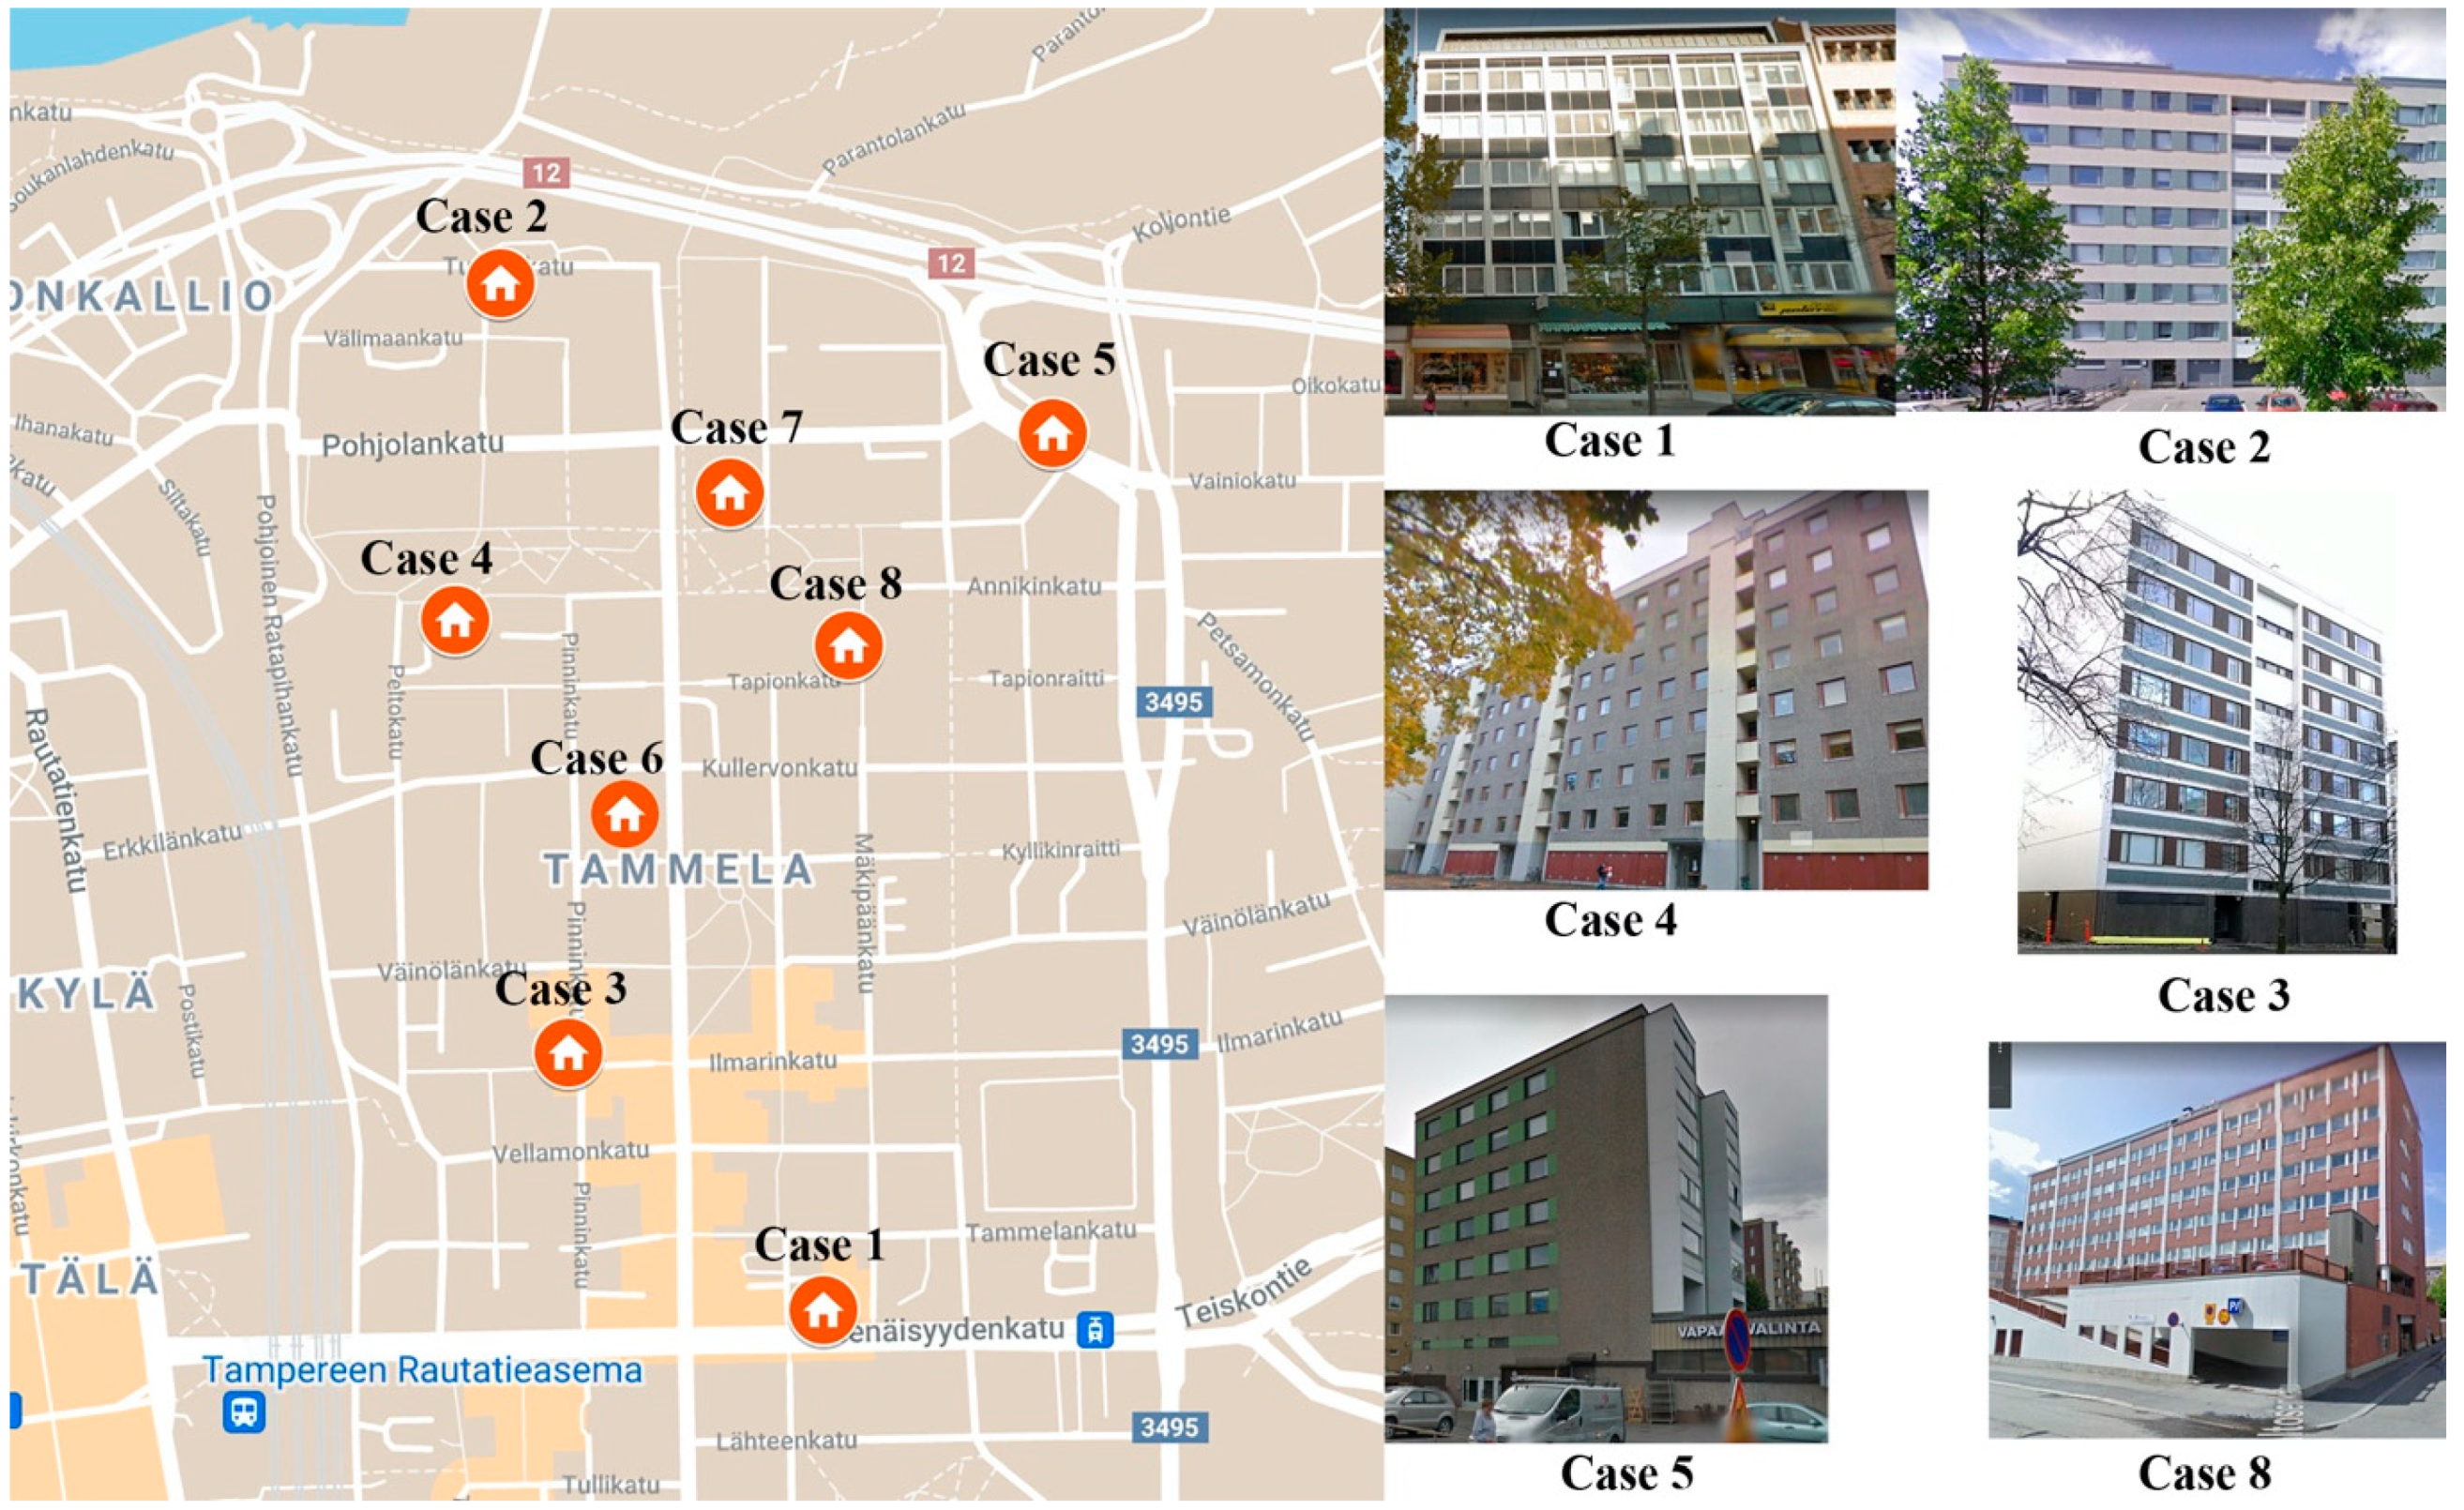
The selection of buildings was largely based on the data availability. Often the actual building energy use data after renovation were not easy to obtain. Eight projects were used in this study to control the variables of building size, age, building system used, and local climate condition. All eight buildings are located in the same city and were built around similar periods, with the energy retrofits mainly focused on the buildings’ heating system and exterior façade. Demonstrated in Figure 1 the eight buildings were part of the “European cities serving as Green Urban Gate towards leadership in sustainable energy” (EU_GUGLE) project [16]. The project aimed to demonstrate the feasibility of a nearly zero energy building renovation target; it started in 2013 and lasted for six years. Six pilot cities from Italy, Austria, Finland, Denmark, Estonia, and Slovakia participated in the project. Around 200,000 m2 of gross floor area was renovated and targeted primary (source) energy savings of up to 82%. Eight buildings in Tampere, Finland, participated in EU_GUGLE. All eight buildings are in the Tammela district, a traditional residential district close to the city center and railway station. There is a total of around 299,000 m2 of existing building stock in Tammela district. The current average energy use intensity is 213 kWh/m2, and the target intensity is 160 kWh/m2 [17], around a 25% operating energy reduction.
2.1.2. Case Building Physical Characteristics
The studied buildings were built between 1961 and 1980; the renovations were completed between 2014 and 2019. Seven buildings have six floors and one has four floors—only the four-story building was built in the first half of the 1960s. All eight buildings selected reflected a typical building constructed in the 1960s and 1970s before building energy regulations were enforced in Finland [18]. According to Niemelä et al., 2017, Finnish multifamily buildings constructed in the first half of the 1960s were normally built on-site with a tile building façade and “bookshelf-type” framework [19]. Beginning in the late 1960s, prefabricated large concrete panels became the main construction type [19]. In fact, all the studied buildings had prefabricated concrete panels. Table 1 shows the main characteristics of the studied buildings—the buildings’ initial conditions without any energy performance improvement interventions.
2.1.3. Building Envelope and Materials Used
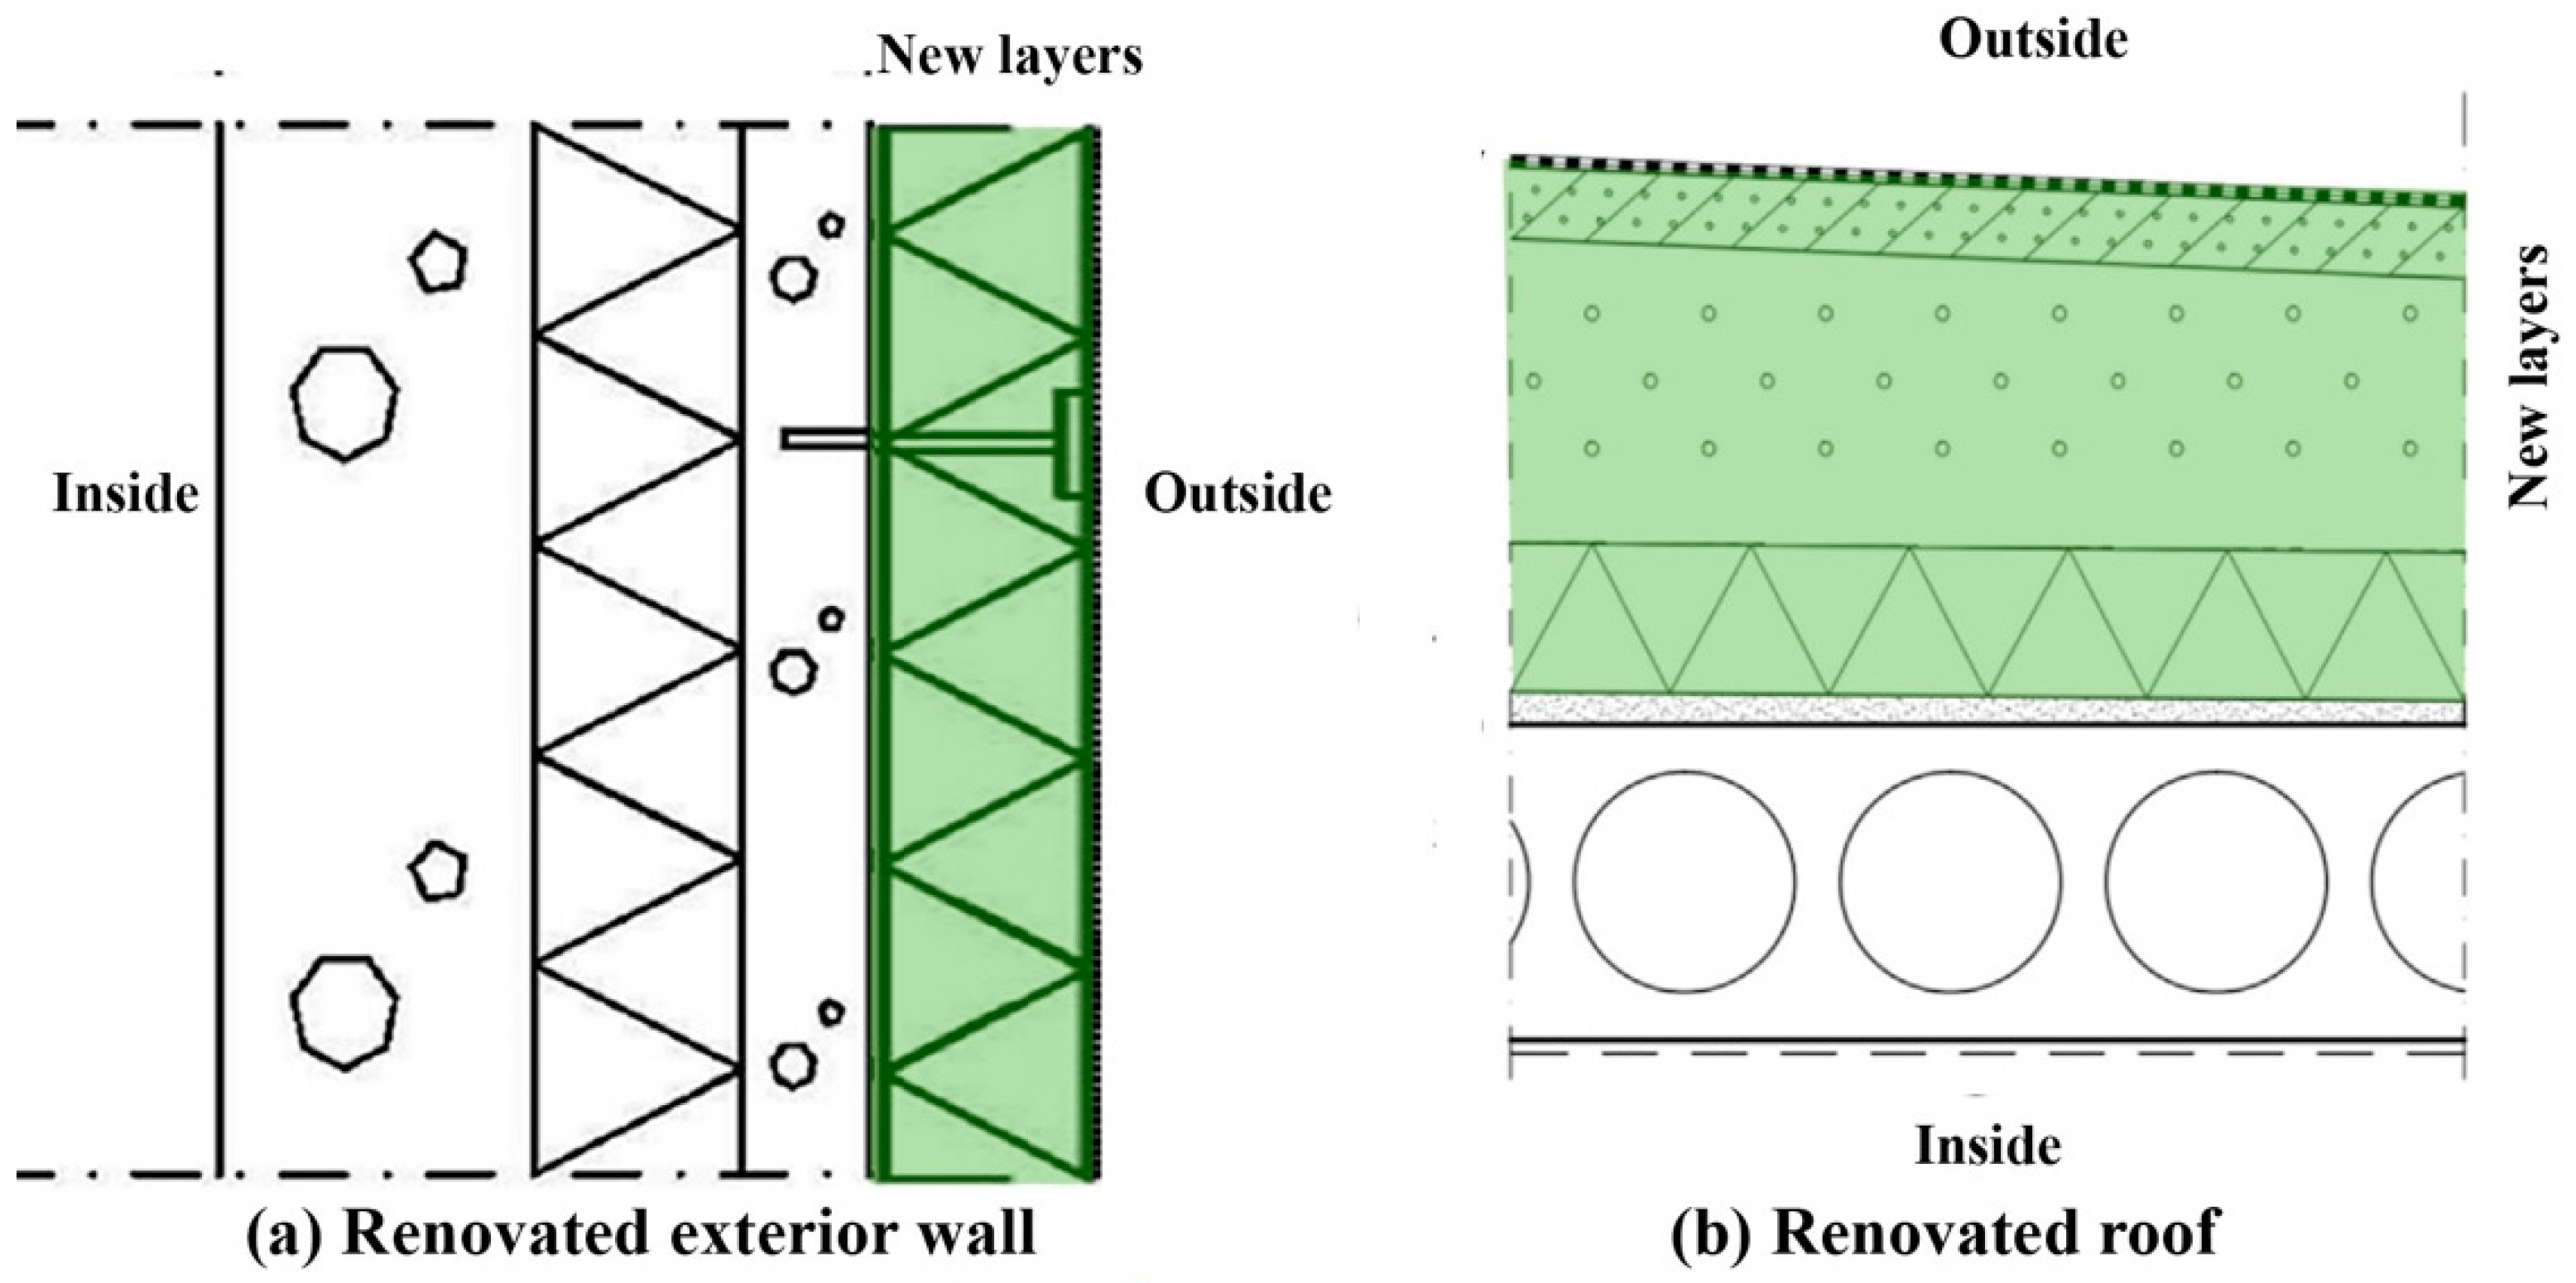
The primary existing structural systems and materials used in the studied buildings are listed in Table 2. As illustrated in Figure 2a, during the renovation, additional insulation was attached directly to the existing external wall structure; then, new plaster was painted over the insulation for protection. For calculation, the same renovated wall type was used for all the case buildings, but the thickness of the added insulation varied according to the information found on the project website and provided by the project team. Not all case buildings had renovated roofs. For those buildings that did, three additional layers were added: a new polyurethane insulation layer, a light gravel layer, and lightweight concrete (functions as insulation). In addition, a new double layer bitumen membrane was added for waterproofing (refer to Figure 2b and Table 2). The existing exterior windows and doors were mainly made of wooden frames, and all case buildings had them replaced with more energy-efficient exterior windows and doors.
2.1.4. Building Service Systems
The information on existing building service systems—including heating, ventilation, and plumbing systems—was provided by the project team and extracted from the project website [16]. The renovations applied to each case building were also obtained from the project report, which is publicly accessible information [16]. The breakdown description for each individual building can be found in Table 3 and is explained in the following section.
2.2. Renovation Strategies and Measures
2.3. Embodied Energy and Carbon Emissions Calculation
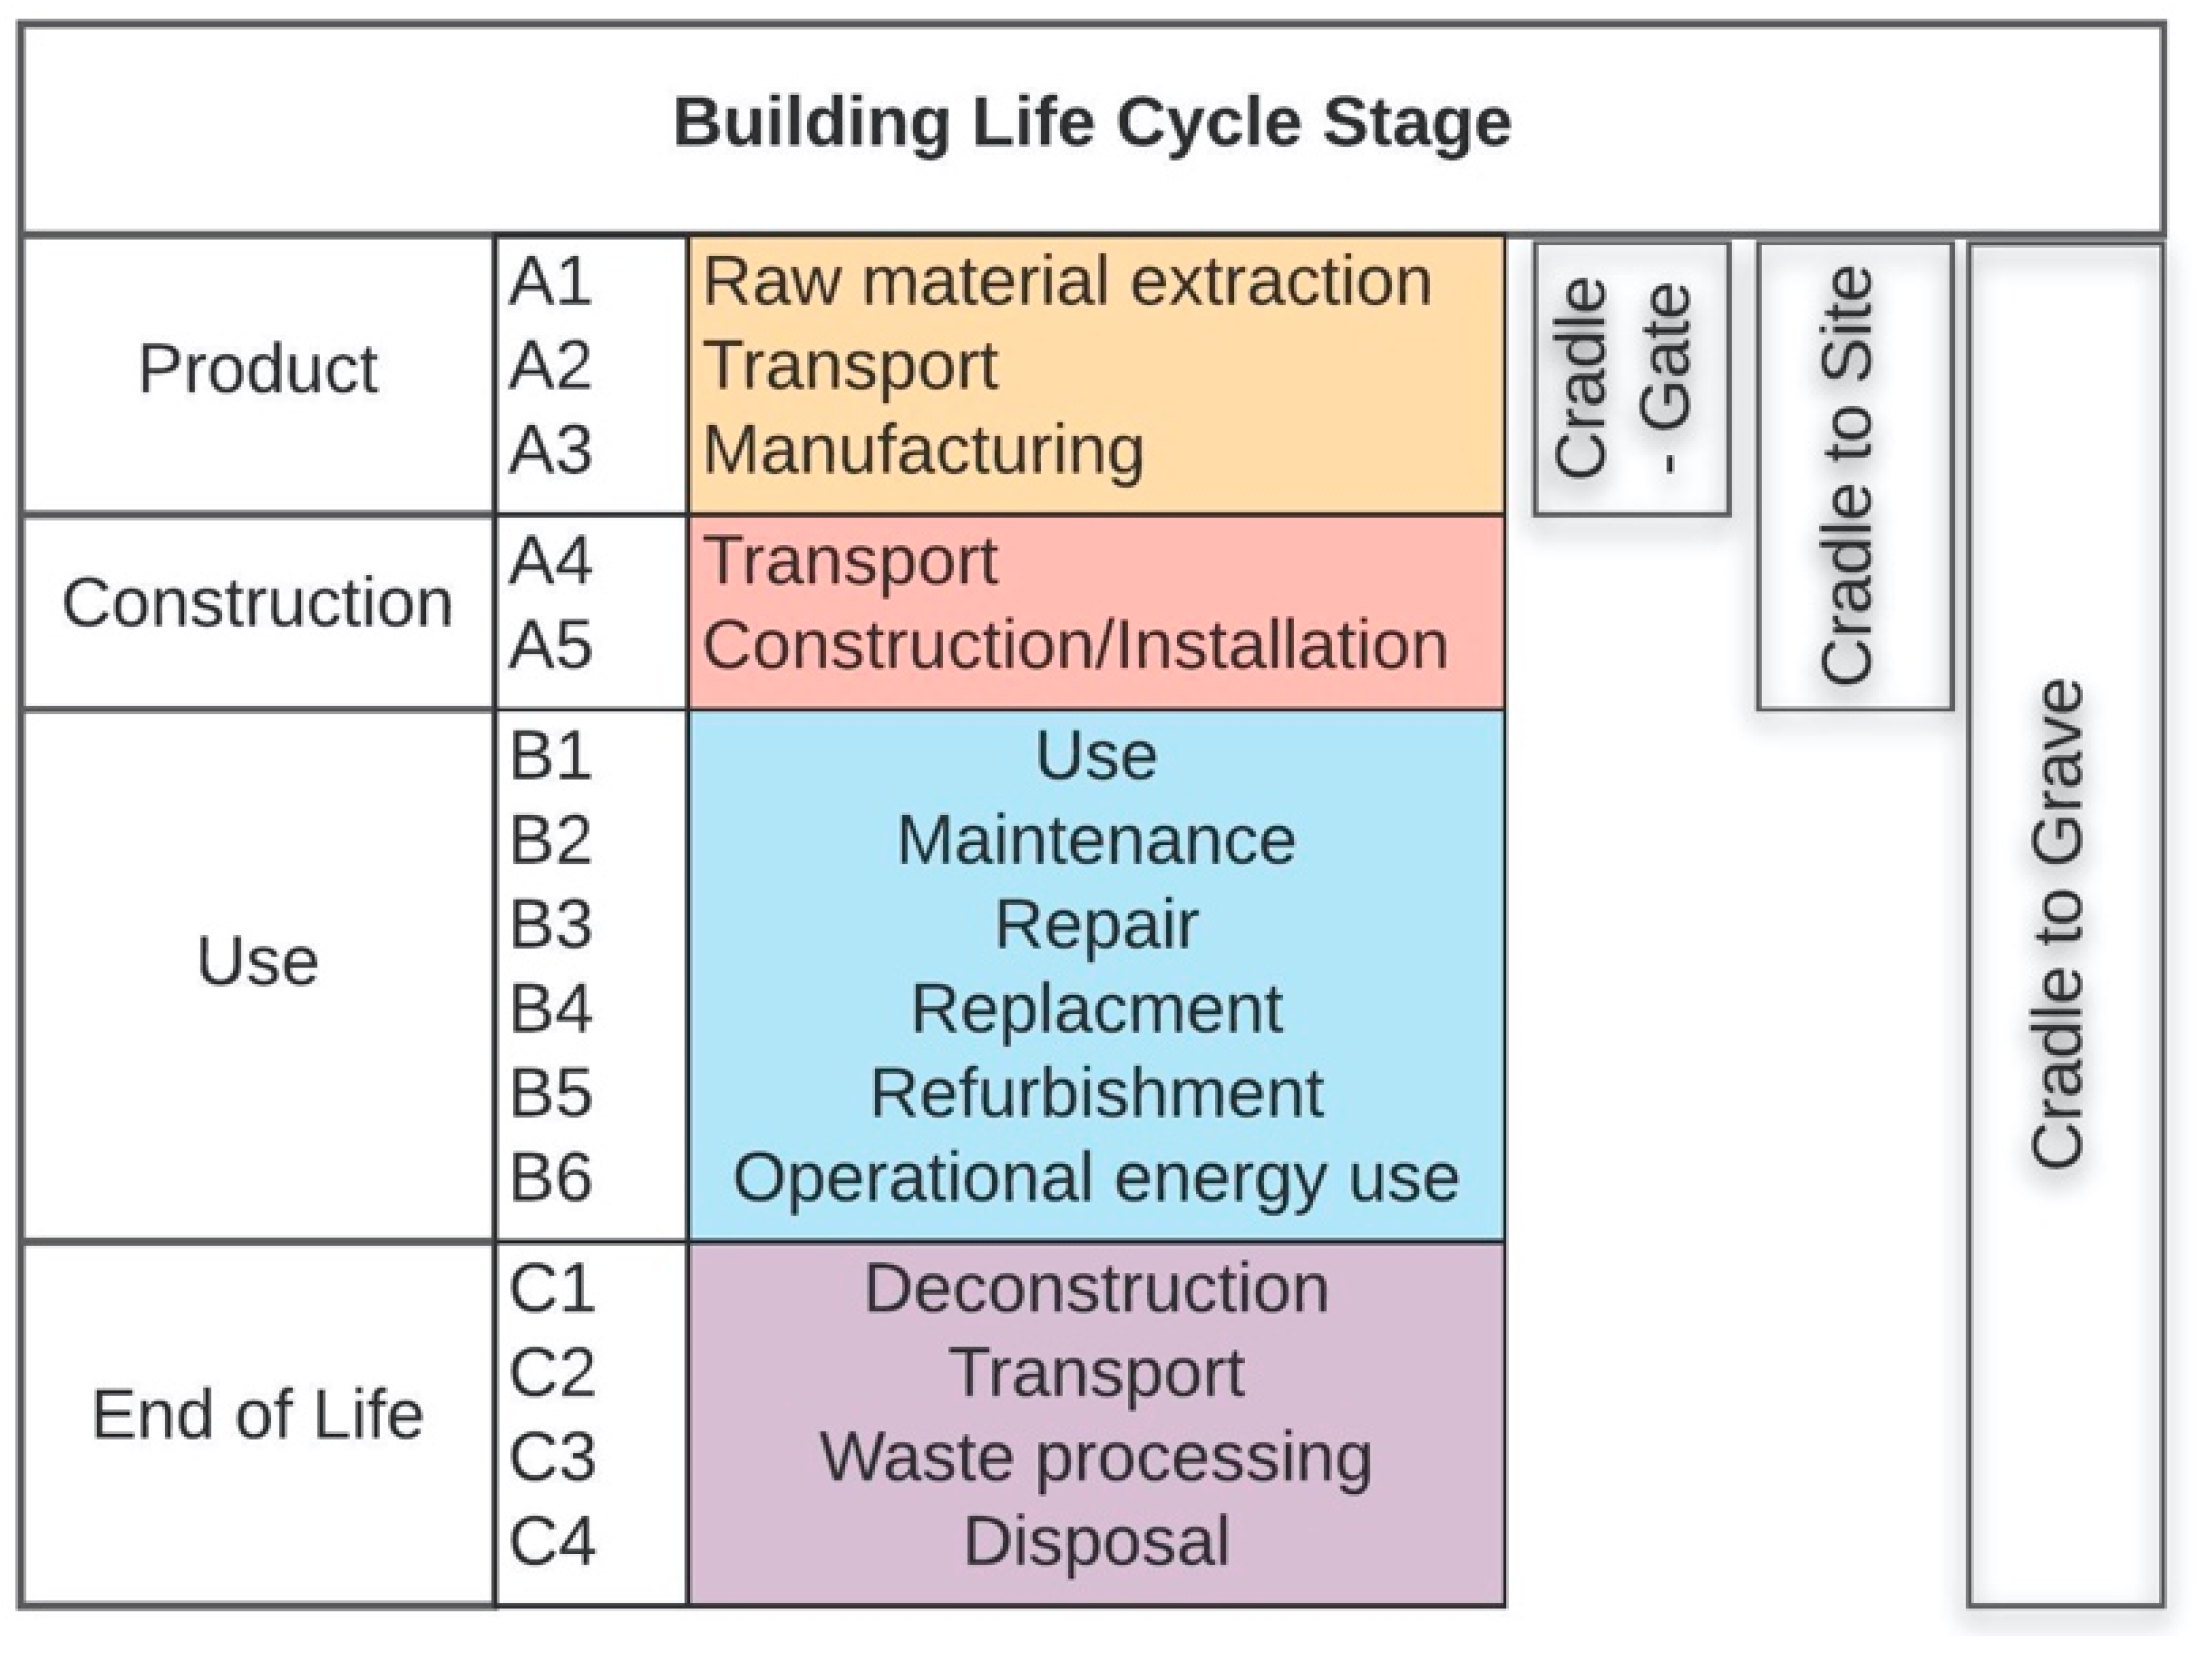
The software One Click LCA™, developed by the Finnish private company Bionova Ltd., was chosen for this study [21]. The software complies with EN 15987 and EN 15804 standards [17], and EN 15804 is a guideline for Environmental Product Declarations based on the ISO 14044 standard. One Click LCA includes the building material database, which is European original and Finland specific [22]. In this project, life cycle carbon emissions were calculated for individual case projects. To normalize the added embodied energy, only renovated components were included: the building envelope, heating/ventilation system, and lighting system. Structural systems and other building service systems were excluded, as they were not changed. Furniture and interior finishes were excluded as well. The life stages included in this study were A through C. As illustrated in Figure 3, stage A is the product and construction stage and includes A1 through A5. A1 through A3 is usually called “cradle to gate,” and A1 through A5, “cradle to site.” Stage B is the use stage, and stage C is the end-of-life stage. A1 through C3 are typically named “cradle to grave.” The data used to create the LCA model were extracted from original construction documents provided by the project team and the author’s visual inspection on site. Information extracted from the EU-GUGLE website, publications, presentations, and other available information can be found online. A life span of 50 years was used for the calculation, and the product service life was set as the default; for example, wood panels, the roof, and windows were set to be replaced once during the building’s lifetime (50 years), and doors were set to be changed twice during the building’s lifetime. In addition, in the One Click LCA database, transportation carbon was included during the production stage [23].
2.4. Proposed Sustainability Index
In this study, sustainability of the renovation project was measured by the balance (trade-off) between reduced carbon emissions (through operating energy savings) and added carbon emissions (through added building materials and systems). The framework proposed by Moran et al., 2017 was adopted and modified to calculate the sustainability of a retrofit solution, using Equation (1) through Equation (4) [23]:
where a, b, and c are weighting factors for each of the respective categories; k is ; OESn is the life cycle carbon reduction due to the operating energy savings of case project n, measured by the operational cost savings (CO2-eq/m2); EMBn is the life cycle carbon increase due to the embodied energy added, measured by the carbon emissions equivalent (CO2-eq/m2); and ECOn is the economic impact of case project n, measured by the operational cost savings (USD/m2). The calculation of OESn, EMBn, and ECOn can be expressed mathematically as Equation (2) through Equation (4):
where is the life cycle carbon reduction indicator m for case project n; m stands for the different operating energy, electricity, and district heating; is the life cycle carbon increase indicator m for case project n; m represents the building elements, such as the exterior wall and windows; is the economic indicator m for case project n; is the weighting applied for each indicator depending on the category’s importance; q is the number of the indicators evaluated in each carbon emissions reduction, carbon emissions increase, and economic category; and p is the total floor area measured. The sum of the weightings ( applied to indicators in each category must add up to 1.
As can be seen from Equation (1), each of the three categories for the sustainability score can be given a different weighting (a, b, c) depending on the importance of the category. The importance of the categories for different stakeholders involved in the energy retrofit projects can vary. For example, the energy supplier and building operators’ priority is most likely the operating energy savings. However, for environmental protection agencies that are involved in permit review, the added embodied carbon is equally critical since it can lead to unintended environmental impacts. For building owners, the operational cost may be the primary reason for choosing retrofit solutions. In Section 3 the impact of different weightings on the sustainability index are demonstrated.
3. Findings
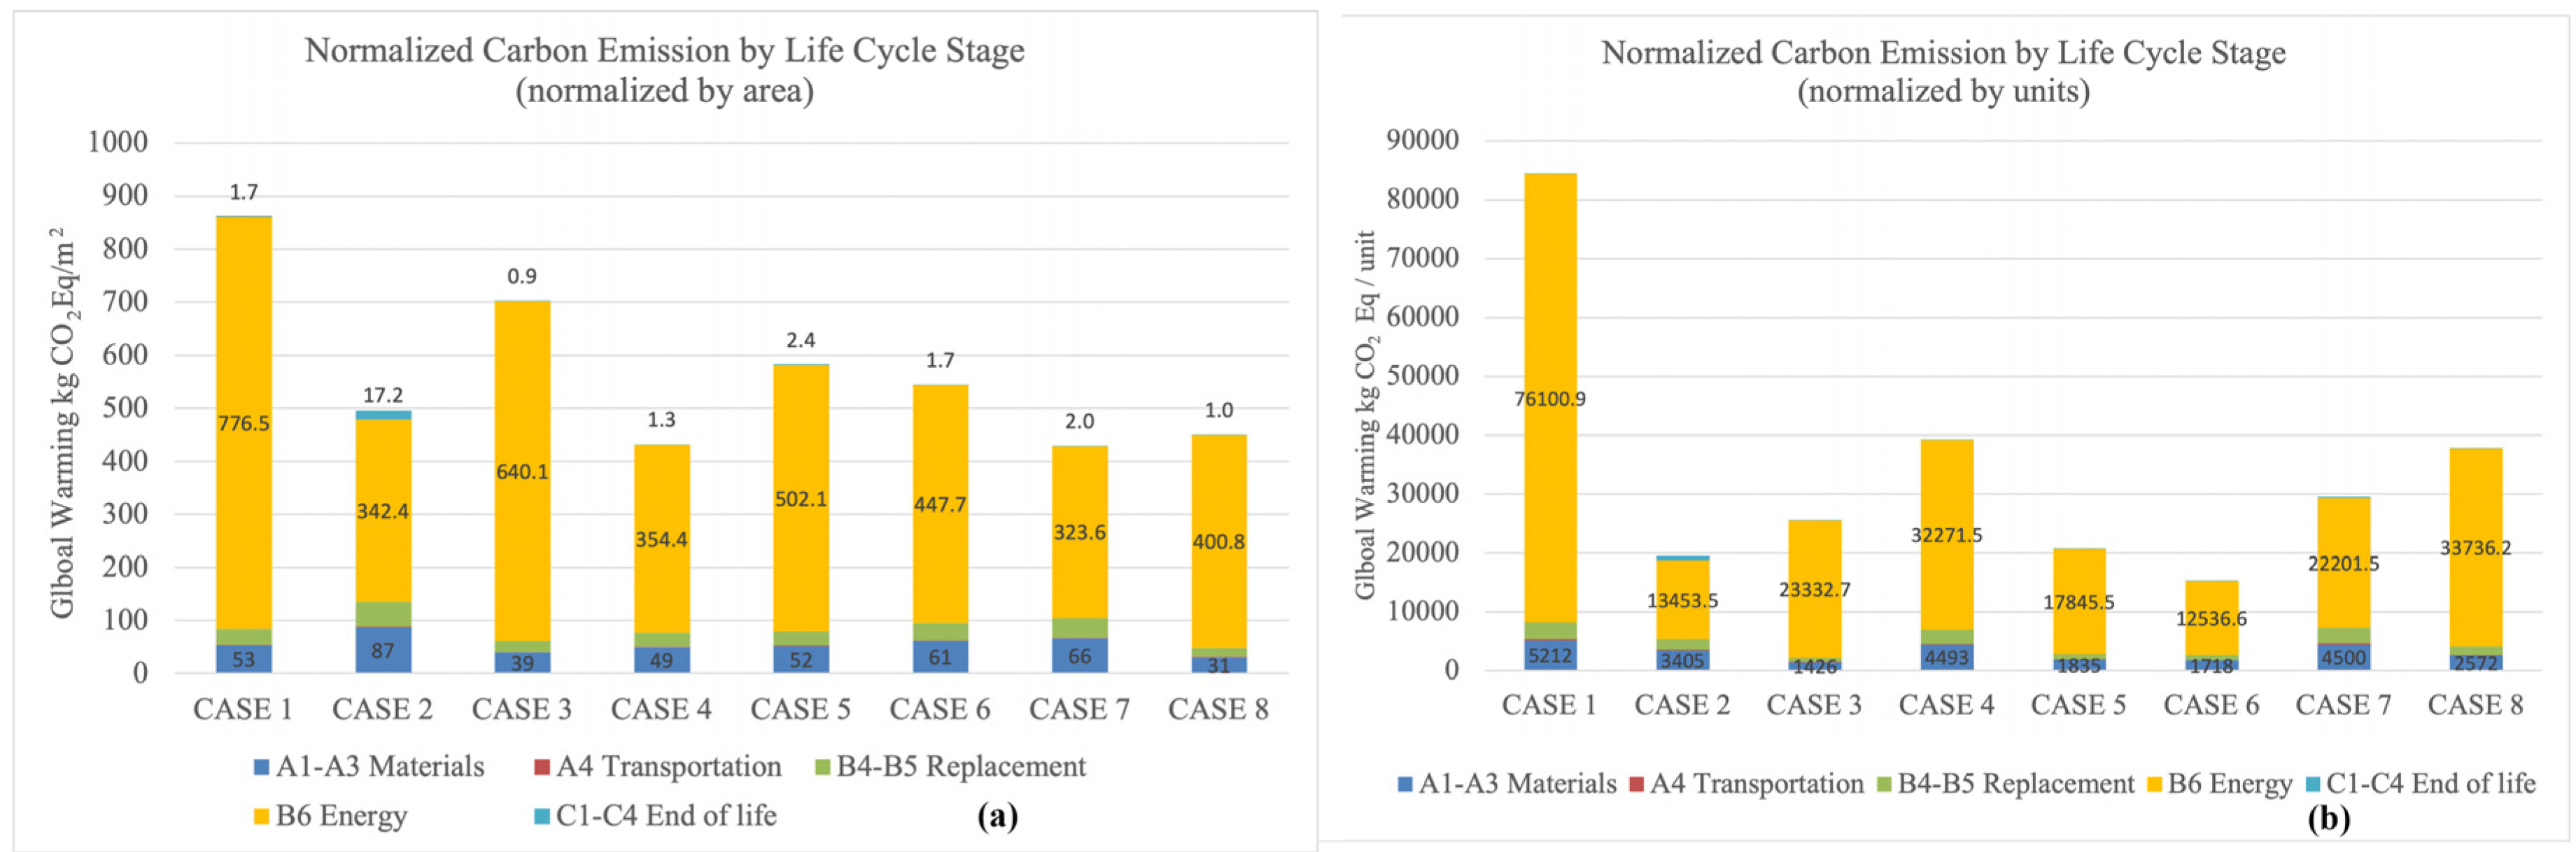
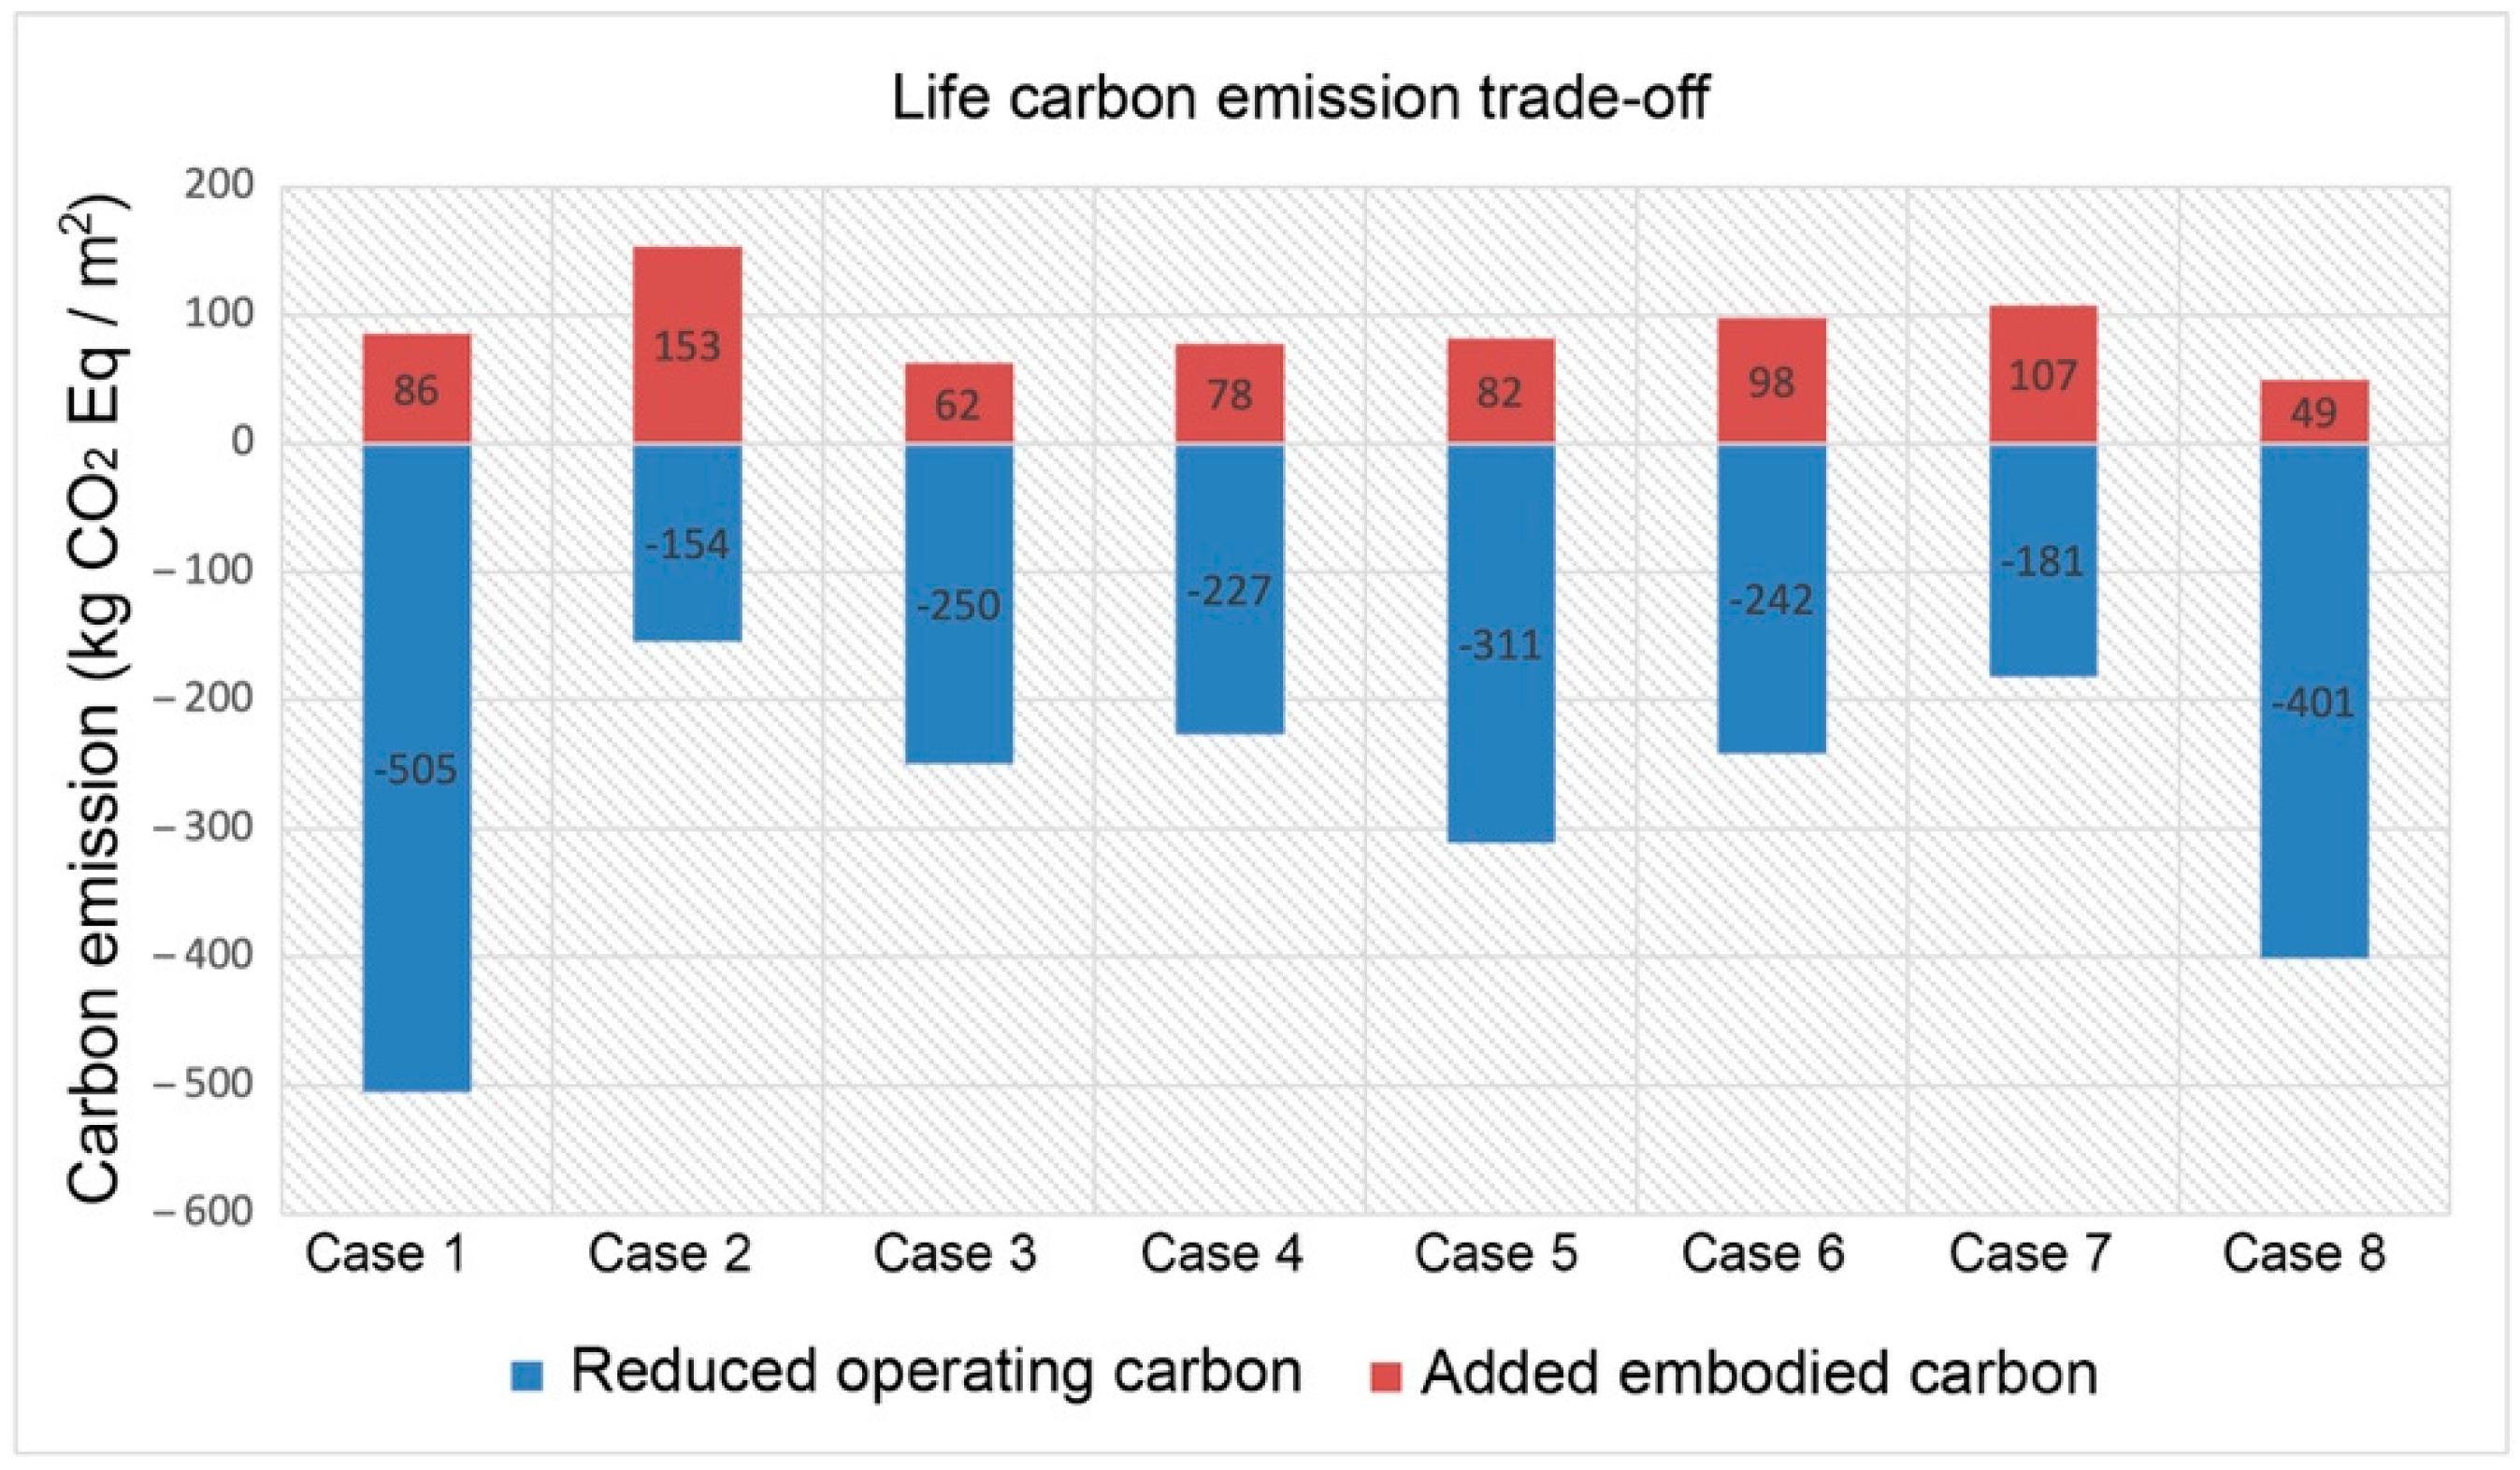
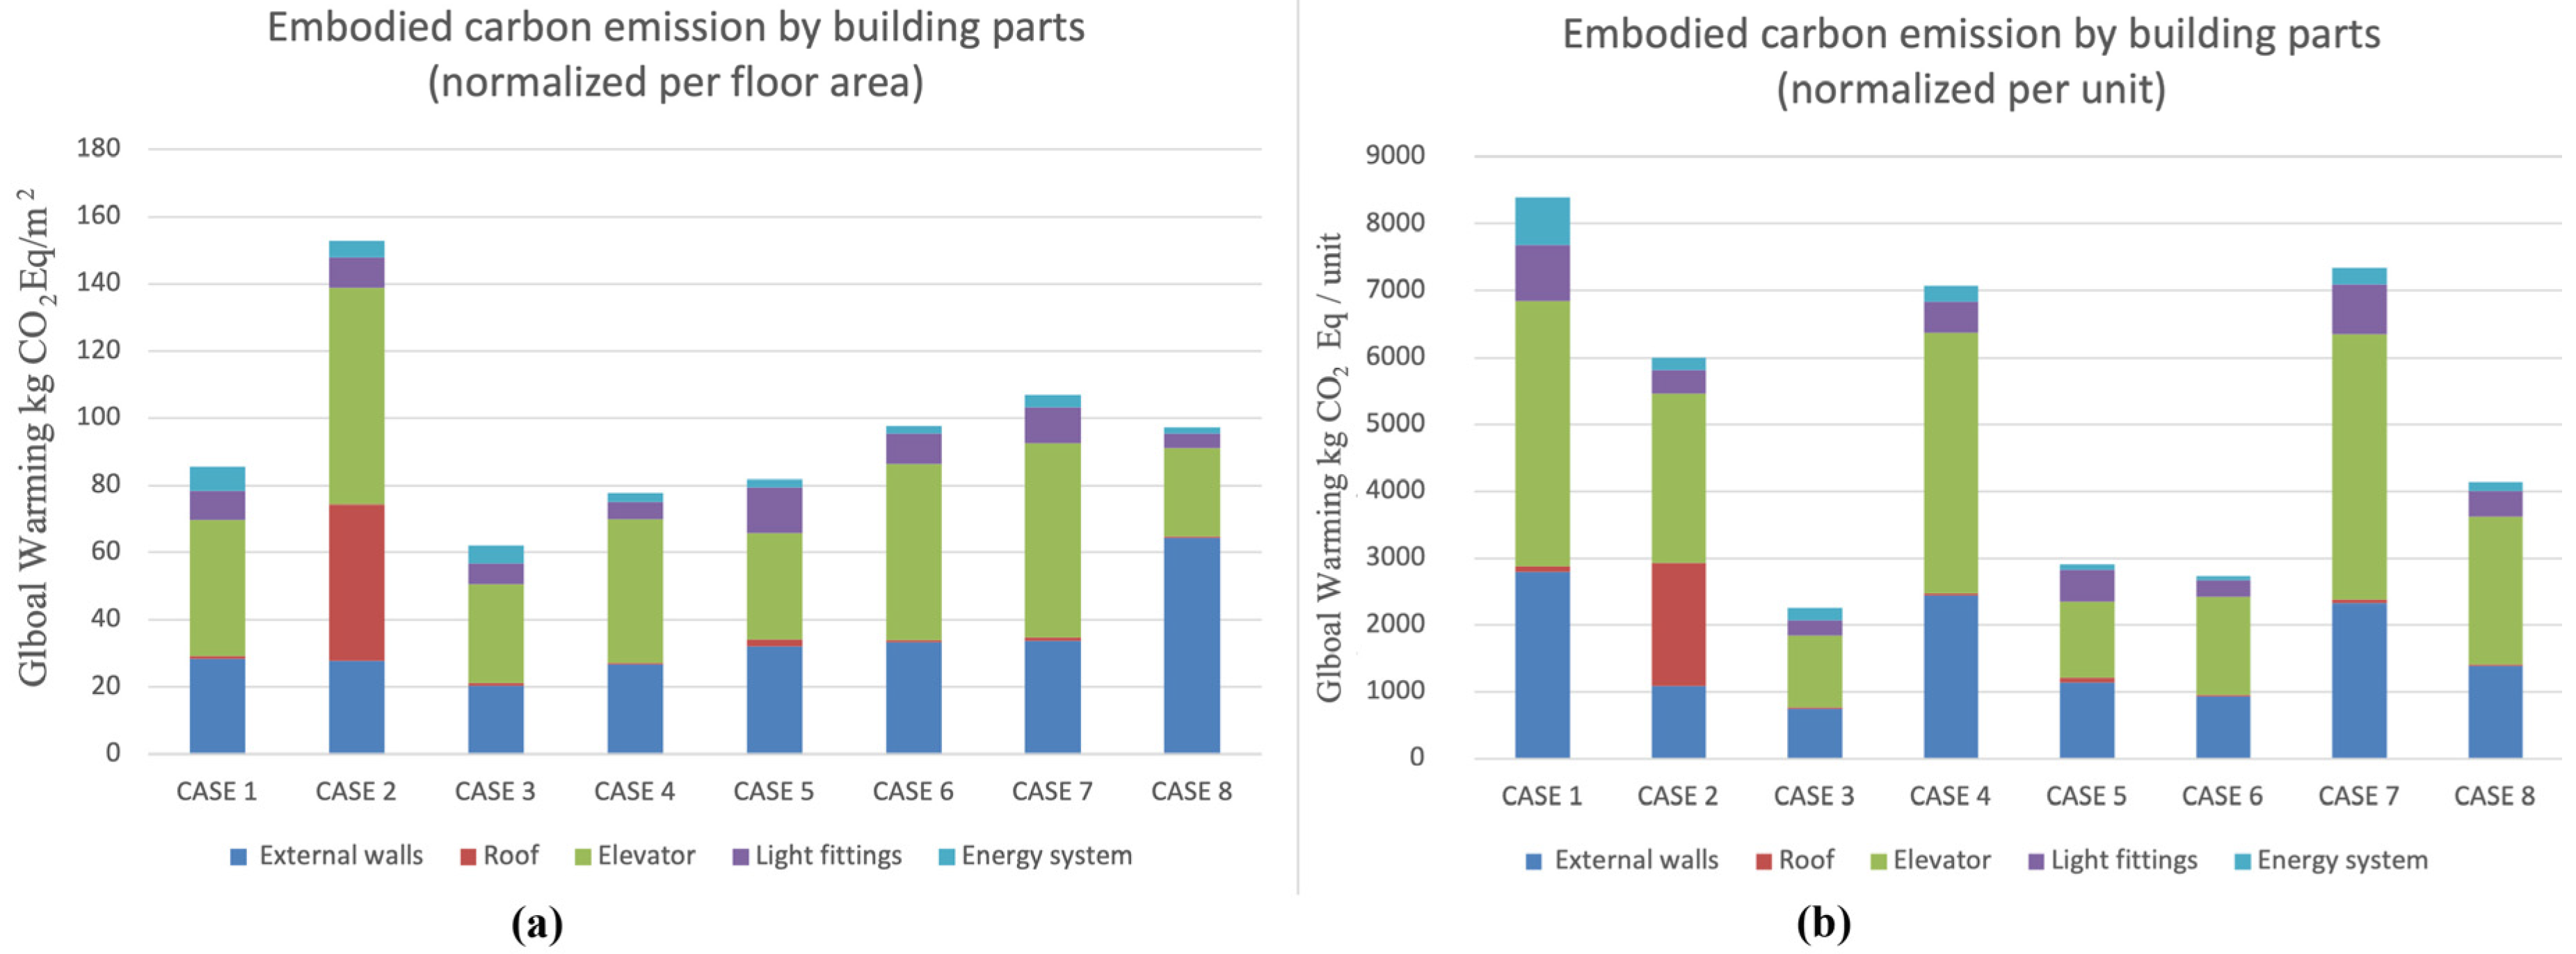
Table 5 shows the basic data for the studied case buildings. We will first discuss the results of the overall life cycle carbon emissions and contributors to added embodied carbon. Then, we will explain the results of applying the proposed sustainability index to the studied cases. Figure 4 illustrates the normalized whole life cycle carbon emissions of the studied case buildings (Figure 4a is the normalized carbon emission by floor area and Figure 4b is the normalized carbon emission by unit counts), and Figure 5 shows the trade-off between the reduced operating carbon and added embodied carbon.
3.1. Life Cycle Carbon Emissions
As showed in Figure 4, case 1 ranked first, with the highest life cycle emissions due to high energy use during the B6 stage, followed by case 5 and case 3 as the top life cycle carbon emitters, also due to the high energy demand in their use life stage. For all case buildings, the B6 stage was the dominant life cycle stage for carbon emissions, contributing around 57–83% of the total life cycle carbon emissions. These findings validate the importance of further reducing the use stage energy demand through a deep energy retrofit. Figure 4 also shows that the second highest life cycle stage contributing to life cycle carbon emissions was A1–A3, the product stage, or “cradle to gate” [24]. The fractional contributions from the remaining life cycle stages were negligible. When we normalized the life cycle emissions by the number of units included in the studied buildings (refer to Figure 4b), the results were different: Case 1 ranked first with the highest life cycle carbon emissions per unit, more than 50% higher than the emissions from case 4 (ranked second) and 60% higher than case 8 (ranked third). Since we can use the number of units as a proxy for the number of occupants in the building, we can interpret the normalized results by unit numbers as an indicator of inequality regarding the carbon emissions burden that each occupant imposes on the larger environment. For example, case building 4 has fewer occupants (refer to Table 4); however, each occupant is responsible for higher life cycle carbon emissions compared to other case buildings’ occupants (except case 1). In the future, we suggest using the number of units to normalize the life cycle carbon emissions, which can better reveal the inequality among different buildings and building occupants. Despite the difference, normalized life cycle carbon emissions by unit also demonstrate that the B6 use phase is the dominant life cycle stage and needs further reductions.
As illustrated in Figure 5, for embodied carbon, case 1 had the highest increase per floor area, followed by case 2 and case 6. For the offset embodied carbon through an operating energy reduction, case 2 had the highest life cycle carbon reduction, followed by case 1 and case 7. Regarding the balance between a carbon increase and offset, all case buildings had negative life cycle carbon, which is an indicator that an energy retrofit is effective in reducing the life cycle carbon emissions of existing buildings. However, if we only look at the offset carbon emissions through an operating energy use reduction, case 1 ranks first, followed by cases 2 and 6. Despite the highest life cycle carbon emissions (refer to Figure 4), as showed in Figure 5, case 1 had the highest life cycle carbon reduction compared to the base condition before the energy retrofit. These different ranking results illustrate how evaluating sustainability using different portions of the life cycle of carbon can have different results; hence, the decisions based on the analysis results may vary.
3.2. Embodied Carbon: Building Materials and Systems
A1–A3 had the second highest life cycle stage contributing to life cycle emissions; this contribution was mostly related to the selection and production of building materials, components, and systems (refer to Figure 4). Then, we looked at the life cycle carbon derived from building materials and systems during the production and construction life stages. Figure 6a shows normalized carbon emissions (per floor area) during A1–A5 stages, which we defined as embodied carbon. The external wall was the dominant category contributing to embodied carbon, and the elevator core ranked second. The only outlier was case 2, where the elevator and roofing systems were the main contributors to the added embodied carbon. Figure 6b shows that the results of normalized carbon by unit counts were different: Case 1 ranked first with the highest per unit carbon emissions from building systems and materials used for the energy retrofit, followed by case 7 and case 4. Again, these different results demonstrate the need to potentially use occupants or unit counts as a normalization unit.
3.3. Sustainability Index Calculation and Visualization
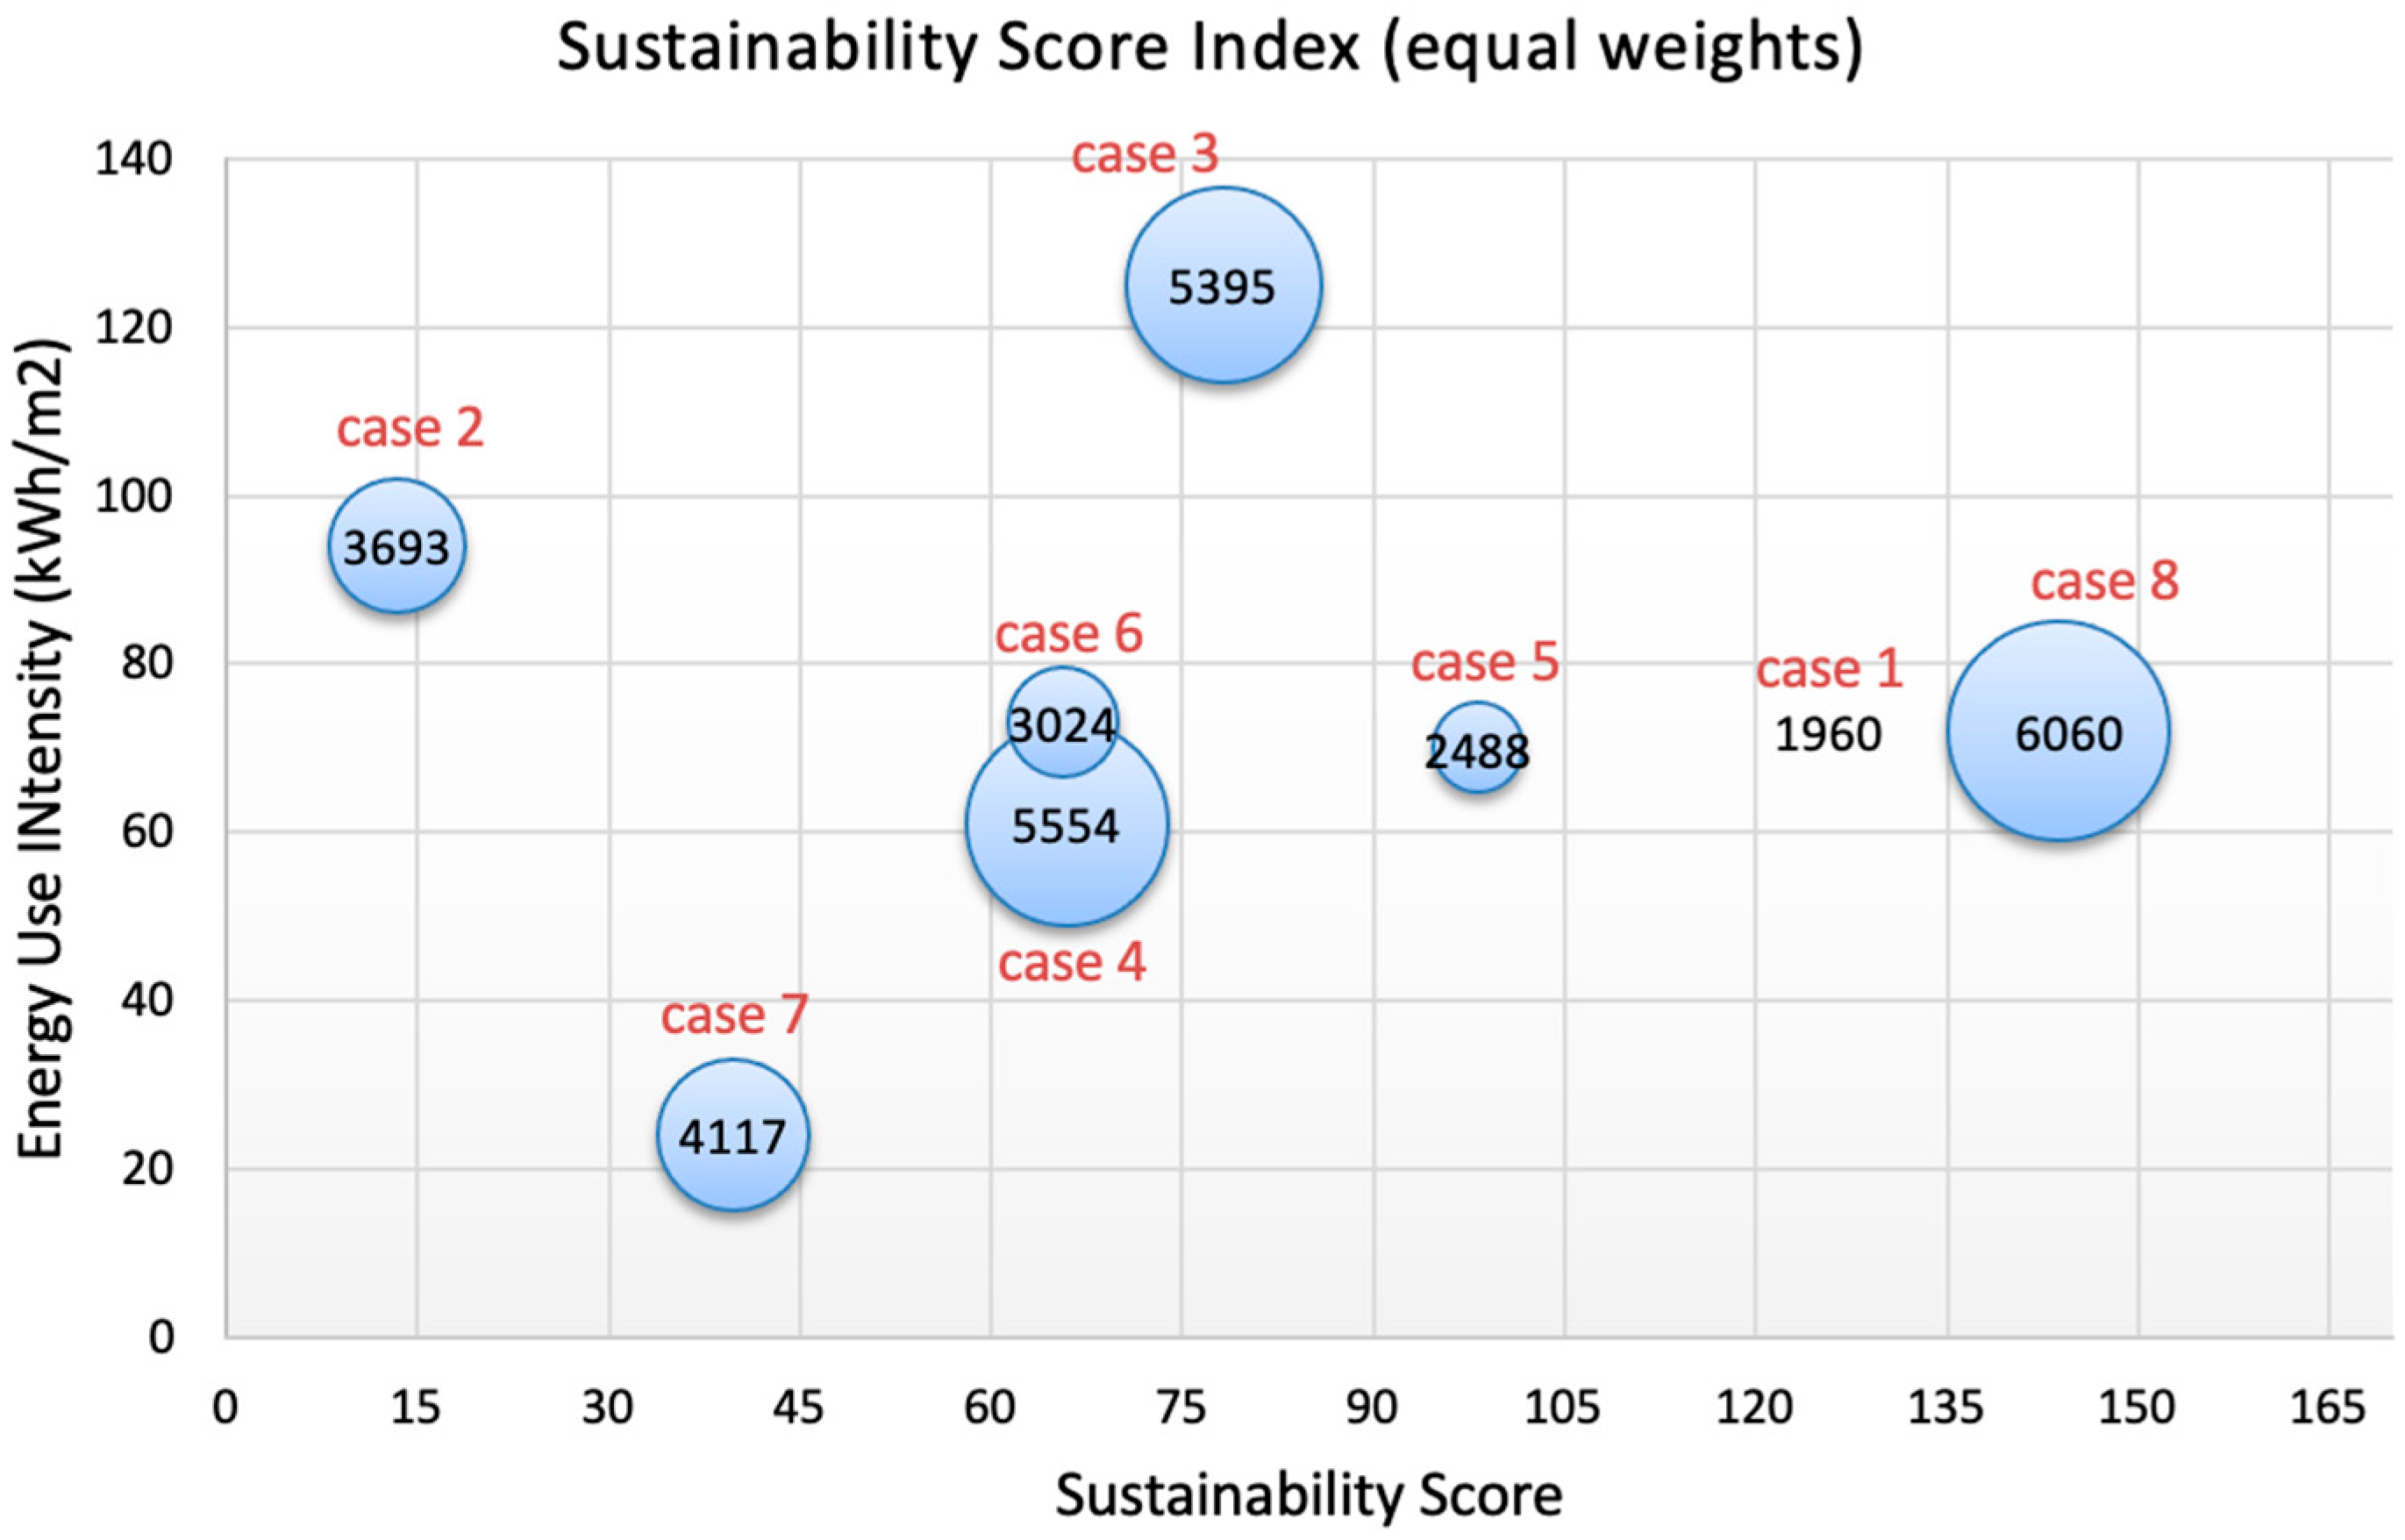
The sustainability score was first calculated using equally weighted OES, EMB, and ECO. As illustrated in Figure 7, the X-axis represents the sustainability score (unitless), and the Y-axis is the energy use intensity after renovation, measured in kWh/m2. The size of the bubble represents the total floor area of the case building, measured in m2. For example, case 8 had a gross floor area of 6060 m2, represented by the biggest circle. In general, the higher the sustainability score, the less the overall life cycle carbon emissions emitted from the renovated building, and the more sustainable the building.
Figure 7 demonstrates two important findings. First, size is not correlated with the sustainability score, as the largest building (case 8) and the smallest building (case 1) had similar sustainability scores that were extremely different from the other cases. Second, energy use intensity (EUI) might not be a good measure of sustainability. In current practice, EUI is often used to measure the energy efficiency of a building and consequently the sustainability of the building. If EUI is a good indicator of sustainability, then the EUI (Y-axis) and sustainability score (X-axis) would be negatively correlated. However, they do not appear to have a clear correlation. For instance, case 7 had the lowest EUI but also the lowest sustainability score. This can be explained by the trade-off between reduced carbon emissions and increased embodied carbon. As shown in Table 5, case 2 had the highest embodied emissions increase with the second lowest operating carbon reduction. Therefore, low EUI does not necessarily mean more sustainability. In addition, case 3 had the highest EUI after renovation, which may indicate that case 3 still has much space to improve the current energy performance. However, case 3 also had the third highest sustainability score due to its poor previous energy performance followed by a large operating energy reduction achieved through the renovation (refer to Table 5). Therefore, the added embodied carbon (from the renovation) was well adjusted by the large offset of an operating carbon reduction.
As shown in Table 6, the proposed sustainability score can provide us with a more comprehensive understanding of how sustainable the renovation works are from a life cycle carbon emissions perspective, providing a more robust estimation of global warming potential related to building renovation. Only focusing on the operating energy may provide an incomplete, sometimes even opposite, interpretation to measure the effectiveness of a building energy retrofit, which is clearly demonstrated in case 7. Case 7 had the lowest energy use intensity after renovation. Based on the current commonly used measurements and criteria, it is considered very energy efficient and even has the potential to achieve net zero energy if there are renewal energy sources onsite, such as solar or wind energy. However, case 7 ranked the second lowest for the proposed sustainability score, mainly due to the trade-off between added embodied energy and reduced operating energy. From a long-term perspective, case 7 can produce more life cycle carbon than the other cases, and a large portion of such emissions are embedded in the building materials, components, and systems used in the renovation.
4. Discussion and Sensitivity Analysis
4.1. Sensitivity Analysis
As demonstrated from this study, EUI is not always the best measure of sustainability because of its emphasis on operating energy. The overall goal of sustainable development is to reduce carbon emissions, mitigating the impact on climate change. Reducing the operating energy demand is only one important part—integrating the counting of added embodied carbon emissions due to an energy retrofit can generate a more holistic view of sustainability. Further, the evaluation of sustainability is not only impacted by the trade-off between operating carbon emissions and embodied carbon emissions but is also influenced by the stakeholders’ priorities.
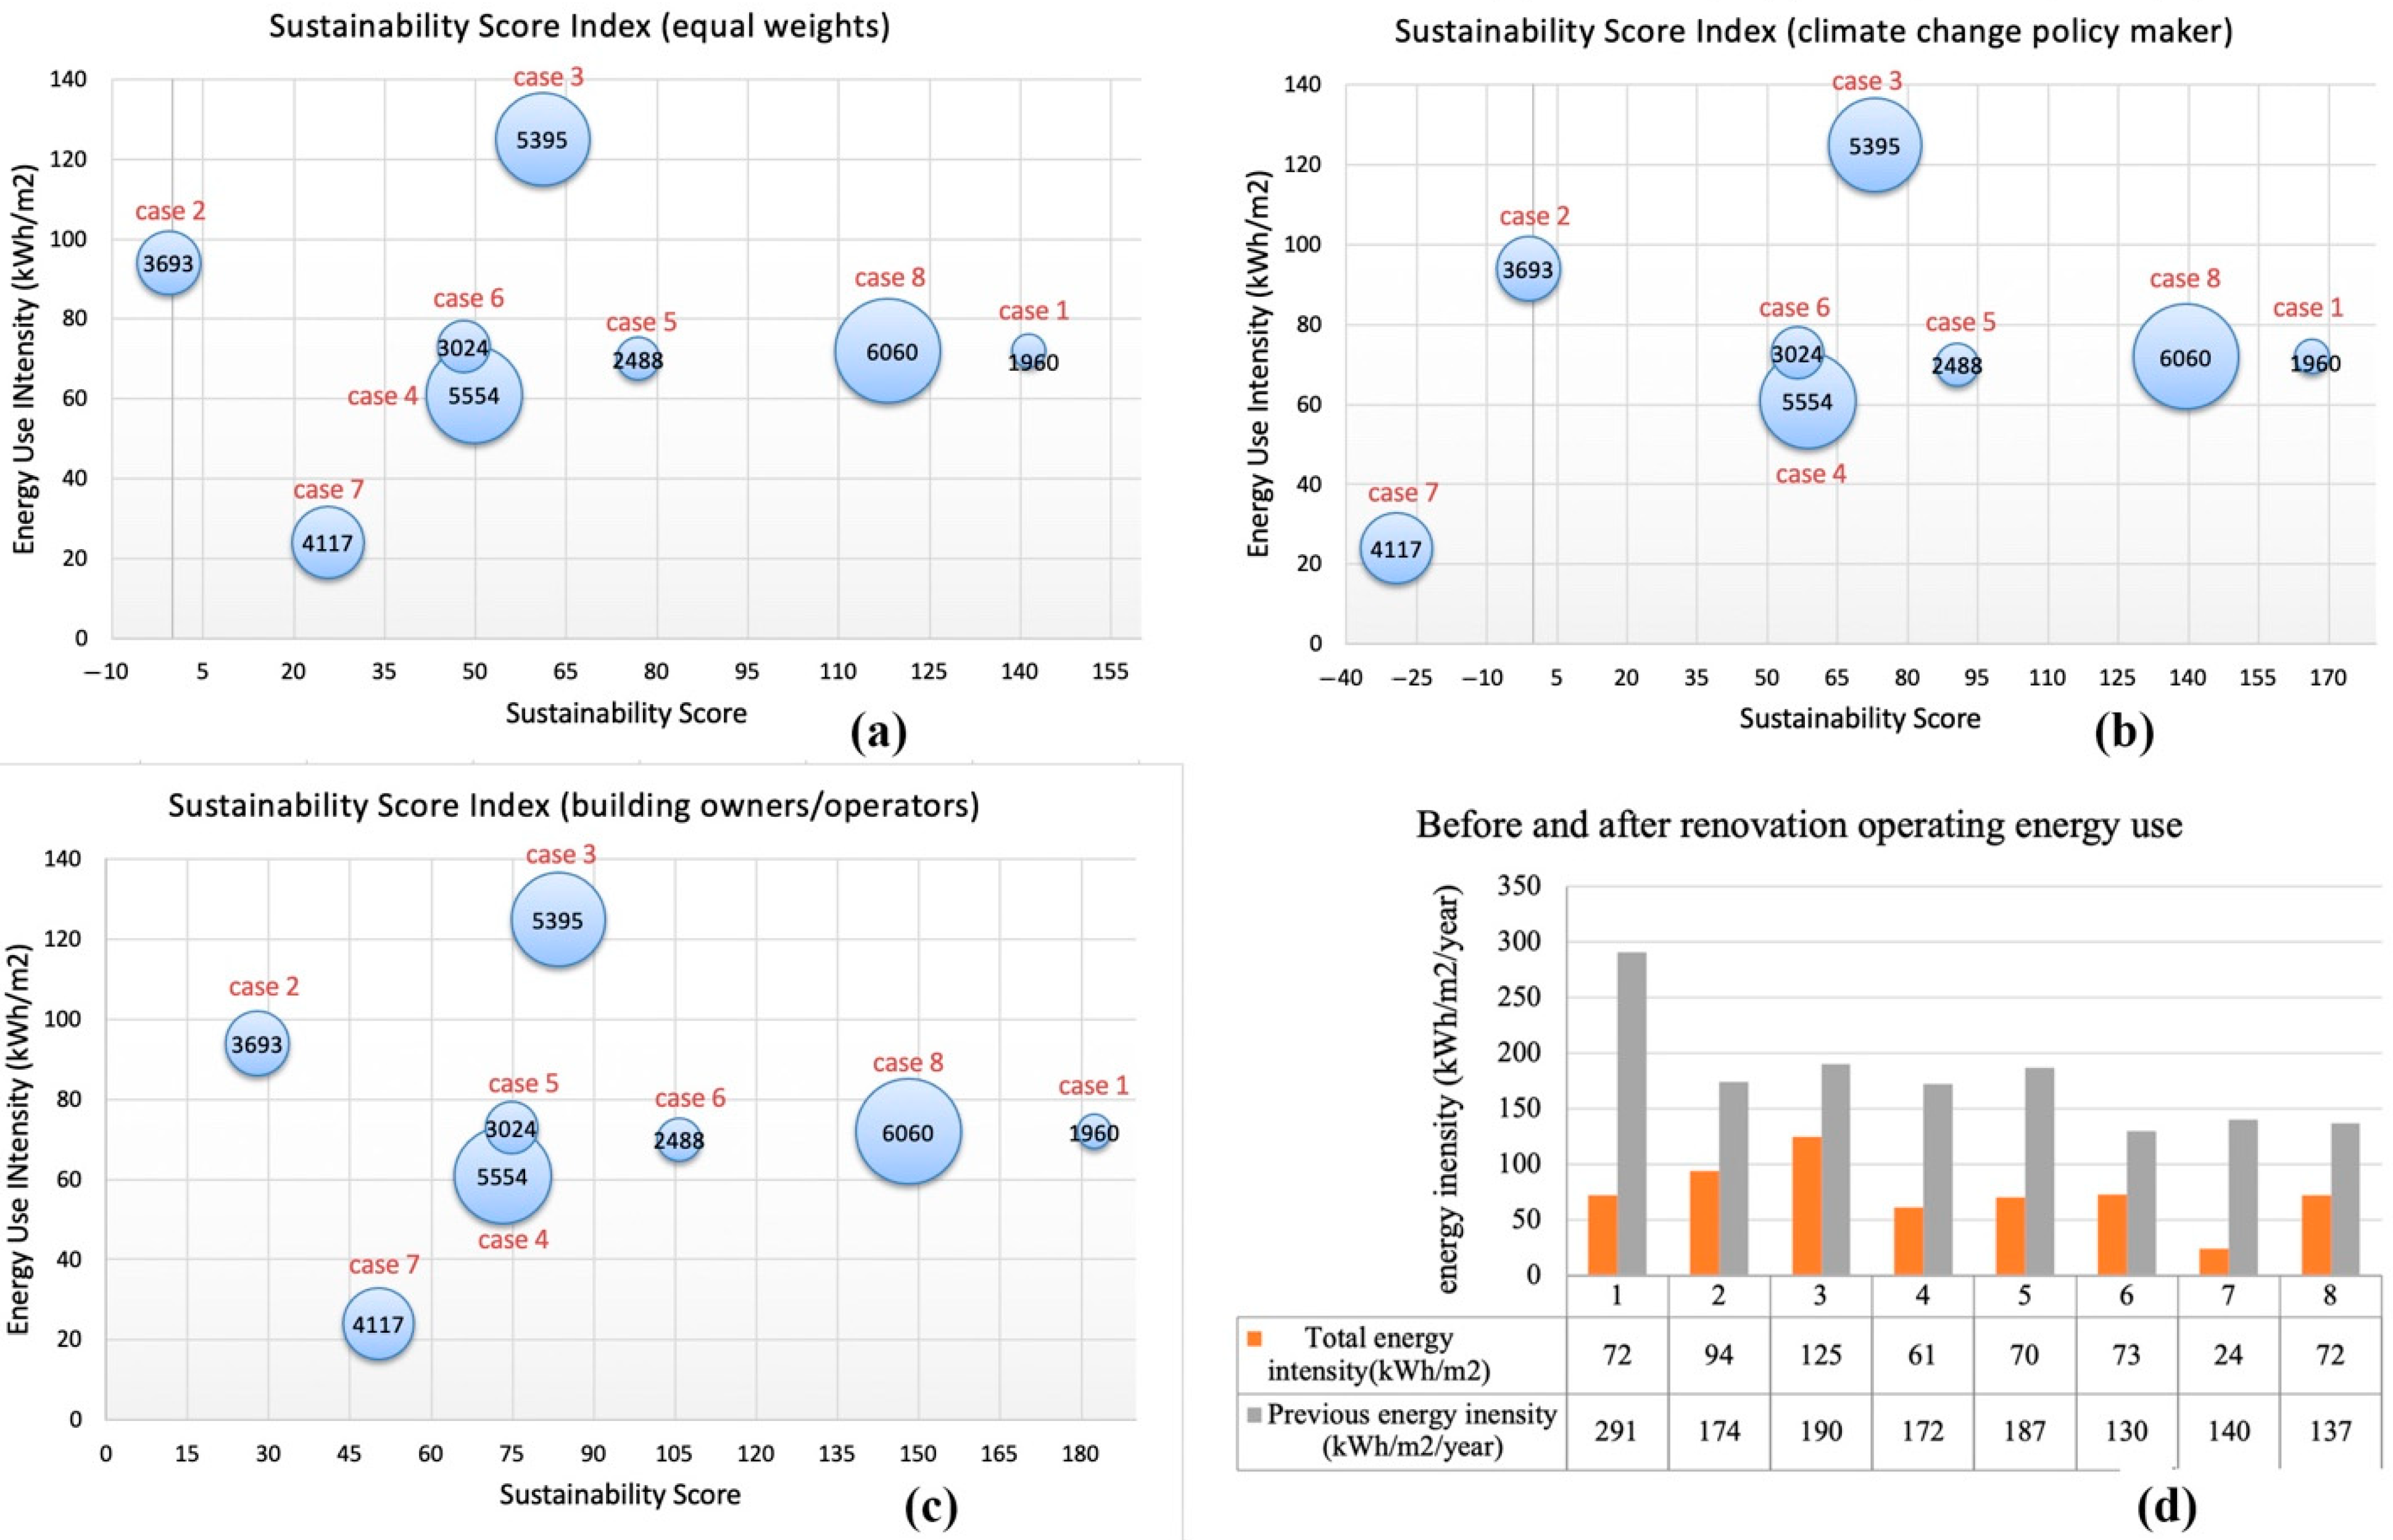
To test the validity of the sustainability score calculation, we used three sets of different weights to represent different stakeholders’ values. For building owners or operators, operating energy savings is prioritized and related to operation cost savings; therefore, we gave the higher weights to OES and ECO to represent the building operators’ view. The results are illustrated in Figure 8a. The second set of weights was for climate change policymakers. We assumed they will prioritize a life cycle carbon emissions reduction; thus, the balance between OES and EMB should be weighted equally but higher than ECO. The results are illustrated in Figure 8b. The third set of weights represented current common practices of sustainable building renovations, which are primarily related to an operating energy reduction (measured by EUI), so we gave much higher weights to OES and lower and equal weights to EMB and ECO. The results are illustrated in Figure 8c.
The results demonstrated that the sustainability index can vary depending on the priorities the decision makers give to operating carbon, embodied carbon, and operating cost. Furthermore, how sustainability is measured can have a determining impact on whether a life cycle carbon emissions reduction can be achieved. A policy maker focused on climate change and overall carbon neutrality will have a much different evaluation of sustainability compared to building owners, operators, and designers (as demonstrated in Figure 8a–c), as Figure 8a,c are more similar to each other than they are to Figure 8b. This can be problematic if the existing sustainability measurement continues to be used in the building and construction industry, as it focuses on operating energy use. There are some countries integrating embodied energy and carbon calculations and considerations in building codes, such as Norway Standard 3720 [25], but an overwhelming majority of countries have not made the embodied carbon calculation a mandatory requirement for new construction and renovation.
4.2. Significance of the Study
The significant features of this study, compared to previous studies on the sustainability of renovation projects, are as follows:
- Uses actual energy performance data (before and after renovation) of eight finished deep energy retrofit projects;
- Uses country-specific life cycle material inventory, and the life cycle impact model was built based on actual building construction documents, historical records, and on-site measurements and investigations;
- Offers a comprehensive view of the trade-off between an operational carbon reduction and an embodied carbon increase;
- Proposes a holistic sustainability index—including the measure of operating carbon, embodied carbon, and operating cost—tested on eight built projects.
4.3. Limitations of the Study
There are three limitations of this study: First, since the LCA database we used is location-specific, we were unable to verify the results using other LCA tools because each tool uses a different database for evaluating the life cycle environmental impact and carbon emissions. Second, we were unable to get further information on why certain renovation techniques were applied to certain buildings but not others; therefore, the motivation for the renovation strategies was not clear to us. Third, structural and other building systems were excluded from this study; the inclusion of the whole building system might reveal additional insights on the source of embodied carbon emissions derived from all building materials and systems.
5. Conclusions
This study investigated the trade-off between a reduced operational carbon reduction and added embodied carbon emissions of eight deep energy retrofit projects. The analysis of the case buildings demonstrated that the current practice, which focuses solely on an operational energy use reduction, may not result in the most sustainable solution if the embodied energy and related carbon emissions are not carefully counted. Moreover, using the proposed sustainability index, integrating both operational carbon and embodied carbon, we found that the large operating energy reduction can be offset by the added embodied energy, and the renovated building with the lowest EUI can be less sustainable than buildings with higher EUIs. In addition, this study revealed that the sustainability score varies based on stakeholders’ perspectives. If embodied carbon emissions are not included in the consideration of energy retrofit planning, it is impossible for building owners to reduce the additional emissions once the renovation is finished. Consequently, addressing embodied carbon emissions should go hand in hand with deep operating energy retrofit initiatives to achieve a comprehensive sustainable result. In the future, we recommend that embodied carbon be included in building codes and regulations and that it be used together with EUI to measure the effectiveness of a building energy retrofit.
Funding
This research was funded by Finland Fulbright Foundation and the APC was funded by Faculty of Architecture, Civil Engineering and Applied Arts, University of Technology.
Institutional Review Board Statement
No Institutional Review Board required for this study.
Informed Consent Statement
Not applicable.
Data Availability Statement
Data available on request due to restrictions eg privacy or ethical. The data presented in this study are available on request from the corresponding author. The data are not publicly available due to privacy of the project owners.
Acknowledgments
I thank School of Architecture, Planning and Preservation at University of Maryland, Faculty of Built Environment, Tampere University and VTT Technical Research Centre of Finland for their support.
Conflicts of Interest
The authors declare no conflict of interest.
References
- Zuhaib, S.; Hajdukiewicz, M.; Keane, M.; Goggins, J. Facade modernisation for retrofitting existing buildings to achieve nearly zero energy buildings. 2016. [Google Scholar]
- Felius, L.C.; Dessen, F.; Hrynyszyn, B.D. Retrofitting towards energy-efficient homes in European cold climates: A review. Energy Effic. 2020, 13, 101–125. [Google Scholar] [CrossRef]
- Antonopoulos, C.A.; Metzger, C.E.; Zhang, J.; Ganguli, S.; Baechler, M.C.; Nagda, H.; Desjarlais, A. Wall Upgrades for Residential Deep Energy Retrofits: A Literature Review (No. PNNL-28690); Pacific Northwest National Lab. (PNNL): Richland, WA, USA, 2019. [Google Scholar]
- Wilson, E.J.; Harris, C.B.; Robertson, J.J.; Agan, J. Evaluating energy efficiency potential in low-income households: A flexible and granular approach. Energy Policy 2019, 129, 710–737. [Google Scholar] [CrossRef]
- European Climate Foundation. Zero Carbon Buildings 2050. Available online: https://cedelft.eu/publications/zero-carbon-buildings-2050/ (accessed on 24 May 2021).
- Rockefeller Foundation. United States Building Energy Efficiency Retrofits. Available online: https://www.rockefellerfoundation.org/report/united-states-building-energy-efficiency-retrofits/ (accessed on 2 February 2021).
- Dodoo, A.; Gustavsson, L.; Sathre, R. Effect of thermal mass on life cycle primary energy balances of a concrete-and a wood-frame building. Appl. Energy 2012, 92, 462–472. [Google Scholar] [CrossRef]
- Cellura, M.; Guarino, F.; Longo, S.; Mistretta, M. Energy life-cycle approach in Net zero energy buildings balance: Operation and embodied energy of an Italian case study. Energy Build. 2014, 72, 371–381. [Google Scholar] [CrossRef]
- Hu, M. Balance between energy conservation and environmental impact: Life-cycle energy analysis and life-cycle environmental impact analysis. Energy Build. 2017, 140, 131–139. [Google Scholar] [CrossRef]
- Crawford, R.H.; Czerniakowski, I.; Fuller, R.J. A comprehensive framework for assessing the life-cycle energy of building construction assemblies. Archit. Sci. Rev. 2010, 53, 288–296. [Google Scholar] [CrossRef] [Green Version]
- Rosselló-Batle, B.; Ribas, C.; Moià-Pol, A.; Martínez-Moll, V. An assessment of the relationship between embodied and thermal energy demands in dwellings in a Mediterranean climate. Energy Build. 2015, 109, 230–244. [Google Scholar] [CrossRef]
- Stephan, A.; Crawford, R.H.; De Myttenaere, K. A comprehensive assessment of the life cycle energy demand of passive houses. Appl. Energy 2013, 112, 23–34. [Google Scholar] [CrossRef] [Green Version]
- Bakar, N.N.A.; Hassan, M.Y.; Abdullah, H.; Rahman, H.A.; Abdullah, M.P.; Hussin, F.; Bandi, M. Energy efficiency index as an indicator for measuring building energy performance: A review. Renew. Sustain. Energy Rev. 2015, 44, 1–11. [Google Scholar] [CrossRef]
- Venkatraj, V.; Dixit, M.K.; Yan, W.; Lavy, S. Evaluating the impact of operating energy reduction measures on embodied energy. Energy Build. 2020, 226, 110340. [Google Scholar] [CrossRef]
- Triana, M.A.; Lamberts, R.; Sassi, P. Sustainable energy performance in Brazilian social housing: A proposal for a Sustainability Index in the energy life cycle considering climate change. Energy Build. 2021, 242, 110845. [Google Scholar] [CrossRef]
- EU-GUGLE. Project Description. Available online: http://eu-gugle.eu/project/ (accessed on 24 May 2021).
- EU-GUGLE. A Sustainable Renovation Pilot Project for Smarter Cities. Available online: https://www.eurac.edu/en/research/technologies/renewableenergy/conferences/Documents/4.%20Morishita%20Naomi.pdf (accessed on 24 May 2021).
- Hirvonen, J.; Jokisalo, J.; Heljo, J.; Kosonen, R. Towards the EU emissions targets of 2050: Optimal energy renovation measures of Finnish apartment buildings. Int. J. Sustain. Energy 2019, 38, 649–672. [Google Scholar] [CrossRef] [Green Version]
- Niemelä, T.; Kosonen, R.; Jokisalo, J. Cost-effectiveness of energy performance renovation measures in Finnish brick apartment buildings. Energy Build. 2017, 137, 60–75. [Google Scholar] [CrossRef] [Green Version]
- Available online: https://hometalkoot.fi/kerrostalo (accessed on 5 February 2021).
- OneClick LCA. We are One Click LCA. Available online: https://www.oneclicklca.com/about-one-click-lca/ (accessed on 2 February 2021).
- Petrovic, B.; Myhren, J.A.; Zhang, X.; Wallhagen, M.; Eriksson, O. Life cycle assessment of building materials for a single-family house in Sweden. Energy Procedia 2019, 158, 3547–3552. [Google Scholar] [CrossRef]
- Moran, P.; O’Connell, J.; Goggins, J. Sustainable energy efficiency retrofits as residential buildings move towards nearly zero energy building (NZEB) standards. Energy Build. 2020, 211, 109816. [Google Scholar] [CrossRef]
- Jiménez-González, C.; Curzons, A.D.; Constable, D.J.; Cunningham, V.L. Cradle-to-gate life cycle inventory and assessment of pharmaceutical compounds. Int. J. Life Cycle Assess. 2004, 9, 114–121. [Google Scholar] [CrossRef]
- Norway Standard 3720:2018. Available online: https://www.standard.no/en/webshop/productcatalog/productpresentation/?ProductID=992162 (accessed on 27 May 2021).
Figure 1.
Studied project location map.

Figure 2.
Building envelope renovation. (a) is the exterior wall details, (b) is roof details.

Figure 3.
Building life cycle stages.

Figure 4.
Normalized carbon emissions by life cycle stage.

Figure 5.
Life cycle carbon emissions trade-off.

Figure 6.
Embodied carbon emissions by element.

Figure 7.
Sustainability score.

Figure 8.
Sensitivity analysis. (a) is the sustainability score with equal weights; (b) is the sustainability score by climate change policy maker; (c) is the sustainability score by building owners; (d) is the before and after renovation operating energy use.
Figure 8.
Sensitivity analysis. (a) is the sustainability score with equal weights; (b) is the sustainability score by climate change policy maker; (c) is the sustainability score by building owners; (d) is the before and after renovation operating energy use.


Table 1.
Physical characteristics of the studied case buildings.
| Case 1 | Case 2 | Case 3 | Case 4 | Case 5 | Case 6 | Case 7 | Case 8 | |
|---|---|---|---|---|---|---|---|---|
| Construction year | 1961 | 1968 | 1970 | 1971 | 1974 | 1978 | 1973 | 1980 |
| Renovation year | 2017 | 2017 | 2017 | 2017 | 2015 | 2014 | 2017 | 2017 |
| Gross area (m2) | 1960 | 3693 | 5395 | 5554 | 2488 | 3024 | 4117 | 6060 |
| # of units | 72 | 94 | 148 | 61 | 70 | 108 | 60 | 72 |
| # of floors | 4 | 6 | 6 | 6 | 6 | 6 | 6 | 6 |
| U-value of envelope (W/m2 K) [18] | ||||||||
| External wall | 0.81 | 0.81 | 0.81 | 0.81 | 0.81 | 0.34 | 0.81 | 0.34 |
| Floor | 0.47 | 0.47 | 0.47 | 0.47 | 0.47 | 0.38 | 0.47 | 0.38 |
| Roof | 0.47 | 0.47 | 0.47 | 0.47 | 0.47 | 0.26 | 0.47 | 0.26 |
| Door | 2.2 | 2.2 | 2.2 | 2.2 | 2.2 | 1.4 | 2.2 | 1.4 |
| Window | 1.7 | 1.7 | 1.7 | 1.7 | 1.7 | 1.7 | 1.7 | 1.7 |
| Ventilation | ||||||||
| Type | Mech exh | Mech exh | Mech exh | Mech exh | Mech exh | Mech exh | Mech exh | Mech exh |
| Heat recovery efficiency | 0 | 0 | 0 | 0 | 0 | 0 | 0 | 0 |
| Air exchange rate | 0.5 | 0.5 | 0.5 | 0.5 | 0.5 | 0.5 | 0.5 | 0.5 |
| Room air temperature setpoint | 22 | 22 | 22 | 22 | 22 | 22 | 22 | 22 |
| Envelope area (m2) | 3938 | 10,738 | 6239 | 9582 | 15,750 | 6510 | 11,550 | 6345 |
| Window area (m2) | 1181 | 3758 | 2496 | 2875 | 3937 | 2278 | 3465 | 1903 |
Table 2.
Existing structural and envelope systems and materials used.
| Existing Building [20] | ||
|---|---|---|
| 1960s | 1970–1980 | |
| External wall | Concrete structure wall + mineral wool insulation (+/−100 mm) + prefabricated panel (+/−50 mm) or brick. | Concrete structure wall + mineral wool insulation (+/−100 mm) + prefabricated panel (+/−50 mm). |
| Roof system | Sloped roof, open-air strike, wooden frame as structure, seamed tin roof as roofing material. | Flat roof, hollow concrete slab (+/− 250 mm) + foam-based insulation (+/−125 mm) + roof plaster. |
| Floor system | Load-bearing concrete hollow core slab. | Load-bearing concrete hollow core slab. |
| Internal wall | Brick wall, plastered and painted. | Made of a bent sheet metal element with strips about 50 cm wide. Sheet metal element, plastic coated, partially tiled. Plated, wood, or metal frame. |
| Window | Wood window frame, some glass panels are operable. | Wood window frame, some glass panels are operable. |
| Exterior door | Wooden door with glass opening. | Replace with new door. |
Table 3.
Renovation techniques.
| R1 | Exterior Wall: Additional Mineral Wool Insulation (+/−200 mm) + Plaster Render |
| R2 | Roof: additional light gravel layer (+/−200 mm) + additional polyurethane insulation (+/−200 mm) + lightweight concrete (+/−40 mm) + bitumen membrane waterproofing |
| R3 | Replace existing windows with energy-efficient ones |
| R4 | Replace existing doors with energy-efficient ones |
| R5 | Renew the thermostat radiator valves and adjust the heating network |
| R6 | Add heat recovery from exhaust air in the ventilation system |
| R7 | Air-to-air heat pump |
| R8 | Air-to-water heat pump |
| R9 | Ground-source heat pump (for heating and cooling) |
| R10 | Connect to municipal district heating network |
| R11 | Replace existing lighting with LED lights |
| R12 | Add meter to monitor the water consumption |
| R13 | Remote energy use monitoring |
| R14 | Replace water faucets with more energy-efficient ones |
| R15 | Replace existing elevator with more energy-efficient ones |
| NC | No change |
Table 4.
Applied renovation techniques for each individual case building.
| Case 1 | Case 2 | Case 3 | Case 4 | Case 5 | Case 6 | Case 7 | Case 8 | |
|---|---|---|---|---|---|---|---|---|
| External wall | R1 | R1 | NC | NC | NC | R1 | NC | R1 |
| Roof system | R2 | R2 | NC | NC | NC | R2 | NC | R2 |
| Exterior window | R3 | R3 | R3 | R3 | R3 | R3 | R3 | |
| Exterior door | R3 | R3 | R3 | R3 | NC | R3 | R3 | R3 |
| Internal wall | NC | NC | NC | NC | NC | NC | NC | NC |
| Floor system | NC | NC | NC | NC | NC | NC | NC | NC |
| Lighting | R11 | R11 | R11 | R11 | R11 | |||
| Heating system | R9 | R7, R10 | R5, R8, R10 | R5, R9 | R8, R9, R10 | R5, R9, R10 | R5, R7, R9, R10 | R5, R7, R10 |
| Ventilation | R6 | R6 | R6 | R6 | R6 | R6 | R6 | R6 |
| Building management | R13 | R13 | R13 | R13 | R13 | R13 | R13 | R13 |
| Water supply | NC | NC | R14 | NC | NC | NC | R12 | R12, R14 |
| Vertical transportation | NC | NC | R15 | NC | NC | NC | NC | NC |
Table 5.
Case building data.
| Case # | Size (m2) | # of Units | # of Floors | Energy Intensity (After) | Energy Intensity (Before) | Operational Cost |
|---|---|---|---|---|---|---|
| (kWh/m2) | (kWh/m2) | ($/m2/Year) | ||||
| 1 | 1960 | 20 | 4 | 72 | 291 | 6 |
| 2 | 3693 | 94 | 6 | 94 | 174 | 8 |
| 3 | 5395 | 148 | 6 | 125 | 190 | 10 |
| 4 | 5554 | 61 | 6 | 61 | 172 | 5 |
| 5 | 2488 | 70 | 6 | 70 | 187 | 6 |
| 6 | 3024 | 108 | 6 | 73 | 130 | 6 |
| 7 | 4117 | 60 | 6 | 24 | 140 | 2 |
| 8 | 6060 | 72 | 6 | 72 | 137 | 6 |
Table 6.
Sustainability score.
| OES | EMB | ECO | EUI (After) | EUI (Before) | SC | SC Ranking | |
|---|---|---|---|---|---|---|---|
| (CO2-eq/m2) | (CO2-eq/m2) | ($/m2) | (kWh/m2) | (kWh/m2) | |||
| Case 1 | −505 | 86 | 6 | 72 | 291 | 141 | 2 |
| Case 2 | −154 | 153 | 8 | 94 | 174 | 13 | 8 |
| Case 3 | −250 | 62 | 10 | 125 | 190 | 78 | 4 |
| Case 4 | −227 | 78 | 5 | 61 | 172 | 66 | 5 |
| Case 5 | −311 | 82 | 6 | 70 | 187 | 98 | 3 |
| Case 6 | −242 | 98 | 6 | 73 | 130 | 66 | 5 |
| Case 7 | −181 | 107 | 2 | 24 | 140 | 40 | 7 |
| Case 8 | −401 | 49 | 6 | 72 | 137 | 144 | 1 |
Publisher’s Note: MDPI stays neutral with regard to jurisdictional claims in published maps and institutional affiliations. |
© 2021 by the author. Licensee MDPI, Basel, Switzerland. This article is an open access article distributed under the terms and conditions of the Creative Commons Attribution (CC BY) license (https://creativecommons.org/licenses/by/4.0/).
Share and Cite
MDPI and ACS Style
Hu, M. Beyond Operational Energy Efficiency: A Balanced Sustainability Index from a Life Cycle Consideration. Sustainability 2021, 13, 11263. https://doi.org/10.3390/su132011263
AMA Style
Hu M. Beyond Operational Energy Efficiency: A Balanced Sustainability Index from a Life Cycle Consideration. Sustainability. 2021; 13(20):11263. https://doi.org/10.3390/su132011263
Chicago/Turabian StyleHu, Ming. 2021. "Beyond Operational Energy Efficiency: A Balanced Sustainability Index from a Life Cycle Consideration" Sustainability 13, no. 20: 11263. https://doi.org/10.3390/su132011263
Note that from the first issue of 2016, this journal uses article numbers instead of page numbers. See further details here.