Article

The Effect of Untreated and Acidified Biochar on NH3-N Emissions from Slurry Digestate

1
Chair of Soil Science, Institute of Agricultural and Environmental Sciences, Estonian University of Life Sciences, 51006 Tartu, Estonia
2
Chair of Animal Nutrition, Institute of Veterinary Medicine and Animal Sciences, Estonian University of Life Sciences, 51006 Tartu, Estonia
*
Author to whom correspondence should be addressed.
Sustainability 2021, 13(2), 837; https://doi.org/10.3390/su13020837
Submission received: 8 December 2020 / Revised: 6 January 2021 / Accepted: 13 January 2021 / Published: 15 January 2021

Abstract

:
The development of new options to reduce ammonia (NH3) emissions during slurry manure storage is still required due to the shortcomings of the current technologies. This study aimed to identify to what extent untreated and acid-treated biochar (BC) and pure acids could reduce ammonia nitrogen (NH3-N) volatilization and increase nitrogen retention in slurry digestate. The NH3-N emissions were effectively reduced by H2SO4 and H3PO4 acids, untreated BC when applied mixed into the digestate and acidified BC treatments applied on the surface of the digestate. Acidification increased the specific surface area and number of O-containing surface functional groups of the BC and decreased the pH, alkalinity and the hydrophobic property. Compared to untreated BC, the ability of BC to reduce NH3-N emissions was greater when it was acidified with H2SO4 and applied to the digestate surface. The effect on digestate pH of acidified BC when applied mixed into the digestate was not different, except for H2O2, from that of the addition of the respective pure acid to digestate. The total N concentration in digestate was not significantly correlated with NH3-N emissions. These findings indicate that acidified BC could be an effective conditioner to reduce NH3-N emissions from slurry digestate storage.

Graphical Abstract

1. Introduction

Approximately 80%–90% of global ammonia (NH3) emissions originate from agriculture [1], and 64% are associated with livestock production [2,3]. The major sources of NH3 emissions are livestock housing, manure storage [4] and application of manure to grassland or arable land [5].
Although NH3 is not considered a greenhouse gas, it is an important environmental pollutant. NH3 emissions are linked to several global environmental problems such as acidification of soils [6], eutrophication in terrestrial and aquatic ecosystems [7] and the formation of particulate matter in the atmosphere [8]. Deposition of NH3 in soil, water and air can have repercussions for plant biodiversity and human and ecosystem health at both local and regional scales [9].
The gaseous loss of nitrogen (N) also reduces the value of animal manure as a fertilizer for crop production [10,11]. Depending on the storage period, NH3 losses from dairy cow digestate can account for between 6% and 40% of the total N contained in the digestate [12], whereas from pig slurry they can reach 50%–60% [13].
The mitigation of NH3 emissions has become a major focus of research in many countries to mitigate environmental issues [14] and reduce N losses from slurry fertilization [15]. Several manure management technologies have the ability to reduce NH3 emissions, but only a few of these solutions are commercially available for use in livestock farming because of technical and economic barriers that hinder their implementation [16].
One of the best-known methods to decrease NH3 emissions is covering the slurry storage areas. Slurry covers can be permeable or impermeable, fixed or floating. Currently, livestock farmers use permeable covers such as natural crust, straw, geotextiles or clay minerals or impermeable covers such as plastic, concrete, wood or steel [17,18,19]. Impermeable covers tend to have higher life expectancy and are up to 100% more effective than permeable covers in reducing NH3 gases from manure storage [20]. However, impermeable covers are very expensive, require a rainwater handling system and make the agitation of the manure more difficult [21].
Acidification of animal slurry is another manure management practice developed in Denmark, which uses concentrated sulfuric acid (H2SO4 96%) as the acidification material [10]. However, the main shortcomings related to this technology are increased nitrous oxide (N2O) emissions [22], sulfur (S) leaching [23], risk of foaming [24] and potential hazards related to acid handling [10].
The level of NH3 emissions is greatly dependent on the equilibrium between aqueous (aq) ammonium ions (NH4+) and (aq) NH3 in manure [25]. The most important factors that influence the transformation rate of NH4+ to gaseous NH3 include NH4+ concentration, pH and exposure to the atmosphere [26]. However, pH is the decisive factor affecting NH3 formation at a constant temperature [20]. The greatest increase in NH3 emissions takes place between a pH of 7 and 10, while at pH levels below 7 only small quantities of NH3 are released, and there is almost no measurable free NH3 around a pH of 4.5 [27]. Therefore, the concept of reducing slurry pH to decrease NH3 emissions relies on shifting the balance between NH4+ (aq) and NH3 (aq) [28].
In recent years, there has been an increase from farming communities in using slurry conditioners. These products are considered to mitigate NH3 emissions in a cost-efficient manner [29] and are relatively easily applied to manure compared with other technologies that require modifications to the existing infrastructure and/or the purchase of expensive equipment [30]. Biochar (BC) is a porous material produced through pyrolysis or gasification of biomass at different temperatures with no or very low oxygen (O) availability [31]. BC has received increasing attention in recent years because of its diverse functionality in the fields of climate change mitigation, sustainable agriculture and environmental control [32]. The BC properties of high surface area, high porosity and high cation or anion exchange capacity make it a promising slurry conditioner to enhance NH4+ retention [33] and reduce nitrate (NO3) leaching [34]. These changes occur through the addition of BC in manure pits and/or to the soil together with the manure [35,36]. BC has been shown to decrease NH3 volatilization and improve N retention in poultry litter composting [37] and to adsorb ammonium nitrogen (NH4+-N) from piggery manure anaerobic digestate slurry [38], thus enhancing the fertilizer value of manure. However, with the increasing quantity of BC addition, the alkalinity of BC is likely to increase the pH of the manure and shift the NH4+/NH3 equilibrium toward NH3 volatilization [39]. To address this issue, the acidic oxidation of BC can neutralize the alkaline pH and facilitate the adsorption of NH4+ because of the increased amount of O-containing surface functional groups [40]. To date, only a few studies have examined the reduction of NH3 emissions using untreated BC as a digestate conditioner applied to manure and slurry storage tanks [35,41]. It was determined that untreated BC can effectively mitigate NH3 emissions from stored swine manure [35]. At the same time, acid modification can affect the physicochemical properties of the BC which in turn could alter the mitigation effect [42]. To the best of our knowledge, there are no published studies comparing surface and mixing application of acidified BC to reduce NH3 emissions.
The aim of the present study was to investigate (i) the ability of hay BC to reduce NH3-N emissions from digestate, (ii) to what extent the suppression effect of NH3-N emissions of BC can be enhanced through acidification, (iii) which method is more effective for the application of untreated and acidified BC (mixed or surface), and (iv) whether untreated and acidified BC addition reduces total N (Ntot), NH4+-N and nitrate-nitrogen (NO3-N) losses in digestate. We hypothesized the following: (1) low-temperature hay BC can reduce NH3-N emissions from slurry digestate, (2) BC acidification increases the capacity of BC to reduce NH3-N emissions, (3) BC effectiveness in reducing N losses depends on its application method to the digestate, and (4) untreated and acidified BC addition mitigates N losses from the digestate. The results of our study will generate information for the development of alternatives to reduce N losses from slurry storage facilities.

2. Materials and Methods

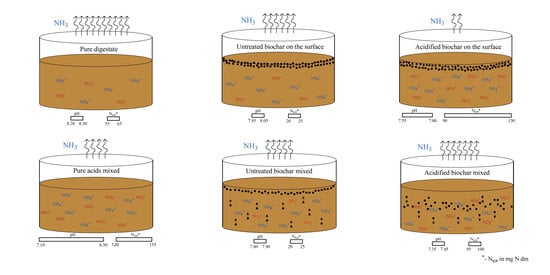
2.1. Experimental Design

The research trial was carried out under controlled laboratory conditions at the Estonian University of Life Sciences (EULS) during a period of 240 days from October 2018 until May 2019. The experiment included a total of 12 treatments and consisted of two experimental factors: (i) digestate conditioner (untreated BC, acidified BC and acid) and (ii) application method of digestate conditioner (BC on the surface – BCs; BC mixed into the digestate – BCm). The pure acids were applied in pure form mixed into digestate only (Table 1).
For accuracy and logistical reasons, the experiment was conducted in two batches. The measurements of digestate pH can increase N emissions in BC treatments, which can bias the estimation of retained N concentrations in digestate. In addition, it was more convenient to measure the N concentrations in all treatments at the same time (and not as one replicate after another during the time span of 8 months). Therefore, in the first batch, NH3 emissions and digestate pH were measured and replicated three times from October 2018 until May 2019. In parallel, the second batch examined NH4+-N, NO3-N, total nitrogen (Ntot) and total carbon (Ctot) concentrations, which were replicated four times from February 2019 until April 2019. In both batches, the replications were carried out in the same order and the digestate conditioners were applied in the same amounts, manner and laboratory conditions.

2.2. Materials

The BC was produced from reed canary (Phalaris arundinacea L.) hay pellets and torrefied at 300 °C. The quantities on a dry weight basis of total phosphorous (Ptot), total potassium (Ktot), total calcium (Catot) and total magnesium (Mgtot) were 2400 mg kg−1, 22,800 mg kg−1, 9300 mg kg−1 and 4700 mg kg−1, respectively. The ash concentration was 10.4%, cumulative pore volume represented 0.0015 cm3 g−1, and the concentration of volatile compounds was 62.9%. The nutrient concentrations, specific surface area (SSA), pH and acid neutralization capacity were determined in the EULS laboratory (Tartu, Estonia). The remaining physicochemical properties were determined at the Lithuanian Energy Institute (Kaunas, Lithuania).
The digestate originated from the Ilmatsalu biogas plant (Tartu county, Estonia) and consisted of 85% cattle slurry; approximately 10% was a mixture of pig slurry, manure (straw bedding) and green biomass, and less than 5% contained food industry by-products. Physicochemical details of the acidified BC conditioners are shown in Table 2.

2.3. Experimental Set-Up

A schematic of the experimental set-up is shown in Figure 1. Digestate was stored in a closed 30-L plastic bucket at 4–6 °C during the entire experiment. Before each sampling, the digestate was mixed thoroughly with a rod to obtain a homogenous material. The digestate was then transferred with a graduated glass beaker to 125-mL Berzelius beakers for the control and BC treatments while 200-mL beakers were used for the acids to allow for the formation of foam. Precision balances PS 450/X (RADWAG, Radom, Poland) were used to weigh digestate and conditioner materials. The weight of digestate for each sample was 100 g, and the weight of untreated and acid-treated BC was 5 g. The weights of added acids were calculated based on the standard dosage rate of 5 kg of H2SO4 (96% concentration) per 1 ton of slurry, which has been previously utilized in the slurry acidification technology [10]. The weights of the other two acids were calculated based on the molar mass and concentration of the acid:
m = n M
where m is the mass of the acid (g), n is 0.005 (mol), and M is the molar mass of the acid (g/mol). Therefore, the application rate of H2SO4 at 96% concentration was 0.5 g, H3PO4 of 85% was 0.59 g, and H2O2 of 50% was 0.34 g.
The BC pellets were ground manually using a lab porcelain mortar and pestle until they had a particle size of less than 1.25 mm.
Ten grams of milled BC were weighed into a 200-mL plastic flask with a cap, to which 100 mL of 0.5 N H2SO4 solution was added at 1:10 (w/v) BC to acid ratio. The plastic flasks with BC and acid solution were sealed and placed in a reciprocating shaker GFL 3006 (GFL, Burgwedel, Germany) to be agitated for a minimum of 24 h at 100 rpm. The acidified BC particles were separated from the liquid via filtering. A cone-like shaped piece of filter paper 56 G (Lachner, Neratovice, Czechia) was placed within a glass funnel with a diameter of 9–11 cm, which in turn was placed into a conical glass flask of 300 mL. The suspension from the plastic flasks was poured through the funnel and left to filtrate for at least 24 h. Identical solution normality and preparation steps were followed to acidify BC with H3PO4 and H2O2.
A multi-gas detection equipment X-am 7000 (Dräger, Lubeck, Germany) connected to an 860-CG acrylic desiccator chamber with a gas port (Plas-Labs, Lansing, MI, USA) was used to measure NH3 concentrations. The volume of the chamber (Plas-Labs) was 24.9-L, equipped with two gas ports and built of transparent acrylic material. Recorded data were transferred to PC using an infrared interface and GasVision software version 5.8.2. (Dräger, Lubeck, Germany). The X-am 7000 apparatus was calibrated before each replication.

2.4. Measurements and Analyses

2.4.1. NH3 Concentration and Digestate pH

The NH3 concentrations were measured in two separate sessions. The first session lasted for 48 h (2880 min), immediately after the digestate was exposed to ambient conditions. In the second session, the gas concentrations were monitored for 24 h (1440 min) from the 7th to 8th day after the beginning of the experiment. Between the measurement sessions, all samples were stored in an unilluminated laboratory cabinet with similar environmental conditions to the location of the measurement sessions.
The pH of the digestate was measured with an HD 2156.2 pH meter (Delta OHM, Padua, Italy) at the beginning of the experiment and after 48, 72, 96 and 120 h. In the untreated and acidified BCs treatments, the pH measurements were recorded under the BC layer (approximately 3–5 cm deep) and in the middle of the vessel (approximately 7–9 cm deep). In the untreated and acidified BCm as well as in the control and acid treatments, the pH was measured only in the middle of the vessel.

2.4.2. Nutrient Concentration

The Ntot, Ctot, NH4+-N and NO3-N concentrations were measured in the digestate at the beginning of the experiment and after 30 days. The same parameters were also examined separately in the BC conditioners before their application to the digestate. The Ntot and Ctot concentrations were determined after dry combustion with a varioMAX CNS elemental analyzer (Elementar Analysensysteme GmbH, Langenselbold, Germany). The NH4+-N and NO3-N were determined after steam distillation [43] using a UDK 126D distillation unit (VELP Scientifica, Usmate Velate, Italy). The N-containing species were calculated by subtracting the concentration in the BC from the total concentration retained in the digestate.

2.4.3. BC Examination

The pH of BC conditioners was determined by a benchtop pH meter SevenCompact S210 (Mettler-Toledo, Schwerzenbach, Switzerland) in a suspension of 1 M KCl using a 1:2.5 (w/v) BC to solution ratio. CaCO3 concentration of BC was established via the titrimetric method explained in detail in the standard operating procedure of Food and Agriculture Organization (FAO) [44]. The acid neutralization capacity expressed as a percentage of CaCO3 was calculated based on the following formula:
C a C O 3 ,   %   =   V H C l N H C l V N a O H N N a O H m × 0.05 × 100
where V H C l N H C l and V N a O H N N a O H are the volume and normality of hydrogen chloride (HCl) and sodium hydroxide (NaOH), and m is the mass of BC material (g).
The SSA (m2 g−1) was estimated by the water vapor adsorption method [45] using the relationship explained by Gámiz et al. [46]:
S S A = n m N σ m 100 = 36.16 n m m 100
where n m is H2O in monolayer (mol), N is Avogadro’s number (6.02 × 10²³), σ is surface area per H2O molecule (10.8 × 10⁻²⁰ m2), and m is the mass of sorbent (g).
Fourier transform infrared spectroscopy (FTIR) analysis was performed to analyze the surface functional groups using a Thermo-Nicolet iS10 Fourier transformed infrared spectrophotometer (Thermo Fisher Scientific, Waltham, MA, USA). The spectral range was between 4000 to 400 cm−1 with a resolution of 4 cm−1, and 32 scans were conducted. An automated baseline correction was applied to adjust the resulted spectra in OMNIC software version 8.3.103. (Thermo Fisher Scientific, Waltham, MA, USA).

2.5. Flux Calculation

The NH3 concentrations (mg m−3) were calculated in accordance with the ideal gas law:
C N H 3 = V N H 3 M W N H 3 P R T
where V N H 3 is the volume of NH3 (ppm min−1), M W N H 3 is the molecular weight of NH3 (g), P is pressure (atm), R is the universal gas constant (L atm mol−1 K−1), and T is the ambient temperature (K).
The NH3 measurements were conducted in an open dynamic chamber system in which the sampled air was pumped outside from the chamber while at the same time the fresh ambient air was drawn into the chamber. The air from the chamber with NH3 concentration was pumped out of the measurement equipment after measurement to avoid contamination with the air pulled into the chamber. The measured NH3 concentrations had therefore to be corrected for the NH3 concentration loss of the gas flow. The corrected NH3 concentrations (mg m−3) were determined according to in- and outflow rates as follows:
C c o r N H 3 = C N H 3 + I R A i r N H 3 I R + C N H 3 V c h a m b e r O R V c h a m b e r
where C N H 3 is the measured NH3 concentration in the chamber (mg m−3), IR is inflow rate (m3 min−1), A i r N H 3 is the concentration of NH3 in the air outside the chamber (mg m−3), V c h a m b e r is the volume of the chamber (m3), and OR is outflow rate (m3 min−1).
The NH3-N fluxes (mg m−2 h−1) were calculated from the slope of the linear regression of the corrected NH3 concentrations of a 10 min interval (10 measurements) using the formula [47]:
F N H 3 N =   ( m N H 3 V c h a m b e r ) M N   S b e a k e r t M p 1 M N H 3
where m N H 3 is the slope of NH3 concentration changed in time (mg m−3), V c h a m b e r is the volume of the chamber (m3), M N is the molar mass of N (g mol−1), S b e a k e r is the surface of the beaker (m2), M p is the number of measurement points during measurement sessions, t is the time conversion factor to 1 h, and M N H 3 is the molar mass of NH3 (g mol−1).

2.6. Statistical Analysis

Statistical analysis was conducted using the R programming software [48]. Data were analyzed using analysis of variance (ANOVA) to study the effect of BC treatment (untreated and acidified), time and the interaction between them on NH3 emissions; digestate pH and N concentrations were compared for the two application methods (mixed in or on the surface). The pure-form acids were also tested but using only the mixed application method. Moreover, the effect of the three acids on the capacity of BC to reduce digestate pH and mitigate N losses over time was investigated between the application methods. When significant differences existed, a post-hoc Tukey’s honest significant difference (HSD) test was conducted to study the differences between groups [49]. The differences in pH were analyzed within and between time points. The NH3 emissions were compared between 100 min (1.6 h) intervals and cumulatively at the end of the first 48 h and for the session between the 7th to 8th measurement days. The different N compounds were tested between treatments at the end of the 30-day period. In addition, the proportion of the variance explained by each factor was determined from ANOVA analysis. Linear regression and Pearson correlation coefficient were used to analyze the relationship between NH3-N emissions and pH or mineral N concentration. Principle component analysis (PCA) of the FTIR spectra was performed using the function “dudi.pca” from the package “ade4” [50].

3. Results

3.1. NH3-N Emissions

The NH3-N emissions were significantly influenced by the digestate conditioner, time and BC application method (p < 0.001). Significant interactions were observed between BC, application method, acid and time (p < 0.001) (Table 3).
All BC treatments, except for BCm+H2O2, significantly reduced NH3-N emissions relative to the control during the first 3.5 h, but the reducing effect of BCm+H2SO4 became significant between 1.6 and 3.5 h. From 3.5 h until the end of the first measurement session, NH3-N emissions increased in untreated BCm, BCs and all acidified BCm treatments and were not significantly different from the control (p > 0.05) (Figure 2). In the acidified BCs treatments, NH3-N emissions were altogether lower than the control during the first 33 h (p < 0.05). From 33 h until 48 h, the NH3-N emissions from BCs+H2SO4 continued to be lower than those of the control (p > 0.05), but from the BCs + H3PO4 and BCs + H2O2 treatments, a few gaseous emissions were higher than the control.
The suppression effect of untreated BCs was not different from untreated BCm during the first 3.5 h (p = 0.80). In the untreated BCm treatment, a sharp increase in NH3-N emissions was detected during the first 1.5 h (Figure 2B), which was followed by a decrease between 1.5 and 3.5 h. However, in untreated BCs, no emissions were recorded during the first 1.5 h, and a steep increase in NH3-N emissions was recorded from 1.5 until 3.5 h. From 3.5 h onward, the NH3-N emissions in untreated BCs were higher than untreated BCm, but the differences were not significant (p > 0.05).
Of the pure acids, only H2SO4 and H3PO4 significantly reduced NH3-N emissions. During the 48-h time period, the reduction effect of both acids was statistically significant during the first 5 h and from 28 to 33 h (p < 0.01) (Figure 2A).
BC acidification improved the suppression effect of BCs but not of BCm (Figure 2B,C). The enhancement of BCs was dependent on the type of acid. Acidification with H2SO4, H2O2 and H3PO4 prolonged the reduction effect of BCs by 41.5, 38.5 and 31.5 h, respectively.
After seven days, the emissions of NH3-N in all BC treatments were not significantly different from those of the control (p > 0.05) (Table S1), although the suppression effect of pure acids occasionally were strong (Figure 2A).

3.2. Cumulative NH3-N Emissions

Cumulative NH3-N emissions in the control were 46.45 ± 4.73 mg N m−2 after 48 h (Figure 3). Addition of untreated BCs and BCm reduced the cumulative NH3-N emissions by 48% (p = 0.07) and 52% (p = 0.04) compared with the control. The suppression effect of BCs and BCm was not significantly different (p = 1.00).
Relative to control, the H2O2, H3PO4 and H2SO4 acids reduced NH3-N emissions by 36.7% (p = 0.37), 68% and 70% (p < 0.01), respectively. In addition, the acidified BCs+H2O2, BCs+H3PO4 and BCs+H2SO4 conditioners reduced NH3-N emissions compared to control by 80%, 88% and 95% (p < 0.001). Meanwhile, acidified BCm+H2O2, BCm+H2SO4 and BCm+H3PO4 decreased cumulated emissions only by 21% (p = 0.93), 38% (p = 0.31) and 44% (p = 0.14) in comparison to control.
Acidification improved the suppression effect of BCs while it decreased the effectiveness of BCm. The suppression effect in acidified BCs + H2O2, BCs + H3PO4 and BCs + H2SO4 treatments was improved by 61% (p = 0.57), 78% (p = 0.24) and 91% (p = 0.09) compared to untreated BCs, respectively. In contrast, the suppression success in BCm + H2O2, BCm + H2SO4 and BCm + H3PO4 conditioners compared with the untreated BCm decreased by 64% (p = 0.59), 30% (p = 0.99) and 16% (p = 0.99). Between the 7th and 8th day, the cumulative NH3-N emissions were not significantly different between treatments (p > 0.05) (Figure S1).

3.3. pH of Digestate

The rates of NH3-N emissions were positively correlated with the pH values in digestate after the addition of the experiment conditioners. The majority of NH3-N emissions occurred in the pH range from 6.80 to 8.50 and peaked between 7.75 and 8.50 (Figure 4). The application location of untreated and acidified BC, type of acid and time had a significant effect on pH levels (Table S2). Untreated BCm significantly decreased (p = 0.01) the average digestate pH by 0.40, whereas the average pH in the untreated BCs treatment was not different (p = 0.35) from that of the control. H2SO4 and H3PO4 significantly decreased (p < 0.001) the average pH in digestate by 0.80 and 1.15, whereas H2O2 slightly increased it (p = 1.00) (Table S3). The reduction effect on the digestate pH of BCm + H2O2 (p = 0.003), BCm + H2SO4 (p = 0.004) and BCm + H3PO4 (p = 0.01) was two times greater than that of the untreated BCm, and it was not different from the effect of the addition of H2SO4 (p = 1.00) and H3PO4 (p = 0.07) acids alone during the first five days of measurement. Acidified BCs did not influence digestate pH in the middle of the vessel (p > 0.05), but the pH was 0.2–0.3 less beneath the surface cover than that under the untreated BCs cover. BCs + H3PO4 was the only treatment to have an average pH significantly lower (p = 0.03) than untreated BCs.

3.4. Concentration of NH4+-N, NO3-N and Ntot

Thirty days from the beginning of the experiment, the NH4+-N concentration was significantly higher (p < 0.01) than that of the control in all conditioner treatments, except H2O2. NO3-N concentration in the BC + H2O2, BC + H2SO4 and the H2SO4 and H3PO4 treatments (p < 0.001) and Ntot in the H2SO4 and H3PO4 treatments were higher (p < 0.01) than control (Figure 5).
The impact of BCs and BCm on the NO3-N concentration increased significantly (p < 0.01) after they were acidified with H2O2 and H2SO4, whereas acidification with H3PO4 decreased (p = 0.04) the impact of BCm on the NH4+-N concentration. However, the effect of the BC on the Ntot concentration remained unchanged through the acidification process (p > 0.05).

3.5. Structural Characterization of BC

FTIR spectra showed increased amounts of O-containing functional groups in all three acidified BC conditioners compared with the untreated BC (Figure 6). The PCA of the FTIR spectroscopy indicated that the surface of untreated BC was different from BC + H2SO4, BC + H3PO4 and BC + H2O2 in the amounts of aromatic, carbonyl, aliphatic, hydroxyl, amine and alcohol groups. The first principal component (PC1) explained the greatest portion of the variance (77.5%) while the second (PC2) contributed 13.2% to the total variance (Figures S2 and S3).
The differences in infrared spectra between acidified BC materials showed also different effects in the studied acids. The asymmetric and symmetric stretching vibrations (amine -NH and -NH2) at 3340 and 3391 cm−1 increased the most in BC acidified with H2SO4, indicating that the nitro groups (-NO2) at 1539 cm−1 converted to the corresponding amino group [51]. The intensity of the hydroxyl (-OH) peak at 3296 cm−1 was higher also in BC + H2SO4 than that of BC + H3PO4 and BC + H2O2, possibly due to a greater degree of acidification [52]. The asymmetric and symmetric stretching vibrations (aliphatic -C-H and -CH2) at 2923 and 2852 cm−1 increased with acidification probably as a result of the aliphatic side chain oxidation [40,53]. Acidification enhanced the strength of the three acidified BC peaks at 1705 cm−1 (-C=O stretching in the carboxyl group). The effect on the stretching vibrations of aromatic -C=C at 1515 and 1393 cm−1 was weaker for BC + H2SO4 and BC + H3PO4 in comparison to BC + H2O2 and untreated BC. Meanwhile, the vibration peak at 1620 cm−1 (-C=C stretching vibration of alkenyl groups) was highest in BC + H2SO4 and BC + H2O2 [54]. Simultaneously, all three acidified BCs displayed a peak at 1235 cm−1 that may represent -C-O stretching in carboxylic acid.

4. Discussion

4.1. Effect of Untreated BC on NH3-N Emissions

The addition of untreated BCm into digestate caused a reduction of cumulative NH3-N volatilization after 48 h compared with the control. In contrast, the untreated BCs did not produce a decrease in cumulative NH3-N emissions relative to control. The suppression effect of BCm was delayed in comparison to BCs, but despite that delay, the cumulative NH3-N emissions in BCm were not significantly different in comparison to BCs.
The short-term effectiveness (<1.5 h) of untreated BCs is likely to be related to the formation of a physical barrier on the digestate surface. The physical cover of untreated BCs particles prevented the digestate from being exposed to the surrounding environment and slowed down the transfer of NH3-N gases at the digestate–air interface. The NH3-N emissions were also slowed down in the control and pure acid treatments due to the digestate crusting. However, the surface crust in these treatments formed later than the BC cover and after a considerable gaseous loss had already occurred. The effectiveness of untreated BCs declined after 1.5 h possibly due to its strong water repellent characteristic. The hydrophobic property prevented the BCs particles from submerging deeper into the digestate, and the resulting BC cover was less resistant to NH3-N emissions. The dry surface of untreated BCs observed 48 h after the application was an indicator of its durable hydrophobicity. This strong physical property was probably induced by the large quantity of aliphatic functional groups on the BC surface (Figure 6). Previous studies have shown a strong correlation between hydrophobicity and the presence of aliphatic functional groups (–C-H, CH2) on the BC surface [63,64]. Our findings are in accordance with those of Holly and Larson [41] in which BC, made from wood and maize cob pyrolyzed at 400 °C, effectively mitigated NH3-N emissions from the dairy manure storage. The effectiveness of BC in their experiment was due to the action of the physical barrier on the manure surface provided by the BC cover thickness of 3.1 and 2.5 cm.
Untreated BC mixing increased the NH3-N emissions at the very beginning of the experiment. The volatilization occurred probably because of the pH increase in the digestate caused by aeration when the BC was mixed with the digestate. The digestate pH also increased in the control treatment due to a higher concentration of OH-, even though the digestate was not mixed. In the BCs treatment, the NH3-N emissions and pH under the BC cover were notably lower than in control because the digestate was not in direct contact with ambient air. The reduced effect of the BCs treatment might also be because the relative change of digestate pH only occurred below the BC cover. According to García-González et al. [65], manure aeration stimulates OH groups release and increases manure pH, which in turn increases the conversion rate of NH4+-N to NH3-N. In the BCm treatment, however, the aeration increased NH3-N emissions in the short-term (<3.5 h). As the BCm particles started to migrate to the upper part of the vessel, they formed, like the BCs treatment, a physical barrier against NH3 loss. However, not all BCm particles floated to the digestate surface after mixing to provide resistance to NH3-N emissions. The BCm particles located closer to the center of the vessel decreased the digestate pH in the middle of the vessel and diminished the formation of NH3-N. The pH reduction was furthermore exacerbated by greater contact between BCm particles and digestate.

4.2. Effect of Acidification on BC Characteristics and NH3-N Emissions

The physicochemical characteristics of BC that affected NH3-N emissions were positively influenced by acidification. Compared with the untreated BC, the SSA and number of surface functional groups were greater in acidified BC (Table 2, Figure 6), whereas pH and alkalinity levels were smaller. These findings indicate that the ability of acids to change BC properties is different.
SSA increased the most in BC + H2O2 and BC + H2SO4, whereas the SSA increase was slightly less in BC + H3PO4. Maximum peaks of hydroxyl (-OH) and carbonyl (–C=O) functional groups were observed in the BC + H2SO4. The peak of aliphatic functional groups was highest in BC + H3PO4, but it was also high on the surface of BC + H2SO4 (Figure 6). The amount of previously mentioned functional groups was a little lower in BC + H2O2. Vithanage et al. [66] and Cibati et al. [67] showed that BC treatment with H2SO4 increased the O/C ratio twofold, whereas treatment with H2O2 only increased it 1.5-fold. These findings indicate the capacity of different acids to generate O-containing functional groups on the BC surface [68]. The addition of O-H, C=O, C-O and N-H functional groups on the BC surface can decrease its hydrophobicity [69,70]. Shen et al. [71] found that acid treatment of BC with HNO3 and H2SO4 enhanced the hydrophilic surface of the BC. Recent study also found that acid-treated BC particles sank deeper into the digestate compared with untreated BC when the surface application method was applied, but they could not rise to the digestate surface in the mixed application method. These findings indicate that BC acidification is an effective method to cause the hydrophobic surface of the BC to become slightly more hydrophilic.
Acidification also remarkably reduced the pH and alkalinity of BC. The effect of acid-treated BC on digestate pH was comparable, except for H2O2, to the respective pure acid applied to the digestate alone. Our results contrast with those of Huff and Lee [72], who found that the pH of BC was only slightly reduced by H2O2 because of the weak ability of this acid to create acidic functional groups on the BC surface.
Acidification improved the effect of BCs to suppress NH3-N emissions. As a result of the developed hydrophilic property, acidified BC particles could form a thicker cover on the digestate surface that withstood the pressure exerted by the gases in the digestate for a longer period than untreated BCs. The ability to reduce NH3-N emissions of BCs + H2SO4 or BCs + H3PO4 was slightly greater than that of both acids when applied in the pure form in the first 48 h only (Figure 3). BC acidification can also reduce the amount of BC needed to effectively decrease the NH3-N emissions. Maurer et al. [35] determined that NH3 emission reduction from manure resulting from surface-applied untreated BC was attained at 4.56 kg m−2 but not at 2.28 kg m−2. In the present study, the NH3 emissions from slurry digestate were effectively reduced by applying acidified BC on the digestate surface at about 2.50 kg m−2.
However, the capacity of BCm to reduce NH3-N emissions was not improved by acidification because most of acidified BCm particles could not float to the digestate surface as they did in the untreated BCm treatment. Although the effect of acidified BCm to influence digestate pH was comparable to that of the pure acids, their impact on NH3-N emissions was smaller than that of the pure acids. Such results might be because of the slower capacity of acidified BCm to alter the digestate pH suggested mostly by the great differences in pH and NH3-N emissions between acid and acidified BC treatments observed in the early stage of the experiment (<3.5 h) (Table S3, Figure 2A,B). The NH3-N emission difference later diminished when digestate pH in acidified BC and acid treatments leveled off. Iriarte-Velasco et al. [73] showed that BC alkalinity was not removed entirely by acidification; BC treatment with H2SO4 and H3PO4 acids induced the formation of solid compounds such as calcium sulfate, calcium phosphate and other salts. The results of the current study show that the effect of acidified BC on digestate pH remained the same as that of pure acid for at least five days. The pH of digestate where acidified BC was added could increase at a certain moment in time due to the salts present in the ash of acidified BC. Thus, further studies are needed to analyze the effect on pH in longer periods.
Petit et al. [74] found that the capacity of BC to adsorb NH3-N can be increased through acidification. In the current experiment, the sorption capacity of BC was not studied, but the differences in the adsorbed amount of NH3-N among BC treatments can be inferred from the presence of O functional groups. NH3-N adsorption onto H2SO4-treated BC was markedly more effective than onto untreated BC because of the increased amount of O functional groups, particularly sulfonic groups (-SO3H) in the BC samples subjected to chemical treatment. Ro et al. [75] showed that H3PO4 acid activation greatly increased the NH3 adsorption capacity of BC. They suggested that exceptionally high NH3 adsorption capacity was generated by H3PO4 acid bound to the acid-activated BC.
Our findings indicate that acidification can alter BC physicochemical features, which may increase the suppression effect of BC on NH3 emissions.

4.3. Effect of Conditioner Treatments on N Concentration in Digestate

The Ntot concentration in digestate after 30 days was not significantly correlated with NH3-N emissions recorded in the first 48 h and between the 7th and 8th days. In addition to NH3-N emissions, the Ntot concentration could be affected by other N-containing gas emissions. Previously, Chadwick et al. [76] showed that the crust or permeable cover formed on the slurry surface during the storage period reduced NH3 but increased N2O emissions. In addition, in our experiment, the BC cover might have stimulated N2O emissions because of the anaerobic conditions.
The conditioners used in the current experiment affected digestate pH and probably also gaseous exchange at the liquid–air interface by the cover formed on the digestate surface. The pH affects the equilibrium between aqueous (aq) NH4+ ions and (aq) NH3 in manure [25]. As digestate pH increases, the concomitant increase of NH3 concentration may inhibit the activity of nitrifying bacteria. As a result, NH4+ is converted into N2O and dinitrogen (N2) gases bypassing the NO3-N phase [77].
In the BCs treatments, N2O emissions were probably not the main factor influencing the NO3-N concentration in digestate. The NO3-N concentration was higher in acidified BCs than in untreated BCs, even though a longer-lasting acidified BCs cover and slightly lower digestate pH should promote denitrifying bacteria activity [76,78,79]. It is possible that NO3-N was adsorbed by acid-treated BC, and its degradation by microorganisms became more difficult. Lan et al. [80] noted that BC adsorption of NO3 in soil can decrease its availability for denitrifiers. The NO3-N concentration between acidified BCs and BCm with H2SO4 or H2O2 was not different, although the cover was not formed in acidified BCm. NO3-N sorption could be promoted by surface basic functional groups such as primary and secondary amine groups (Figure 6) via electrostatic interactions. This is in accordance with the findings of Wu et al. [81] that NO3 can interact with amine groups through electrostatic interactions during the adsorption process. In BC + H3PO4, the NO3-N could be limited because of the presence of competitive phosphate anions (PO43−) bound by sorption sites during acidification, which could remain immobilized because of their highly negative charge. A small amount of NO3-N could be adsorbed to positively charged cations (K+, Ca2+ and Mg2+) present in the ash of acidified BC by bridge bonding. Fidel et al. [82] mentioned that some NO3-N sorption to acidified BC can occur via cation bridging. However, NO3-N could not be bound by untreated BC primarily because of the lower peaks of basic functional groups. Alsewaileh et al. [83] found that low-temperature BC (300 °C) exhibited minimal adsorption efficiency of NO3-N because of the reduced total basicity (surface basic functional groups) and limited surface area.

5. Conclusions

Of the eleven treatments compared in the experiment, H2SO4 and H3PO4 acids, untreated BCm and acidified BCs treatments were found in reducing NH3-N emissions from digestate. The NH3-N emissions were reduced to a similar extent by all these treatments even though the suppression mechanism was different. Acids reduced the digestate pH and reduced the rate of conversion from NH4+-N to NH3-N. Untreated BCm formed a physical barrier on the digestate surface that isolated the digestate from the atmosphere.
Acidification of BC increased its specific surface area and number of O-containing surface functional groups and decreased the pH, alkalinity and the hydrophobic property. The impact on NH3-N emissions of acidified BC was dependent on the application method. Compared with untreated BC, the ability of BC to reduce NH3-N emissions was greater when it was acidified with H2SO4 and applied to the digestate surface because of the reduced hydrophobic property of BC particles that sank deeper into the digestate. The effect on digestate pH of acidified BCm was comparable, except for H2O2, to the respective pure acids applied individually. However, the reduction of pH of the digestate occurred later in time, and thus the impact on NH3-N emissions was weaker. The effect was also less strong compared to untreated BCm because most of the acidified BCm particles could not float to the digestate surface and form a physical cover. The novel finding of our study is that acidified BC applied on digestate surface could have an effective application potential to reduce NH3 emissions from slurry storage tanks.
These results suggest that BC cover might stimulate N2O emissions because of the anaerobic conditions. In addition, BC + H2SO4 and BC + H2O2 might adsorb NO3-N present in digestate and decrease its availability to denitrifying bacteria. These new hypotheses need to be tested in future research.

Supplementary Materials

The following are available online at https://www.mdpi.com/2071-1050/13/2/837/s1, Figure S1: Cumulative NH3-N emissions from the 7th to 8th day (mean ± standard error; n = 3). Results marked with similar lowercase letters are not significantly different. Control is digestate without conditioner; H2O2, H2SO4 and H3PO4 represent pure-form acids applied mixed into the digestate; BC is biochar; BC + H2O2, BC + H2SO4 and BC + H3PO4 represent BC acidified with the respective acid; BCm indicates that the BC was mixed with the digestate and BCs indicates that the BC was applied to the digestate surface. Figure S2: PCA1 and PCA2 of FTIR spectra for untreated and acidified biochar (BC) amendments. BC + H2O2, BC + H2SO4 and BC + H3PO4 represent BC acidified with the respective acid. Figure S3: Eigenvectors and wavenumber values for principal components 1 and 2 (PC1 and PC2, respectively) of the FTIR spectra. Table S1: NH3-N emissions during 24 h on the 7th day after conditioner application as the effect of conditioner, application method and time passed since conditioner application (two-way ANOVA analysis; n = 3). Asterisks indicate the level of significance. **** p < 0.0001; *** p < 0.001; ** p < 0.01; * p < 0.05. A lack of * symbols indicates significance at p < 0.1. Table S2: Digestate pH during the first 5 days as an effect of conditioner, application method and time passed since conditioner application (two-way ANOVA analysis; n = 3). Asterisks indicate the level of significance. **** p < 0.0001; *** p < 0.001; ** p < 0.01; * p < 0.05. A lack of * symbols indicates significance at p < 0.1. Table S3: Digestate pH during the first 5 days (mean ± standard error, n = 3).

Author Contributions

Conceptualization, A.A., H.R., A.K., T.T. and P.C.; methodology, A.A., H.R., A.K. and T.T.; validation, A.A. and H.R.; formal analysis, P.C. and J.E.-G.; investigation, P.C.; resources, A.A., H.R., A.K. and T.T.; data curation, J.E.-G. and P.C.; writing—original draft preparation, P.C.; writing—review and editing, A.A. and H.R.; visualization, J.E.-G. and P.C.; supervision, A.A., H.R. and T.T. All authors have read and agreed to the published version of the manuscript.

Funding

This research was funded by the Estonian University of Life Sciences projects (base funding P170185, development fund PM180258) and the European Union’s European Regional Development Fund (Estonian University of Life Sciences ASTRA project “Value-chain based bio-economy”). This research was supported by the European Social Fund’s Dora Plus Programme.

Institutional Review Board Statement

Not applicable.

Informed Consent Statement

Not applicable.

Data Availability Statement

The data presented in this study are available on request from the corresponding author.

Acknowledgments

The authors would like to thank Alex Boon of Soil Science Editing for editing a draft of this manuscript.

Conflicts of Interest

The authors declare no conflict of interest.

References

  1. Xu, R.; Tian, H.; Pan, S.; Prior, S.A.; Feng, Y.; Batchelor, W.D.; Chen, J.; Yang, J. Global ammonia emissions from synthetic nitrogen fertilizer applications in agricultural systems: Empirical and process-based estimates and uncertainty. Glob. Chang. Biol. 2019, 25, 314–326. [Google Scholar] [CrossRef] [PubMed] [Green Version]
  2. Sanchis, E.; Calvet, S.; Galán, E.; Estellés, F. Meta-analysis of environmental effects on gaseous emissions from dairy cattle houses. Biosyst. Eng. 2019, 178, 176–183. [Google Scholar] [CrossRef]
  3. Steinfeld, H.; Gerber, P.; Wassenaar, T.; Castel, V.; Rosales, M.; Haan, C.D. Livestock’s Long Shadow—Environmental Issues and Options; Food and Agriculture Organization of the United Nations: Rome, Italy, 2006; ISBN 9789251055717. [Google Scholar]
  4. Sommer, S.G.; Petersen, S.O.; Søgaard, H.T. Greenhouse Gas Emission from Stored Livestock Slurry. J. Environ. Qual. 2000, 29, 744–751. [Google Scholar] [CrossRef]
  5. Groenestein, C.M.; Smits, M.C.J.; Huijsmans, J.F.M.; Oenema, O. Measures to Reduce Ammonia Emissions from Livestock Manures: Now, Soon and Later. Available online: https://edepot.wur.nl/189371 (accessed on 25 August 2020).
  6. Behera, S.N.; Sharma, M.; Aneja, V.P.; Balasubramanian, R. Ammonia in the atmosphere: A review on emission sources, atmospheric chemistry and deposition on terrestrial bodies. Environ. Sci. Pollut. Res. 2013, 20, 8092–8131. [Google Scholar] [CrossRef] [PubMed]
  7. Krupa, S.V. Effects of atmospheric ammonia (NH3) on terrestrial vegetation: A review. Environ. Pollut. 2003, 124, 179–221. [Google Scholar] [CrossRef]
  8. Ti, C.; Xia, L.; Chang, S.X.; Yan, X. Potential for mitigating global agricultural ammonia emission: A meta-analysis. Environ. Pollut. 2018, 245, 141–148. [Google Scholar] [CrossRef] [PubMed]
  9. Erisman, J.W.; Bleeker, A.; Hensen, A.; Vermeulen, A. Agricultural air quality in Europe and the future perspectives. Atmos. Environ. 2008, 42, 3209–3217. [Google Scholar] [CrossRef] [Green Version]
  10. Kai, P.; Pedersen, P.; Jensen, J.E.; Hansen, M.N.; Sommer, S.G. A whole-farm assessment of the efficacy of slurry acidification in reducing ammonia emissions. Eur. J. Agron. 2008, 28, 148–154. [Google Scholar] [CrossRef]
  11. Sørensen, P.; Amato, M. Remineralisation and residual effects of N after application of pig slurry to soil. Eur. J. Agron. 2002, 16, 81–95. [Google Scholar] [CrossRef]
  12. Perazzolo, F.; Mattachini, G.; Tambone, F.; Calcante, A.; Provolo, G. Nutrient losses from cattle co-digestate slurry during storage. J. Agric. Eng. 2016, 47, 94–99. [Google Scholar] [CrossRef] [Green Version]
  13. Brockmann, D.; Hanhoun, M.; Négri, O.; Hélias, A. Environmental assessment of nutrient recycling from biological pig slurry treatment—Impact of fertilizer substitution and field emissions. Bioresour. Technol. 2014, 163, 270–279. [Google Scholar] [CrossRef] [PubMed]
  14. Galloway, J.N.; Aber, J.D.; Erisman, J.W.; Seitzinger, S.P.; Howarth, R.; Cowling, E.B.; Cosby, B.J. The Nitrogen Cascade. BioScience 2003, 53, 341. [Google Scholar] [CrossRef]
  15. Carozzi, M.; Ferrara, R.M.; Rana, G.; Acutis, M. Evaluation of mitigation strategies to reduce ammonia losses from slurry fertilisation on arable lands. Sci. Total Environ. 2013, 449, 126–133. [Google Scholar] [CrossRef] [PubMed]
  16. Rodhe, L.; Casimir, J.; Sindhöj, E. Possibilities and Bottlenecks for Implementing Slurry Acidification Techniques in the Baltic Sea Region (revised). Available online: http://balticslurry.eu/wp-content/uploads/2016/06/Report-2.1-Possibilities-and-bottlenecks-REVISED.pdf (accessed on 7 June 2020).
  17. Stenglein, R.; Clanton, C.; Schmidt, D.; Jacobson, L.; Janni, K. Covers for Mitigating Odour and Gas Emissions in Animal Agriculture: An Overview [Fact sheet]. Available online: http://www.extension.org/sites/default/files/CoversoverviewFINAL_0.pdf (accessed on 23 August 2020).
  18. Viguria, M.; Sanz-Cobeña, A.; López, D.M.; Arriaga, H.; Merino, P. Ammonia and greenhouse gases emission from impermeable covered storage and land application of cattle slurry to bare soil. Agric. Ecosyst. Environ. 2015, 199, 261–271. [Google Scholar] [CrossRef]
  19. Madejováa, J.; Jankovič, Ľ.; Slaný, M.; Hronský, V. Conformation heterogeneity of alkylammonium surfactants self-assembled on montmorillonite: Effect of head-group structure and temperature. Appl. Surf. Sci. 2020, 503, 144125. [Google Scholar] [CrossRef]
  20. Ndegwa, P.M.; Hristov, A.N.; Arogo, J.; Sheffield, R.E. A review of ammonia emission mitigation techniques for concentrated animal feeding operations. Biosyst. Eng. 2008, 100, 453–469. [Google Scholar] [CrossRef]
  21. Andersen, D.; Harmon, J.; Hoff, S.; Rieck-Hinz, A. Manure Storages—Impermeable Covers Overview [Fact sheet]. Available online: www.agronext.iastate.edu/ampat (accessed on 17 June 2020).
  22. Thorman, R.E.; Webb, J.; Yamulki, S.; Chadwick, D.R.; Bennett, G.; McMillan, S.; Kingston, H.; Donovan, N.; Misselbrook, T.H. The effect of solid manure incorporation on nitrous oxide emissions. In Proceedings of the 13th International Conference of the FAO RAMIRAN: Potential for Simple Technology Solutions in Organic Manure Management; Ambrozia NT Ltd.: Albena, Bulgaria, 2008; pp. 170–175. [Google Scholar]
  23. Loide, V.; Saue, T.; Võsa, T.; Tamm, K. The effect of acidified slurry on crop uptake and leaching of nutrients from a loamy topsoil. Acta Agric. Scand. Sect. B Soil Plant Sci. 2020, 70, 31–38. [Google Scholar] [CrossRef]
  24. Misselbrook, T.; Hunt, J.; Perazzolo, F.; Provolo, G. Greenhouse gas and ammonia emissions from slurry storage: Impacts of temperature and potential mitigation through covering (pig slurry) or acidification (cattle slurry). J. Environ. Qual. 2016, 45, 1520–1530. [Google Scholar] [CrossRef]
  25. Yoon, H.; Lim, J.H.; Chung, H.K. Ammonia removal model based on the equilibrium and mass transfer principles. Bull. Korean Chem. Soc. 2008, 29, 555–561. [Google Scholar] [CrossRef] [Green Version]
  26. Carew, R. Ammonia emissions from livestock industries in Canada: Feasibility of abatement strategies. Environ. Pollut. 2010, 158, 2618–2626. [Google Scholar] [CrossRef]
  27. Hartung, J.; Phillips, V.R. Control of Gaseous Emissions from Livestock Buildings and Manure Stores. J. Agric. Eng. Res. 1994, 57, 173–189. [Google Scholar] [CrossRef]
  28. Fangueiro, D.; Hjorth, M.; Gioelli, F. Acidification of animal slurry—A review. J. Environ. Manag. 2015, 149, 46–56. [Google Scholar] [CrossRef] [PubMed]
  29. Kavanagh, I.; Burchill, W.; Healy, M.G.; Fenton, O.; Krol, D.J.; Lanigan, G.J. Mitigation of ammonia and greenhouse gas emissions from stored cattle slurry using acidifiers and chemical amendments. J. Clean. Prod. 2019, 237, 117822. [Google Scholar] [CrossRef]
  30. Maurer, D.L.; Koziel, J.A.; Harmon, J.D.; Hoff, S.J.; Rieck-Hinz, A.M.; Andersen, D.S. Summary of performance data for technologies to control gaseous, odor, and particulate emissions from livestock operations: Air management practices assessment tool (AMPAT). Data Br. 2016, 7, 1413–1429. [Google Scholar] [CrossRef] [Green Version]
  31. Sohi, S.; Lopez-Capel, E.; Krull, E.; Bol, R. Biochar, Climate Change and Soil: A Review to Guide Future Research. CSIRO L. Water Rep. 2009, 64. [Google Scholar] [CrossRef]
  32. Xiao, X.; Chen, B.; Chen, Z.; Zhu, L.; Schnoor, J.L. Insight into Multiple and Multilevel Structures of Biochars and Their Potential Environmental Applications: A Critical Review. Environ. Sci. Technol. 2018, 52, 5027–5047. [Google Scholar] [CrossRef]
  33. Li, S.; Barreto, V.; Li, R.; Chen, G.; Hsieh, Y.P. Nitrogen retention of biochar derived from different feedstocks at variable pyrolysis temperatures. J. Anal. Appl. Pyrolysis 2018, 133, 136–146. [Google Scholar] [CrossRef]
  34. Saarnio, S.; Räty, M.; Hyrkäs, M.; Virkajärvi, P. Biochar addition changed the nutrient content and runoff water quality from the top layer of a grass field during simulated snowmelt. Agric. Ecosyst. Environ. 2018, 265, 156–165. [Google Scholar] [CrossRef]
  35. Maurer, D.L.; Koziel, J.A.; Kalus, K.; Andersen, D.S.; Opalinski, S. Pilot-scale testing of non-activated biochar for swine manure treatment and mitigation of ammonia, hydrogen sulfide, odorous volatile organic compounds (VOCs), and greenhouse gas emissions. Sustainability 2017, 9. [Google Scholar] [CrossRef] [Green Version]
  36. Feng, Y.; Sun, H.; Xue, L.; Liu, Y.; Gao, Q.; Lu, K.; Yang, L. Biochar applied at an appropriate rate can avoid increasing NH3 volatilization dramatically in rice paddy soil. Chemosphere 2017, 168, 1277–1284. [Google Scholar] [CrossRef]
  37. Agyarko-Mintah, E.; Cowie, A.; Van Zwieten, L.; Singh, B.P.; Smillie, R.; Harden, S.; Fornasier, F. Biochar lowers ammonia emission and improves nitrogen retention in poultry litter composting. Waste Manag. 2017, 61, 129–137. [Google Scholar] [CrossRef] [PubMed]
  38. Kizito, S.; Wu, S.; Kipkemoi Kirui, W.; Lei, M.; Lu, Q.; Bah, H.; Dong, R. Evaluation of slow pyrolyzed wood and rice husks biochar for adsorption of ammonium nitrogen from piggery manure anaerobic digestate slurry. Sci. Total Environ. 2015, 505, 102–112. [Google Scholar] [CrossRef] [PubMed]
  39. Sun, H.; Zhang, H.; Xiao, H.; Shi, W.; Müller, K.; Van Zwieten, L.; Wang, H. Wheat straw biochar application increases ammonia volatilization from an urban compacted soil giving a short-term reduction in fertilizer nitrogen use efficiency. J. Soils Sediments 2019, 19, 1624–1631. [Google Scholar] [CrossRef]
  40. Sajjadi, B.; Chen, W.Y.; Egiebor, N.O. A comprehensive review on physical activation of biochar for energy and environmental applications. Rev. Chem. Eng. 2019, 35, 735–776. [Google Scholar] [CrossRef]
  41. Holly, M.A.; Larson, R.A. Thermochemical Conversion of Biomass Storage Covers to Reduce Ammonia Emissions from Dairy Manure. Water. Air. Soil Pollut. 2017, 228. [Google Scholar] [CrossRef]
  42. Peiris, C.; Nayanathara, O.; Navarathna, C.M.; Jayawardhana, Y.; Nawalage, S.; Burk, G.; Karunanayake, A.G.; Madduri, S.B.; Vithanage, M.; Kaumal, M.N.; et al. The influence of three acid modifications on the physicochemical characteristics of tea-waste biochar pyrolyzed at different temperatures: A comparative study. RSC Adv. 2019, 9, 17612–17622. [Google Scholar] [CrossRef] [Green Version]
  43. Bremner, J.M.; Keeney, D.R. Steam distillation methods for determination of ammonium, nitrate and nitrite. Anal. Chim. Acta 1965, 32, 485–495. [Google Scholar] [CrossRef]
  44. FAO Standard Operating Procedure for Soil Calcium Carbonate Equivalent: Titrimetric Method. Available online: http://www.fao.org/3/ca8620en/CA8620EN.pdf (accessed on 13 July 2020).
  45. Niskanen, R.; Mäntylahti, V. Determination of soil specific surface area by water vapor adsorption: II. Dependence of soil specific surface areas on clay and organic carbon content. Agric. Food Sci. 1987, 59, 67–72. [Google Scholar] [CrossRef]
  46. Gámiz, B.; Hall, K.; Spokas, K.A.; Cox, L. Understanding activation effects on low-temperature biochar for optimization of herbicide sorption. Agronomy 2019, 9, 588. [Google Scholar] [CrossRef] [Green Version]
  47. Venterea, R.T.; Parkin, T.B. USDA-ARS GRACEnet Project Protocols Chapter 3. Chamber-Based Trace Gas Flux Measurements 4. Flux 2010, 2010, 1–39. [Google Scholar]
  48. R Foundation for Statistical Computing. R Development Core Team R: A language and environment for statistical computing; R Foundation for Statistical Computing: Vienna, Austria, 2019. [Google Scholar]
  49. Tukey, J.W. Exploratory Data Analysis; Addison-Wesley Publishing Company: Reading, MA, USA, 1977. [Google Scholar]
  50. Dray, S.; Dufour, A.B. The ade4 package: Implementing the duality diagram for ecologists. J. Stat. Softw. 2007, 22, 1–20. [Google Scholar] [CrossRef] [Green Version]
  51. Liu, W.J.; Jiang, H.; Yu, H.Q. Development of Biochar-Based Functional Materials: Toward a Sustainable Platform Carbon Material. Chem. Rev. 2015, 115, 12251–12285. [Google Scholar] [CrossRef] [PubMed]
  52. Mia, S.; Dijkstra, F.A.; Singh, B. Aging Induced Changes in Biochar’s Functionality and Adsorption Behavior for Phosphate and Ammonium. Environ. Sci. Technol. 2017, 51, 8359–8367. [Google Scholar] [CrossRef] [PubMed]
  53. Slaný, M.; Jankovič, Ľ.; Madejová, J. Structural characterization of organo-montmorillonites prepared from a series of primary alkylamines salts: Mid-IR and near-IR study. Appl. Clay Sci. 2019, 176, 11–20. [Google Scholar] [CrossRef]
  54. Chang, R.; Sohi, S.P.; Jing, F.; Liu, Y.; Chen, J. A comparative study on biochar properties and Cd adsorption behavior under effects of ageing processes of leaching, acidification and oxidation. Environ. Pollut. 2019, 254, 113123. [Google Scholar] [CrossRef] [PubMed]
  55. Horikawa, Y.; Hirano, S.; Mihashi, A.; Kobayashi, Y.; Zhai, S.; Sugiyama, J. Prediction of Lignin Contents from Infrared Spectroscopy: Chemical Digestion and Lignin/Biomass Ratios of Cryptomeria japonica. Appl. Biochem. Biotechnol. 2019, 188, 1066–1076. [Google Scholar] [CrossRef]
  56. Cantrell, K.B.; Hunt, P.G.; Uchimiya, M.; Novak, J.M.; Ro, K.S. Impact of pyrolysis temperature and manure source on physicochemical characteristics of biochar. Bioresour. Technol. 2012, 107, 419–428. [Google Scholar] [CrossRef]
  57. Keiluweit, M.; Nico, P.S.; Johnson, M.; Kleber, M. Dynamic molecular structure of plant biomass-derived black carbon (biochar). Environ. Sci. Technol. 2010, 44, 1247–1253. [Google Scholar] [CrossRef] [Green Version]
  58. Oancea, A.; Grasset, O.; Le Menn, E.; Bollengier, O.; Bezacier, L.; Le Mouélic, S.; Tobie, G. Laboratory infrared reflection spectrum of carbon dioxide clathrate hydrates for astrophysical remote sensing applications. Icarus 2012, 221, 900–910. [Google Scholar] [CrossRef]
  59. Coates, J. Interpretation of Infrared Spectra, A Practical Approach. Encycl. Anal. Chem. 2006, 1–23. [Google Scholar] [CrossRef]
  60. Das, D.D.; Schnitzer, M.I.; Monreal, C.M.; Mayer, P. Chemical composition of acid-base fractions separated from biooil derived by fast pyrolysis of chicken manure. Bioresour. Technol. 2009, 100, 6524–6532. [Google Scholar] [CrossRef] [PubMed]
  61. Jiang, W.; Saxena, A.; Song, B.; Ward, B.B.; Beveridge, T.J.; Myneni, S.C.B. Elucidation of functional groups on gram-positive and gram-negative bacterial surfaces using infrared spectroscopy. Langmuir 2004, 20, 11433–11442. [Google Scholar] [CrossRef] [PubMed]
  62. Yang, H.; Yan, R.; Chen, H.; Lee, D.H.; Zheng, C. Characteristics of hemicellulose, cellulose and lignin pyrolysis. Fuel 2007, 86, 1781–1788. [Google Scholar] [CrossRef]
  63. Kinney, T.J.; Masiello, C.A.; Dugan, B.; Hockaday, W.C.; Dean, M.R.; Zygourakis, K.; Barnes, R.T. Hydrologic properties of biochars produced at different temperatures. Biomass Bioenergy 2012, 41, 34–43. [Google Scholar] [CrossRef]
  64. Mao, J.; Zhang, K.; Chen, B. Linking hydrophobicity of biochar to the water repellency and water holding capacity of biochar-amended soil. Environ. Pollut. 2019, 253, 779–789. [Google Scholar] [CrossRef]
  65. García-González, M.C.; Vanotti, M.B.; Szogi, A.A. Recovery of ammonia from swine manure using gas-permeable membranes: Effect of aeration. J. Environ. Manage. 2015, 152, 19–26. [Google Scholar] [CrossRef]
  66. Vithanage, M.; Rajapaksha, A.U.; Zhang, M.; Thiele-Bruhn, S.; Lee, S.S.; Ok, Y.S. Acid-activated biochar increased sulfamethazine retention in soils. Environ. Sci. Pollut. Res. 2015, 22, 2175–2186. [Google Scholar] [CrossRef]
  67. Cibati, A.; Foereid, B.; Bissessur, A.; Hapca, S. Assessment of Miscanthus × giganteus derived biochar as copper and zinc adsorbent: Study of the effect of pyrolysis temperature, pH and hydrogen peroxide modification. J. Clean. Prod. 2017, 162, 1285–1296. [Google Scholar] [CrossRef] [Green Version]
  68. Shi, R.Y.; Ni, N.; Nkoh, J.N.; Li, J.Y.; Xu, R.K.; Qian, W. Beneficial dual role of biochars in inhibiting soil acidification resulting from nitrification. Chemosphere 2019, 234, 43–51. [Google Scholar] [CrossRef]
  69. Ahmed, M.B.; Zhou, J.L.; Ngo, H.H.; Guo, W.; Chen, M. Progress in the preparation and application of modified biochar for improved contaminant removal from water and wastewater. Bioresour. Technol. 2016, 214, 836–851. [Google Scholar] [CrossRef]
  70. Rechberger, M.V.; Kloss, S.; Rennhofer, H.; Tintner, J.; Watzinger, A.; Soja, G.; Lichtenegger, H.; Zehetner, F. Changes in biochar physical and chemical properties: Accelerated biochar aging in an acidic soil. Carbon N. Y. 2017, 115, 209–219. [Google Scholar] [CrossRef]
  71. Shen, W.; Li, Z.; Liu, Y. Surface Chemical Functional Groups Modification of Porous Carbon. Recent Patents Chem. Eng. 2008, 1, 27–40. [Google Scholar] [CrossRef]
  72. Huff, M.D.; Lee, J.W. Biochar-surface oxygenation with hydrogen peroxide. J. Environ. Manage. 2016, 165, 17–21. [Google Scholar] [CrossRef] [PubMed]
  73. Iriarte-Velasco, U.; Sierra, I.; Zudaire, L.; Ayastuy, J.L. Preparation of a porous biochar from the acid activation of pork bones. Food Bioprod. Process. 2016, 98, 341–353. [Google Scholar] [CrossRef]
  74. Petit, C.; Kante, K.; Bandosz, T.J. The role of sulfur-containing groups in ammonia retention on activated carbons. Carbon N. Y. 2010, 48, 654–667. [Google Scholar] [CrossRef]
  75. Ro, K.; Lima, I.; Reddy, G.; Jackson, M.; Gao, B. Removing Gaseous NH3 Using Biochar as an Adsorbent. Agriculture 2015, 5, 991–1002. [Google Scholar] [CrossRef] [Green Version]
  76. Chadwick, D.; Sommer, S.; Thorman, R.; Fangueiro, D.; Cardenas, L.; Amon, B.; Misselbrook, T. Manure management: Implications for greenhouse gas emissions. Anim. Feed Sci. Technol. 2011, 166–167, 514–531. [Google Scholar] [CrossRef]
  77. Soliman, M.; Eldyasti, A. Ammonia-Oxidizing Bacteria (AOB): Opportunities and Applications—A review; Springer: Dordrecht, The Netherlands, 2018; Volume 17, ISBN 1115701894. [Google Scholar] [CrossRef]
  78. Šimek, M.; Jíšová, L.; Hopkins, D.W. What is the so-called optimum pH for denitrification in soil? Soil Biol. Biochem. 2002, 34, 1227–1234. [Google Scholar] [CrossRef]
  79. Kupper, T.; Häni, C.; Neftel, A.; Kincaid, C.; Bühler, M.; Amon, B.; VanderZaag, A. Ammonia and greenhouse gas emissions from slurry storage—A review. Agric. Ecosyst. Environ. 2020, 300, 106963. [Google Scholar] [CrossRef]
  80. Lan, Z.M.; Chen, C.R.; Rashti, M.R.; Yang, H.; Zhang, D.K. Stoichiometric ratio of dissolved organic carbon to nitrate regulates nitrous oxide emission from the biochar-amended soils. Sci. Total Environ. 2017, 576, 559–571. [Google Scholar] [CrossRef]
  81. Wu, K.; Li, Y.; Liu, T.; Huang, Q.; Yang, S.; Wang, W.; Jin, P. The simultaneous adsorption of nitrate and phosphate by an organic-modified aluminum-manganese bimetal oxide: Adsorption properties and mechanisms. Appl. Surf. Sci. 2019, 478, 539–551. [Google Scholar] [CrossRef]
  82. Fidel, R.B.; Laird, D.A.; Spokas, K.A. Sorption of ammonium and nitrate to biochars is electrostatic and pH-dependent. Sci. Rep. 2018, 8, 1–10. [Google Scholar] [CrossRef] [PubMed]
  83. Alsewaileh, A.S.; Usman, A.R.; Al-Wabel, M.I. Effects of pyrolysis temperature on nitrate-nitrogen (NO3−-N) and bromate (BrO3−) adsorption onto date palm biochar. J. Environ. Manage. 2019, 237, 289–296. [Google Scholar] [CrossRef] [PubMed]
Figure 1. Schematic of the experimental set-up.
Sustainability 13 00837 g001
Figure 2. NH3-N emissions (mean ± standard error) during 0–48 h and from the 7th to 8th day after the application of pure acids (A), untreated and acidified biochar mixed in the digestate (B) and untreated and acidified biochar applied on the digestate surface (C). Control without conditioner; H2O2, H2SO4 and H3PO4 pure-form acids applied mixed to digestate; BC: biochar; BC + H2O2, BC + H2SO4 and BC + H3PO4 represent BC acidified with the respective acid; BCm indicates that the BC was mixed into the digestate, and BCs indicates that the BC was applied on the digestate surface. Asterisks indicate the level of significant differences between treatments. **** p < 0.0001; *** p < 0.001; ** p < 0.01; * p < 0.05. A lack of * symbols indicates significance at p < 0.1.
Sustainability 13 00837 g002
Figure 3. Cumulative NH3-N emissions for 0–48 h from conditioner application (mean ± standard error (n = 3). Results marked with different lowercase letters are statistically different. Control without conditioner; H2O2, H2SO4 and H3PO4 pure-form acids applied mixed to digestate; BC: biochar; BC + H2O2, BC + H2SO4 and BC + H3PO4 are BC acidified with the respective acid; BCm indicates that the BC was mixed into the digestate, and BCs indicates that the BC was applied on the digestate surface.
Sustainability 13 00837 g003
Figure 4. NH3-N emissions from pure acids, untreated and acidified BCm treatments depending on digestate pH (n = 3). Control without conditioner; H2O2, H2SO4 and H3PO4 pure-form acids applied mixed with digestate; BC: biochar; BC + H2O2, BC + H2SO4 and BC + H3PO4 are BC acidified with the respective acid; BCm indicates that the BC was mixed with the digestate.
Sustainability 13 00837 g004
Figure 5. Concentration of NH4+-N, NO3-N and Ntot (mean ± standard error; n = 3) in the digestate 30 days after conditioner addition. Results marked with different lowercase letters are statistically different. Control without conditioner; H2O2, H2SO4 and H3PO4 pure-form acids applied mixed to digestate; BC: biochar; BC + H2O2, BC + H2SO4 and BC + H3PO4 represent BC acidified with the respective acid; BCm indicates that the BC was mixed with the digestate, and BCs indicates that the BC was applied to the digestate surface.
Sustainability 13 00837 g005
Figure 6. FTIR spectra of untreated and acidified BC with identified functional groups [55,56,57,58,59,60,61,62]. BC: biochar; BC + H2O2, BC + H2SO4 and BC + H3PO4 represent BC acidified with the respective acid.
Sustainability 13 00837 g006
Table 1. Experimental treatment abbreviations and description. BC: biochar.
AbbreviationTreatment description
ControlDigestate
BCmUntreated BC mixed into digestate
BCsUntreated BC on the digestate surface
BCm + H2SO4BC treated with sulfuric acid mixed into digestate
BCs + H2SO4BC treated with sulfuric acid on the digestate surface
BCm + H3PO4BC treated with phosphoric acid mixed into digestate
BCs + H3PO4BC treated with phosphoric acid on the digestate surface
BCm + H2O2BC treated with hydrogen peroxide mixed into digestate
BCs + H2O2BC treated with hydrogen peroxide on the digestate surface
H2SO4Sulfuric acid mixed into digestate
H3PO4Phosphoric acid mixed into digestate
H2O2Hydrogen peroxide mixed into digestate
Table 2. Characteristics of digestate, untreated and acid-treated BC.
ParameterDigestateBCBC + H2SO4BC + H3PO4BC + H2O2
pH8.26.401.552.654.80
Specific surface area, m2 g−1-126.14161.48145.92166.31
Acid neutralization capacity (CaCO3, %)-3.800.000.493.86
Dry matter (%)4.06100100100100
Ctot (%)40.3750.2951.1853.5751.77
Ntot (%)6.872.792.812.962.85
C/N5.8818.0318.2218.1018.16
NH4+-N (mg kg−1)46,39080400230220
NO3-N (mg kg−1)352060809080
Table 3. NH3-N emissions during 0–48 h as influenced by conditioner, application method and time passed since conditioner application (ANOVA analysis; n = 3). Asterisks indicate the level of significance. **** p < 0.0001; *** p < 0.001; ** p < 0.01; * p < 0.05. A lack of * symbols indicates significance at p < 0.1.
FactorDfSum Sq.Mean Sq.F ValuePr(>F)R2ω2Sig
BC14847.7046.1271.07 × 10−110.00390.0038***
BC application method1251251.33243.025<2 × 10−160.02070.2066***
Acids320668.6866.411<2 × 10−160.01700.0167***
Time passed2874461.551.5021.60 × 10−70.03680.0122***
BC:acids310133.8032.686<2 × 10−160.00830.0081***
BC application method:acids310434.7233.573<2 × 10−160.00860.0083***
BC:time passed2874391.531.4784.85 × 10−70.03620.0117***
BC application method:time passed2873741.301.2620.0021650.03090.0064**
Acid:time passed86110871.261.2212.86 × 10−50.08970.0162***
BC:acid:time passed86110691.241.2000.0001210.08820.0147***
BC application method:acids:time passed8618380.970.9410.8793990.06910.0000
Residuals691271481.03
Publisher’s Note: MDPI stays neutral with regard to jurisdictional claims in published maps and institutional affiliations.

