Article

Will Transaction Costs and Economies of Scale Tip the Balance in Farm Size in Industrial Agriculture? An Illustration for Non-Food Biomass Production in Germany

by
Lanjiao Wen
1,2 and
Lioudmila Chatalova
1,*
1
Leibniz Institute of Agricultural Development in Transition Economies (IAMO), 06120 Halle, Germany
2
College of Land Management, Huazhong Agricultural University, Wuhan 430070, China
*
Author to whom correspondence should be addressed.
Sustainability 2021, 13(2), 733; https://doi.org/10.3390/su13020733
Submission received: 30 November 2020 / Revised: 8 January 2021 / Accepted: 10 January 2021 / Published: 13 January 2021

Abstract

:
The study investigates how the agricultural sector can respond to a growing non-food biomass demand. Taking Germany as an example, a stylized case of biomass production under conditions of technological advance and constantly growing demand is modelled. It is argued that biomass producers might seek to adjust their farm size by simultaneously optimizing benefits from the production scale and transaction cost savings, where transaction costs are measured using Data Envelopment Analysis. The results extend the debate on transaction costs and structural change in agriculture by revealing a possible synergy and trade-off between transaction cost savings and benefits from (dis)economies of scale. They show that if larger farms cannot economize on transaction costs, then investments in land and labor, needed to adjust to higher biomass demand, partly compromise the returns to scale, which decelerates the farm size growth. A higher degree of asset specificity gives rise to transaction costs and reduces the rate at which the farm size decreases. Smaller producers may disproportionally benefit from their higher potential of transaction cost savings, if advanced technologies can offset the scale advantage of larger farms. The findings inform policymakers to consider this complex effect when comparing the opportunities of smaller and larger agricultural producers in the bioeconomy.

1. Introduction

Since the industrial and agricultural revolutions, the rise in productivity and competition have kept the agricultural sectors moving towards fewer but bigger farms [1,2,3]. Scaling up farm size has become one of the primary means of reducing production and transaction costs and realizing economies of scale [4,5]. Large-scale farming, with its relatively high cost-saving potential, is still tantamount to an efficient form of industrial agriculture [6]. However, the recent spate of instances of diseconomies of scale in large farms in a number of developed countries indicate an increasingly exhausted cost reduction potential in competitive industrial agriculture [7,8]. The ever-thinner profit margins of agricultural producers due to price and cost competition may force producers in the near future to develop new optimization strategies, in which transaction cost reduction can become increasingly relevant. In the context of the current transition to the bioeconomy, which not only relies on a sufficient supply of plant biomass, but also on smaller producers as important promoters of sustainability and innovations [9], the optimization of agricultural transaction costs may additionally be challenged by the question of the optimal production scale.
The initiated transition to a sustainable bio-based economy is a key component of the so-called fourth industrial revolution [10,11,12]. It promises to equip the agricultural sector to deal with the unremitting pressure from structural change and changing social expectations [4,13,14]. National and supranational bioeconomy strategies and action plans assign the agricultural sector (along with forestry) as key to the development of bio-based alternatives to existing products and materials [4,15]. The involvement of agricultural producers in non-food biomass production, sustainable practices, new values and supply chains and the circular economy is expected not only to benefit the environment, but create new jobs in rural areas, support smaller farms and stimulate new businesses [11,16,17].
In industrial and technologically leading countries like Germany, domestic production of non-food biomass might under certain conditions help reduce the high raw material imports [18] and create opportunities for agricultural producers [19,20]. It can provide new income sources when policy support to agriculture and crop-based energy production will be reduced or phased out [21]. Technical and biotechnological advances might lower the labor, fertilizer and transaction costs, as well as facilitate value chain integration through cascading or circular resource utilization [22,23]. Affordable technological innovations [24,25], which allow attaining approximately the same proportion of output or labor input for all farms, if broadly implemented, could improve the profitability and competitiveness of smaller businesses [26]. However, even under such beneficial conditions, a noticeable increase in non-food biomass supply would be only possible at the expense of structural implications for the sector [27].
The German agricultural sector is already confronted with a limited amount of arable land, high labor costs and changing societal expectations towards sustainable agriculture. Its involvement in large-scale production of non-food biomass can open new opportunities for farmers, but it can also accelerate the pace of structural change [27]. In the reunified Germany, the 30% drop in the number of agricultural enterprises in 1991–1999 slowed down to 12.7% in 2003 and to 3.4% in 2016 [28,29]. In 2005–2019, the number of farms decreased by 32%, while the average farm size grew at almost the same rate [30]. However, the pace of the farm number decline has been slowed down [31]. In eastern Germany, characterized by larger farm structures, the number of farms even began to slightly rise since 2005 [32]. Admittedly, this increase amounted to only 1.2% in 2005–2014 and was mainly due to spin-offs from large companies, demergers and transformations [7,33], and not due to small farms’ adjustments and flexibility [10,34]. Only one fifth of the statistically new companies were real start-ups. The share of agricultural employment in total employment declined steadily from 3.5% in 1991 to 1.17% in 2020 [11]. While the number of agricultural jobs rose by 5.3% in 2005–2007 and by 10.4% in 2007–2010, it decreased again to 4.1% in 2010–2013 and to 6.5% in 2013–2016 [30].
To open opportunities for smaller, new and sustainability-oriented producers in general and at the same time increase supply of agricultural biomass, the current trend in farms size might need to be halted [35,36]. To this end, the marginal costs of smaller farms should decline below the average production costs [37,38]. Alternatively, or additionally, larger producers should experience noticeable diseconomies of scale [8,39]. In fact, smaller farms can better economize on certain transaction costs, benefitting from their higher flexibility and lower supervision costs [8], local infrastructural advantages [40] or a better access to some factor markets [33]. They also can potentially benefit from a growing demand for non-fossil resources [41] and the vertical integration into the bioeconomy [20,42]. In eastern Germany, for example, the Central European Chemical Network, the BioEconomy Cluster and a number of local biotech initiatives might integrate biomass producers in a circular economy and create new jobs in the agricultural sector and processing industries [43,44]. However, infrastructural conditions in rural areas, including geographical proximity to suppliers, buyers and processors, and imperfect factor markets, usually offset the advantages of the lower supervision costs of smaller producers [40,45].
This effect can be counteracted by implementation of product and process innovations that are neutral to scale or that increasingly replace human labor [22,46]. Such technologies, if affordable, may reduce either the variable costs of the labor and input factors (such as high yielding, draught-resistant varieties or highly effective pesticides) or fixed cost (e.g., expensive combine harvesters or milking parlors). If their application makes marginal costs decline below the average costs, the scale at which a farm can be run efficiently will decrease as well. The resulting diseconomies of scale might encourage larger farms to reduce their production scale by spinning-off parts of their operations [9]. In fact, the number of very large agricultural enterprises declined in Germany between 1999 and 2013, not least due to deliberate divestments [32]. These developments suggest that transaction costs, (dis-)economies of scale and their combined effects may play a critical role in assessing the opportunities of agricultural producers in the bioeconomy.
Against this background, this study sets out to examine the combined effect of transaction costs and economies of scale on agricultural production decisions. This question is put in the context of two main policy paths towards the bioeconomy: continuing technological advances and the shift from fossil to biomass resources. Two stylized scenarios of agricultural biomass production in Germany are developed, namely the adoption of neutral-to-scale technologies and the growing demand for plant-based biomass. The second scenario is further divided into three subcases to address the average sectoral-, regional- and farm-type-specific implications. The selected study design aims not at assessing the effectiveness of the transition to the bioeconomy and of related policies [47,48], but at understanding the endogeneity between the transaction costs and economies of scale. From this novel perspective, this study seeks to contribute to the debate on agricultural transaction costs and agricultural structural change.
The next section outlines the conceptual framework of the study. Then, the model, data and scenarios are introduced. The results are summarized and discussed before the conclusions and implications for policy and research are derived.

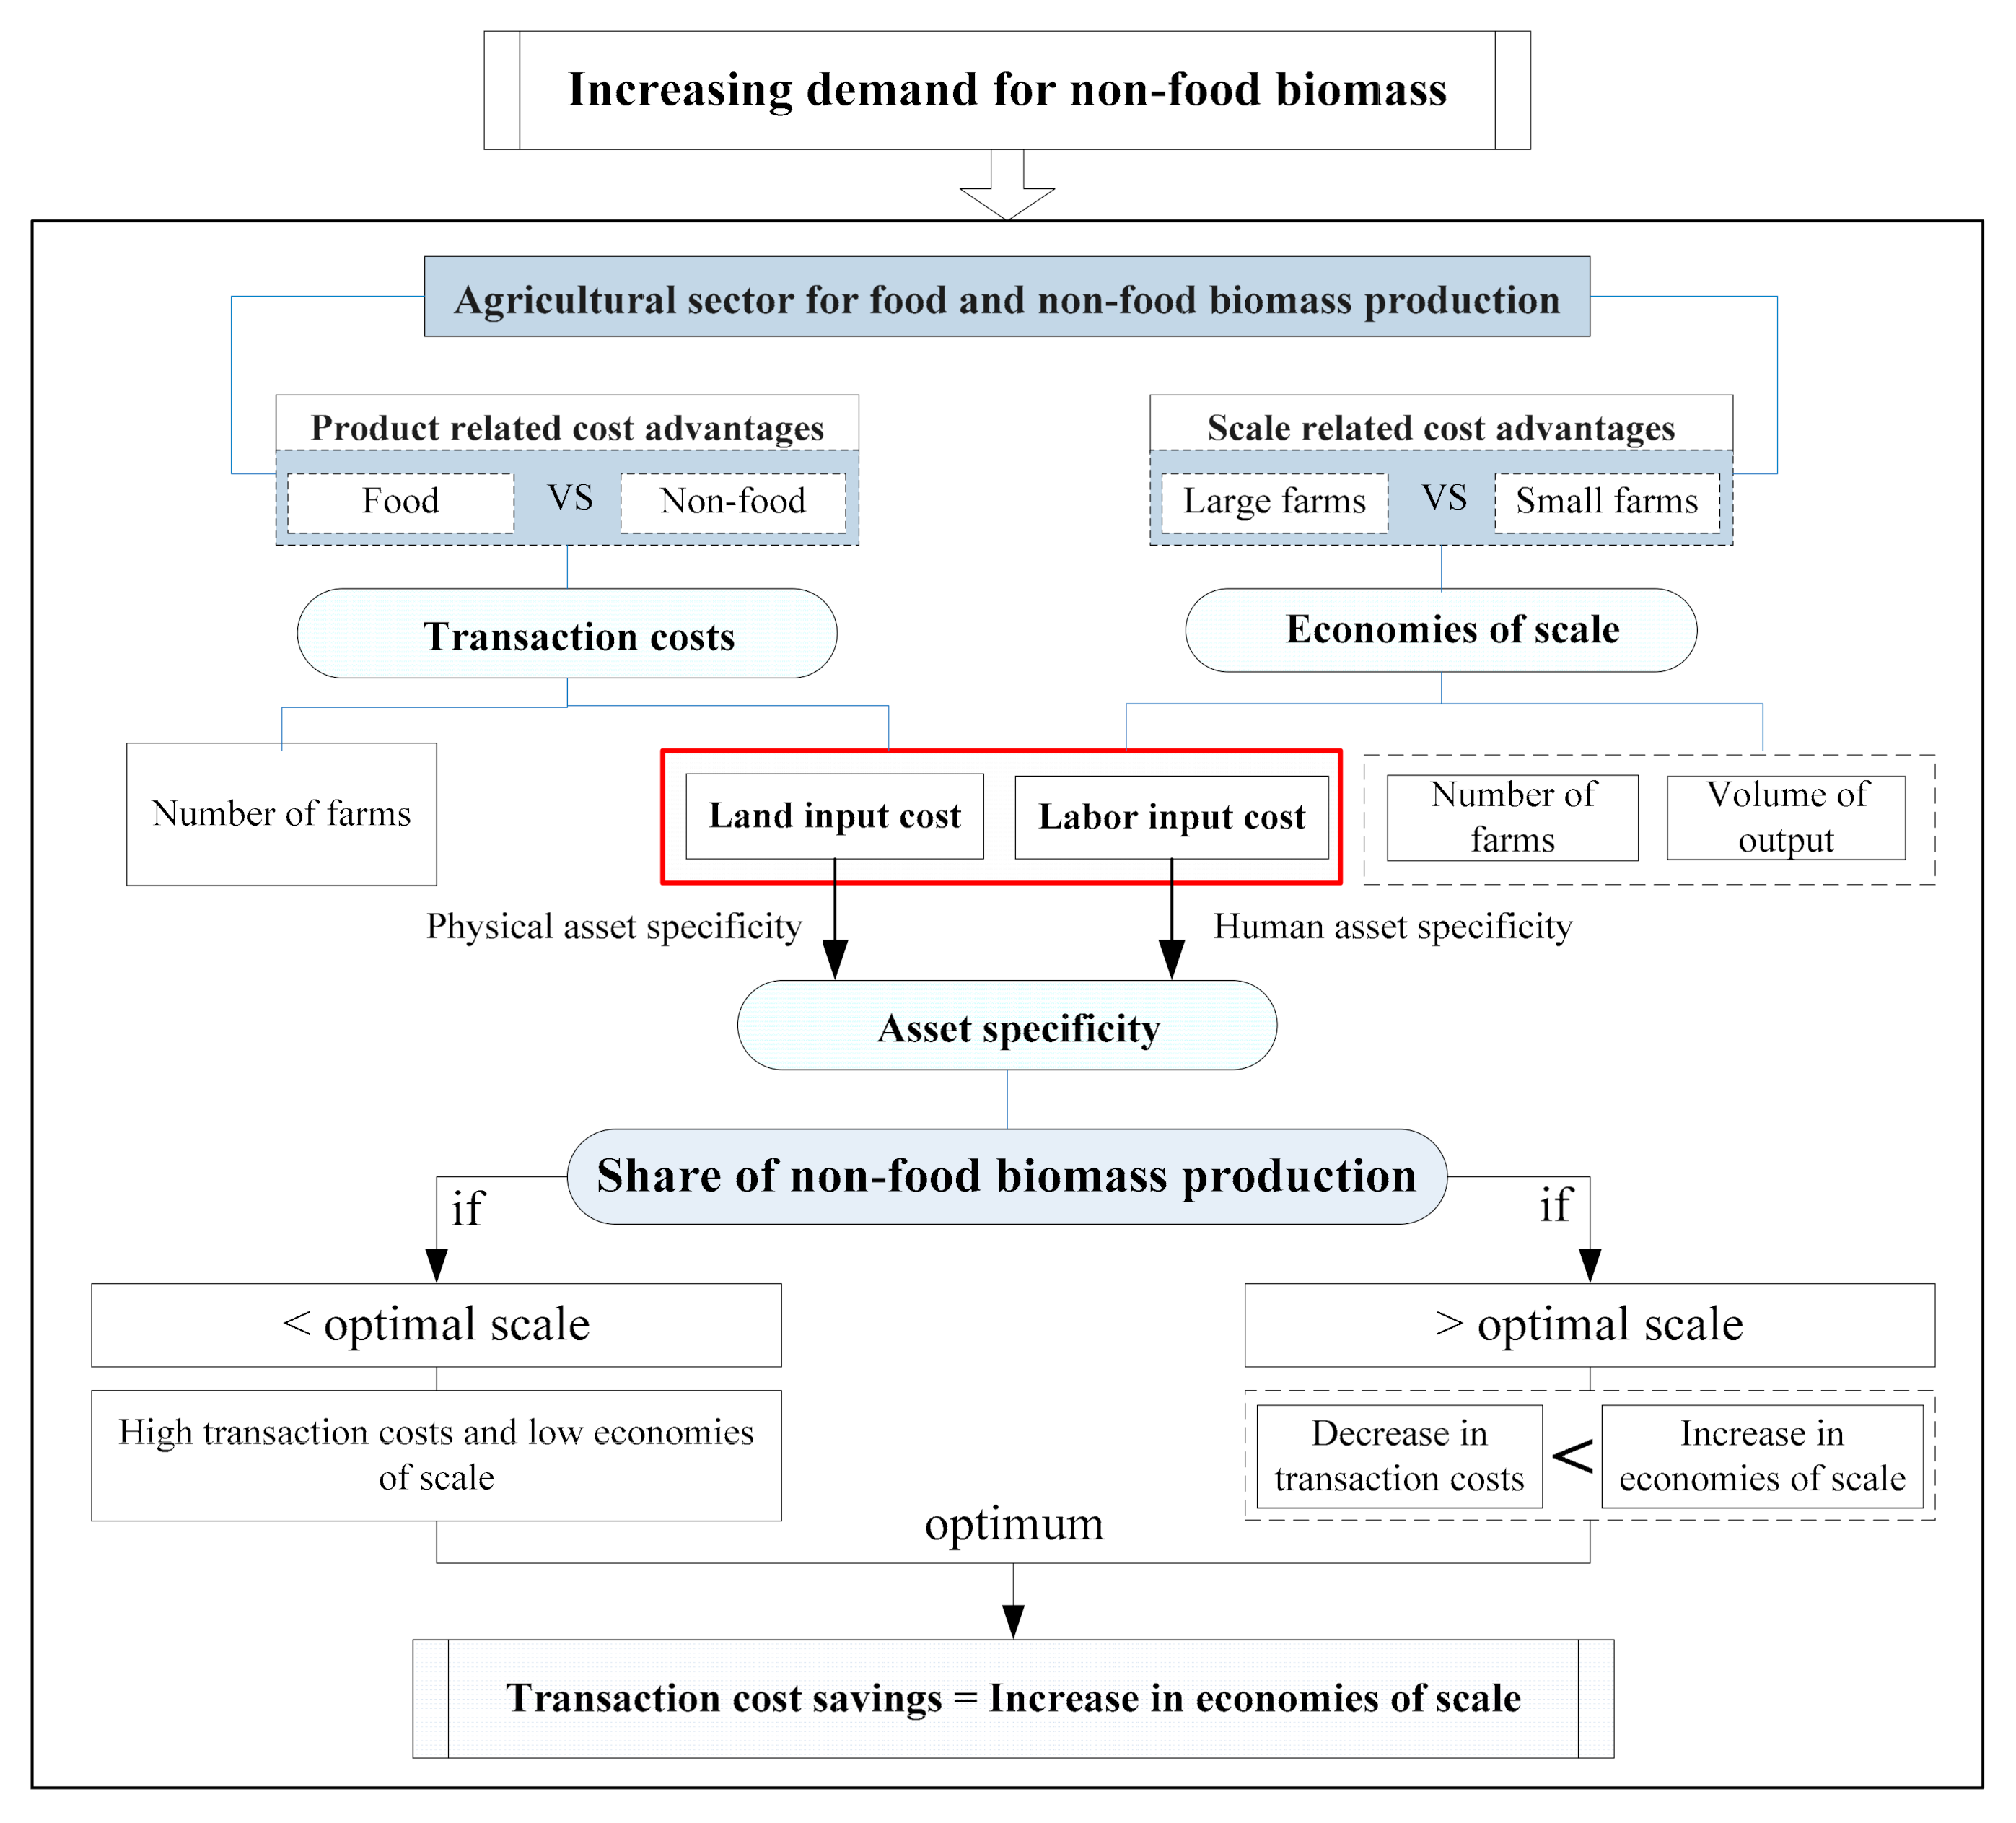
2. Conceptual Framework: Combining Arguments of Transaction Costs and Production Scale

Transaction costs, originally defined by Coase [49,50], are the costs of coordinating (that is, of monitoring, controlling, and managing) economic transactions [51]. Williamson elaborated Coase’s argument further into a theory of transaction costs. Drawing on Arrow [52], he defined these costs as the costs of running the economic system of firms [53]. The main tenet of the transaction costs theory is that costs, and not revenues, are the main determinants of the optimization decision and transaction costs are as important for efficiency as production costs. From this perspective, the optimal organizational structure (and consequently also the optimal scale of operation) is the one that achieves economic efficiency by minimizing transaction costs [54,55]. The latter may vary depending on the transaction frequency, the level of uncertainty, and especially on the asset specificity associated with the degree of the asset’s redeploy ability [56].
Although the relevance of transaction costs for assessing agricultural transactions and related policy options is increasingly advocated [57,58,59], the combined effect of economies of scale and transaction costs has hardly been investigated (few exceptions are, e.g., [6,60]). This is all the more surprising that economies of scale and asset specificity can significantly affect agricultural efficiency [61,62]. Furthermore, specificity of human (e.g., skilled producers) or physical assets (e.g., farmland) can restrict economies of scale and a firm’s growth [63]. In the ongoing discussions over agricultural biomass, there is growing evidence that both transaction costs and economies of scale are good predictors of organizational form [64]. In view of the possible rise in demand for agricultural non-food biomass and the ever-decreasing potential for production costs reduction in competitive industrial agriculture, transaction costs may grow in importance [6,26].
The interaction between economies of scale and transaction costs is complex, not least because of the non-convexities of both functions and the possible U-shape of the transaction costs function in asset specificity [65,66,67]. Recent studies outside the agricultural context suggest that economies of scale mediate the influence of asset specificity on transaction costs [66,68,69]. Specifically, if assets involved in certain transactions are not characterized by high specificity, increasing economies of scale can help economize on a larger share of the transaction costs [70]. Vice versa, a decrease in the total transaction costs positively affects economies of scale [71], which indicates an inverse relationship.
In the present study, transaction costs are defined as the costs (and hence the inefficiency) of structural adjustments due to the engagement of agricultural producers in non-food biomass production (Figure 1). In order to lay bare the interaction mechanism of transaction costs and economies of scale as a combined effect on the optimization decision in highly competitive industrial agriculture, the analysis framework is deliberately reduced. Two types of asset specificities, human and physical asset specificities, which can significantly affect both production and transaction costs and as a result also the economies of scale [72], are considered. Thus, it excludes a number of important factors, such as price, volatility, competing land use, etc., which necessarily would influence this mechanism. In this stylized setting, non-food biomass producers optimize the scale of operations by trying to economize on transaction costs and improve production efficiency. The optimal farm size at the minimum transaction costs depends on the costs associated with the inability to run equipment below a certain labor input [45,54]. This implies that, in the case of diseconomies of scale, an increase in production costs can offset the benefits from the transaction cost savings associated with changes in asset specificity.
Farmland as a fixed asset and specialized labor present assets with relatively high specificity. The interaction between transaction costs and economies of scale is reflected by the marginal input of these factors. The more land and labor are involved in non-food biomass production, the higher the transaction costs. This raises the average costs per unit of product, lowering the economies of scale [73]. At the sectoral level, the optimal share of non-food biomass production will therefore depend on the balance between the actual operation scale and the optimal scale, which is relevant to the transaction cost-economizing effect of farms [74]. The optimal scale is determined by the transaction costs saved by shifting to non-food biomass production and production cost under the resultant economies of scale. If farms operate below the optimal scale, there still are the transaction costs associated, for instance, with information searching or contracting. By contrast, if the operation scale exceeds the optimal scale, the decrease in transaction costs is smaller than the increase in economies of scale. Optimality is reached when the reduced transaction costs equals the benefits from the economies of scale. Thus, transaction costs reflect the changes in farmland and labor allocation and measure the inefficiency of agricultural structures adjusting to the increasing demand for non-food biomass [75].
Based on the above considerations, two assumptions are put forward. First, the share of non-food biomass production will not reduce the transaction costs until the resulting economies of scale equal the transaction costs saved (ceteris paribus). Second, the optimal solution set for the transaction costs is one that maximizes the benefits from economies of scale (ceteris paribus).

3. Methodology

3.1. The Model

A stylized model of an economy consisting of an external biomass demand and an aggregated non-food biomass output produced by agricultural farms is developed. Farms use land and labor according to a Cobb–Douglas production function and try to optimize their economic performance by minimizing transaction costs. Transaction costs (TCt) are defined as a function of the economies of scale (Et), asset specificity (At) and the shift parameter (Rt,):
T C t = f E t , A t , R t
with T C t E t < 0 , T C t E t > 0 , T C t A t > 0 , and T C t R t > 0 .
The shift parameter denotes the relative number of farms that switch from food to non-food production. The economic performance of non-food biomass producers Yt is measured in terms of their revenues and is a function of the transaction costs incurred:
Y t = g T C t
with d Y t   d T C t < 0 , Y t E t = Y t T C t T C t E t > 0 , Y t A t = Y t T C t T C t A t < 0 , Y t R t = Y t T C t T C t R t < 0 .
Economies of scale (Et), which reflects the reduction in production costs in response to output increase, and hence the input–output relationship, can formally be described as a function of the farmland (St) and labor (Lt) involved in non-food biomass production. Asset specificity (At) is a function of land and labor that is invested to improve the production efficiency of non-food biomass production. Given that the amount of labor on each farm is constant, the shift rate (Rt) is positively correlated with labor. Consequently, the change in transaction costs results from the effect of the economies of scale on the net production costs (cf. Riordan and Williamson, 1985). Because this effect is determined by the trade-off between the (dis)economies of scale and the change in asset specificity, the transaction costs are a function of land, labor and the shift parameter:
T C t = T C t E t , A t , R t = T C t L t , S t , R t
To solve the model for the minimal (i.e., optimal) transaction costs ( T C * ), Data Envelopment Analysis (DEA) is employed. DEA is a nonparametric method to estimate the production frontier, derived from fundamental efficiency and productivity theory principles [76,77]. The main DEA principle is that an entity (a firm, an organization or any other decision-making unit) is inefficient unless it reaches the overall best efficiency score among all entities that use similar inputs to produce similar outputs. The efficiency is defined as the ratio of an output and an input with a bound of unity on its possible values. DEA identifies a production possibility set in an empirical frontier that approximates an actual production frontier, defined by unknown parameters [78]. In this way, it “envelops” observations in search for a frontier that is used to evaluate observations (e.g., economic performances of entities). The advantage of DEA is that it allows a combined analysis of different efficiency figures, such as the economic performance, (dis)economies of scale and marginal productivity of technological improvements.
In the present analysis, DEA is used to estimate the efficiency of economic performance (ϵ) directly and transaction costs as inefficiency (1 ϵ). The purely technological efficiency consequently can be defined as the ratio of input efficiency and economies of scale [79]. The transaction cost of biomass production is given by the distance of the equilibrium state to the best-practice frontier, where the benchmark output under variable returns to scale is interpolated from the annual output levels of German farms. The evaluation index system includes input indexes (land size, farm number and labor of non-food biomass production) and output index (the revenue of non-food biomass production). Given x represents the matrix of the input amount and M represents the output in decision-making unit (DMU) j, the input-oriented DEA model with variable returns to scale (i.e., DEA model of BC2 type) has the following form:
m i n ϵ ε e 1 T ω + e 2 T ω + s . t .   j = 1 k x j l λ j + ω = ϵ x l k l = 1 , 2 ,   I j = 1 k M j λ j ω + = M k   λ j 0 , j k λ j = 1 ,  
with the weight   λ j ( λ j   ≥ 0), the types of input variables I (farmland, farm number and labor), the input redundant variables   ω ( ω ≥ 0) and the output deficit variable   ω + ( ω + ≥ 0). For the non-Archimedes infinitesimal   ε , apply ε = 10−6, e 1 T = 1 , 1 , 1 1 E m , e 2 T = 1 , 1 , 1 1 E k , with Em and Ek as the respective m- and k-dimensional vector spaces. Because the input-oriented version of the DEA model is used, the estimated transaction costs are the sum costs of redundancy for land size, farm number and labor in non-food biomass production. Minimizing the transaction costs by eliminating the input slacks ( ω ) therefore means to search for a Pareto optimal solution for DMU j. This occurs through adjusting the original production function by the target inputs x ^ j l :
x ^ j l = x j l ω j l
These adjustments generate a new input–output combination. A decision-making unit is efficient under a certain technological level, when ϵ = 1, ω = 0 and ω + = 0. Considering Assumption 2 about the relationship between economies of scale and transaction costs, the optimal solution set for the transaction costs is on the tangent of the economies of scale to transaction costs function.

3.2. Data and Scenarios

The secondary data for 2005–2016 were collected from the European Statistical Office (Eurostat), the statistics of the Federal Ministry of Food and Agriculture and the Land Market Report [80]. Based on these data, the average per hectare farmland price c was set at 8000 € (with an annual increase by 9.1%) and the average wage in industrial agriculture w was set at 3000 € per person and month. Land and labor reflect the amount of arable land (ha) and labor units involved in the production. The output of non-food biomass production is measured in its monetary value (m€). Using the panel data for 13 federal states (that is, excluding three city states) for five years (2005, 2007, 2010, 2013 and 2016), the average production function is estimated as Y = 2.77 L 0.50 S 0.56 (for individual estimates see Table 1). This estimation roughly corresponds to the one provided by Mathijs and Swinnen [81] for eastern Germany in 1992–1995 and by Fernandez-Cornejo et al. [82] for Germany. Even though the production function for Germany in 2001–2008 has been provided by Petrick and Kloss [83], it corresponds less to our estimation because the physical asset specificity and human asset specificity are highlighted in this study. The sum of the elasticities of farmland and labor, which is greater than 1, suggests that an increase in demand for biomass might indicate economies of scale having a certain effect on the production costs.
Two stylized scenarios are developed to analyze the structural implications of non-food biomass production for the agricultural sector from 2017 to 2030: (1) the adoption of neutral-to-scale technologies; and (2) a growing demand for plant-based biomass. These scenarios reflect the two main policy paths towards the bioeconomy: the continuing technological advance and the shift from fossil to biomass resources. While the first scenario addresses the impact of external factors (significant technological breakthroughs) on structural adjustments in agricultural sector, the second scenario is centered on internal factors (asset specificity, farm size and input factors). Because economies of scale vary across ownership types, input–output relationships and regional structures, the production costs and transaction costs of farms vary accordingly [7]. Their potentially different effects are therefore scrutinized in their respective subcases. The time period is selected so as to estimate the sector’s contribution to achieving the relevant milestones defined by the National Bioeconomy Strategy, BioEconomy 2030 [4]. The year 2030 marks also the end of the projection periods of the EU’s Food 2030 and Bioeconomy 2030 policies [84], as well as of the international bioeconomy agendas [14].
The case of neutral-to-scale technologies implies a constant elasticity of substitution between labor and land, so that technologies are equally beneficial to farms disregarding their size. Scenario 1 assumes that such technologies are Hicks-neutral and improve productivities of land and labor and the output will increase by 1% annually during the projected period 2017 to 2030 (cf. Klärle [85]). In this case, profit rates and output price remain constant. An example of a scale-neutral technology might be a mass application of affordable (potentially subsidized) self-reconfigurable robots, which substantially reduces the variable costs of human labor. As such technological innovations are hardly realizable (or implementable on a large scale) in the near future, their analysis is limited to anticipation of potential average effects.
The second scenario assumes that the demand for non-food biomass, as projected by a number of studies, will increase by 2% annually during 2017 to 2030 (cf. Piotrowski et al. [86]). In this scenario, the level of technological efficiency is kept constant, so that the output value, determined by the joint effect of (dis)economies of scale and transaction costs, will increase by 2% annually. Given the optimal allocation of labor and land, the ratio of the marginal product of the labor to its price w equals the ratio of the marginal product of the land to its price c ( M P L / M P S = w / c ). As the land price increases by 9.1% annually, the marginal rate of substitution increases as well. The scenario is analyzed in three subcases: (2a) the total effects; (2b) the scale-specific effects; and (2c) the regional, ownership-type-specific effects of an increased demand for agricultural biomass. Subcase (2b) includes five farm size groups (<10 ha, 10–50 ha, 50–100 ha, 100–200 ha and >200 ha), which reflect the distribution of farm sizes in Germany in 2005–2016 (cf. Baessler and Klotz [87]; Huettel and Margarian [88]), while subcase (2c) distinguishes individual farms, partnerships and companies in western and eastern Germany. Table 1 summarizes the scenarios with the corresponding production functions.
The adjusted production functions account for the constrains on the minimum transaction costs in the input-oriented DEA model. In addition, the trend functions extrapolated from farm number and average farm size data for 2005–2016 are used as baselines for comparison of the obtained results.

4. Results

4.1. Scenario 1: Neutral-to-Scale Technologies

The results of the first scenario are graphically summarized in Figure 2. The results show that in the projected period 2017–2030, a technology-induced annual increase in efficiency by 1% leads to an increase in the number of farms that switch from food to non-food biomass production. The growth in farm number is accompanied by a decline in the average farm size by 9.1%, which corresponds to the rate of the land price growth.
This dynamic is due to the fact that neutral-to-scale technologies reduce the part of the investment costs that creates competitive disadvantages to smaller producers. It implies that under such an optimistic scenario of significant technological breakthroughs, a bioeconomy could indeed support diseconomies of scale and, as envisioned by the current policy strategies, encourage smaller and new agricultural businesses. The comparison with the baseline case, which is the extrapolated trend of farm size and number, illustrates a possible scale of this effect. Although the positive effect of new technologies on the farm number may seem trivial under the given assumptions, it reveals that a scale-induced decline in transaction costs (and hence, in inefficiency) observed for real data (2005–2016), may, if supported by technological advance, continue even under diseconomies of scale.

4.2. Scenario 2: Increasing Demand for Non-Food Biomass

4.2.1. Average Sectoral Effects

An annual increase in demand for agricultural non-food biomass by 2% starting in 2017 raises the sectoral shift parameter value by 1.79% annually. As a result, the number of farms (and labor force) that switch from food to non-food biomass production grows significantly by 1.79% (Figure 3). The average farm size, by contrast, remains almost constant, decreasing only slightly, namely from 90.80 ha in 2017 to 88.95 ha in 2030 (that is, by 0.15% annually).
Assuming that the technology level and the total agricultural area remain constant, enlarging the area under non-food biomass at the expense of food crops production is the only means to meet the increasing non-food biomass demand. Consequently, there should still be a clear decrease in the average farm size in some farm size groups. An overall increase in average farm size would also be necessarily constrained by the threshold costs of investments [54]. As the rate of increase in farm number (1.79%) is higher than that of land under non-food biomass (1.64%), the observed average decrease in farm size may therefore be due to the combined effects of the relative share of the farm sizes groups, as well as the regional heterogeneities in agricultural and ownership structures [8,46]. These effects are scrutinized below.

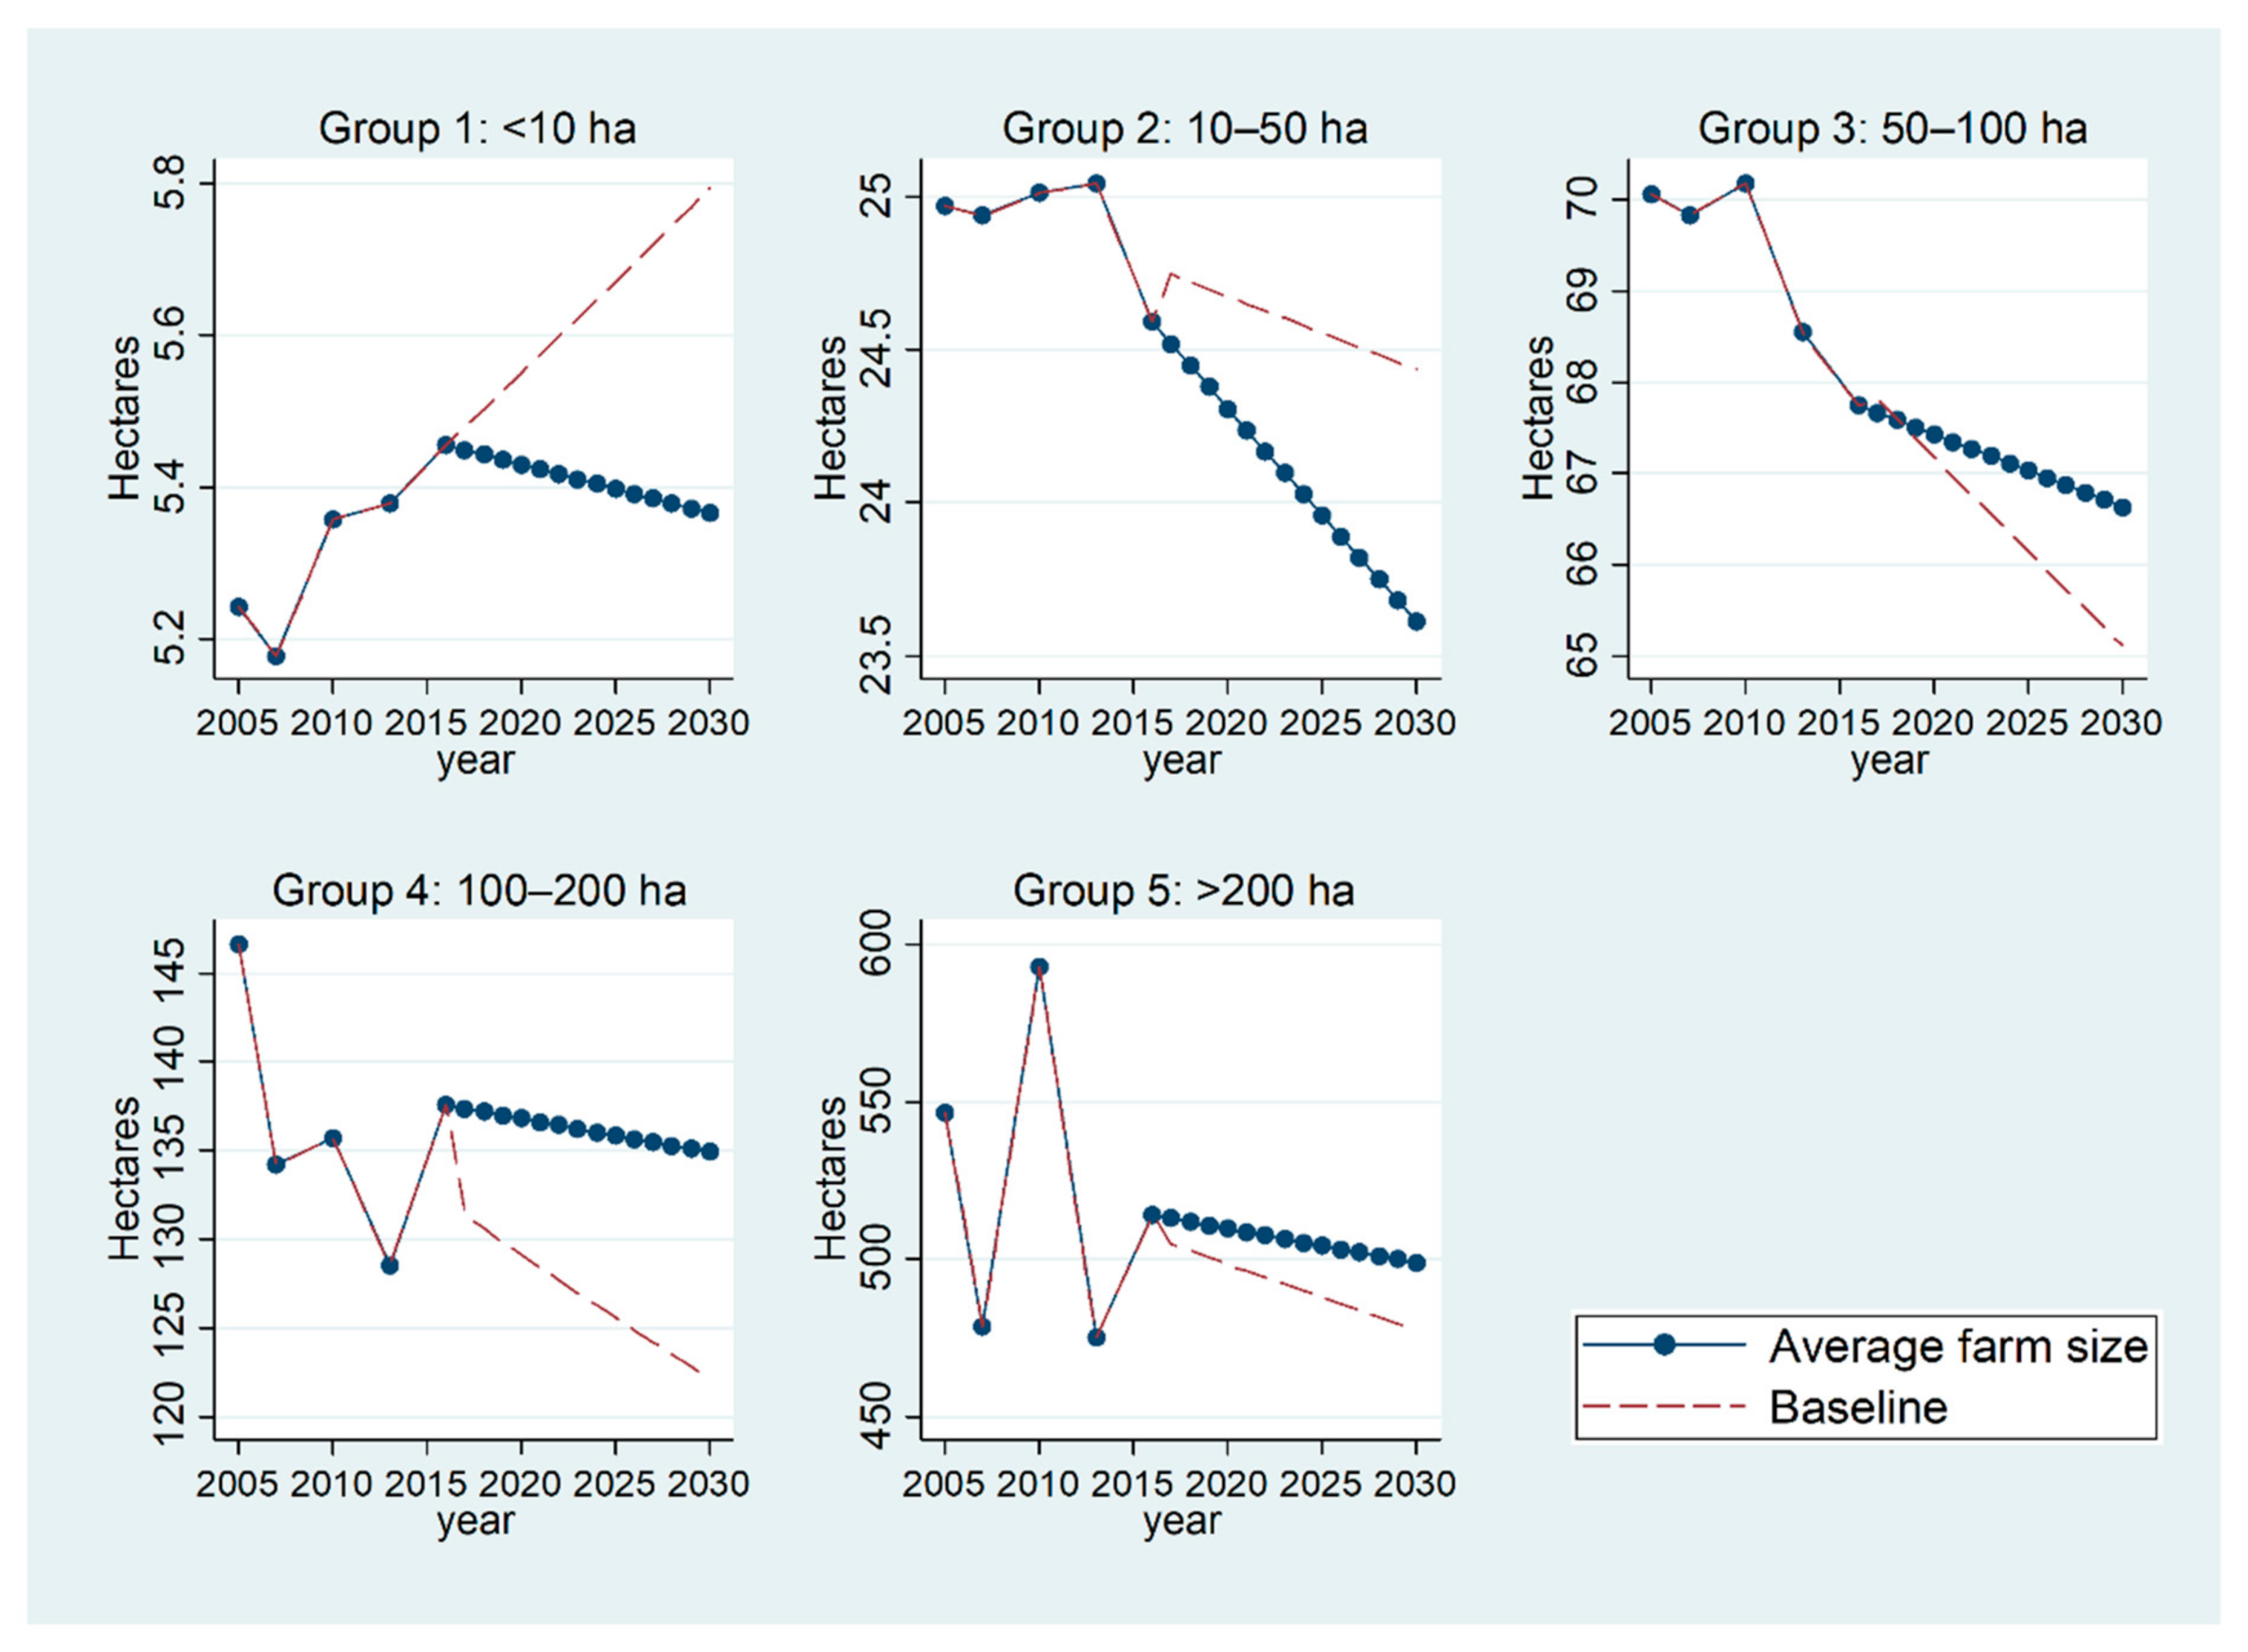
4.2.2. Effects for Farm Size Groups

Within the five farm size groups, an annual increase in biomass demand by 2% leads to different dynamics from 2017 to 2030 (Figure 4). The number of farms grows in each size group, but at different rates, namely 1.48%, 3.32%, 1.46%, 1.70% and 2.69% for Groups 1 to 5, respectively. This means that the scale alone cannot be responsible for this effect. Compared with the negative baseline trend, the projected number of farms in Groups 1 to 3 goes up if the transaction cost (and hence the inefficiency) is minimized. For larger farms (Groups 4 and 5), this number increases both in the baseline and projected trends, whereas for Group 5 the projected development outperforms the baseline trend. The difference between the baseline and projected dynamics indicates that the benefits from transaction cost savings are highly sensitive to the number of farms, especially for smaller groups.
The optimal average farm size (Figure 5) declines in response to a higher demand for non-food biomass in each group, namely by 0.12%, 0.30%, 0.12%, 0.14% and 0.21%, respectively. The comparison with the baseline trend reveals that the effect of transaction costs economization is particularly strong in Groups 1, 2 and 4. The difference between the baseline and projected dynamics in Group 1 and 2 can support the argument that transaction cost savings in competitive industrial agriculture can help small farms realize the supervision and local infrastructural advantages [8,40]. While, the observed gap between the baseline and projected dynamics in Group 4 is mainly caused by a lower growth rate in farm number compared to its corresponding baseline. Given that the technological (and hence the productivity) level remains unchanged, producers respond to increasing biomass demand by readjusting their input–output combinations. For instance, the adjusted production function in Group 5, as shown in Table 1, changes from increasing returns to scale to decreasing returns to scale. In this case, the largest farms adjust their optimal size less compared to both the other size groups and the baseline.

4.2.3. Regional Effects for Different Ownerships Types

Figure 6 shows that the increase in farm number observed in Subcase 2a and 2b for 2017–2030 can be stated for western Germany (1.64%) and eastern Germany (2.42%). Under the given assumptions, the growth in farm number reflects the relative amount of land and labor shifted from food to non-food biomass production, so that asset specificity increases with economies of scale. As a result, transaction cost savings improve the production efficiency in both regions, but especially for individual farms (where the baseline trend in farm number is reversed) and for partnerships in eastern Germany. The number of partnerships and companies in western Germany increases at a lower rate compared to the case of constant demand for agricultural biomass.
Average farm size within the ownership types correspondingly declines (Figure 7). Specifically, the average farm size decreases by 0.14% in western Germany and at a slightly higher rate (0.20%) in eastern Germany (see Figure 7). The declining average farms size both in eastern and western Germany indicates the prospects for smaller producers with regard to agricultural development [37]. In particular, the difference between the baseline and projected dynamics for western Germany is greater than that for eastern Germany. This might be caused by the decreasing returns to scale in western Germany, as shown by the adjusted production function in Table 1. To meet the increasing demand for non-food biomass, producers in western Germany largely adjust the combination of investments in land and labor. Thus, the higher the transaction costs saved, the smaller the optimal farm size, supporting the studies that observe a U-shaped function of asset specificity [66,67].
With regard to ownership types, only individual farms display the same size effect in both regions. This may be relevant for smaller individual farms, because smaller farms are supposed to be more flexible to adapt to market innovations [9], and thus benefit more from the effect of transaction cost savings [38]. By contrast, for partnerships and companies in eastern Germany, which are typically much larger than in western Germany, a higher industrial demand for biomass interrupts or significantly decelerates the negative farm size trend of 2005–2016. While, in western Germany, the upward baseline trend is reversed and stabilized. Partnerships and companies in eastern Germany adjust their optimal size less, because their adjustments of investments in land and labor cause additional transaction costs, slowing down the decrease rate in farm size.

5. Discussion

The results allow important and novel insights into the complex interaction between transaction costs and economies of scale in industrial agriculture. Although scaling-up production remains an effective means of profit maximization in a competitive environment [10], the results point to the rather nonlinear relationship between the transaction costs and economies of scale [34]. The analysis further shows that, if the average costs cannot be substantially reduced through expanding the scale of operation [37,66,70,89], a growing demand for non-food biomass can encourage more farms to switch from food to non-food biomass production. This means that, if economies of scale entail additional transaction costs, the effect of transaction cost savings can change the degree of asset specificity and lead to a downward adjustment in the optimal farm size [70,89]. This finding extends the relevant debate by showing that economies of scale mediate the impact of asset specificity on transaction costs [66].
The conducted analysis extends the findings of the existing studies, which focusses on the relationship between economies of scale and asset specificity [45,70] or just measure the level of transaction costs in agriculture [34], by accounting for the sector-specific characteristics that are relevant for transaction cost savings and production scale optimization [74]. This helps explore the complex non-linear relationship between transaction costs and economies of scale. For instance, the observed decline in the optimal size of farms indicates that the recent divestments of very large farms in eastern Germany may continue if more farms engage in non-food biomass production. These findings shed new light on agricultural transaction costs, highlighting their potentially non-trivial role in optimization of agricultural production decisions in a bio-based economy [11,43]. Specifically, the results show that the combined effect of transaction costs and economies of scale on the optimal farm size varies across the different farm size groups. The demonstrated effect of transaction cost savings for different scales of operation points to its potential relevance for the (de-)centralization of biomass production systems [90]. The results reveal that the effect of transaction cost savings is greater for smaller farms, which indicates their potential competitive advantage [37,46].
The projected slowdown of the growth rate for larger farms reveals the non-convexities of both functions for transaction costs and economies of scale, as well as the U-shape of the transaction cost function regarding asset specificity. The adjusted production function changes from increasing returns to scale to decreasing returns to scale in the group with a farm size greater than 200 ha. The diseconomies of scale indicate that the increase in production costs can offset the decrease in transaction costs as the asset specificity becomes greater. The decrease in total transaction costs positively affects the economies of scale, which emphasizes their inverse relationship [71]. As a higher degree of asset specificity will bring about higher transaction costs [70], the effect of the transaction cost savings on larger farms can lead to diseconomies of scale. This observation allows to seek for new ways to optimize the farm size by adjusting the asset specificity so as to minimize the transaction costs and reduce the dependence of optimal farm size on economies of scale [90]. This indicates that extending the supply chains and new agribusinesses in the bioeconomy through asset allocation may increasingly promote the vertical integration into the plant-based bioeconomy—once the effect of transaction costs can be reduced or neutralized [9,11,91,92,93].
Given a productivity increase due to the application of neutral-to-scale technologies, such as biological pesticide, drones and biofertilizers [94], which can largely substitute the variable input of labor, the effect of transaction cost savings can lead to economies of scale. As shown for the scenario of neutral-to-scale technologies, the increase of technological efficiency can reduce the transaction costs and increase the number of farms engaged in non-food biomass production. As a result, the increase in technology efficiency lowers the optimal size of farms from 2017 to 2030 if the land area for non-food biomass production remains unchanged (the shift parameter is zero). This finding is in line with the argument that neutral-to-scale technologies could render the logic of economies of scale less relevant by changing the cost advantage and improving productivity [46,95]. From this perspective, continuous investment in neutral-to-scale technologies may accelerate the commercialization progress of the supply chains in the future bioeconomy [16,96]. In addition, investing in neutral-to-scale technologies can help exploit transaction cost advantages and improve the production efficiency of smaller producers [97]. This insight may likewise inform agricultural policies and action plans in the transition economies like India, China, and those in Africa, where the farm scale is small to very small [23] and the cost of delay in technology approval is substantial [5].
Other than studies by Buckley and Chapman [54] and McCann [66], the present analysis suggests that the threshold costs of asset specificity will make the combined effect of the transaction costs and economies of scale vary among the different regions and ownership types of farms. This can be illustrated by the greater average size of farms projected both for all farm types in eastern Germany and companies in western Germany. The individual farms display the same size effect of transaction cost savings in both regions. This implies that the individual farms (which are typically much smaller than partnerships and companies) might be more flexible to adapt the new forms of agribusiness, which can be encouraged to support agricultural development [92,93]. Furthermore, the growth rate of the shift parameter in eastern Germany (2.42%), which largely determines the degree of asset specificity, is faster than that of the land area under non-food crops (2.22%). This indicates that under given assumptions more land and labor would shift from food production to non-food biomass production.
The different degree of the combined effect of transaction costs and economies of scale in eastern and western Germany indicates that this effect is highly sensitive to farms’ asset specificity. The findings suggest that developing marginal arable land and alternative forms of non-food biomass production [98,99] are needed to avoid additional conflicts with food production in the bioeconomy [100,101]. The results also indicate that policy action plans should account for the regional and ownership-specific responses to the technological advances and higher demand for biomass. Specifically, if smaller and new producers are to be encouraged to contribute to the transition to a sustainable plant-based economy, policy instruments aiming at transaction cost reduction will be needed [102,103].

6. Conclusions

Agriculture has long been regarded as the sector that “may limit severely or contribute importantly” to overall economic development [104]. In the initiated transition to an innovation-driven and bio-based economy, particularly high expectations are attached to agriculture as a biomass supplier, one of the largest contributors to greenhouse gas savings and job creation in rural areas [98,105,106]. Taking Germany as an example, the study looked into the question of how industrial agriculture—with its tight competition, low yield increases and little room for reduction of production costs—can still engage in biomass production for material and energy uses. The study argued that one of the key structural responses might be the adjustment of the farm size by simultaneously optimizing benefits from the production scale and transaction cost savings. A stylized model of agricultural non-food biomass production was developed to illustrate the potential relevance of this optimization for the agricultural sector and the bioeconomy strategy. By measuring transaction costs as the inefficiency of non-food biomass producers with Data Envelopment Analysis, the study arrived at the following three main conclusions.
First, the combined effect of economies of scale and transaction costs reveals that, if farms cannot economize on transaction costs, then investments in land and labor need to adjust to the higher biomass demand, partly compromising the returns to scale, so that the growth in farm size is slowed down. Second, a higher degree of asset specificity, indicated by the greater sum of elasticities of farmland and labor, gives rise to transaction costs. This effect reduces the rate at which the farm size decreases. Third, if the scale advantage can be rendered less relevant (as in the illustrated case of significant technological breakthroughs), smaller producers may disproportionally benefit from their higher potential of transaction cost savings.
Although the model design is deliberately reduced so as to trace down the endogeneity between economies of scale and transaction costs, the findings still point to a number of policy implications. Specifically, they suggest that pivoting highly competitive industrial agriculture towards economic sustainability requires considering both the possible synergy and trade-off between transaction cost savings and (dis)economies of scale benefits. The provided insights into their combined effect on agricultural optimization decisions inform bioeconomy strategies to account for this complex effect when comparing the opportunities of smaller and larger agricultural producers in the bioeconomy. At the same time, the reported positive implications for smaller producers draw attention to the potentially significant structural implications of an uncritical enthusiasm for agricultural non-food biomass. The observed regional effects likewise indicate the projected increase in the number of smaller farms, which might be due to the decisions of the very large producers to divest parts of their operations. Furthermore, the increase in the number of farms that are encouraged to shift from food to non-food production raises attention to a possible aggravation of the already serious land-use conflicts in industrial agriculture. The illustrated implications from politically promoted demand for renewable biomass and application of new technologies in agriculture alert policymakers to align the existing sustainability, agricultural and innovation strategies, so as to avoid conflicts with food production and environment protection [47,48,90,102].
Yet, the provisional nature of the findings should be emphasized. The non-convexity of the economies of scale function, as well as the U-shape of the transaction costs function in asset specificity, make the analysis of the combined effect mathematically complex and context-sensitive. Further work investigating how the combined effect of economies of scale and transaction costs unfolds under more realistic conditions is warranted. These conditions can in particular account for price and volatility effects, competitive land use, incremental agricultural innovations, the degree of vertical integration and new market entrants. Not least, different levels of aggregation (farm, farm groups, sector) should be considered to better understand the complex mechanism behind agricultural transaction costs.

Author Contributions

Conceptualization, L.C. and L.W.; methodology, L.W.; software, L.W.; validation, L.W. and L.C.; formal analysis, L.W. and L.C.; data curation, L.W.; writing—original draft preparation, L.C. and L.W.; writing—review and editing, L.C. and L.W.; visualization, L.W. and L.C.; supervision, L.C. All authors have read and agreed to the published version of the manuscript.

Funding

This research was funded by ScienceCampus Halle—Plant-based Bioeconomy, EFRE funds, Germany. The publication of this article was funded by the Open Access Fund of the Leibniz Association.

Institutional Review Board Statement

Not applicable.

Informed Consent Statement

Not applicable.

Data Availability Statement

The data presented in this study are available on request from the corresponding author.

Acknowledgments

We thank the editor and two anonymous reviewers for their careful reading of earlier versions of this paper and the very insightful comments. We also indebted to a number of colleagues for providing us encouragement and valuable feedbacks on the research idea and design: Alfons Balmann, Anlu Zhang, Justus Wesseler, Thomas Herzfeld, Zhanli Sun and Yan Jin.

Conflicts of Interest

The authors declare no conflict of interest.

References

  1. Cochrane, W.W. Farm Prices: Myth and Reality; University of Minnesota Press: Minneapolis, MN, USA, 1958. [Google Scholar]
  2. Uekötter, F. Die Wahrheit ist auf dem Feld: Eine Wissensgeschichte der Deutschen Landwirtschaft; Vandenhoeck & Ruprecht: Göttingen, Germany, 2010. [Google Scholar]
  3. Chatalova, L.; Müller, D.; Valentinov, V.; Balmann, A. The Rise of the Food Risk Society and the Changing Nature of the Technological Treadmill. Sustainability 2016, 8, 584. [Google Scholar] [CrossRef] [Green Version]
  4. BMBF. National Bioeconomy Strategy. Federal Ministry of Education and Research, Division “Bioeconomy, Material Biomass Use”. 2020. Available online: www.bmbf.de/bioeconomy (accessed on 7 January 2020).
  5. Wesseler, J.; Zilberman, D. The economic power of the Golden Rice opposition. Env. Dev. Econ. 2014, 19, 724–742. [Google Scholar] [CrossRef] [Green Version]
  6. Woodhouse, P. Beyond industrial agriculture? Some questions about farm size, productivity and sustainability. J. Agrar. Chang. 2010, 10, 437–453. [Google Scholar] [CrossRef]
  7. Thiele, H.; Brodersen, C.M. Differences in farm efficiency in market and transition economies: Empirical evidence from West and East Germany. Eur. Rev. Agric. Econ. 1999, 26, 331–347. [Google Scholar] [CrossRef]
  8. Deininger, K. Global land investments in the bio-economy: Evidence and policy implications. Agric. Econ. 2013, 44, 115–127. [Google Scholar]
  9. BECOTEPS. The European Bioeconomy in 2030: Delivering Sustainable Growth by Addressing the Grand Societal Challenges. 2011. Available online: www.epsoweb.org/file/560 (accessed on 31 March 2011).
  10. Zambon, I.; Cecchini, M.; Egidi, G.; Saporito, M.G.; Colantoni, A. Revolution 4.0: Industry vs. agriculture in a future development for SMEs. Processes 2019, 7, 36. [Google Scholar] [CrossRef] [Green Version]
  11. EC. Making Europe’s Businesses Future-Ready: A New Industrial Strategy for a Globally Competitive, Green and Digital Europe; European Commission (EC): Brussels, Belgium, 2020. [Google Scholar]
  12. Schwab, K. The Fourth Industrial Revolution; Crown Business: New York, NY, USA, 2017. [Google Scholar]
  13. EC. A Sustainable Bioeconomy for Europe: Strengthening the Connection between Economy, Society and the Environment: Updated Bioeconomy Strategy; European Commission (EC): Brussels, Belgium, 2018. [Google Scholar]
  14. OECD. The Bioeconomy in 2030: Designing a Policy Agenda; OECD: Paris, France, 2009. [Google Scholar]
  15. BMBF. Mit vereinter Kraft für die Bioökonomie; Pressemitteilung: Berlin, Germany, 2018. [Google Scholar]
  16. Kardung, M.; Cingiz, K.; Costenoble, O.; Delahaye, R.; Heijman, W.; Lovrić, M.; van Leeuwen, M.; M’Barek, R.; van Meijl, H.; Piotrowski, S.; et al. Development of the Circular Bioeconomy: Drivers and Indicators. Sustainability 2021, 13, 413. [Google Scholar] [CrossRef]
  17. MWW, SA. Regionale Innovationsstrategie Sachsen-Anhalt 2014–2020. Ministerium für Wissenschaft und Wirtschaft des Landes Sachsen-Anhalt (MWW SA). 2014. Available online: https://mw.sachsenanhalt.de/fileadmin/Bibliothek/Politik_und_Verwaltung/MW/Publikationen/RIS/Regionale_Innovationsstrategie_2014-2020_final.pdf (accessed on 27 January 2015).
  18. Gent, R. Bioökonomie: Erdöl versus Biomasse? Chancen und Risiken aus Sicht der Deutschen Industrievereinigung Biotechnologie. Rundbr. Forum Umw. Entwickl. Mit Bioökonomie Die Welt Rett. 2018, 1, 4–5. [Google Scholar]
  19. Troost, C.; Walter, T.; Berger, T. Climate, energy and environmental policies in agriculture: Simulating likely farmer responses in Southwest Germany. Land Use Policy 2015, 46, 50–64. [Google Scholar] [CrossRef] [Green Version]
  20. Scarlat, N.; Dallemand, J.; Monforti-Ferrario, F.; Nita, V. The role of biomass and bioenergy in a future bioeconomy: Policies and facts. Environ. Dev. 2015, 15, 3–34. [Google Scholar] [CrossRef]
  21. Zinngrebe, Y.; Pe’er, G.; Schueler, S.; Schmitt, S.; Schmidt, J.; Lakner, S. The EU’s ecological focus areas-How experts explain farmers’ choices in Germany. Land Use Policy 2017, 65, 93–108. [Google Scholar] [CrossRef]
  22. Arbo, M.; Utstumo, T.; Brekke, E.; Gravdahl, J. Unscented multi-point smoother for fusion of delayed displacement measurements: Application to agricultural robots. Model. Identif. Control 2017, 38, 1–9. [Google Scholar] [CrossRef] [Green Version]
  23. Wesseler, J.; von Braun, J. Measuring the bioeconomy: Economics and policies. Annu. Rev. Resour. Econ. 2017, 9, 275–298. [Google Scholar] [CrossRef]
  24. Adenle, A.A.; De Steur, H.; Hefferon, K.; Wesseler, J. Two Decades of GMOs. Science, Technology, and Innovation for Sustainable Development Goals: Insights from Agriculture, Health, Environment, and Energy; Oxford University Press: Oxford, UK, 2020; pp. 401–412. [Google Scholar]
  25. Bagheri, A.; Bondori, A.; Damalas, C.A. Modeling cereal farmers’ intended and actual adoption of integrated crop management (ICM) practices. J. Rural Stud. 2019, 70, 58–65. [Google Scholar] [CrossRef]
  26. Lurie, S.; Brekken, C.A. The role of local agriculture in the new natural resource economy (NNRE) for rural economic development. Renew. Agric. Food Syst. 2019, 34, 395–405. [Google Scholar] [CrossRef]
  27. Asada, R.; Stern, T. Competitive bioeconomy? Comparing bio-based and non-bio-based primary sectors of the world. Ecol. Econ. 2018, 149, 120–128. [Google Scholar] [CrossRef]
  28. Pretty, J.; Brett, C.; Gee, D.; Hine, R. Mason, C.; Morison, J.; Rayment, M.; van der Bijl, G.; Dobbs, T. Policy challenges and priorities for internalizing the externalities of modern agriculture. J. Environ. Plann. Manag. 2001, 44, 263–283. [Google Scholar] [CrossRef]
  29. DBV. Deutscher Bauernverband: Situationsbericht 2019/20. Trends und Fakten der Landwirtschaft. 2019. Available online: https://www.bauernverband.de/situationsbericht (accessed on 12 December 2019).
  30. Eurostat. 2020. Available online: https://ec.europa.eu/eurostat/databrowser/view/ef_lus_main/default/table?lang=en (accessed on 15 December 2020).
  31. Landatlas. 2018. Available online: https://www.landatlas.de/ (accessed on 1 January 2018).
  32. Tietz, A. Überregional aktive Kapitaleigentümer in ostdeutschen Agrarunternehmen: Bestandsaufnahme und Entwicklung. In Thünen Report 35; Johann Heinrich von Thünen-Institut: Braunschweig, Germany, 2015. [Google Scholar] [CrossRef]
  33. Word Bank. Germany: Employment in Agriculture. 2020. Available online: https://tradingeconomics.com/germany/employment-in-agriculture-percent-of-total-employment-wb-data.html (accessed on 30 June 2020).
  34. Nikolaeva, E.; Pletnev, D. The role of the transaction costs in the business success of small and medium sized enterprises in Russia. Procedia Soc. Behav. Sci. 2016, 221, 176–184. [Google Scholar] [CrossRef] [Green Version]
  35. Benoît, M.; Rizzo, D.; Marraccini, E.; Moonen, A.C.; Galli, M.; Lardon, S.; Rapey, H.; Thenail, C.; Bonari, E. Landscape agronomy: A new field for addressing agricultural landscape dynamics. Landsc. Ecol. 2012, 27, 1385–1394. [Google Scholar] [CrossRef]
  36. Rogers, M. Networks, firm size and innovation. Small Buz. Econ. 2004, 22, 141–153. [Google Scholar] [CrossRef]
  37. Jochen, D. The political economy of agriculture for development today: The “small versus large” scale debate revisited. Agric. Econ. 2016, 47, 671–681. [Google Scholar]
  38. Batáry, P.; Gallé, R.; Riesch, F.; Fischer, C.; Dormann, C.F.; Mußhoff, O.; Császár, P.; Fusaro, S.; Gayer, C.; Happe, A.K.; et al. The former Iron Curtain still drives biodiversity–profit trade-offs in German agriculture. Nat. Ecol. Evol. 2017, 1, 1279–1284. [Google Scholar]
  39. Hayami, A. A great transformation: Social and Economic change in sixteenth and seventeenth-century Japan. In Population, Family and Society in Pre-Modern Japan; Global Oriental: Kent, UK, 2010; pp. 42–51. [Google Scholar]
  40. Villoria, N. Technology spillovers and land use change: Empirical evidence from global agriculture. Am. J. Agric. Econ. 2017, 12, 1–35. [Google Scholar] [CrossRef] [Green Version]
  41. Hall, R.; Zacune, J. Bio-Economies: The EU’s Real ‘Green Economy’ Agenda; World Development Movement and the Transnational Institute: Amsterdam, The Netherlands, 2012. [Google Scholar]
  42. Davies, S.; Griestop, L.; Vironen, H.; Bachtler, J.; Dozhdeva, V.; Michie, R. Case studies of national bioeconomy strategies in Finland and Germany. BioSTEP Deliv. 2016. Available online: https://strathprints.strath.ac.uk/62217/ (accessed on 1 February 2016).
  43. Efken, J.; Dirksmeyer, W.; Kreins, P.; Knecht, M. Measuring the importance of the bioeconomy in Germany: Concept and illustration. NJAS Wagening. J. Life Sci. 2016, 77, 9–17. [Google Scholar] [CrossRef]
  44. Budzinski, M.; Bezama, A.; Thrän, D. Monitoring the progress towards bioeconomy using multi-regional input-output analysis: The example of wood use in Germany. J. Clean. Prod. 2017, 161, 1–11. [Google Scholar] [CrossRef]
  45. Nooteboom, B. Firm Size Effects on Transaction Costs. Small Bus. Econ. 1993, 5, 283–295. [Google Scholar] [CrossRef]
  46. Blesh, J.; Hoey, L.; Jones, A.D.; Friedmann, H.; Perfecto, I. Development pathways toward “zero hunger”. World Dev. 2019, 118, 1–14. [Google Scholar] [CrossRef]
  47. Liobikiene, G.; Chen, X.; Streimikiene, D.; Balezentis, T. The trends in bioeconomy development in the European Union: Exploiting capacity and productivity measures based on the land footprint approach. Land Use Policy 2020, 91, 104375. [Google Scholar] [CrossRef]
  48. Castrejon-Campos, O.; Aye, L.; Hui, F.K.P. Making policy mixes more robust: An integrative and interdisciplinary approach for clean energy transitions. Energy Res. Soc. Sci. 2020, 64, 101425. [Google Scholar] [CrossRef]
  49. Coase, R.H. The nature of the firm. Economica 1937, 4, 386–405. [Google Scholar] [CrossRef]
  50. Coase, R.H. The Problem of social cost. J. Law Econ. 1960, 25, 1–44. [Google Scholar] [CrossRef]
  51. Dahlman, C.J. Problem of externality. J. Law Econ. 1979, 22, 141–162. [Google Scholar] [CrossRef] [Green Version]
  52. Arrow, K.J. The organization of economic activity: Issues pertinent to the choice of market versus nonmarket allocation. Anal. Eval. Public Expend. PPB Syst. 1969, 1, 59–73. [Google Scholar]
  53. Williamson, O.E. Markets and hierarchies: Some elementary considerations. Am. Econ. Rev. 1973, 63, 316–325. [Google Scholar]
  54. Buckley, P.J.; Chapman, M. The perception and measurement of transaction costs. Camb. J. Econ. 1997, 21, 127–145. [Google Scholar] [CrossRef]
  55. Eggertsson, T. Economic Behavior and Institutions; Cambridge University Press: Cambridge, UK, 1990. [Google Scholar]
  56. Williamson, O.E. Transaction cost economics. Handb. Ind. Organ. 1989, 1, 135–182. [Google Scholar]
  57. Vatn, A. Transaction costs and multifunctionality. In Proceedings of the OECD Workshop on Multifunctionality by the Directorate for Food Agriculture, and Fisheries, Paris, France, 2–3 July 2001. [Google Scholar]
  58. McCann, L.; Colby, B.; Easter, K.W.; Kasterine, A.; Kuperan, K.V. Transaction cost measurement for evaluating environmental policies. Ecol. Econ. 2005, 52, 527–542. [Google Scholar] [CrossRef]
  59. Rørstad, P.K.; Vatn, A.; Kvakkestad, V. Why do transaction costs of agricultural policies vary? Agric. Econ. 2007, 36, 1–11. [Google Scholar] [CrossRef]
  60. James, H., Jr.; Klein., P.; Sykuta, M. Markets, contracts, or integration? The adoption, diffusion, and evolution of organizational form. Presented at the American Agricultural Economics Association Annual Meeting, Providence, Rhode Island, 24–27 June 2005. [Google Scholar]
  61. Carter, M.R. Resource allocation and use under collective rights and labour management in peruvian coastal agriculture. Econ. J. 1984, 94, 826–846. [Google Scholar] [CrossRef]
  62. Deininger, K. Collective agricultural production: A solution for transition economies? World Dev. 1995, 23, 1317–1334. [Google Scholar] [CrossRef]
  63. North, D.C.; Wallis, J.J. Integrating institutional change and technical change in economic history a transaction cost approach. J. Inst. Theor. Econ. 1994, 150, 609–624. [Google Scholar]
  64. Altman, I.; Klein, P.G.; Johnson, T. Scale and Transaction Costs in the U.S. Biopower Industry. J. Agric. Food Ind. Org. 2007, 5, 1–19. [Google Scholar] [CrossRef]
  65. Perrin, R.; Winkelmann, D. Impediments to technical progress on small versus large farms. Am. J. Agric. Econ. 1976, 58, 888–894. [Google Scholar] [CrossRef]
  66. McCann, L.M.J. Transaction costs of environmental policies and returns to scale: The case of comprehensive nutrient management plans. Rev. Agric. Econ. 2009, 31, 561–573. [Google Scholar] [CrossRef]
  67. Xie, X.; Zhang, A.; Wen, L.; Bin, P. How horizontal integration affects transaction costs of rural collective construction land market? An empirical analysis in Nanhai District, Guangdong Province, China. Land Use Policy 2019, 82, 138–146. [Google Scholar] [CrossRef]
  68. Stoll, H.R.; Whaley, R.E. Transaction costs and the small firm effect. J. Financ. Econ. 1983, 12, 57–79. [Google Scholar] [CrossRef]
  69. Holloway, G.; Nicholson, C.; Delgado, C.; Staal, S.; Ehuia, S. Agroindustrialization through institutional innovation Transaction costs, cooperatives and milk-market development in the east-African highlands. Agric. Econ. 2000, 23, 279–288. [Google Scholar] [CrossRef]
  70. Lyons, B.R. Specific investment, economies of scale, and the make-or-buy decision: A test of transaction cost theory. J. Econ. Behav. Org. 1995, 26, 431–443. [Google Scholar] [CrossRef]
  71. Xu, C. Transaction cost, economic size and economic growth. J. Audit Econ. 2016, 31, 120–128. [Google Scholar]
  72. John, G.; Weitz, B.A. Forward integration into distribution: An empirical test of transaction cost analysis. J. Law Econ. Org. 1988, 4, 337. [Google Scholar]
  73. Masten, S.E. Transaction-Cost Economics and the Organization of Agricultural Transactions; Baye, M.R., Ed.; Industrial Organization, Emerald Group Publishing Limited: Bingley, UK, 2000; pp. 173–195. [Google Scholar]
  74. Valentinov, V. Why are cooperatives important in agriculture? An organizational economics perspective. J. Ins. Econ. 2007, 3, 55–69. [Google Scholar] [CrossRef]
  75. He, Y.; Luo, B. Industrial characteristics, transactional costs and economic performance—Based on the positive analysis of China’s agricultural economic transition (1958–2008). J. Shanxi Fan. Econ. Univ. 2011, 33, 57–62. [Google Scholar]
  76. Charnes, A.; Cooper, W.W.; Rhodes, E.L. Measuring the efficiency of decision making units. Eur. J. Oper. Res. 1978, 2, 429–444. [Google Scholar] [CrossRef]
  77. Cooper, W.W.; Seiford, L.M.; Tone, K. Introduction to Data Envelopment Analysis and Its Uses: With DEA-Solver Software and References; Springer: New York, NY, USA, 2006. [Google Scholar]
  78. Dulá, J.H. Mining nonparametric frontiers. In Modeling Data Irregularities and Structural Complexities in Data Envelopment Analysis; Zhu, J., Wade, D.C., Eds.; Springer Science & Business Media: Boston, MA, USA, 2007; pp. 155–170. [Google Scholar]
  79. Thanassoulis, E. Introduction to the Theory and Application of Data Envelopment Analysis; Kluwer Academic Publishers: Dordrecht, The Netherlands, 2001. [Google Scholar]
  80. Accesstoland, A. European Network of Grassroots Organisations Securing Land for Agroecological Farming. 2013. Available online: https://www.accesstoland.eu/Background-10 (accessed on 1 February 2013).
  81. Mathijs, E.; Swinnen, J.F. Production organization and efficiency during transition: An empirical analysis of East German agriculture. Rev. Econ. Statis. 2001, 83, 100–107. [Google Scholar] [CrossRef]
  82. Fernandez-Cornejo, J.; Gempesaw, C.; Elterich, J.; Stefanou, S. Dynamic measures of scope and scale economies: An application to German agriculture. Am. J. Agric. Econ. 1992, 74, 329–342. [Google Scholar] [CrossRef]
  83. Petrick, M.; Kloss, M. Identifying agricultural factor productivity from micro-data: A review of approaches with an application to EU countries. German J. Agric. Econ. 2018, 67, 67–69. [Google Scholar]
  84. EC. EU Biodiversity Strategy for 2030: Bringing Nature Back into our Lives; Communication from the Commission to the European Parliament, the Council, the European Economic and Social Committee and the Committee of the Regions: Brussels, Belgium, 2020. [Google Scholar]
  85. Klärle, M. Landmanagement 4.0. Mehrwert durch künstliche Intelligenz. Landtechnik 2018, 73, 37–38. [Google Scholar]
  86. Piotrowski, S.; Carus, M.; Carrez, D. European bioeconomy in figures. Ind. Biotechnol. 2016, 12, 78–82. [Google Scholar] [CrossRef]
  87. Baessler, C.; Klotz, S. Effects of changes in agricultural land-use on landscape structure and arable weed vegetation over the last 50 years. Agric. Eco. Environ. 2006, 115, 43–50. [Google Scholar] [CrossRef]
  88. Huettel, S.; Margarian, A. Structural change in the West German agricultural sector. Agric. Econ. 2010, 40, 759–772. [Google Scholar] [CrossRef]
  89. Alvarez, A.; Arias, C. Diseconomies of size with fixed managerial ability. Am. J. Agric. Econ. 2003, 85, 134–142. [Google Scholar] [CrossRef]
  90. De Roest, K.; Ferrari, P.; Knickel, K. Specialisation and economies of scale or diversification and economies of scope? Assessing different agricultural development pathways. J. Rural. Stud. 2018, 59, 222–231. [Google Scholar] [CrossRef]
  91. Lindberg, M.B.; Markard, J.; Andersen, A.D. Policies, actors and sustainability transition pathways: A study of the EU’s energy policy mix. Res. Policy 2019, 48, 103668. [Google Scholar] [CrossRef]
  92. Alemu, M. Applications of biotechnology for characterization of plants and pests as the key components of plant protection and production strategies: A review. Intern. J. Appl. Sci. Biotechnol. 2020, 8, 247–288. [Google Scholar] [CrossRef]
  93. Emerick, K.; de Janvry, A.; Sadoulet, E.; Dar, M.H. Technological innovations, downside risk, and the modernization of agriculture. Am. Econ. Rev. 2016, 106, 1537–1561. [Google Scholar] [CrossRef] [Green Version]
  94. De Clercq, M.; Vats, A.; Biel, A. Agriculture 4.0: The future of farming technology. In Proceedings of the World Government Summit, Dubai, UAE, 24 February 2018; pp. 11–13. [Google Scholar]
  95. Liobikiene, G.; Balezentis, T.; Streimikiene, D.; Chen, X. Evaluation of bioeconomy in the context of strong sustainability. Sustain. Dev. 2019, 27, 955–964. [Google Scholar] [CrossRef]
  96. Zilberman, D.; Kim, E.; Kirschner, S.; Kaplan, S.; Reeves, J. Technology and the future bioeconomy. Agric. Econ. 2013, 44, 95–102. [Google Scholar] [CrossRef]
  97. Lewandowski, I. Securing a sustainable biomass supply in a growing bioeconomy. Glob. Food Sec. 2015, 6, 34–42. [Google Scholar] [CrossRef]
  98. El-Chichakli, B.; von Braun, J.; Lang, C.; Barben, D.; Philp, J. Policy: Five cornerstones of a global bioeconomy. Nature 2016, 535, 221–223. [Google Scholar] [CrossRef]
  99. Von Cossel, M.; Wagner, M.; Lask, J.; Magenau, E.; Bauerle, A.; Von Cossel, V.; Iqbal, Y. Prospects of bioenergy cropping systems for a more social-ecologically sound bioeconomy. Agronomy 2019, 9, 605. [Google Scholar] [CrossRef] [Green Version]
  100. Rada, N.E.; Fuglie, K.O. New perspectives on farm size and productivity. Food Policy 2019, 84, 147–152. [Google Scholar] [CrossRef]
  101. Xie, L.; Qiu, Z.; You, L.; Kang, Y. A Macro Perspective on the Relationship between Farm Size and Agrochemicals Use in China. Sustainanility 2020, 12, 9299. [Google Scholar] [CrossRef]
  102. Falcone, P.M.; Lopolito, A.; Sica, E. Policy mixes towards sustainability transition in the Italian biofuel sector: Dealing with alternative crisis scenarios. Energy Res. Soc. Sci. 2017, 33, 105–114. [Google Scholar] [CrossRef]
  103. D’Adamo, I.; Falcone, P.M.; Imbert, E.; Morone, P. Exploring regional transitions to the bioeconomy using a socio-economic indicator: The case of Italy. Econ. Politica 2020, 1–33. [Google Scholar] [CrossRef]
  104. Schultz, T.W. The Economic Organization of Agriculture; McGrawHill: New York, NY, USA, 1953; p. 8. [Google Scholar]
  105. Gawel, E.; Pannicke, N.; Hagemann, N. A path transition towards a bioeconomy-the crucial role of sustainability. Sustainability 2019, 11, 3005. [Google Scholar] [CrossRef] [Green Version]
  106. Grossauer, F.; Stoeglehner, G. Bioeconomy-Spatial requirements for sustainable development. Sustainability 2020, 12, 1877. [Google Scholar] [CrossRef] [Green Version]
Figure 1. Conceptual framework of the study.
Sustainability 13 00733 g001
Figure 2. The number of farms and average farm size, 2005–2030 (Scenario 1).
Sustainability 13 00733 g002
Figure 3. Number of farms and average farm size, 2005–2030 (Scenario 2a).
Sustainability 13 00733 g003
Figure 4. Number of farms in the farm size groups, 2005–2030 (Scenario 2b).
Sustainability 13 00733 g004
Figure 5. Average farm size in the different farm size groups, 2005–2030 (Scenario 2b).
Sustainability 13 00733 g005
Figure 6. Number of farms for the different ownership types and regions, 2005–2030 (Scenario 2c).
Sustainability 13 00733 g006
Figure 7. Average farm size for the different ownership types and regions, 2005–2030 (Scenario 2c).
Sustainability 13 00733 g007
Table 1. Overview of the scenarios and their basic assumptions.
Scenarios and AssumptionsEstimated
Production Functions
Adjusted
Production Functions
SCENARIO 1: Neutral-to-scale technologiesY =2.77L0.50 S0.56Y =2.45L0.67 S0.49
• Annual increase in factor productivity by 1%
• Constant profit rate and output price
• Hicks-neutral technology
SCENARIO 2: Higher demand for non-food biomass
• Annual increase in demand by 2%
• Constant profit rate and product price
• Constant factor productivity/technology
2a: Average sectoral effectsY =2.77L0.50 S0.56Y =2.45L0.67 S0.49
2b: Effects for farm size groups
Group 1: <10 haY =3.47L0.53 S0.54Y =8.41L1.35
Group 2: 10 ha–50 haY = 4.54L−0.99S2.13Y = 21.49L−4.36S5.36
Group 3: 50 ha–100 haY = 2.98L−0.89S2.12Y = S1.49
Group 4: 100 ha–200 haY = L−0.35S1.7Y = L−0.33S1.64
Group 5: >200 haY = S1.07Y = S0.81
2c: Regional effects for different ownerships types
Western GermanyY = 31.69L−0.7S2.47Y = −8.3L5.64S−4.82
Eastern GermanyY = 38.44L−0.16S15.47Y = 16.59L−3.92S5.18
Note: Z-stat for α(ln_labor) in Scenario 2(b) are 1.05, 2.17 **, −1.11, −0.61, 2.27 ** and in 2(c) 3.08 ***, −4.56 *** respectively; Z-stat for β(ln_land) in 2(b) are 0.29, 3.12 ***, 2.07 **, 2.15 **, −1.88 * and in 2(c) 3.77 ***, 5.6 *** respectively; Z-stat for constant in 2(b) are 0.96, 0.3, −0.31, 0.58, 3.23 *** and in 2(c) 0.32, 0.1 respectively; *** Pr >|z|—probability for z < 0.01; ** Pr >|z|—probability for z < 0.05, * Pr > |z|—probability for z < 0.1.
Publisher’s Note: MDPI stays neutral with regard to jurisdictional claims in published maps and institutional affiliations.

