1. Introduction
China’s iron and steel industry (ISI) has rapidly developed since the beginning of the country’s reform and opening-up processes. In 1996, China became the world’s largest producer of crude steel. The country’s past policy approaches affected its industry development and economic growth [
1]. Especially during the 11th Five-Year Plan (2006–2010) and the 12th Five-Year Plan (2011–2015) periods, the crude steel output in China increased from 423 million tons (Mt) in 2006 to 804 Mt in 2015, which is an increase of 7.4% annually [
2]. As a pillar promoting China’s national economic growth, the ISI has played a key role by providing industrial products, promoting employment, and constructing national infrastructure. However, China’s ISI is an energy- and emission-intensive industry. Its proportion of coal-related energy use was about 85.03% of the total energy consumption from 2000 to 2016 [
3]. From 2006 to 2015, the energy consumption of the ISI increased 1.5 times from 428 to 640 Mt. The amount of CO
2 emitted by the ISI in 2015 was 1.53 times that in 2006. During this period, the ISI accounted for 14.7% and over 10% of the total Chinese energy consumption and CO
2 emissions, respectively [
4], which is one of the main reasons for the frequent regional haze and air pollution in China, threatening human health and sustainable regional development.
Green development can overcome resource and environmental bottlenecks, provide guidance for industrial transformation and upgrading, and promote the construction of an ecological civilization in China [
5]. To achieve the green and low-carbon development of the ISI, the Chinese government has promulgated a series of policies. In 2010, guidelines on energy conservation and emissions reductions for the ISI were issued to eliminate 125.4 Mt of blast furnace capacity under 400 m
3 as well as 28.2 Mt of converter and electric furnace steelmaking capacities under 30 t by the end of 2011. In 2012, a guidebook was published, requiring advanced and applicable energy savings and emissions reduction technologies to be applied in the ISI. The Iron and Steel Industry Adjustment and Upgrade Plan (2016–2020) was introduced by the Chinese government in 2016, emphasizing that the production capacity of crude steel would decrease by 100–150 Mt by 2020. In this context, exploring the ISI’s green development and its driving forces could not only determine the potential for energy savings and carbon reduction, but could also identify a precise, green, and sustainable development path for other industries in China.
The concept of a green economy was first introduced in the Green Economy Blueprint in 1989 [
6]. Since then, many institutions and scholars have defined green development from different perspectives [
7,
8]. The Organization for Economic Cooperation and Development (OECD) defined green development as “pursuing economic growth and development while offering resources and environmental services for human demands” [
9]. The aim of green development is to promote the sustainable development of the economy, society, and environment [
10]. Thus, factors related to the economy, society, and ecological environment should be considered in the evaluation of green development [
11]. In China, green development means environment protection, improvement of resource use efficiency, and economic growth [
12]. The 19th National Congress of the Communist Party of China (NCCPA) emphasized that the harmonious development of humans and nature is the new concept of green development.
In previous research studies, many scholars have focused on the relationship between economic growth and the environment, such as the relationships between carbon emissions and economic growth [
13]; economic growth and energy consumption [
14]; and economic growth, energy intensity, and carbon emissions [
15]. Balancing the two systems is the key to achieving green development. The studies related to green development can be divided into two groups: those suggesting that green development should be formed by policy and regulations [
16,
17] and those focusing on evaluation methods for green development, mainly including composite evaluation index systems and green development efficiency (GDE) measures. Some scholars have measured the level of green development by constructing complex indicator systems, such as the evaluation index system for China’s green economy development [
18], the green development evaluation index system based on a multi-level evaluation method and the entropy method [
19], the green development integrated weighting method [
11], and the urban green growth efficiency evaluation index system [
20]. However, the evaluation results for the green development produced using such methods may be biased because the selection of system indicators was subjective [
21]. Two methods can be used to evaluate GDE: data envelopment analysis (DEA) [
5,
21] and stochastic frontier analysis (SFA) [
22] models. The SFA model should include certain settings related to the form of the production function and shape of the efficiency boundary [
23]. The DEA model does not require estimation parameters to be set, which may avoid bias in the estimation results caused by inappropriate assumptions [
23] and is why this method has become a popular for evaluating GDE [
24].
Regarding the regional perspective of the above studies, the GDE evaluations have mainly been performed at the regional and city levels. At the regional level, Feng et al. found that GDE levels in developed regions and countries had been leading since the 21st century, while GDE levels in developing regions and countries showed a downward trend [
25]. Zhu at al. explored China’s interprovincial GDE using the super slack-based measure (super-SBM) model for 1999–2016 [
5]. Zhou and Deng indicated that the green economic efficiency in coastal areas of China is higher than that in Western China [
26]. At the city level, Zha et al. analyzed the development efficiency of the low-carbon tourism economy of 17 cities in Hubei province in China, adopting the SBM-DEA model [
27]. Guo et al. measured the GDE of 34 cities in Northeast China based on the SBM-DEA model and indicated that significant spatial differences exist among the cities [
21]. Chen et al. evaluated the industrial land green efficiency of 198 cities in China and found that cities with high industrial land green efficiency are mainly concentrated in the eastern region [
28].
In addition, the forces driving GDE must be explored, as this is not only conducive to analyzing the potential and path of energy-savings and carbon emissions, but also provides specific guidance for policies and recommendations. Some scholars have found that energy price, technology progress, foreign direct investment, environmental protection, energy conservation, and emission reduction policies can promote the improvement of GDE [
5,
21,
26,
29], whereas openness, urbanization, industrial structure, climate change, energy consumption structure, and environmental regulation hinder its improvement [
5,
21,
30]. Feng et al. found that the relationship between GDP per capital and GED for global 41 regions presents a significant inverted U-shape [
31]. A U-shaped relationship exists between industrial agglomeration and GDE [
21]. Zhu et al. found that industrial structure rationalization and advancement both positive affect the improvement of GDE [
5]. Zhu et al. found that the carbon-trading mechanism, research and development intensity, and pollution control investment have a positive effect on GDE [
32]. However, the same driving forces were reported to have different impacts on efficiency improvement because of the different research objects and methods. For instance, Su and Zhang found that urbanization promotes the improvement of the regional economy efficiency [
33], whereas Zhu et al. indicated a negative effect of urbanization on the improvement of GDE [
5].
Based on the above analysis of the literature, GDE has been comprehensively evaluated. However, some research gaps still exist follows: Firstly, existing studies on the ISI mainly concentrated on energy efficiency [
34], pollution control efficiency [
35], energy and carbon emission efficiency [
3], green growth [
29], and productivity evolution [
31] from the perspectives of regions and firms. None of them constructed an integrated framework measuring China’s provincial GDE in the ISI, which could promote technology progress and the development of a low-carbon industry. Secondly, in many studies, China’s provinces were divided into different regions based on geographical location, which cannot reflect the changes in production technology [
3]. Thirdly, the selected factors influencing GDE did not consider regional or industrial characteristics. Many scholars explored the factors influencing GDE based on the entire region or industry, which is not conducive to recognizing heterogeneous influences for different regions.
In this study, the above limitations were observed, and the main contributions are presented as follows: Firstly, a unified framework was constructed for evaluating the GDE of the ISI in China’s 28 provinces using the super-SBM model, considering the research and development (R&D) expenditure input for the period of 2006–2015. Secondly, China’s provinces were divided into different groups according to differences in R&D input and GDE value, and the differences and change trends of the ISI’s GDE were analyzed from the nation, group, and region levels. Thirdly, we selected factors influencing GDE based on the characteristics of the ISI and explored their impact on GDE using a Tobit panel regression model.
The remainder of this paper is structured as follows.
Section 2 describes the used methods, data sources, and variables.
Section 3 introduces the empirical results and discussions.
Section 4 summarizes our conclusions and related policy implications.
4. Conclusions and Policy Implications
4.1. Conclusions
Measuring GDE is important for upgrading the structure and green development of China’s iron and steel industry. Adopting the super-SBM model, we evaluated the GDE of the ISI in China’s 28 provinces during the period of 2006–2015. The empirical results were analyzed from three perspectives: nation, province, and region. We divided the 28 provinces into different groups according to their R&D expenditure inputs and GDE values. Then, a Tobit model was used to explore the factors influencing the improvement in GDE. The main conclusions were drawn as follows:
Firstly, the GDE value declined over time from 0.628 in 2006 to 0.571 in 2015, showing an average decrease of 1.1% annually. However, during 2006–2008, the GDE demonstrated an upward trend, and the efficiency value in 2008 (0.653) was the highest in the study period. The average GDE values of 75% of the provinces were less than that in the ISI, indicating that many provinces have huge potential for energy conversion and reduction of carbon emissions in the ISI. Beijing had the highest average GDE value for the ISI, while Shanxi had the lowest.
Secondly, provinces were divided into four types based on R&D expenditure and GDE value. (1) Provinces with high R&D expenditure and low GDE were Liaoning, Anhui, Fujian, Shandong, Hunan, Guangdong, Sichuan, and Shanxi. They showed huge potential to enhance the ISI’s GDE. (2) Some provinces, i.e., Beijing, Inner Mongolia, Jilin, Guizhou, Shaanxi, and Xinjiang, had low R&D expenditure input and high GDE, showing that green transformation has produced considerable effects in these provinces’ ISI. (3) Provinces with high R&D expenditure input and high GDE were mostly located in the eastern region. (4) Provinces with low R&D expenditure input and low GDE were located in the central and western regions.
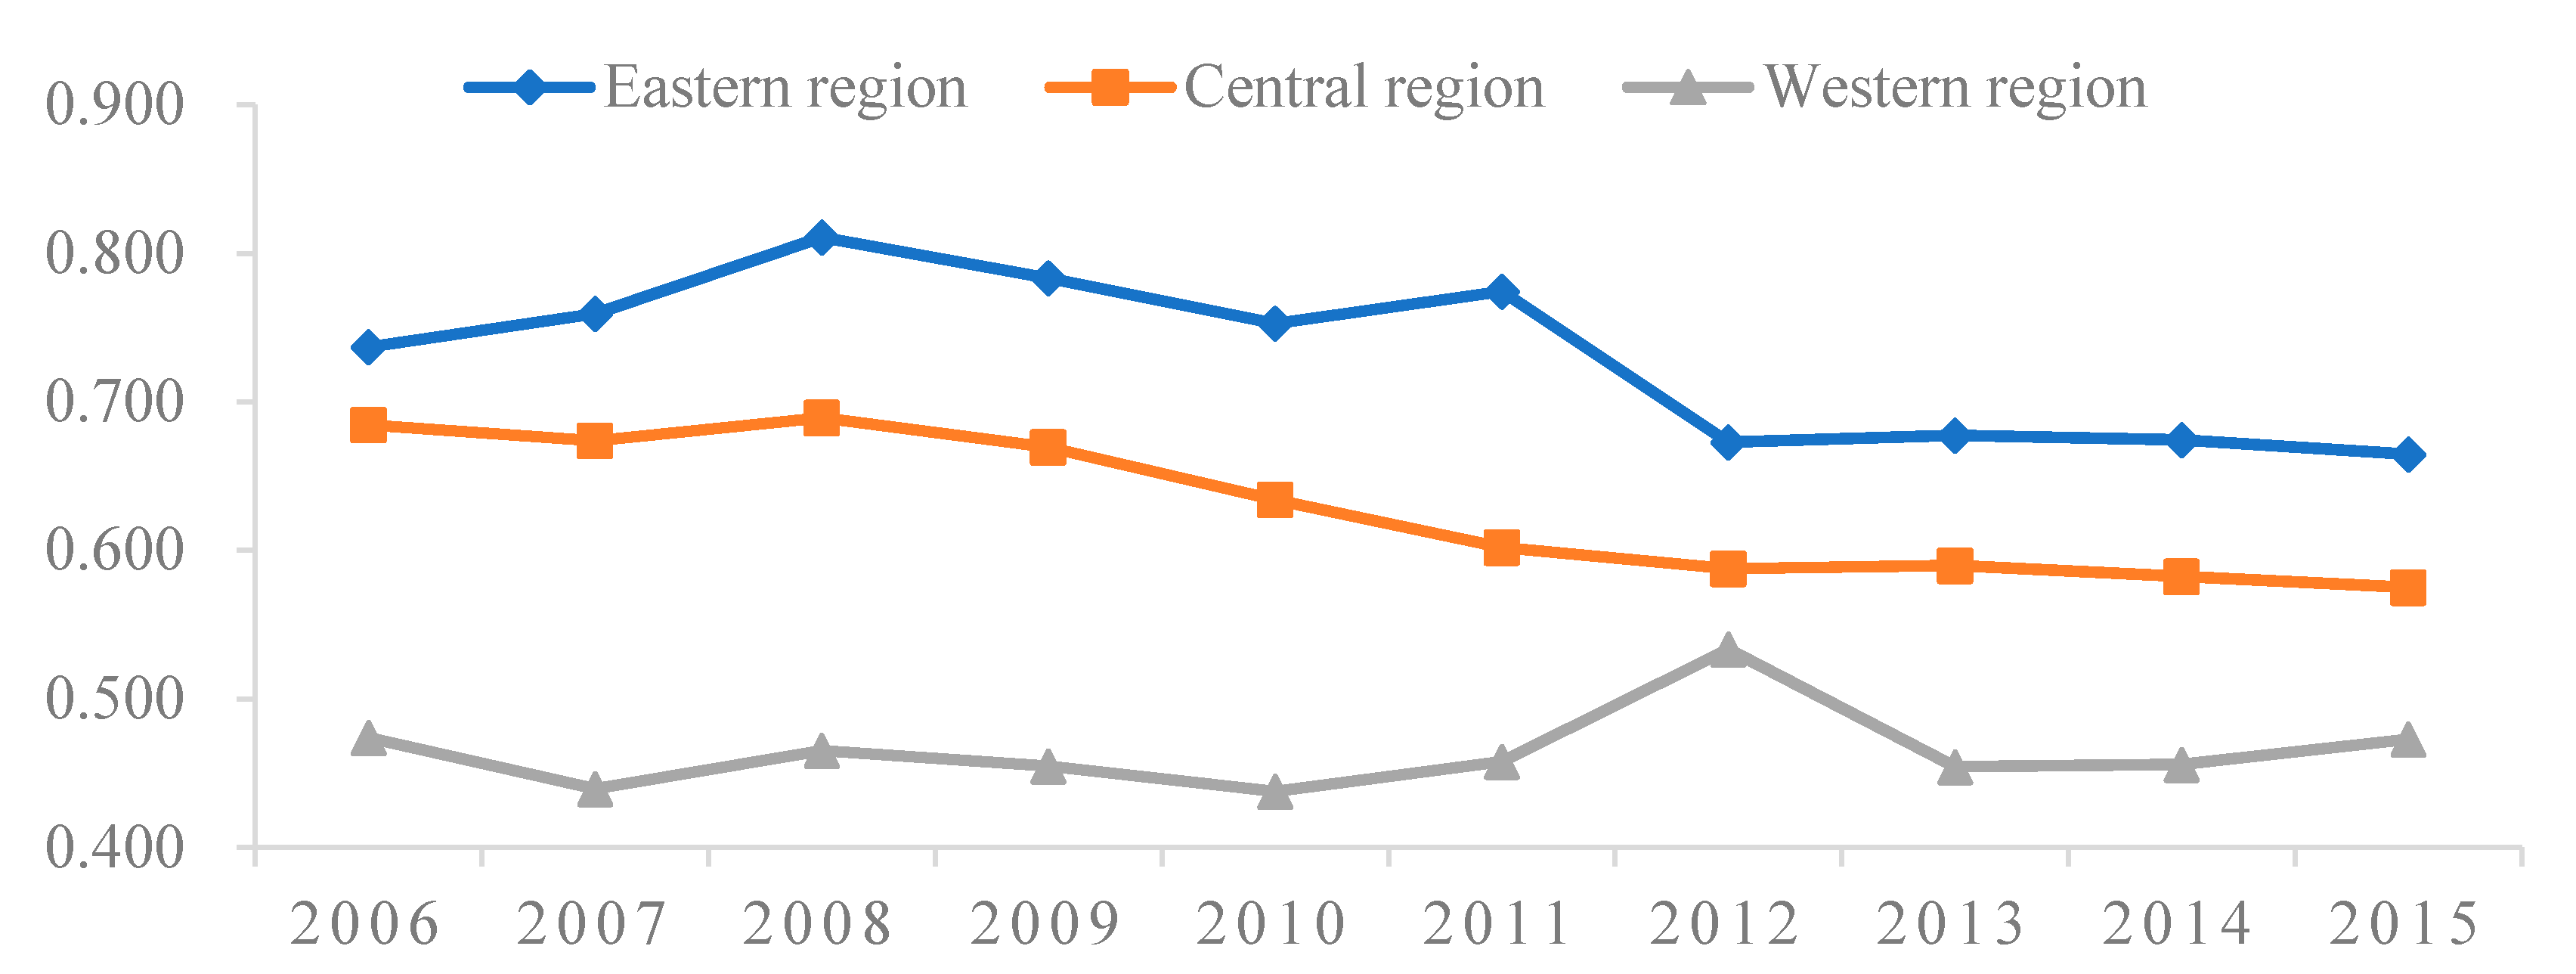
Thirdly, during the research period, the GDE of the ISI showed significant heterogeneity among the different regions. The average GDE of the ISI in the eastern and central regions was 0.731 and 0.629, respectively, which are higher than the 0.465 in the western region. Further, the GDE in the eastern and central regions showed a declining trend, decreasing by an average of 1.14% and 1.92%, respectively, per year. In contrast, the ISI’s GDE in the western region was steady at 0.474 in 2006 and 0.473 in 2015.
Fourthly, certain factors, i.e., export demand, property structure, and capital investment, had significant positive effects on the ISI’s GDE in the eastern and western regions, while energy consumption structure and industry scale had negative impacts on the improvement in GDE in the central region.
4.2. Policy Implications
The specific policy recommendations for the improvement of GDE in China’s ISI are proposed as follows:
Firstly, for provinces with high R&D expenditure input and low GDE, the government should focus on the impact of R&D investment in technology on the updating of industry structure and strengthening the application of green technology in the ISI. The technology innovation capacities should be improved by strengthening the relationship between scientific research institutions and production sectors [
21]. In addition, supervising the use of R&D investment is important to avoid the crowding-out effect of industry development. For provinces with high R&D expenditure input and high GDE, R&D expenditure should be increased in energy-saving and emission reduction technologies in the ISI. For provinces with low R&D expenditure input and low GDE, the government should continuously increase the R&D investment in technology innovation and green development. Investment should be accelerated to improve opening up and promote the spillover and diffusion of knowledge and technology in provinces with lagging economic development. For provinces with low R&D expenditure input and high GDE, advanced technology should be cultivated and highly-skilled workers should be introduced.
Secondly, resource and energy use should be improved. It is necessary to change the structure of energy consumption and increase the proportion of green and renewable energy in total energy consumption. The government should strengthen and popularize the application of clean coal technology in the ISI. In addition, the industry scale of the ISI should be controlled. It is necessary to inhibit the crowding-out effect caused by expanding industry scale on the efficiency of improvement.
Thirdly, increasing the ISI’s exports should apply advanced production technology and obtain management experience from foreign industries, as well as force enterprises to improve the quality of the product and increase awareness of environmental protection. The government should issue some policies, such as tax credits and subsidies, to enhance the international competitiveness of enterprises [
42]. In addition, the reform of stated-own enterprises should be continuously deepened, playing a more significant role in the green and low-carbon development of the ISI.
4.3. Limitations and Future Research
There are some limitations in this study. First, the DEA method assumes the homogeneity of DMUs. However, the production technology is widely different in the ISI of each province. Second, the undesirable output only included carbon emissions calculated based on the Intergovernmental Panel on Climate Change guidelines because of data availability. Third, we did not analyze the ISI’s GDE in specific economic zones in China, such as Central Bohai, Pearl River Delta, and Yangtze River Delta. In the future research, the following should be emphasized. First, we would further expand the research period to analyze the GDE in China’s ISI. Second, the research results should be calculated using and compared with other models. Third, we should further investigate the relationship between environmental regulation and GDE from the perspective of spatial correlation. Fourth, the ISI’s GDE in China’s specific economic zones could be further explored, such as Central Bohai, Pearl River Delta, Yangtze River Delta, etc.


