Article

Development and Assessment of a Web-Based National Spatial Data Infrastructure for Nature-Based Solutions and Their Social, Hydrological, Ecological, and Environmental Co-Benefits

Department of Civil and Environmental Engineering, University of Houston, Houston, TX 77204-4003, USA
*
Author to whom correspondence should be addressed.
Sustainability 2021, 13(19), 11018; https://doi.org/10.3390/su131911018
Submission received: 6 September 2021 / Revised: 29 September 2021 / Accepted: 1 October 2021 / Published: 4 October 2021

Abstract

:
Comprehensive datasets for nature-based solutions (NBS), and their diverse relationships have not yet been accumulated into a deployable format. This research describes the development of a novel National Spatial Data Infrastructure (NSDI) system for NBS co-benefits throughout the contiguous United States. Here, we gather and integrate robust geospatial datasets from the social, ecological, environmental, and hydrologic domains using seamless, cloud-based data services to facilitate the trans-disciplinary assessment of NBSs as a function of society and Earth. This research enhances practical decision making and research by assimilating web-based datasets and describing the missing links between national policy and robust adoption of NBSs as a sustainability solution. This NSDI serves to foster participatory planning capabilities and integrate local sustainability goals into decision–support frameworks. Such a platform strengthens the knowledge base necessary for addressing multiple, co-evolving issues of societal relevance, an essential component of fully espousing NBSs within the realm of socio-technological systems and improving policies and implementation regarding sustainable solutions. The efficacy of the proposed platform to serve as a holistic data information system is assessed by exploring important characteristics associated with geospatial NSDI tools, namely, openness, spatial functionality, scalability, and standardization. By placing GIS strengths and weaknesses in the context of transdisciplinary NBSs, we reveal strategic directions toward further co-production of such NSDIs. We conclude with recommendations for facilitating a shared vision of transdisciplinary technologies to strengthen the amalgamation of broad co-benefits and multi-disciplinary influences in sustainability planning.

Graphical Abstract

1. Introduction

Flooding is the most prevalent and influential natural disaster in the world, causing more economic damage and affecting more people than any other natural event [1]. Water processes are subject to stressors from intensified climate change and human development patterns, with over two-thirds of the global population projected to reside in urban areas by 2050 [2]. Traditional stormwater networks for mitigating flooding, known as greywater systems, are typically comprised of concrete and metal infrastructure designed to quickly transport rainfall offsite and into bodies of water. As climate change and urbanization increase the frequency and severity of flooding, communities are transitioning from sole reliance of greywater systems toward hybrid green-greywater systems using nature-based solutions (NBSs). NBSs strategically incorporate natural materials, such as vegetation and soil, into the urban fabric to slow the course of stormwater flow through on-site evaporation and infiltration [3]. Common NBS technologies include rain barrels, vegetative swales, green roofs, permeable pavements, rain gardens, wetlands, native plantings, and naturalized streams. In addition to mitigating stormwater, NBSs have been associated with improved mental and physical health, social vulnerability, crime rates, and economic prosperity through enhanced levels of greenspace [4,5,6]. NBSs also provide environmental benefits through abatement of urban heat levels, air and water quality, noise pollution, and greenhouse gasses [7,8,9]. The UN deemed NBSs as an essential component toward achieving the Paris Agreement, providing up to one-third the necessary emissions’ reduction by 2030, and declared an NBS Climate Manifesto (2020–2030) to scale-up NBS adoption globally [10]. Moreover, NBSs contribute to conservation efforts by enhancing ecosystem diversity and connectivity [11].
While such utilities have been widely noted within the literature, traditional NBS planning prioritizes flood mitigation with less attention to co-benefits due to a lack of representative datasets [4]. In this way, NBS multi-functionalities are assumed to propagate throughout the system without an explicit representation of their locational benefits, thus limiting the maximum potential of NBSs to mitigate cross-cutting issues within the urban fabric. A right first step toward fully encompassing NBS multi-functionalities is to represent overlapping phenomena as explicit functions of space. Toward this aim, we suggest the combination of cloud-based geographical information systems (GIS) with curated web mapping applications to facilitate two-way interaction between users and integrated datasets across disparate domains (i.e., sociology, hydrology, ecology, environmental science). In this study, we present the geospatial framework for such a web-app and describe the development of an open-access prototype, called NBS-Geo, for use within the contiguous United States.
Here, we suggest the use of comprehensive web-based datasets as a means toward better understanding how NBSs impact the surrounding environment while also investigating how local characteristics, in turn, may impact the efficacy and co-benefits of NBSs. By harnessing the power of web-based GIS, we transition toward building a measurement framework that can be employed across diverse regions to develop generalizable insights for NBS systems. Web-based GIS is defined here as a GIS system that utilizes cloud technologies to communicate data, functionality, and user-interface through online mapping. Web-based GIS applications have increased significantly in recent years due to improvements in cloud computing and storage [12]. As high-resolution datasets for Earth–system sciences have proliferated with advances in remote sensing technologies, web-based GIS tools for environmental applications have become more common [13]. Data discovery, visualization, processing, and analysis techniques have been improved through web-based GIS for various topics such as hydrology (i.e., HydroDesktop [14]), ecology [15,16], Earth observations (i.e., JEODPP [17], Google Earth Engine [18]), and site-specific issues of integrated phenomena (i.e., [19,20,21]). While such data platforms have successfully linked users with vast amounts of data, the results continue to be in the format of search-and discovery, with the user needing an idea of what types of data to investigate for their end-goals. These GIS services have also been typically constrained to a singular domain and/or study area with limited inclusion of overlapping information from diverse epistemologies, thereby limiting their use for understanding the complex, multi-functional impacts associated with NBS implementation.
To amalgamate GIS services toward enhanced NBS decision making, we necessitate multidisciplinary datasets that are geospatially robust, user-friendly, and curated for specific properties of societal and environmental importance. Within the NBS literature, studies have linked stakeholder interaction with web-apps for decision making (i.e., [22]). However, in such applications, the users are still required to supply the local data layers and are limited in which types of information the tools will accept (i.e., it is not possible to search various data layers and then decide which criteria are most important). Other applications have compiled various datasets pertinent to NBS planning in a web-based framework (i.e., [23]) but are location specific and are generally presented at a coarse scale. Many of the latest NBS web applications described by [24] tend to be information portals designed to inform the user of generalized co-benefits through textual descriptions and do not contain spatial evidence for local siting. A 2018 panel by the United Nations Intergovernmental Panel on Climate Change (UN IPCC) assessed the state-of-the-art for NBS decision making and noted a considerable research gap regarding holistic data frameworks for identification of local characteristics and spatial trade-offs. The UN IPCC panel noted a particular fragmentation of social reference data within NBS science and urged a rapid development toward novel data streams that could facilitate transdisciplinary research [25].

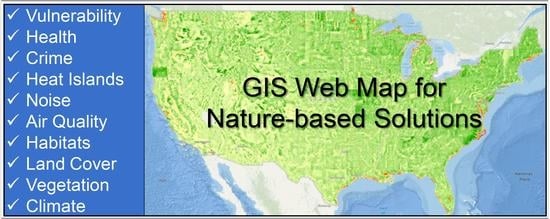
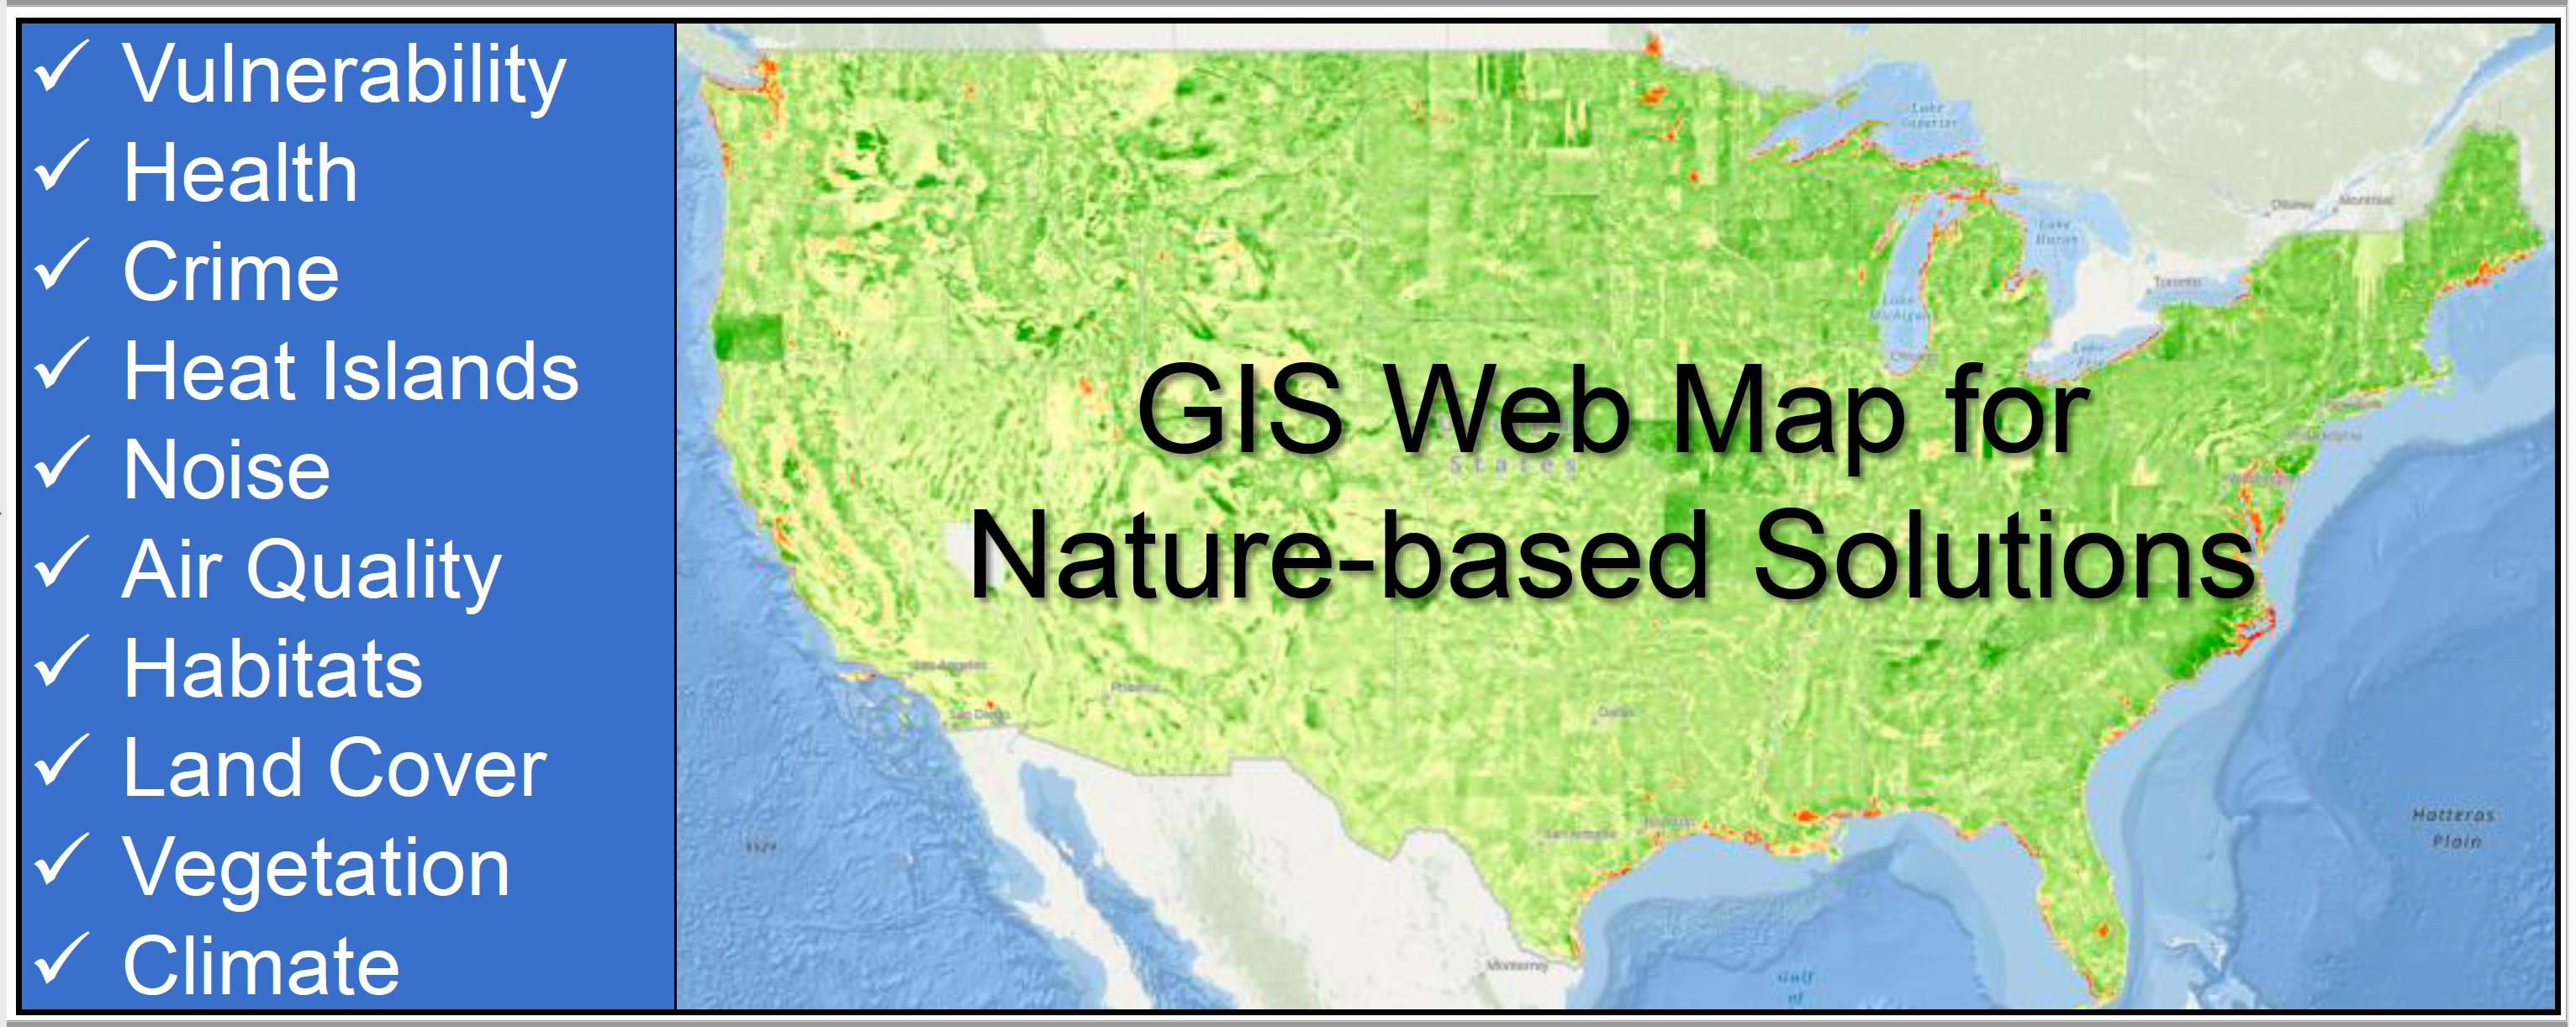
2. NBS Multi-Functional Datasets

To link researchers and practitioners with comprehensive data layers associated with NBSs, we performed an extensive literature review of the co-benefits that have been associated with widespread NBS implementation. NBSs have been shown to provide significant abatement of air and water pollutants, aid ecosystem connectivity, and preserve biodiversity through enhanced green spaces in the urban environment [4,7,26,27]. Additional co-benefits have been widely demonstrated throughout the literature, including improvements in societal wellbeing, mental health, recreation, community, energy demand, urban heat, carbon sequestration, social capital, economic viability, crime, and noise pollution [28,29,30]. Table 1 summarizes the co-benefits association with NBSs according to the literature review.

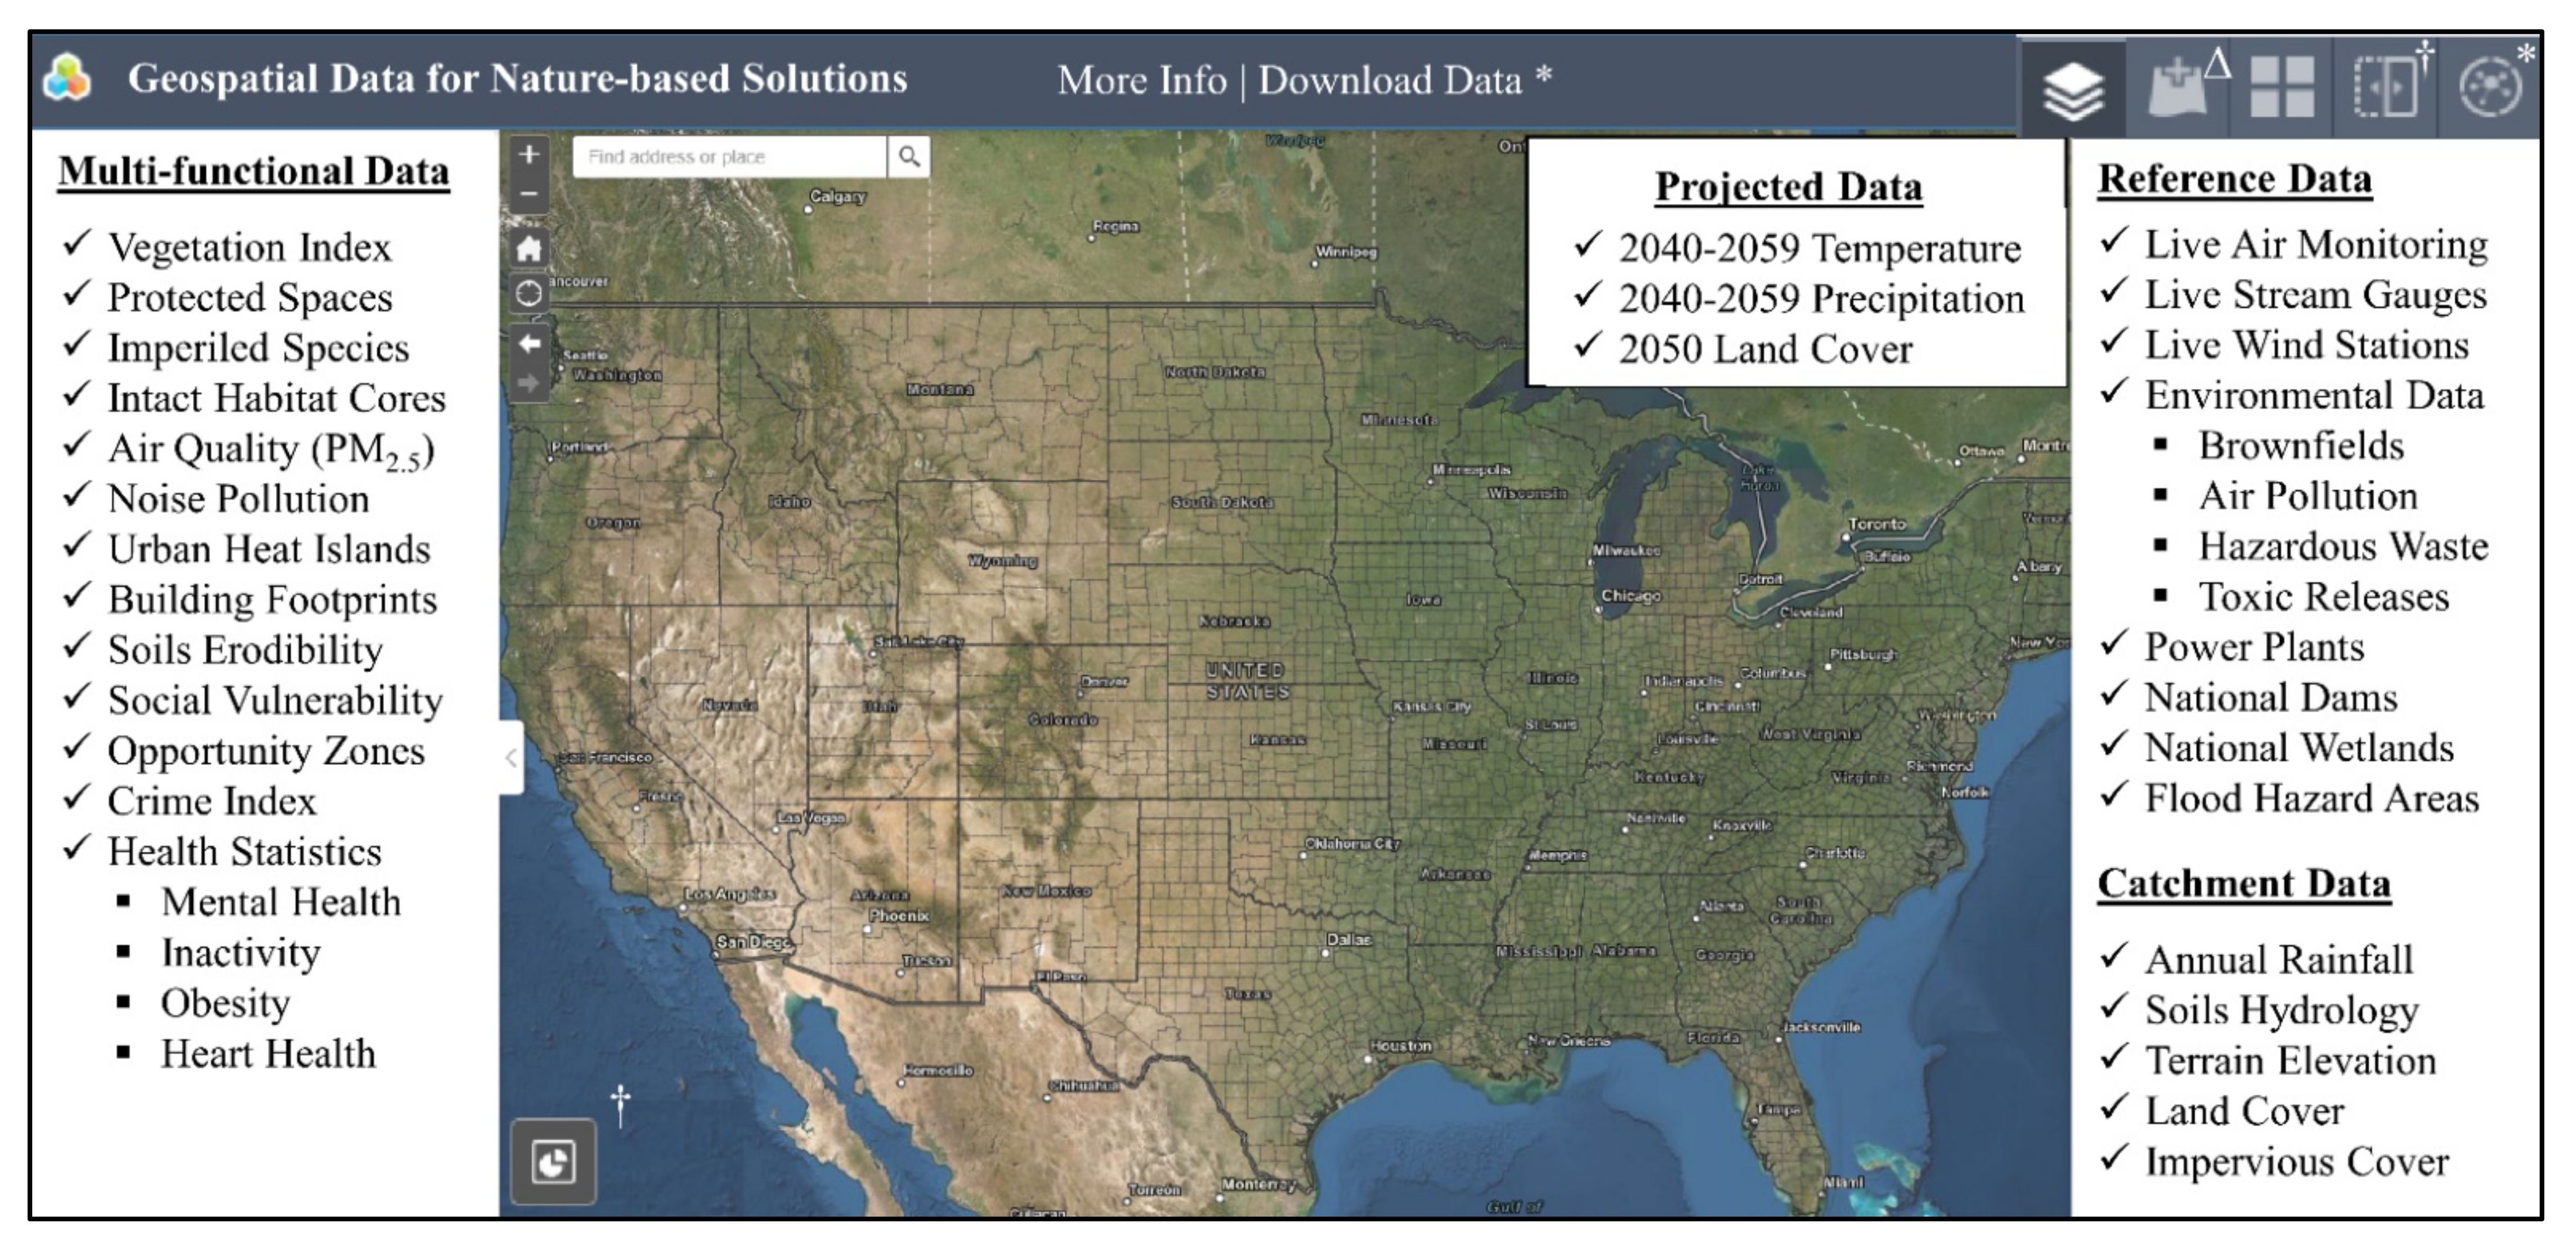
3. NBS-Geo Sustainability Tool

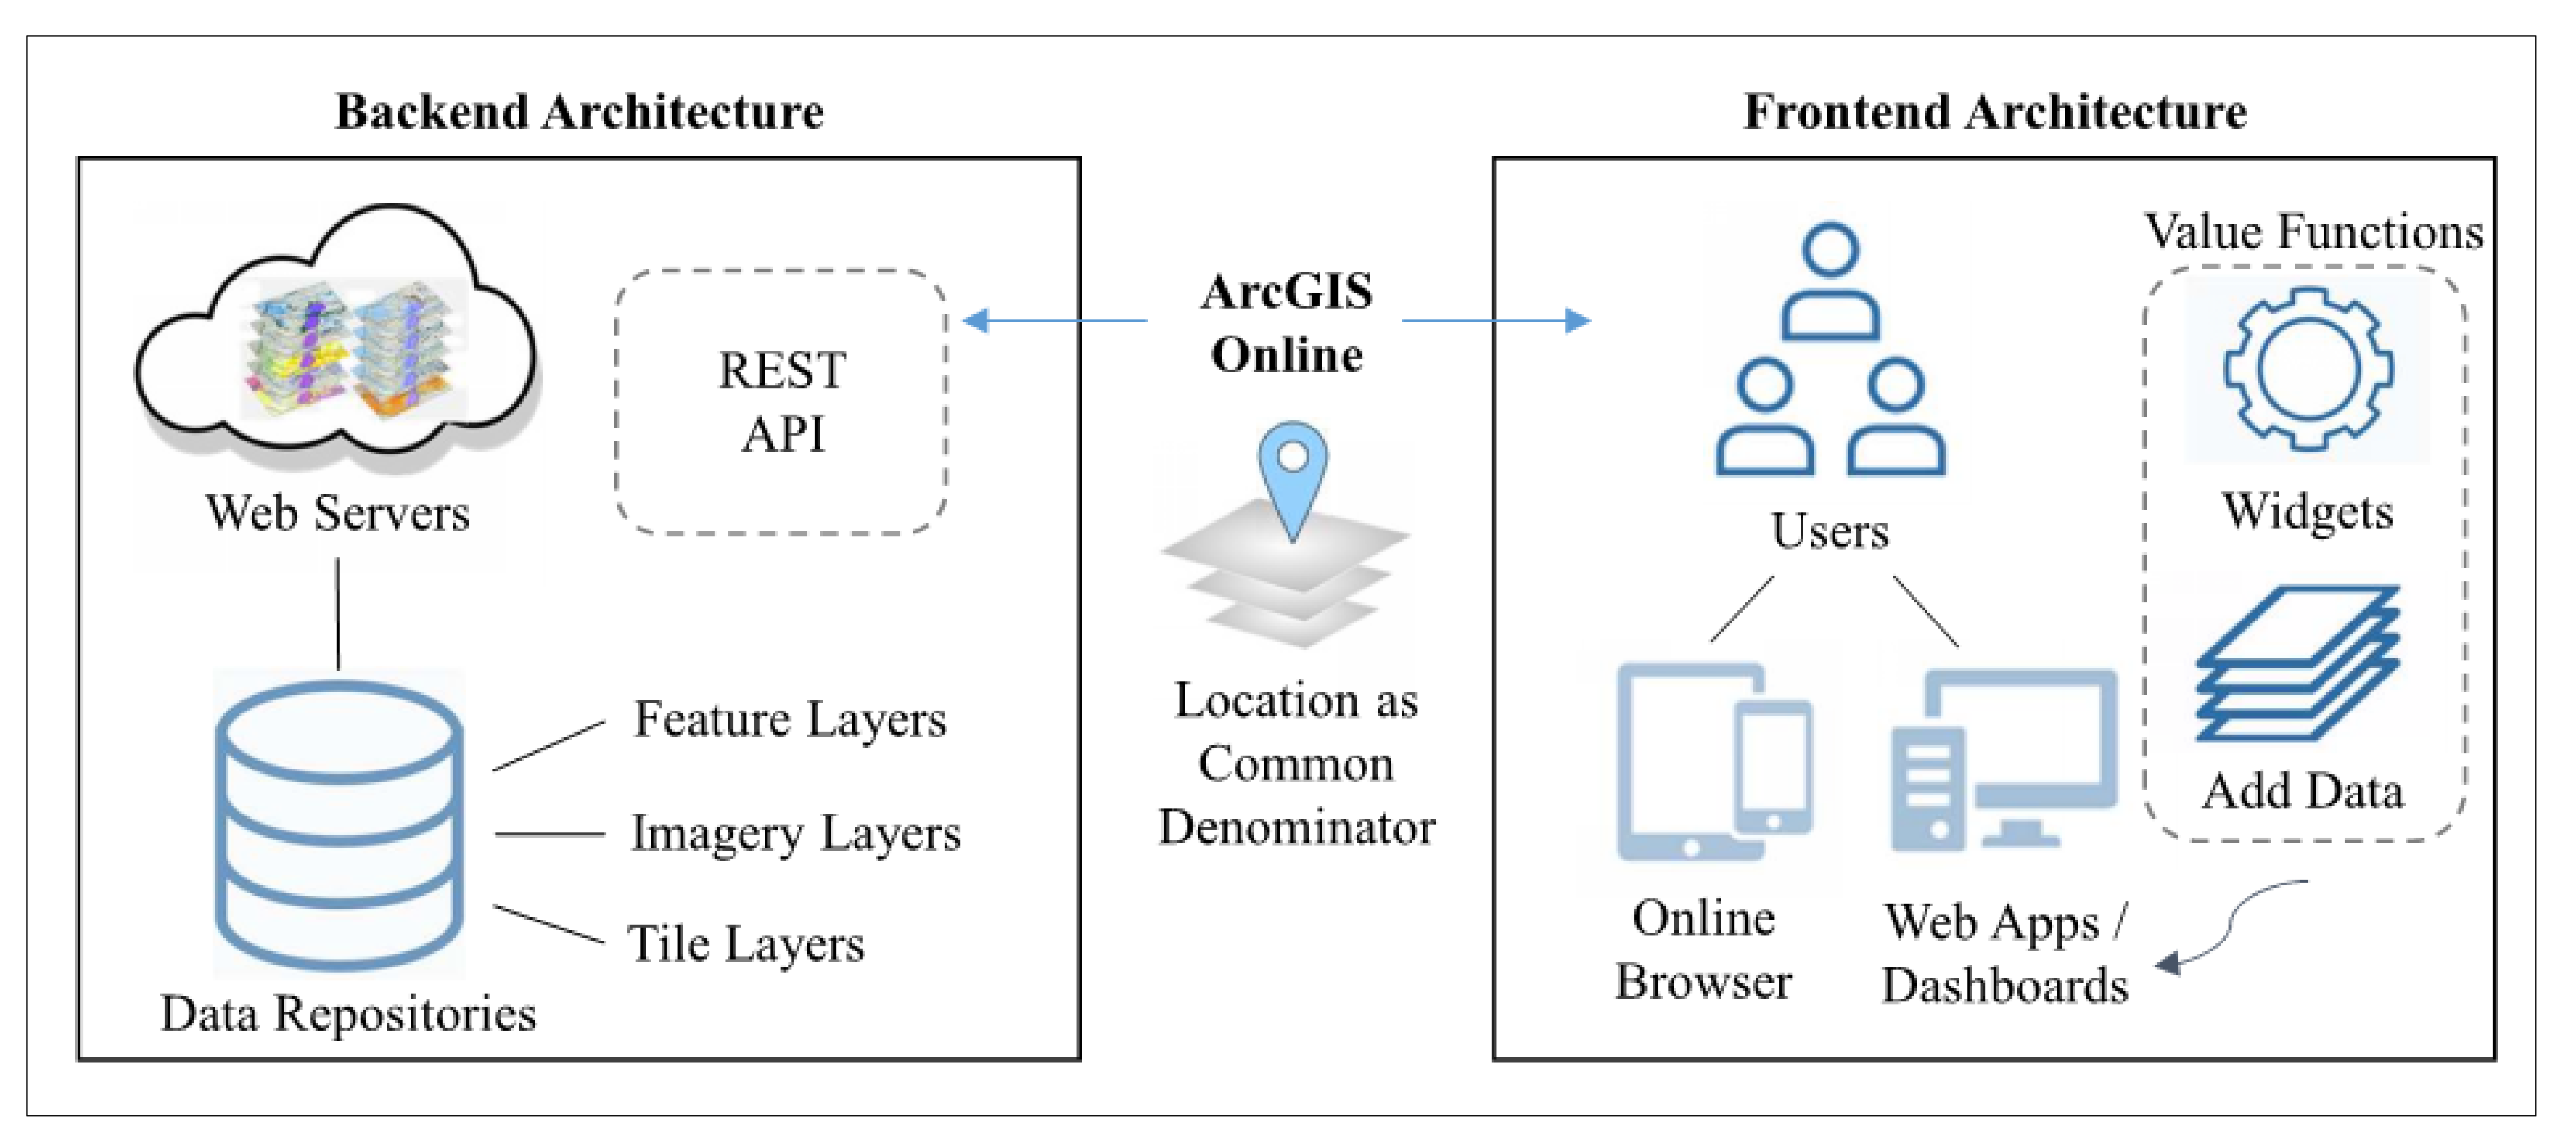
3.1. System Architecture

Model architecture for cloud-based web applications describes a combination of structural layout and functional capability of the webGIS platform [100]. Here, we derived a national information system using cloud-based geospatial data layers that are seamless across the entire contiguous United States (CONUS) by extrapolating from Esri’s ArcGIS Online service-oriented architecture. ArcGIS Online is an online gateway to cloud-based maps, layers, and data services, whereby a user interface forms the basis for accessing an array of spatial datasets and functions. We leveraged the ArcGIS online platform to create a curated spatial mashup applicable to NBS multi-functionalities. Spatial mashups are common components of web-based GIS whereby numerous geospatial datasets are overlaid within one user interface for easy access and rapid assessment of multiple sets of information [101] and are becoming increasingly popular in environmental applications [102,103,104]. The ensemble data mashup was derived from Esri’s Living Atlas of the World (aka “Living Atlas”) data repository, which is an extensive collection of ready-to-use geospatial data layers from governmental, academic, and civil service users throughout the world. The Living Atlas uses REST servers to host and transfer the data layers, which may be accessed in the ArcGIS portal through a simple web uniform resource locator (URL) address [105].
Spatial mashups were spawned after the advent of Asynchronous JavaScript and XML (AJAX) technologies, which are used to send and receive datasets from a remote server without disrupting user interactions. The success of AJAX led to the development of various Application Programming Interfaces (APIs), which allowed combination of remotely sensed and user-defined local data to create customized mashups. APIs provide software-to-software capabilities, beyond the traditional user-to-software interactions, thereby facilitating combination of different web services and rapid retrieval and linkage of numerous online repositories simultaneously [12]. ArcGIS Online, which is a core component of the approach used in this study, is an example of a widespread geospatial mashup that leverages API technologies to connect users with data and additional interactive capabilities, including widgets and spatial tools, to foster communication and collaboration across disciplines. In ArcGIS Online, numerous maps and map servers are packaged through a standardized interface known as the Representational State Transfer (REST) API. This service-based architecture allows for a bridging of the knowledge gap between data and users, thereby facilitating engagement of multiple disciplines across varying scales [12]. This geospatial architecture is demonstrated in Figure 1.

3.2. Comprehensive Datasets

Representative geospatial layers were located within the Living Atlas data repository and curated for the NBS-Geo mapping application to encompass cross-domain NBS functionalities, as summarized in Table 2. The data sources referenced from the Living Atlas cloud had been previously hosted by various governmental agencies, academic institutions, non-profit organizations, and geospatial corporations (further described in Supplementary Information). The datasets selected for inclusion within NBS-Geo were categorized into the following themes: (1) NBS-multifunctionality, which integrated various social, ecological, environmental, and hydrological co-benefits associated with NBSs, (2) prediction, which comprised several projected data layers for supporting scenario analyses of future climatic and societal conditions in NBS planning, (3) reference datasets, which were added to assist the user with general spatial grounding and further cross-domain spatial considerations, and (4) hydrological datasets, encompassing various watershed properties used in standard hydrological modeling schemes (see [106] for more information regarding how such geospatial datasets may be used to perform watershed delineation and to estimate common hydrological parameters). Each hosted data layer had been categorized within ArcGIS Online as authoritative, subscriber, or premium content, further described below:
  • Authoritative content: Authoritative content includes data from a national mapping agency or governmental entity that has been reviewed and vetted by Esri as reliable. Such content is recommended as the best-available data from the hosting agency and is proposed to be well-maintained over time.
  • Subscriber content: These layers require an organizational subscription for access, including various satellite-based, large-scale data layers, demographical layers, and historical maps. An organizational subscription for Esri content is free, although many web users do not have organizational account access readily available. To eliminate this hindrance, and to provide the NBS-Geo tool to the general public at no cost, we leveraged the University of Houston’s organizational account credentials to pre-authorize subscriber content via the layer’s source (i.e., the REST service endpoint) [107], thereby enabling use of the full web mapping application functionality without logging in to an Esri account.
  • Premium content: Premium content is subscriber content that consumes credits within the subscriber’s organizational account. The only layer within NBS-Geo that had been categorized as premium content was the crime index. We pre-authorized this data layer through the University of Houston’s organizational account to allow public access. We then imposed daily usage limitations of this dataset within the web application [107], which are only triggered when the crime index layer is selected for display, in order to minimize overall consumption of our organizational subscription credits.

3.3. Sustainability Tool Framework

By linking users to holistic datasets through organizational web credentials, we leverage cloud-based data repositories for improved integration of spatial data directly within environmental decision making [108]. In our workflow for NBS-Geo, we first created an ArcGIS Online map to curate and compile the disparate data sources identified for transdisciplinary NBS planning, described in Section 3.2. By leveraging the power of pre-assembled data servers, we alleviated the need to manually: (1) search from a variety of diverse institutional websites and validate each source, (2) download, extract, and compile numerous datasets, each with unique formats (i.e., ASCII, FTP, TIFF, LAS, XYZ, CAD, NetCDF, etc.), (3) extract and mosaic the datasets to the study area, and (4) process the layers into common projections and typologies for spatial analysis operations. The web map, and thus the referenced datasets, were hosted through the University of Houston ArcGIS organizational account to provide open access for all public visitors to the mapping website. Descriptive metadata was added to the NBS-Geo homepage (http://tinyurl.com/nbsgeohome, accessed on 3 October 2021) for proper accreditation and ease of locating the tool online through common keywords. A brief demonstration video was also created and linked to the NBS-Geo homepage to showcase the various user-friendly mapping features. The web map was then converted into a web application using the ArcGIS Web AppBuilder wizard, which involved selecting a pre-defined theme and customizing the user interface of the map with curated widgets. The cloud-based data layers within the web map were further categorized within the web app according to NBS functionality, reference datasets for spatial grounding, catchment datasets for hydrological modeling, and projected climate and land use datasets, as shown in Figure 2. Detailed information for each dataset was provided through the “More Info” link within the web-app ribbon, referencing URLs that described the dataset authors, licenses of usage, creation background, symbols, and assumptions (see Supplementary Information).

3.4. Value-Added Tool Functions

A widget was added to the NBS-Geo ribbon (far-right icon, *, in Figure 2) that allows users to download select extractable datasets, including live air monitoring, environmental facilities, power plant facilities, dams, air quality, social vulnerability, opportunity zones, and health statistics, to the user’s computer according to a specified spatial boundary. For a featured data layer to be extractable within the ArcGIS Online platform, the data owner must have specifically enabled user-exportation capabilities. Many of the data layers pertinent to landscape analysis and hydrological modeling were not enabled for direct web-based extraction. Therefore, we adapted a previous tool called HMS-PrePro [106] where the desktop-based ArcMap software may be used to connect the user with the Esri Living Atlas servers through temporary cloud-based feature images to extract pertinent datasets to the local computer according to a user-defined geospatial boundary. HMS-PrePro was designed for rapid pre-processing of cloud-based data layers into a format compatible with HEC-HMS hydrological software modeling. Here, we utilized the capabilities of HMS-PrePro to leverage image server layer capabilities and aid in bridging the gap between robust datasets and the end-user through cloud-based technologies. Several of the datasets available for extraction using the customized toolbox included: soils erodibility factor, soils hydrologic group, flood hazard areas, average precipitation, terrain elevation (low and high resolution), land cover (years 2016 and 2050), and impervious coverage. The “Download Data” link in the middle of NBS-Geo toolbar (*) routes the user to a GitHub repository containing the ArcMap Toolbox for data download. Various limitations associated with this approach to differentiate data download capabilities according to inherent dataset attributes are further discussed in Section 4.2.
Additional added-value widgets were included in the web application, as identified in Figure 2 with the (†) symbol. The bottom-left (†) icon represents a screening widget customized to allow visual exploration of various social vulnerability themes and their respective compositions within the user viewport. In the top-right toolbar of NBS-Geo, a sliding tool widget was added (†) for exploring the spatial differences between current and projected land cover classifications. This toolbar also includes an added-value widget, identified with the (∆) symbol, to allow uploading of user-defined geospatial data layers into the web mapping application for locally curated visualization. For example, if a jurisdiction possessed higher-resolution datasets than what is contained within the Esri Living Atlas server, the end-user can easily add their own geospatial data layers to the web mapping application for a fully customized assessment of local conditions. By utilizing such added-value widgets and tools, we transition from a large assortment of disparate geospatial datasets toward increased knowledge and user-derived wisdom.

4. Geospatial Suitability Evaluation

Here, we evaluate the applicability of NBS-Geo as an NSDI prototype for planning and researching NBSs across disparate domains. As emphasized by [109], effective NSDIs must be underpinned by an intuitive organizational structure, robust interoperability, and ease of sharing, discovery, access, and use. To this end, we analyze the extent to which NBS-Geo supports common GIS metrics of usability and reliability, namely: (1) openness, (2) spatial analysis functionality, (3) scalability, and (4) geospatial standards. We include recommendations for how improved geospatial web applications and data technologies could facilitate such goals. We build upon the work presented by [110], where the authors assessed the applicability and effectiveness of a national spatial data information (NSDI) system to progress urban sustainability rooted in equitable principles. In this study, [110] proposed a qualitative evaluation of three common characteristics associated with geospatial systems. First, a robust NSDI must contain a high degree of openness to encourage collaboration among public and private domains and improve widespread accessibility [111]. Second, the system should foster an ability for functional spatial analysis through streamlined formats and value-added data attributes. Finally, the geospatial standards associated with the NSDI must be consistent, easily accessible, combinable, and interoperable across platforms. We extended this approach to also consider the suitability of a NSDI framework for use across nested spatial scales, as suggested by the UN Intergovernmental Panel on Climate Change (IPCC) regarding NBSs and data science [25].

4.1. Characteristic #1: Openness

Openness describes the extent to which geospatial data platforms are attainable by interested users. Open and seamless geospatial technologies are more easily adopted by decision makers who are not well versed in GIS data processing. While the traditional suite of Esri desktop-based software is proprietary and requires a paid license subscription for access, the web version of ArcGIS Online may serve as a platform for sharing GIS data layers through semi-open architecture APIs and geospatial standards. We assessed the varying degrees of openness presented by [110] in our evaluation, specifically, fully open, limited-open, permitted-open, or private. Fully open describes the condition where all datasets and underlying metadata are fully available to all interested parties, fostering access across both public and private sectors. Limited-open means the complete dataset is not available to the public, but select sub-sets are available in an aggregated manner. Permitted-open describes the condition where datasets are available but are subject to additional limitations and permissions, according to the hosting agency’s conditions of use [110]. Private datasets are only available to authorized users within the hosting agency’s internal organization. In crafting the NBS-Geo web mapping application, we encountered various levels of openness within the Living Atlas repository, as described in Section 3.2 and summarized in Table 2.
Since the Living Atlas uses a combination of publicly authoritative and private vendor-based users for hosting created content, the resulting GIS web app was a mixture of fully open, limited-open, permitted-open, and private datasets. To facilitate public access for the web app without requiring prior ArcGIS organizational account credentials, fully private datasets that may have been otherwise included in the NBS-Geo curated content were strategically removed from the final web version (i.e., NatureServe’s biodiversity maps, see Supplementary Information). We recognize the organizational costs associated with gathering, managing, and hosting geospatial data, which may thereby limit its fully open accessibility. Nonetheless, we encourage additional ongoing development to facilitate the use of fully open datasets across disparate epistemologies. Particularly within the United States, there is an increasing urge toward geospatial data transparency, in which information produced using public expenditures (i.e., tax-payer money) should be made fully open and freely available to improve public involvement and policy making [112].
While our approach of pre-authorizing the ArcGIS Online organizational credentials provided a functional solution for public dissemination of NBS-Geo (as described in Section 3.2), we acknowledged several limitations associated with the semi-open nature of the Esri Living Atlas. For example, the user must still supply organizational credentials in order to download and subsequently perform spatial analyses on the underlying data. (The pre-authorization technique we imposed for public access only provides visualization capabilities and does not allow data extraction without a licensed Esri account.) We suspect this requirement for association with an organizational account is one of the main hindrances of widespread usage of the Living Atlas, as evidenced in its limited representation within the academic literature. Instead of necessitating a lengthy process of pre-authorization through our personal credentials, we suggest an ongoing transition toward fully open geospatial data repositories, especially considering how much of the underlying information contained in these hosted layers originally stemmed from open-access, governmental datasets. The issue regarding geospatial data availability is not a matter of cost, as many governmental organizations host their GIS data online for free (i.e., FEMA, USGS, NOAA). Rather, we lack strategic selection and amalgamation of many disparate datasets, each hosted in a unique format and location across the internet, into a readily deployable application that may be quickly used by technical and non-technical audiences for informed decision making.

4.2. Characteristic #2: Spatial Analysis Functionality

Spatial analysis functionality within webGIS refers to the integration of data and people according to geospatial relationships disseminated through a web-based user interface [12]. Location is used as a common denominator to link the user’s visualization inquiry with a select subset array from large-scale datasets. While such functionality provides rapid data access for browsing, users often necessitate performing additional analysis upon the curated subsets to understand local scenarios. Spatial analysis of correlated datasets describes the usage of functional properties (i.e., geospatial location and/or attributes) to transform data into new formats and to impose modifications toward a specific goal. For example, in the hydrological sciences, spatial analysis is commonly performed within a GIS environment to transform landscape datasets, such as terrain elevation, soils, and land use, into standardized formats, which are then further merged, processed, and assessed to derive representative model elements and describe the flow of water throughout the watershed.
In the NBS-Geo web app, much of the data accessed from the Living Atlas repository was found to be analysis-ready, both in terms of webGIS and local processing. The primary spatial analysis limitations associated with this web app involved the difficulties encountered with extracting data subsets to a local computer, as described in Section 4.1, which is necessary for performing robust geospatial operations. High-resolution Earth–systems modeling was thereby limited by the need for the user to obtain organizational credentials for proper data downloading and also the need to possess costly Esri license extensions on the local computer (i.e., Spatial Analyst, 3D Analyst, see [106] for example of standard hydrological terrain processing steps within a GIS environment utilizing such extensions). Furthermore, several out-of-the-box widgets were implemented in the NBS-Geo web application, which were intended by Esri to provide value-added spatial functionalities within a web application without necessitating complex coding skills by the developer [113]. While in theory, pre-built widgets would aid facilitation of cloud-based GIS data and user-friendly web applications, we found that practical usage of these tools were lacking.
For example, the “swipe widget” used in NBS-Geo was not intuitive in terms of how to achieve proper data overlays and transparency symbologies to showcase overlapping land use classifications. When using this widget, we noted the user is required to manually turn on all land use layers while turning off all other layers for proper visualization. The “screening widget”, used here to showcase the CDC’s SVI vulnerability themes within the user’s viewport, did not provide the capability to modify the legend nomenclature for clarity and resulted in small text that was sometimes hidden from view. We attempted to mitigate user understanding of this widget information by including a text link for the CDC’s SVI data documentation within the widget. A demonstration video was added to the tool’s homepage to help clarify how these widgets may be used. However, further improvements regarding ready-to-use webGIS widgets would facilitate spatial analysis functionality for the end-users without necessitating additional or ongoing training by the developers. We had planned to use several additional widgets created by Esri for robust spatial investigations, such as user-defined hotspot mapping and cloud data extraction, but we noted various limitations in the types of data that can be incorporated into such widgets. Only data layers that had been identified by the hosting agency as fully open and extractable can be used in several of these added-value Esri widgets (as described in Section 3.2), thereby limiting our use within a comprehensive collection of datasets, each containing varying levels of openness.
Spatial functionality also includes the management of GIS datasets and value-added tools for long-term user functionality. During the course of this tool development, several datasets within the Esri Living Atlas had been depreciated by the hosting agencies and updated with newer data. This necessitated manual re-linking of the underlying data REST URLs within the NBS-Geo web map in order to update the datasets on the NBS-Geo web app. We were typically notified of the dataset depreciation by a user of the NBS-Geo tool and not immediately informed by the developers of the dataset or the hosting repository. Identification of new datasets that may be applicable for holistic NBS planning also required manual searching of the Living Atlas repository on a periodic basis. This brings up the question: Whose responsibility is such data management, maintenance, and curation when the underling information is derived from a variety of sources? We, as authors, will attempt to manage this tool’s underlying datasets into the future; however, we realize that data depreciation is likely to occur at-scale as new data is derived by the GIS community. We encourage improved best management practices regarding large-scale data hosting repositories, such as the Living Atlas, toward user notification of dataset updates and also the capability for automatic linkage to new datasets within linked web applications and their underlying spatial tools.

4.3. Characteristic #3: Scalability

As the cloud web mapping era has increased, the scalability of mass information has become a key observed benefit [12]. Here, scaling refers to the ability of the two-way feedbacks between data and the users to occur at cascading levels of computing power, size of data, and geographical area of interest. The cloud computing within ArcGIS Online, which uses a software-as-a-service platform, fosters scalable computing and storage using immense technological resources to iterate data queries in rapid time. Several of the datasets referenced in NBS-Geo were provided in real-time (i.e., stream gauges, air pollution monitors, wind data), which necessitates instant context and dynamic data display from the local to the regional, and the national scale. The cloud-based computing technologies then leverage resources from disparate servers to scale up user queries within the web mapping applications and perform geospatial operations for real-time situational awareness [114]. Here, we recognize the unique computational scaling capability of web-based geospatial datasets as compared to traditional, desktop-based data. Nonetheless, cloud-based datasets can contain a significant number of pixels for data visualization, and limits to the scale of which the user may view the datasets is often incorporated into the data symbology attributes for enhanced functionality over the internet. For example, the building footprints layer hosted in NBS-Geo was automatically set for a visibility range of 1:10,000 square meters by the hosting agency, meaning the dataset will not display until the user is zoomed in to a map area of 10,000 square meters or less (approximately street- or neighborhood-scale). The benefits of such scale-dependent data mapping are enhanced organization among potentially convoluted sets of data and computational performance improvements; however, scale-dependent rendering may also limit data visualization at larger scales, which are important for regional planning. Through our experience with deriving NBS-Geo from the Living Atlas datasets and web building wizards, we note a substantial ability to scale data using such a framework from local to regional areas. This capability promotes place-based risk assessments according to community priorities across institutional boundaries.

4.4. Characteristic #4: Geospatial Standards

Another important component of web mapping applications is adherence to an agreed-upon set of geospatial standards and specifications. One of the most common sets of geospatial standards was developed by the Open Geospatial Consortium (OGC), which provides ease of accessibility, interoperability, and combination with other software suites [115]. Another set of fundamental standards was derived from the International Organization for Standardization (ISO) for describing the inherent data construction, quality management approaches, and workflow implementation [12]. Within the Living Atlas, hosted datasets are intended to be well-documented according to OGC or ISO geospatial standards. However, through the exercise of crafting and documenting the NBS-Geo web application, we noted many instances where the hosted datasets did not contain adequate metadata for fully understanding how the datasets were created. In attempting to better understand the scientific basis for several datasets, we needed to manually contact the hosting agencies and request background documentation. We also noted many instances where the nomenclature for the geospatial attributes used within a hosted data layer was not immediately understandable, and we therefore necessitated additional searching online for core documentation and legend descriptions (i.e., [116,117]). Such information, which is necessary for data dependability and reproduction capability, should be easily accessible directly within the geospatial metadata descriptions.
Due to the manner in which the Esri Living Atlas data is compiled by contributions from a plethora of user-types (i.e., commercial, academic, general GIS users, governmental), and not all datasets have been vetted as authoritative, we suggest further efforts to comprehensively document the underlying datasets involved in holistic NBS planning and research. While we recommend here the use of a comprehensive web-based geospatial repository for amalgamating an interdisciplinary traffic of ideas and cross-domain datasets, the end users will likely stem from a siloed domain of understanding and will therefore require easy-to-understand and easy-to-find metadata descriptions for digesting and adequately using the information available on the web application screen.

5. Discussion and Conclusions

To date, a comprehensive NSDI for NBSs has yet to be achieved and is essential for fully espousing the effective functionalities of natural solutions to climate change, social equity, and natural disaster mitigation. As resilience and sustainability goals have become increasingly linked, many governmental agencies are seeking the prioritization of NBS capital improvement projects using a risk-based or benefits-based prioritization metric to help guide equitable investments rather than focusing in a one dimensional paradigm [118]. To amalgamate such interwoven goals, decision makers seek the ability to quickly map and identify priority planning areas according to local conditions while being confident that the underlying information is scientifically robust, up-to-date, accessible, interdisciplinary, and thorough. As such, a thorough analysis of the underlying data formats, standards, and spatial functionalities of the NSDI are essential for addressing policy level challenges and linking governance goals with geospatial infrastructure. It is envisaged that by highlighting the strengths and limitations of latest GIS technologies toward transdisciplinary research, this study will further the establishment of important spatial resources and improve information transparency across domains.
The curated web application presented here, NBS-Geo, provides systematic access to multi-disciplinary information regarding the full functionality of NBS solutions, thereby creating a novel knowledge base for studying complex interactions and considering inherent tradeoffs between society and the environment. Here, we have discussed the overall framework behind NBS-Geo to foster identification of unique feedbacks between social and Earth–system processes involved in NBS multi-functionalities and enable the linkage of disparate systems to evaluate hydro-socio-environmental connectivity. NBS-Geo is the first known attempt to incorporate governmental decision making into a social–environmental–ecological–hydrological representation of NBS systems for exploring the interplay between design, policy, and watershed self-organization in an urban environment. This research transitions beyond the standard focus of watershed physiological characteristics to investigate the complex associations relating social patterns and watershed efficacy. By constructing models with interdisciplinary elements, we strengthen the foundation for novel research regarding how NBSs function in diverse geographical locations, each with unique properties.
NBS design is a function of rapid urban development, quality of life goals, and a scarcity of resources for addressing hydro-meteorological challenges. As such, proper co-development of NBS plans can and should include expert input from scientists, practitioners, and local community constituents for a weaving together of pertinent insights across diverse disciplines. In this light, strategic NBS planning requires real-world empirical datasets to aid in clarifying causality among disparate social and physical domains in a manner that is understandable and usable by diverse parties to inform interventions for long-term resilience [25]. Here, we highlighted how the datasets and method of distribution presented in NBS-Geo can help decision makers, from community participants to regional decision makers, improve NBS planning in light of overlapping themes. An understanding of the spatial variation in patterns and processes at nested scales, and how they impact NBS implementation potential and efficacy, is important for transitioning beyond the ad hoc planning of this multi-beneficial technology and toward achieving integrated planning that links disparate epistemologies. Below we summarize the key strengths of using a webGIS framework, such as NBS-Geo, for visualizing comprehensive NBS datasets, disseminating them to key decision makers, and performing general spatial analysis techniques across scales:
  • ✓ Bridges the gaps between research, data, and implementation.
  • ✓ Enables science-based (risk-based) decision making.
  • ✓ Fosters collaborative approaches across disciplines.
  • ✓ Enhances understanding through data and mapping.
  • ✓ Provides empirical evidence for novel planning and research in light of urgent climate change and urbanization challenges.
  • ✓ Provides a common understanding of overlapping objectives and underlying functionalities.
  • ✓ Used as a lens to understand the world.
  • ✓ Facilitates relationships with local governmental officials.
  • ✓ Fosters prioritization of equity across domains.
One of the novelties of our framework included the curated collection of web-based datasets that reflects the current state-of-the-art in NBS efficacy across a variety of complementary but distinct domains. Here, we combined open-source and proprietary geospatial technologies for data generation, management, sharing, and visualization. By building upon a review of existing NBS data suites, we aimed to improve research and planning in the field of NBSs by linking disparate systems to increase our understanding of complex hydro-socio-environmental connections. Coupled human–Earth models allow for an improved understanding of how social characteristics correlate with environmental processes as a socio-technological system. In a world with increasing socio-environmental stressors and finite resources, this research will improve public policy interventions by providing the knowledge necessary for identifying, quantifying, and linking and prioritizing complex interactions for sound decision making. By providing a framework that connects users with comprehensive NBS data at a high-level planning stage, this research is customizable to any geographic region (within the limitations of the datasets) and may be used to elucidate generalizable understandings regarding engineered NBS technology in urban environments. The practical implications of this research will enhance the user-friendliness of NBS spatial planning in a flexible manner while merging well-established hydrological considerations with a vast spectrum of NBS co-benefits.
As discussed in Section 4, GIS licensures, access credentials, and data maintenance presented an additional layer of challenges that must be overcome for full embracing of GIS web app technologies in cross-disciplinary research and planning. Integrated data resources that enable robust data discovery and usage toward derived wisdom must contain the four geospatial attributes discussed in this study, namely: (1) openness, (2) spatial analysis functionality, (3) scalability, and (4) geospatial standards. We described areas of strengths and further research and development opportunities in the field of GIS toward achieving these goals. We suggested future best practices for interdisciplinary data mash-ups by assessing the current suite of cloud-based social and Earth–system GIS datasets accessible to the authors. We assessed their fitness-of-use for aiding decision making and discuss a need for improved research to overcome several challenges for interdisciplinary data services in the era of the Anthropocene, whereby human interaction and accessibility with the datasets and tools are just as important as the dataset accuracy and level of detail.

Supplementary Materials

The supplementary materials are available online at https://www.mdpi.com/article/10.3390/su131911018/s1.

Author Contributions

Conceptualization, C.V.C.; methodology, C.V.C.; software, C.V.C.; validation, C.V.C.; formal analysis, C.V.C.; resources, C.V.C. and H.S.R.; data curation, C.V.C.; writing—original draft preparation, C.V.C.; writing—review and editing, C.V.C. and H.S.R.; visualization, C.V.C.; supervision, H.S.R.; project administration, H.S.R.; funding acquisition, H.S.R. All authors have read and agreed to the published version of the manuscript. Authorship was limited to those who have contributed substantially to the work reported.

Funding

This research was funded by National Science Foundation, grant number 1840607.

Institutional Review Board Statement

Not applicable.

Informed Consent Statement

Not applicable.

Data Availability Statement

Data availability is referenced throughout the manuscript and within the Supplementary Materials, according to available content at the time of publication. All pertinent datasets as provided by the hosting agencies are credited on the NBS-Geo home page (https://tinyurl.com/nbsgeohome, accessed on 3 October 2021). Users can browse this web-page and click on any of the associated links for more information regarding each dataset attributors, underlying assumptions, limitations, descriptions, terms of use, and dates of service. At the time of publication, all data layers described in this article were current within the Esri Living Atlas data repository; however, datasets may become depreciated by the hosting agencies at any time. The author(s) will maintain the site to link data updates, as available. In the event this site is no longer maintained due to widespread data depreciation, the general framework presented here for multi-functional geospatial data curation, by transposing themes of society, environment, hydrology, and ecology, is encouraged for further development and application.

Acknowledgments

We thank the input provided by Laura Patiño from the City of Houston Office of Recovery regarding this web application and manuscript.

Conflicts of Interest

The authors declare no conflict of interest.

References

  1. UNDRR. Human Cost of Disasters: An Overview of the Last 20 Years (2000–2019); UNDRR: Geneva, Switzerland, 2020. [Google Scholar]
  2. World Urbanization Prospects 2018; United Nations: New York, NY, USA, 2018.
  3. Demuzere, M.; Orru, K.; Heidrich, O.; Olazabal, E.; Geneletti, D.; Orru, H.; Bhave, A.G.; Mittal, N.; Feliu, E.; Faehnle, M. Mitigating and adapting to climate change: Multi-functional and multi-scale assessment of green urban infrastructure. J. Environ. Manag. 2014, 146, 107–115. [Google Scholar] [CrossRef] [PubMed]
  4. Hansen, R.; Olafsson, A.S.; Van der Jagt, A.P.N.; Rall, E.; Pauleit, S. Planning multifunctional green infrastructure for compact cities: What is the state of practice? Ecol. Indic. 2019, 96, 99–110. [Google Scholar] [CrossRef]
  5. Bratman, G.N.; Anderson, C.B.; Berman, M.G.; Cochran, B.; De Vries, S.; Flanders, J.; Folke, C.; Frumkin, H.; Gross, J.J.; Hartig, T.; et al. Nature and mental health: An ecosystem service perspective. Sci. Adv. 2019, 5, eaax0903. [Google Scholar] [CrossRef] [PubMed] [Green Version]
  6. Bowen, K.J.; Parry, M.; Barrett, M.A.; Miller, D.; Frumkin, H.; Peen, J.; Schoevers, R.A.; Beekman, A.T.; Dekker, J.; Sandifer, P.A.; et al. The evidence base for linkages between green infrastructure, public health and economic benefit. Ecosyst. Serv. 2014, 11, 1–34. [Google Scholar]
  7. Anderson, V.; Gough, W.A. Evaluating the potential of nature-based solutions to reduce ozone, nitrogen dioxide, and carbon dioxide through a multi-type green infrastructure study in Ontario, Canada. City Environ. Interact. 2020, 6, 100043. [Google Scholar] [CrossRef]
  8. Berardi, U.; GhaffarianHoseini, A.H.; GhaffarianHoseini, A. State-of-the-art analysis of the environmental benefits of green roofs. Appl. Energy 2014, 115, 411–428. [Google Scholar] [CrossRef]
  9. Van den Bosch, M.; Sang, O. Urban natural environments as nature-based solutions for improved public health—A systematic review of reviews. Environ. Res. 2017, 158, 373–384. [Google Scholar] [CrossRef]
  10. UN. Environment Programme Nature-Based Solutions for Climate Manifesto. 2019. Available online: https://www.unenvironment.org/nature-based-solutions-climate (accessed on 25 June 2021).
  11. Keesstra, S.; Nunes, J.; Novara, A.; Finger, D.; Avelar, D.; Kalantari, Z.; Cerdà, A. The superior effect of nature based solutions in land management for enhancing ecosystem services. Sci. Total Environ. 2018, 610–611, 997–1009. [Google Scholar] [CrossRef] [Green Version]
  12. Veenendaal, B.; Brovelli, M.A.; Li, S. Review of web mapping: Eras, trends and directions. ISPRS Int. J. Geo-Inf. 2017, 6, 317. [Google Scholar] [CrossRef]
  13. Guo, H.; Liu, Z.; Jiang, H.; Wang, C.; Liu, J.; Liang, D. Big Earth Data: A new challenge and opportunity for Digital Earth’s development. Int. J. Digit. Earth 2017, 10, 1–12. [Google Scholar] [CrossRef] [Green Version]
  14. Ames, D.P.; Horsburgh, J.S.; Cao, Y.; Kadlec, J.; Whiteaker, T.; Valentine, D. HydroDesktop: Web services-based software for hydrologic data discovery, download, visualization, and analysis. Environ. Model. Softw. 2012, 37, 146–156. [Google Scholar] [CrossRef]
  15. Boyd, D.S.; Foody, G.M. An overview of recent remote sensing and GIS based research in ecological informatics. Ecol. Inform. 2011, 6, 25–36. [Google Scholar] [CrossRef] [Green Version]
  16. Flemons, P.; Guralnick, R.; Krieger, J.; Ranipeta, A.; Neufeld, D. A web-based GIS tool for exploring the world’s biodiversity: The Global Biodiversity Information Facility Mapping and Analysis Portal Application (GBIF-MAPA). Ecol. Inform. 2007, 2, 49–60. [Google Scholar] [CrossRef]
  17. Soille, P.; Burger, A.; De Marchi, D.; Kempeneers, P.; Rodriguez, D.; Syrris, V.; Vasilev, V. A versatile data-intensive computing platform for information retrieval from big geospatial data. Future Gener. Comput. Syst. 2018, 81, 30–40. [Google Scholar] [CrossRef]
  18. Gorelick, N.; Hancher, M.; Dixon, M.; Ilyushchenko, S.; Thau, D.; Moore, R. Google Earth Engine: Planetary-scale geospatial analysis for everyone. Remote Sens. Environ. 2017, 202, 799–815. [Google Scholar] [CrossRef]
  19. Lehmann, A.; Guigoz, Y.; Ray, N.; Mancosu, E.; Abbaspour, K.C.; Rouholahnejad Freund, E.; Allenbach, K.; De Bono, A.; Fasel, M.; Gago-Silva, A.; et al. A web platform for landuse, climate, demography, hydrology and beach erosion in the Black Sea catchment. Sci. Data 2017, 4, 1–15. [Google Scholar] [CrossRef] [Green Version]
  20. Mekonnen, A.D.; Gorsevski, P.V. A web-based participatory GIS (PGIS) for offshore wind farm suitability within Lake Erie, Ohio. Renew. Sustain. Energy Rev. 2015, 41, 162–177. [Google Scholar] [CrossRef] [Green Version]
  21. Khalil, A.; Hanich, L.; Hakkou, R.; Lepage, M. GIS-based environmental database for assessing the mine pollution: A case study of an abandoned mine site in Morocco. J. Geochem. Explor. 2014, 144, 468–477. [Google Scholar] [CrossRef]
  22. Meerow, S. A green infrastructure spatial planning model for evaluating ecosystem service tradeoffs and synergies across three coastal megacities. Environ. Res. Lett. 2019, 14, 125011. [Google Scholar] [CrossRef] [Green Version]
  23. Green Infrastructure Focus Map: Briefing 1; GLA: London, UK, 2018.
  24. Ruangpan, L.; Vojinovic, Z.; Di Sabatino, S.; Leo, L.S.; Capobianco, V.; Oen, A.M.P.; Mcclain, M.E.; Lopez-Gunn, E. Nature-based solutions for hydro-meteorological risk reduction: A state-of-the-art review of the research area. Nat. Hazards Earth Syst. Sci. 2020, 20, 243–270. [Google Scholar] [CrossRef] [Green Version]
  25. Frantzeskaki, N.; McPhearson, T.; Collier, M.J.; Kendal, D.; Bulkeley, H.; Dumitru, A.; Walsh, C.; Noble, K.; Van Wyk, E.; Ordóñez, C.; et al. Nature-based solutions for urban climate change adaptation: Linking science, policy, and practice communities for evidence-based decision-making. Bioscience 2019, 69, 455–466. [Google Scholar] [CrossRef]
  26. Song, Y.; Kirkwood, N.; Maksimović, Č.; Zhen, X.; O’Connor, D.; Jin, Y.; Hou, D. Nature based solutions for contaminated land remediation and brownfield redevelopment in cities: A review. Sci. Total Environ. 2019, 663, 568–579. [Google Scholar] [CrossRef] [PubMed]
  27. García, A.M.; Santé, I.; Loureiro, X.; Miranda, D. Green infrastructure spatial planning considering ecosystem services assessment and trade-off analysis. Application at landscape scale in Galicia region (NW Spain). Ecosyst. Serv. 2020, 43, 101115. [Google Scholar] [CrossRef]
  28. Alves, A.; Gersonius, B.; Kapelan, Z.; Vojinovic, Z.; Sanchez, A. Assessing the Co-Benefits of green-blue-grey infrastructure for sustainable urban flood risk management. J. Environ. Manag. 2019, 239, 244–254. [Google Scholar] [CrossRef] [PubMed]
  29. Fenner, R. Spatial evaluation of multiple benefits to encourage multi-functional design of sustainable drainage in Blue-Green cities. Water 2017, 9, 953. [Google Scholar] [CrossRef] [Green Version]
  30. Li, H.; Ding, L.; Ren, M.; Li, C.; Wang, H. Sponge city construction in China: A survey of the challenges and opportunities. Water 2017, 9, 594. [Google Scholar] [CrossRef] [Green Version]
  31. Mitchell, R.; Popham, F. Effect of exposure to natural environment on health inequalities: An observational population study. Lancet 2008, 372, 1655–1660. [Google Scholar] [CrossRef] [Green Version]
  32. Maas, J.; Van Dillen, S.M.E.; Verheij, R.A.; Groenewegen, P.P. Social contacts as a possible mechanism behind the relation between green space and health. Health Place 2009, 15, 586–595. [Google Scholar] [CrossRef] [Green Version]
  33. Gascon, M.; Triguero-Mas, M.; Martínez, D.; Dadvand, P.; Rojas-Rueda, D.; Plasència, A.; Nieuwenhuijsen, M.J. Residential green spaces and mortality: A systematic review. Environ. Int. 2016, 86, 60–67. [Google Scholar] [CrossRef] [Green Version]
  34. Brown, S.C.; Lombard, J.; Wang, K.; Byrne, M.M.; Toro, M.; Plater-Zyberk, E.; Feaster, D.J.; Kardys, J.; Nardi, M.I.; Perez-Gomez, G.; et al. Neighborhood greenness and chronic health conditions in medicare beneficiaries. Am. J. Prev. Med. 2016, 51, 78–89. [Google Scholar] [CrossRef]
  35. Ray, H.; Jakubec, S.L. Nature-based experiences and health of cancer survivors. Complement. Ther. Clin. Pract. 2014, 20, 188–192. [Google Scholar] [CrossRef] [PubMed]
  36. Fuertes, E.; Markevych, I.; Von Berg, A.; Bauer, C.P.; Berdel, D.; Koletzko, S.; Sugiri, D.; Heinrich, J. Greenness and allergies: Evidence of differential associations in two areas in Germany. J. Epidemiol. Community Health 2014, 68, 787–790. [Google Scholar] [CrossRef]
  37. Astell-Burt, T.; Feng, X. Urban green space, tree canopy and prevention of cardiometabolic diseases: A multilevel longitudinal study of 46 786 Australians. Int. J. Epidemiol. 2021, 49, 926–933. [Google Scholar] [CrossRef] [PubMed] [Green Version]
  38. Ward Thompson, C.; Roe, J.; Aspinall, P.; Mitchell, R.; Clow, A.; Miller, D. More green space is linked to less stress in deprived communities: Evidence from salivary cortisol patterns. Landsc. Urban Plan. 2012, 105, 221–229. [Google Scholar] [CrossRef] [Green Version]
  39. Dadvand, P.; Wright, J.; Martinez, D.; Basagaña, X.; McEachan, R.R.C.; Cirach, M.; Gidlow, C.J.; De Hoogh, K.; Gražulevičiene, R.; Nieuwenhuijsen, M.J. Inequality, green spaces, and pregnant women: Roles of ethnicity and individual and neighbourhood socioeconomic status. Environ. Int. 2014, 71, 101–108. [Google Scholar] [CrossRef]
  40. Luck, G.W.; Smallbone, L.T.; O’Brien, R. Socio-economics and vegetation change in urban ecosystems: Patterns in space and time. Ecosystems 2009, 12, 604–620. [Google Scholar] [CrossRef]
  41. Dunn, A.D. Siting green infrastructure: Legal and policy solutions to alleviate urban poverty and promote healthy communities. Environ. Aff. 2008, 37, 604–620. [Google Scholar]
  42. Mell, I.C.; Henneberry, J.; Hehl-Lange, S.; Keskin, B. To green or not to green: Establishing the economic value of green infrastructure investments in The Wicker, Sheffield. Urban For. Urban Green. 2016, 18, 257–267. [Google Scholar] [CrossRef]
  43. Vandermeulen, V.; Verspecht, A.; Vermeire, B.; Van Huylenbroeck, G.; Gellynck, X. The use of economic valuation to create public support for green infrastructure investments in urban areas. Landsc. Urban Plan. 2011, 103, 198–206. [Google Scholar] [CrossRef]
  44. Bowler, D.E.; Buyung-Ali, L.M.; Knight, T.M.; Pullin, A.S. A systematic review of evidence for the added benefits to health of exposure to natural environments. BMC Public Health 2010, 10, 1–10. [Google Scholar] [CrossRef] [Green Version]
  45. McMahan, E.A.; Estes, D. The effect of contact with natural environments on positive and negative affect: A meta-analysis. J. Posit. Psychol. 2015, 10, 507–519. [Google Scholar] [CrossRef]
  46. Houlden, V.; Weich, S.; De Albuquerque, J.P.; Jarvis, S.; Rees, K. The relationship between greenspace and the mental wellbeing of adults: A systematic review. PLoS ONE 2018, 13, e0203000. [Google Scholar] [CrossRef] [Green Version]
  47. Frumkin, H.; Bratman, G.N.; Breslow, S.J.; Cochran, B.; Kahn, P.H.; Lawler, J.J.; Levin, P.S.; Tandon, P.S.; Varanasi, U.; Wolf, K.L.; et al. Nature contact and human health: A research agenda. Environ. Health Perspect. 2017, 125, 075001. [Google Scholar] [CrossRef] [Green Version]
  48. Han, J.W.; Choi, H.; Jeon, Y.H.; Yoon, C.H.; Woo, J.M.; Kim, W. The effects of forest therapy on coping with chronic widespread pain: Physiological and psychological differences between participants in a forest therapy program and a control group. Int. J. Environ. Res. Public Health 2016, 13, 255. [Google Scholar] [CrossRef] [Green Version]
  49. Roe, M.; Mell, I. Negotiating value and priorities: Evaluating the demands of green infrastructure development. J. Environ. Plan. Manag. 2013, 56, 650–673. [Google Scholar] [CrossRef]
  50. Van den Berg, A.E.; Maas, J.; Verheij, R.A.; Groenewegen, P.P. Green space as a buffer between stressful life events and health. Soc. Sci. Med. 2010, 70, 1203–1210. [Google Scholar] [CrossRef] [PubMed] [Green Version]
  51. McGrath, L.J.; Hopkins, W.G.; Hinckson, E.A. Associations of objectively measured built-environment attributes with youth moderate—Vigorous physical activity: A systematic review and meta-analysis. Sport. Med. 2015, 45, 841–865. [Google Scholar] [CrossRef] [PubMed]
  52. Kaczynski, A.T.; Henderson, K.A. Environmental correlates of physical activity: A review of evidence about parks and recreation. Leis. Sci. 2007, 29, 315–354. [Google Scholar] [CrossRef]
  53. Lovell, R.; Wheeler, B.W.; Higgins, S.L.; Irvine, K.N.; Depledge, M.H. A Systematic Review of the Health and Well-Being Benefits of Biodiverse Environments. J. Toxicol. Environ. Health Part B Crit. Rev. 2014, 17, 1–20. [Google Scholar] [CrossRef] [Green Version]
  54. Mitchell, R. Is physical activity in natural environments better for mental health than physical activity in other environments? Soc. Sci. Med. 2013, 91, 130–134. [Google Scholar] [CrossRef]
  55. Suppakittpaisarn, P.; Jiang, X.; Sullivan, W.C. Green Infrastructure, Green Stormwater Infrastructure, and Human Health: A Review. Curr. Landsc. Ecol. Rep. 2017, 2, 96–110. [Google Scholar] [CrossRef] [Green Version]
  56. Troy, A.; Morgan Grove, J.; O’Neil-Dunne, J. The relationship between tree canopy and crime rates across an urban-rural gradient in the greater Baltimore region. Landsc. Urban Plan. 2012, 106, 262–270. [Google Scholar] [CrossRef]
  57. Kondo, M.C.; Han, S.H.; Donovan, G.H.; MacDonald, J.M. The association between urban trees and crime: Evidence from the spread of the emerald ash borer in Cincinnati. Landsc. Urban Plan. 2017, 157, 193–199. [Google Scholar] [CrossRef] [Green Version]
  58. Branas, C.C.; Cheney, R.A.; MacDonald, J.M.; Tam, V.W.; Jackson, T.D.; Ten Havey, T.R. A difference-in-differences analysis of health, safety, and greening vacant urban space. Am. J. Epidemiol. 2011, 174, 1296–1306. [Google Scholar] [CrossRef] [PubMed] [Green Version]
  59. De Vries, S.; Verheij, R.A.; Groenewegen, P.P.; Spreeuwenberg, P. Natural environments—Healthy environments? An exploratory analysis of the relationship between greenspace and health. Environ. Plan. A 2003, 35, 1717–1731. [Google Scholar] [CrossRef] [Green Version]
  60. Piff, P.K.; Dietze, P.; Feinberg, M.; Stancato, D.M.; Keltner, D. Awe, the small self, and prosocial behavior. J. Pers. Soc. Psychol. 2015, 108, 883–899. [Google Scholar] [CrossRef] [Green Version]
  61. Dadvand, P.; Bartoll, X.; Basagaña, X.; Dalmau-Bueno, A.; Martinez, D.; Ambros, A.; Cirach, M.; Triguero-Mas, M.; Gascon, M.; Borrell, C.; et al. Green spaces and General Health: Roles of mental health status, social support, and physical activity. Environ. Int. 2016, 91, 161–167. [Google Scholar] [CrossRef] [PubMed] [Green Version]
  62. Daniels, G.D.; Kirkpatrick, J.B. Does variation in garden characteristics influence the conservation of birds in suburbia? Biol. Conserv. 2006, 133, 326–335. [Google Scholar] [CrossRef]
  63. Sandström, U.G.; Angelstam, P.; Mikusiński, G. Ecological diversity of birds in relation to the structure of urban green space. Landsc. Urban Plan. 2006, 77, 39–53. [Google Scholar] [CrossRef]
  64. Arroyo-Rodríguez, V.; Fahrig, L.; Tabarelli, M.; Watling, J.I.; Tischendorf, L.; Benchimol, M.; Cazetta, E.; Faria, D.; Leal, I.R.; Melo, F.P.L.; et al. Designing optimal human-modified landscapes for forest biodiversity conservation. Ecol. Lett. 2020, 23, 1404–1420. [Google Scholar] [CrossRef]
  65. Tzoulas, K.; Korpela, K.; Venn, S.; Yli-Pelkonen, V.; Kaźmierczak, A.; Niemela, J.; James, P. Promoting ecosystem and human health in urban areas using Green Infrastructure: A literature review. Landsc. Urban Plan. 2007, 81, 167–178. [Google Scholar] [CrossRef] [Green Version]
  66. Planchuelo, G.; Von Der Lippe, M.; Kowarik, I. Untangling the role of urban ecosystems as habitats for endangered plant species. Landsc. Urban Plan. 2019, 189, 320–334. [Google Scholar] [CrossRef]
  67. Kowarik, I.; Hiller, A.; Planchuelo, G.; Seitz, B.; Lippe, M.; Von der Buchholz, S. Emerging urban forests: Opportunities for promoting the wild side of the urban green infrastructure. Sustainability 2019, 11, 6318. [Google Scholar] [CrossRef] [Green Version]
  68. Gilbert-Norton, L.; Wilson, R.; Stevens, J.R.; Beard, K.H. A Meta-Analytic Review of Corridor Effectiveness. Conserv. Biol. 2010, 24, 660–668. [Google Scholar] [CrossRef] [PubMed]
  69. Carlier, J.; Moran, J.; Aughney, T.; Roche, N. Effects of greenway development on functional connectivity for bats. Glob. Ecol. Conserv. 2019, 18, e00613. [Google Scholar] [CrossRef]
  70. Zhang, Z.; Meerow, S.; Newell, J.P.; Lindquist, M. Enhancing landscape connectivity through multifunctional green infrastructure corridor modeling and design. Urban For. Urban Green. 2019, 38, 305–317. [Google Scholar] [CrossRef]
  71. Abhijith, K.V.; Kumar, P.; Gallagher, J.; McNabola, A.; Baldauf, R.; Pilla, F.; Broderick, B.; Di Sabatino, S.; Pulvirenti, B. Air pollution abatement performances of green infrastructure in open road and built-up street canyon environments—A review. Atmos. Environ. 2017, 162, 71–86. [Google Scholar] [CrossRef]
  72. Kumar, P.; Druckman, A.; Gallagher, J.; Gatersleben, B.; Allison, S.; Eisenman, T.S.; Hoang, U.; Hama, S.; Tiwari, A.; Sharma, A.; et al. The nexus between air pollution, green infrastructure and human health. Environ. Int. 2019, 133, 105181. [Google Scholar] [CrossRef]
  73. Nowak, D.J.; Crane, D.E.; Stevens, J.C. Air pollution removal by urban trees and shrubs in the United States. Urban For. Urban Green. 2006, 4, 115–123. [Google Scholar] [CrossRef]
  74. Nowak, D.J.; Greenfield, E.J.; Hoehn, R.E.; Lapoint, E. Carbon storage and sequestration by trees in urban and community areas of the United States. Environ. Pollut. 2013, 178, 229–236. [Google Scholar] [CrossRef] [Green Version]
  75. Hofman, J.; Stokkaer, I.; Snauwaert, L.; Samson, R. Spatial distribution assessment of particulate matter in an urban street canyon using biomagnetic leaf monitoring of tree crown deposited particles. Environ. Pollut. 2013, 183, 123–132. [Google Scholar] [CrossRef] [PubMed]
  76. Bowler, D.E.; Buyung-Ali, L.; Knight, T.M.; Pullin, A.S. Urban greening to cool towns and cities: A systematic review of the empirical evidence. Landsc. Urban Plan. 2010, 97, 147–155. [Google Scholar] [CrossRef]
  77. Yang, J.; Kumar, D.L.M.; Pyrgou, A.; Chong, A.; Santamouris, M.; Kolokotsa, D.; Lee, S.E. Green and cool roofs’ urban heat island mitigation potential in tropical climate. Sol. Energy 2018, 173, 597–609. [Google Scholar] [CrossRef]
  78. Wang, Y.; Bakker, F.; De Groot, R.; Wörtche, H. Effect of ecosystem services provided by urban green infrastructure on indoor environment: A literature review. Build. Environ. 2014, 77, 88–100. [Google Scholar] [CrossRef]
  79. Doick, K.; Hutchings, T. Air Temperature Regulation by Urban Trees and Green Infrastructure; Forestry Commission: Edinburgh, UK, 2013.
  80. Dzhambov, A.; Dimitrova, D. Urban green spaces’ effectiveness as a psychological buffer for the negative health impact of noise pollution: A systematic review. Noise Health 2014, 16, 157–165. [Google Scholar] [CrossRef]
  81. Cohen, P.; Potchter, O.; Schnell, I. The impact of an urban park on air pollution and noise levels in the Mediterranean city of Tel-Aviv, Israel. Environ. Pollut. 2014, 195, 73–83. [Google Scholar] [CrossRef]
  82. Mekonnen, M.; Keesstra, S.D.; Baartman, J.E.M.; Stroosnijder, L.; Maroulis, J. Reducing sediment connectivity through man-made and natural sediment sinks in the Minizr Catchment, Northwest Ethiopia. Land Degrad. Dev. 2017, 28, 708–717. [Google Scholar] [CrossRef]
  83. De Jesús Arce-Mojica, T.; Nehren, U.; Sudmeier-Rieux, K.; Miranda, P.J.; Anhuf, D. Nature-based solutions (NbS) for reducing the risk of shallow landslides: Where do we stand? Int. J. Disaster Risk Reduct. 2019, 41, 101293. [Google Scholar] [CrossRef]
  84. Boano, F.; Caruso, A.; Costamagna, E.; Ridolfi, L.; Fiore, S.; Demichelis, F.; Galvão, A.; Pisoeiro, J.; Rizzo, A.; Masi, F. A review of nature-based solutions for greywater treatment: Applications, hydraulic design, and environmental benefits. Sci. Total Environ. 2020, 711, 134731. [Google Scholar] [CrossRef]
  85. Arden, S.; Ma, X. Constructed wetlands for greywater recycle and reuse: A review. Sci. Total Environ. 2018, 630, 587–599. [Google Scholar] [CrossRef]
  86. Pradhan, S.; Al-Ghamdi, S.G.; Mackey, H.R. Greywater recycling in buildings using living walls and green roofs: A review of the applicability and challenges. Sci. Total Environ. 2019, 652, 330–344. [Google Scholar] [CrossRef]
  87. Debele, S.E.; Kumar, P.; Sahani, J.; Marti-Cardona, B.; Mickovski, S.B.; Leo, L.S.; Porcù, F.; Bertini, F.; Montesi, D.; Vojinovic, Z.; et al. Nature-based solutions for hydro-meteorological hazards: Revised concepts, classification schemes and databases. Environ. Res. 2019, 179, 108799. [Google Scholar] [CrossRef]
  88. Ishimatsu, K.; Ito, K.; Mitani, Y.; Tanaka, Y.; Sugahara, T.; Naka, Y. Use of rain gardens for stormwater management in urban design and planning. Landsc. Ecol. Eng. 2017, 13, 205–212. [Google Scholar] [CrossRef]
  89. Ercolani, G.; Chiaradia, E.A.; Gandolfi, C.; Castelli, F.; Masseroni, D. Evaluating performances of green roofs for stormwater runoff mitigation in a high flood risk urban catchment. J. Hydrol. 2018, 566, 830–845. [Google Scholar] [CrossRef]
  90. Yang, B.; Li, S. Green infrastructure design for stormwater runoff and water quality: Empirical evidence from large watershed-scale community developments. Water 2013, 5, 2038–2057. [Google Scholar] [CrossRef]
  91. Carter, J.G.; Handley, J.; Butlin, T.; Gill, S. Adapting cities to climate change—Exploring the flood risk management role of green infrastructure landscapes. J. Environ. Plan. Manag. 2018, 61, 1535–1552. [Google Scholar] [CrossRef] [Green Version]
  92. Arkema, K.K.; Griffin, R.; Maldonado, S.; Silver, J.; Suckale, J.; Guerry, A.D. Linking social, ecological, and physical science to advance natural and nature-based protection for coastal communities. Ann. N. Y. Acad. Sci. 2017, 1399, 5–26. [Google Scholar] [CrossRef]
  93. Schoonees, T.; Gijón Mancheño, A.; Scheres, B.; Bouma, T.J.; Silva, R.; Schlurmann, T.; Schüttrumpf, H. Hard Structures for Coastal Protection, Towards Greener Designs. Estuaries Coasts 2019, 42, 1709–1729. [Google Scholar] [CrossRef]
  94. Ruckelshaus, M.H.; Guannel, G.; Arkema, K.; Verutes, G.; Griffin, R.; Guerry, A.; Silver, J.; Faries, J.; Brenner, J.; Rosenthal, A. Evaluating the Benefits of Green Infrastructure for Coastal Areas: Location, Location, Location. Coast. Manag. 2016, 44, 504–516. [Google Scholar] [CrossRef]
  95. Pennino, M.J.; McDonald, R.I.; Jaffe, P.R. Watershed-scale impacts of stormwater green infrastructure on hydrology, nutrient fluxes, and combined sewer overflows in the mid-Atlantic region. Sci. Total Environ. 2016, 565, 1044–1053. [Google Scholar] [CrossRef] [PubMed] [Green Version]
  96. Tavakol-Davani, H.; Burian, S.J.; Devkota, J.; Apul, D. Performance and Cost-Based Comparison of Green and Gray Infrastructure to Control Combined Sewer Overflows. J. Sustain. Water Built Environ. 2016, 2, 04015009. [Google Scholar] [CrossRef]
  97. Lucas, W.C.; Sample, D.J. Reducing combined sewer overflows by using outlet controls for Green Stormwater Infrastructure: Case study in Richmond, Virginia. J. Hydrol. 2015, 520, 473–488. [Google Scholar] [CrossRef]
  98. Lottering, N.; Du Plessis, D.; Donaldson, R. Coping with drought: The experience of water sensitive urban design (WSUD) in the George Municipality. Water SA 2015, 41, 1–8. [Google Scholar] [CrossRef] [Green Version]
  99. Wang, Y.; Huang, J.; Chen, X. Do forests relieve crop thirst in the face of drought? Empirical evidence from South China. Glob. Environ. Chang. 2019, 55, 105–114. [Google Scholar] [CrossRef] [Green Version]
  100. Agrawal, S.; Gupta, R.D. Web GIS and its architecture: A review. Arab. J. Geosci. 2017, 10, 518. [Google Scholar] [CrossRef]
  101. Zhou, W.; Chi, C.H.; Wang, C.; Wong, R.; Ding, C. Bridging the gap between spatial data sources and mashup applications. In Proceedings of the 2014 IEEE International Congress on Big Data (BigData Congress), Anchorage, AK, USA, 27 June–2 July 2014. [Google Scholar]
  102. Feng, Q.; Flanagan, D.C.; Engel, B.A.; Yang, L.; Chen, L. GeoAPEXOL, a web GIS interface for the agricultural policy environmental eXtender (APEX) model enabling both field and small watershed simulation. Environ. Model. Softw. 2020, 123, 104569. [Google Scholar] [CrossRef]
  103. Granell, C.; Havlik, D.; Schade, S.; Sabeur, Z.; Delaney, C.; Pielorz, J.; Usländer, T.; Mazzetti, P.; Schleidt, K.; Kobernus, M.; et al. Future Internet technologies for environmental applications. Environ. Model. Softw. 2016, 78, 1–15. [Google Scholar] [CrossRef]
  104. Zhang, C.; Di, L.; Sun, Z.; Lin, L.; Yu, E.G.; Gaigalas, J. Exploring cloud-based Web Processing Service: A case study on the implementation of CMAQ as a Service. Environ. Model. Softw. 2019, 113, 29–41. [Google Scholar] [CrossRef]
  105. Esri ArcGIS Living Atlas of the World. Available online: https://livingatlas.arcgis.com/en/home/ (accessed on 18 January 2021).
  106. Castro, C.V.; Maidment, D.R. GIS preprocessing for rapid initialization of HEC-HMS hydrological basin models using web-based data services. Environ. Model. Softw. 2020, 130, 104732. [Google Scholar] [CrossRef]
  107. Szukalski, B. Use ArcGIS Living Atlas Subscriber Content in Public Maps and Apps. Available online: https://www.esri.com/arcgis-blog/products/arcgis-living-atlas/mapping/living-atlas-subscriber-content-public-apps/ (accessed on 2 June 2021).
  108. Fu, B.; Merritt, W.S.; Croke, B.F.W.; Weber, T.R.; Jakeman, A.J. A review of catchment-scale water quality and erosion models and a synthesis of future prospects. Environ. Model. Softw. 2019, 114, 75–97. [Google Scholar] [CrossRef]
  109. Singh, P. Spatial data infrastructure in India: Status, governance challenges, and strategies for effective functioning. Int. J. Spat. Data Infrastruct. Res. 2009, 4, 359–388. [Google Scholar]
  110. Choi, J.; Hwang, M.; Kim, G.; Seong, J.; Ahn, J. Supporting the measurement of the United Nations’ sustainable development goal 11 through the use of national urban information systems and open geospatial technologies: A case study of south Korea. Open Geospat. Data Softw. Stand. 2016, 1, 1–9. [Google Scholar] [CrossRef] [Green Version]
  111. Paradis, E. A review of computer tools for prediction of ecosystems and populations: We need more open-source software. Environ. Model. Softw. 2020, 134, 104872. [Google Scholar] [CrossRef]
  112. Vitolo, C.; Elkhatib, Y.; Reusser, D.; Macleod, C.J.A.; Buytaert, W. Web technologies for environmental Big Data. Environ. Model. Softw. 2015, 63, 185–198. [Google Scholar] [CrossRef] [Green Version]
  113. ESRI. Add Custom Widgets to Web AppBuilder for ArcGIS Developer Edition. Available online: https://www.esri.com/about/newsroom/arcwatch/add-custom-widgets-to-web-appbuilder-for-arcgis-developer-edition/ (accessed on 21 June 2021).
  114. Dangermond, J. The Emergence of a Geospatial Cloud. 2019. Available online: https://www.esri.com/about/newsroom/arcnews/the-emergence-of-a-geospatial-cloud/ (accessed on 8 May 2021).
  115. Zhang, M.; Jiang, L.; Yue, P.; Gong, J. Interoperable web sharing of environmental models using OGC web processing service and Open Modeling Interface (OpenMI). Environ. Model. Softw. 2020, 133, 104838. [Google Scholar] [CrossRef]
  116. CDC SVI 2016 Documentation. 2020. Available online: https://www.atsdr.cdc.gov/placeandhealth/svi/data_documentation_download.html (accessed on 3 October 2021).
  117. Jin, S.; Homer, C.; Yang, L.; Danielson, P.; Dewitz, J.; Li, C.; Zhu, Z.; Xian, G.; Howard, D. Overall methodology design for the United States national land cover database 2016 products. Remote Sens. 2019, 11, 2971. [Google Scholar] [CrossRef] [Green Version]
  118. Marchese, D.; Reynolds, E.; Bates, M.E.; Morgan, H.; Clark, S.S.; Linkov, I. Resilience and sustainability: Similarities and differences in environmental management applications. Sci. Total Environ. 2018, 613, 1275–1283. [Google Scholar] [CrossRef]
Figure 1. Framework for NBS-Geo by utilizing ArcGIS Online platform where location is the common denominator to link the backend architecture (consisting of geospatial data repositories and web-based servers, connected with REST APIs) with the frontend architecture (including user interaction and added value functions/widgets).
Sustainability 13 11018 g001
Figure 2. Web user-interface for NBS-Geo (http://tinyurl.com/nbsgeo, accessed on 3 October 2021 ). Added-value widgets and tools for downloading cloud-based datasets to a local computer are identified with (*). Added-value user widgets for screening are included with the (†) symbol. An added-value user widget for uploading custom, local geospatial datasets for integrated visualization with the cloud-based datasets is notated with the (∆) symbol.
Sustainability 13 11018 g002
Table 1. Summary of literature review for NBS co-benefits across multiple domains.
ThemeUrban ChallengeNBS Demonstrated BenefitsSources
SocietyMorbidityImprovements in various non-communicable diseases,
including heart disease, diabetes, cancer, mental
disorders, and chronic respiratory diseases.
[31,32,33,34,35,36,37]
Social VulnerabilityImproved health and social outcomes, particularly in lower socio-economic populations.[38,39,40,41]
Economic HealthImproved land values. Increased tourism. Indirect
economic benefits from improvements to local health.
[6,42,43]
Mental HealthImprovements in mental stress, depression, general
emotional wellbeing, sleep, anxiety, mood, aggression, and pain management.
[5,44,45,46,47,48,49,50]
Physical HealthImproved levels of physical activity. Reduced obesity.
Improved birth outcomes and pregnancy health.
[51,52,53,54]
CrimeReduction in crime rates, including improvements in
incidences of theft and assault.
[55,56,57,58]
Social CohesionImproved sense of community and pro-social behavior.[59,60,61]
EcosystemBiodiversityHigher levels of biodiversity in various plant, insect, bird, mammal, and aquatic species.[11,62,63,64,65]
Imperiled SpeciesHabitat preservation for native and non-native wildlife, including endangered and threatened species.[66,67]
Habitat ConnectivityIncreased movement of plants and animals between
fragmented areas, resulting in improved conservation.
[68,69,70]
EnvironmentAir PollutionImproved air quality, including abatement of particulate matter, carbon, ozone precursors, and indoor air.[71,72,73,74,75]
Urban Heat IslandEvaporative outdoor cooling effects. Reduced indoor energy consumption and improved energy savings.[9,76,77,78,79]
Noise PollutionImproved levels of urban noise, including from air and traffic-related sources.[8,80,81]
Soil ErosionReduced risk of shallow landslides. Reduced soil erosion and enhanced catchment sedimentation.[82,83]
Water QualityRemoval of contaminants in greywater reuse. Improved water quality, including levels of nutrients, metals,
suspended solids, oil/grease, oxygen, and chemicals.
[84,85,86]
HydrologyFloodingImproved peak runoff, delay, and attenuation. Reduction in total runoff volume. Reduced hydrological flashiness.[87,88,89,90,91]
Coastal ProtectionCoastal habitat protection. Mitigation for storms and
sea-level rise.
[92,93,94]
Sewer OverflowReduced occurrence and magnitude of combined sewer overflows.[95,96,97]
DroughtAgricultural protection. Improved irrigation, water
availability and food security.
[98,99]
Table 2. Geospatial datasets included in the NBS-Geo web tool, sourced from the Esri Living Atlas repository.
DatasetAttributionDescription
NBS Multi-functionality1. Vegetation Index *,‡U.S. Dept. of Agriculture (USDA)High-resolution aerial imagery describing intensity of vegetation on the Earth’s surface through the normalized difference vegetation index (NDVI).
2. Imperiled SpeciesNatureServe
Network 2020
Range-size rarity for wildlife (vertebrates, invertebrates, pollinators, plants) protected by the Endangered Species Act.
3. Open Spaces *U.S. Geological Survey (USGS)Open space lands protected by federal, state, and local governments, as well as private conservation easements.
4. Intact Habitat CoresEsriNational core index of minimally disturbed natural areas, modeled as part of Esri’s Green Infrastructure Initiative.
5. Air QualityNational Aeronautics and Space Admin. (NASA)Aggregated data in 50 km hexagonal bins of average annual particular matter (sized ≤ 2.5 micrometers, PM2.5), in microgram/m3, for years 1998–2016.
6. Opportunity ZonesU.S. Department of the Treasury (DOT)Qualified federal opportunity zones, per 2017 Tax Cuts and Jobs Act, for economic development in low-income neighborhoods.
7. Social VulnerabilityU.S. Centers for Disease Control (CDC)Social Vulnerability Index (SVI), created from U.S. census data to determine social vulnerability according to key themes: socio-economic, housing composition and disability, minority status and language, housing, and transportation.
8. Health StatisticsUniversity of WisconsinComposite county health rankings, including health behaviors (smoking, diet, and exercise), access to care, socio-economics, and life expectance.
9. Urban Heat Islands *The Trust for Public Land (TPL)Relative heat severity during summers 2018 and 2019, from Landsat 8 imagery, ground-level thermal sensors.
10. Building FootprintsOpenStreetMapBuilding feature outlines from OpenStreetMap data, updated every minute.
11. Soils Erodibility *,‡U.S. Natural Resources Cons. Service (NRCS)K-factor for national soil survey using Universal Soil Loss Equation.
12. Crime Index *Applied Geographic SolutionsTotal crime score for 2020, including personal and property crime indices compared to national crime average.
13. Transportation NoiseU.S. Department of Transportation (DOT)Transportation-related noise from exposure to aviation and highway modes.
Prediction14. Temperature AnomalyNational Center for Atmo. Research (NCAR)Projected anomalies for RCP 6.0 (most likely climate scenario) using mean results of 10 future-scenario CMIP5 climate models from Research Applications Laboratory (RAL). Temperature (℃) and average annual precipitation (mm). Anomalies represent average differences between projected years 2040–2059 compared with baseline conditions for 1986–2005.
15. Precipitation AnomalyNational Center for Atmo. Research (NCAR)
16. Land Cover Change, Year 2050 Clark UniversityPredicted land cover for year 2050, projected from historical land cover patterns in the 2018–2018 European Space Agency Climate Change Initiative maps.
Reference Data17. Environmental FacilitiesU.S. Environmental Protection Agency (EPA)Locations of facilities within the EPA Facility Registry Service (FRS), including brownfield sites, sources of air pollution, superfund sites, radioactive sites, toxic release inventory sites, greenhouse gas emitters, and power plants.
18. Air Quality MonitorsU.S. Environmental Protection Agency (EPA)Live (hourly) air quality data from local monitoring sites, displaying the average Air Quality Index (AQI).
19. Stream Gauges *U.S. Geological Survey (USGS) (and others)Live stream gauge observations, including discharge and stage height.
20. Flood Hazard Areas Federal Emergency Mgmt. Assoc. (FEMA)Federal flood insurance rate map special flood hazard area classifications.
21. Dam InventoryU.S. Army Corps of Engineers (USACE)National inventory of dams, regulated by federal and state agencies, meeting large-scale or high-hazard potential classification criteria.
22. Wetlands * Fish and Wildlife ServiceNational wetlands inventory with detailed characteristics of each area.
Hydrology23. Rainfall * WorldClimAverage global mean precipitation from WorldClim, per interpolated rainfall stations, for 1970–2000 (mm), 5 km resolution.
24. Soils Hydrology *,‡U.S. Natural Resources Cons. Service (NRCS)Hydrologic soil group classifications (A–D), depicting the rate of precipitation infiltration capability, from SSURGO soils data.
25. Terrain Elevation * VariousDigital terrain elevation model showing ground height (m) from various sources, depending on highest-resolution available.
26. Land Cover * National Land Cover Database (NLCD)Time series of land cover (20 classifications, according to modified Anderson Level-II scheme) for 2001–2016.
27. Impervious Cover * National Land Cover Database (NLCD)Time series of percent imperviousness (roadways, parking lots, rooftops) within each 30 m pixel, derived from land cover database for 2001–2016.
*: authoritative content; : subscriber content; ф: premium content.
Publisher’s Note: MDPI stays neutral with regard to jurisdictional claims in published maps and institutional affiliations.

