1. Introduction
Economic growth and economic sustainability depend heavily on the business decisions made by the owners of firms, which are in turn influenced by business obstacles that they are facing. Understanding the extent to which various business obstacles impact the decisions of business owners is therefore important for policy makers and business leaders. Current theoretical and empirical studies focus on how business obstacles affect investment decisions and sales growth, but little is known about how they affect firms’ decisions relating to firm growth and on employment stability in firms [
1,
2,
3].
The 2030 Agenda for Sustainable Development adopted in 2015 by all United Nations member states identifies 17 Sustainable Development Goals, including providing people with decent work, that are crucial to the success of the sustainability agenda. It is well documented that unemployment is an important cause of poor mental and physical health [
4,
5,
6]. In addition, the recent increasing use of nonpermanent contracts negatively affects the wellbeing of workers. At the national level, an increase in the proportion of non-permanent workers reflects job insecurity and a risk to sustainable development [
7,
8]. Yet, promoting employment and ensuring job stability receives little attention by policy makers [
9,
10,
11,
12,
13]. This study used employment growth as the surrogate for firm growth and it used the proportion of permanent to non-permanent works as an indicator of workforce stability. Business obstacles can hinder firm growth by restricting employment growth and by influencing the employment contracts offered by firms. Understanding how business obstacles affect employment growth and the percentage of permanent workers in a firm’s workforce is important to address the sustainable development goal of full and productive employment and decent work for all, thereby promoting sustainable economic growth [
14,
15,
16].
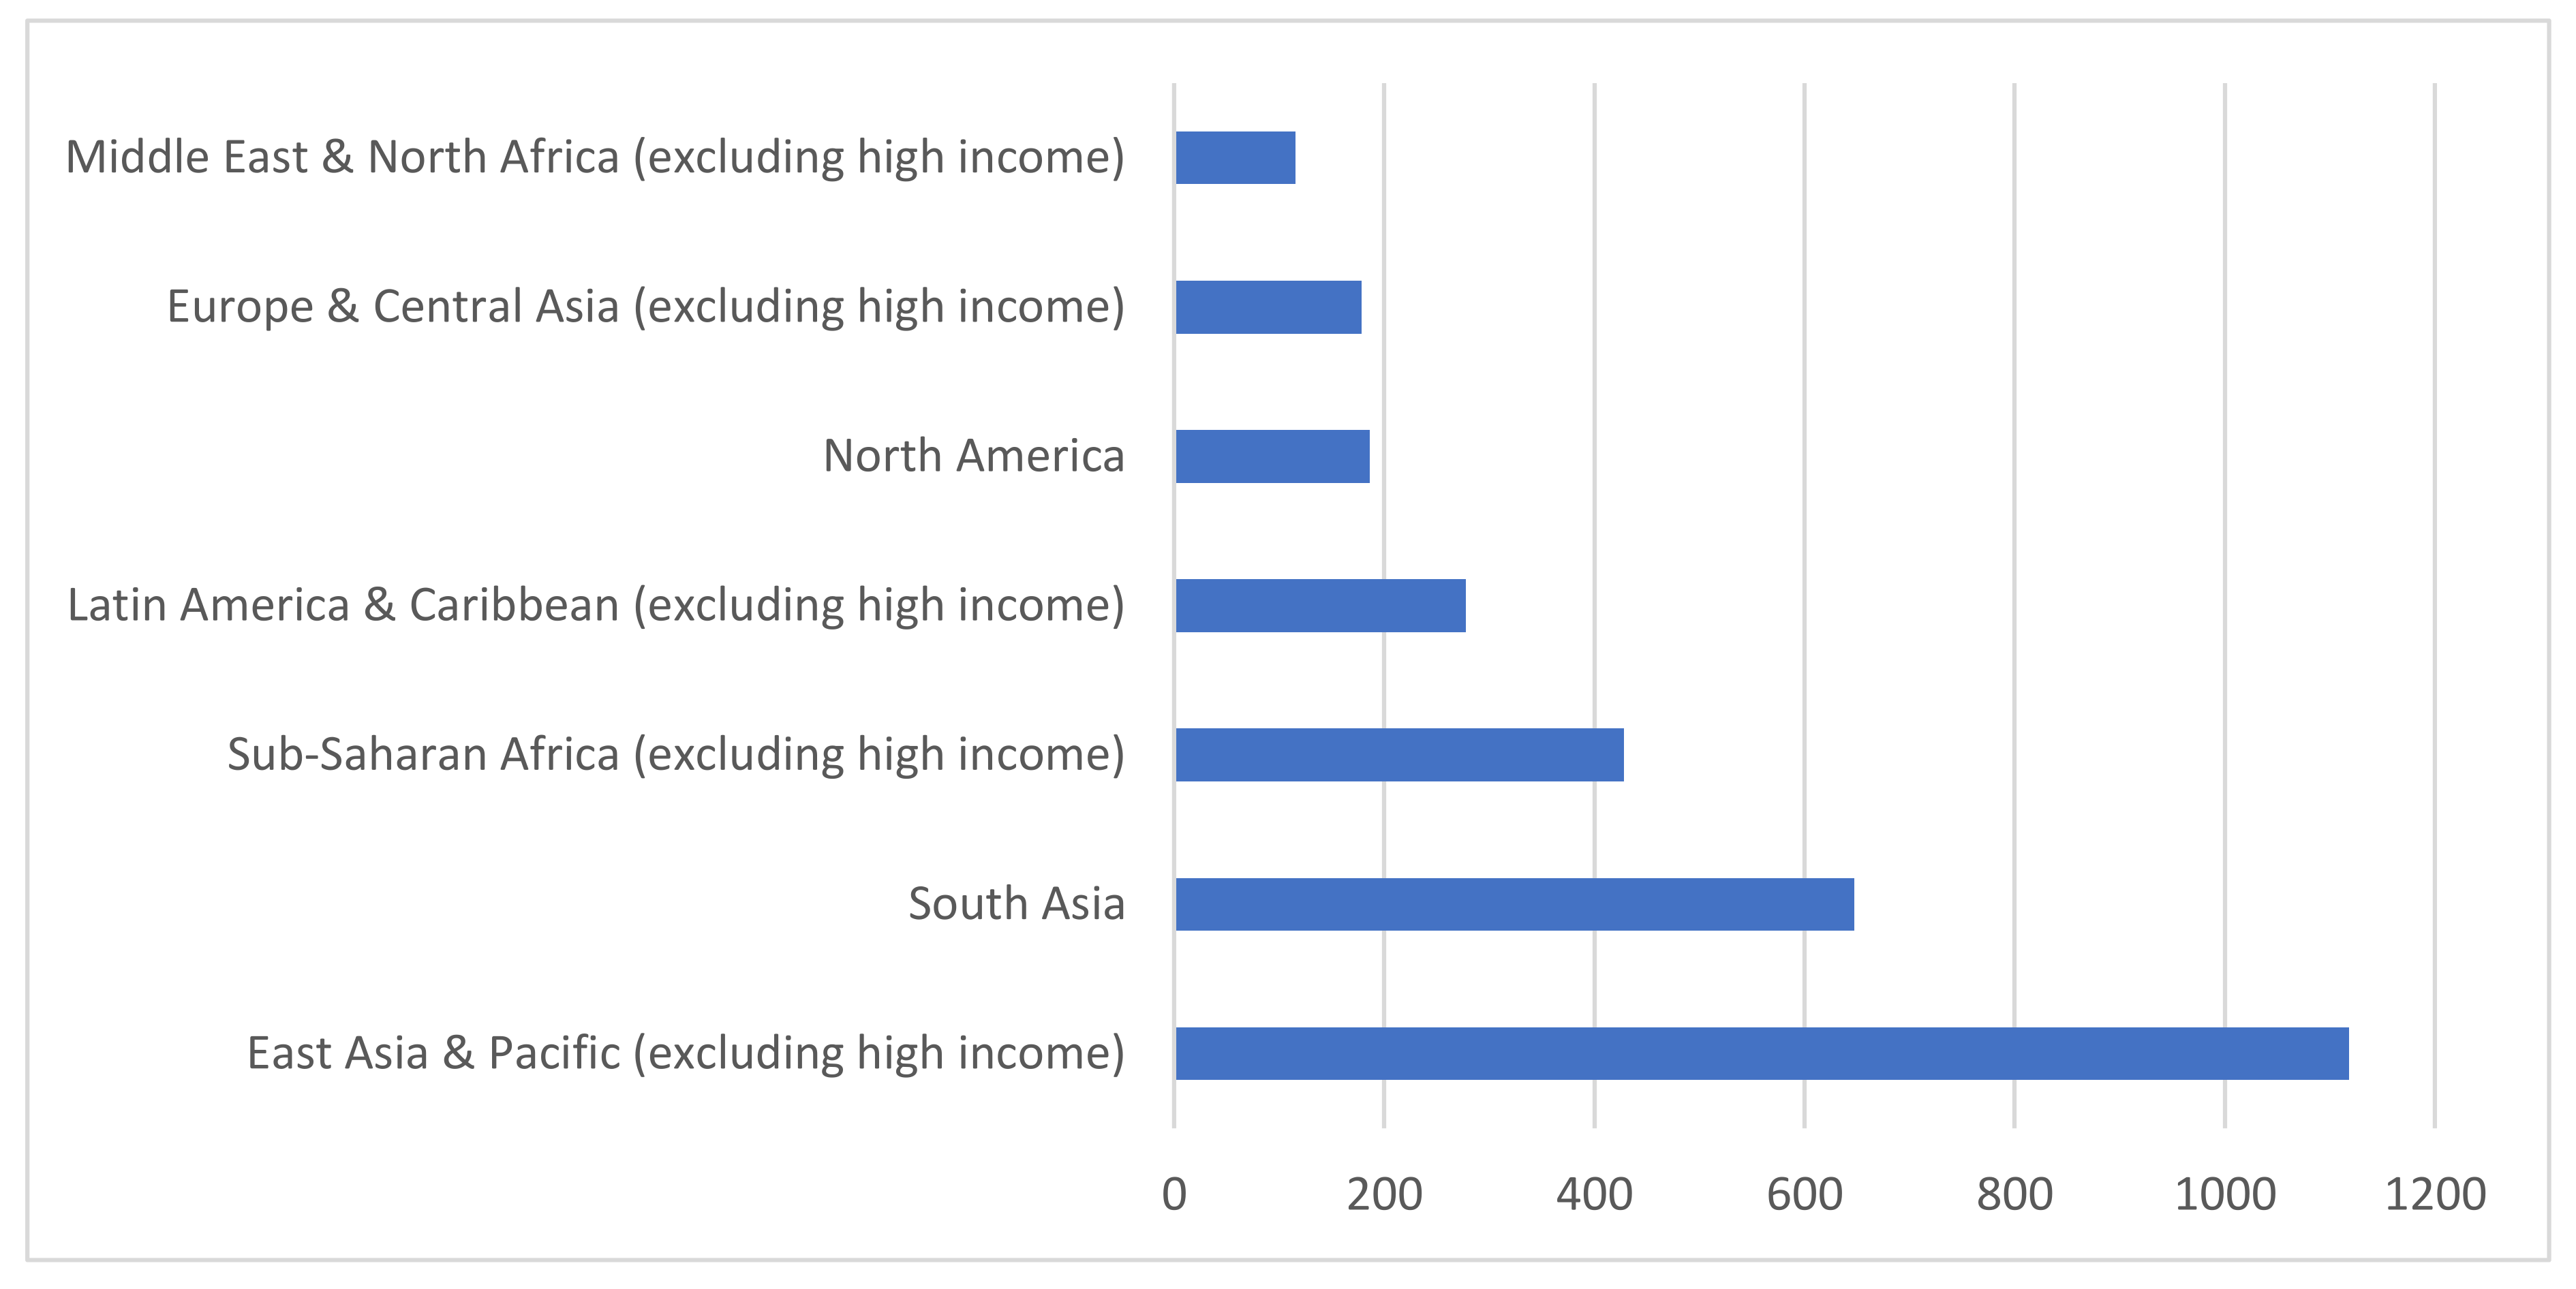
The business obstacles that are the subjects of this study were financing, labour market regulation, and the presence of an under-skilled workforce, questions about which were asked of business owners in World Bank Enterprise Surveys spanning 2009–2019. The World Bank Enterprise Surveys used in this study were conducted in East Asia and the Pacific, the most labour-intensive region globally with 1118 million workers and accounting for around 33 per cent of the total global workforce (see
Figure 1).
The intention of this article was to inform policymakers and business leaders of how business obstacles influence employment-related decisions at the firm level and therefore economic growth in the region.
Some unobservable firm characteristics may be related to firm growth and the proportion of permanent workers and, at the same time, be associated with levels of reported obstacles, thus creating bias and inconsistency in OLS estimates [
17]. Existing studies of the impact of business obstacles on firm growth and employment contracts use standard ordinary least square (OLS) that does not address the endogeneity problem brought about by the non-random assignment of obstacles [
18,
19,
20]. To overcome this issue, this study used an instrumental variables (IV) method with two-stage least squares (2SLS). This research used the average value of obstacles in each size, industry, and location as instrumental variables [
21]. The F-statistics in the first stage regressions in 2SLS were statistically significant in all regression models, indicating that the firm size, industry, and location averages are good instruments.
As well as addressing the endogeneity issue, this research builds on the prior evidence that the impact of reported obstacles varies across firm growth quantiles [
22]. The quantile method was applied to estimate the partial effect of the reported obstacles across different segments of firm growth.
In summary, this research addresses the following research questions:
Research question 1: To what extent do the business obstacles of financing, labour regulation, and the presence of an under-skilled workforce impact the level of firm growth?
Research question 2: To what extent do the business obstacles of financing, labour regulation, and the presence of an under-skilled workforce impact the level of firm growth at different levels of thereof?
Research question 3: To what extent do the business obstacles of financing, labour regulation, and the presence of an under-skilled workforce impact the percentage of permanent workers in a firm’s workforce?
The results showed a negative and significant relationship between the financing obstacle and firm growth, and the impact was greater at the lower and upper ends of the firm growth distribution. Labour regulation and under-skilled workforce obstacles have only a marginal effect on firm growth. Financing and under-skilled workforce obstacles have a negative impact on the proportion of permanent workers at the firm level.
In the next section, the related literature is reviewed and a series of hypotheses is proposed. The data and variables used in this empirical analysis are presented in
Section 3, and
Section 4 presents the research method. Regression results are presented and analysed in
Section 5. The conclusions are proffered in
Section 6 and limitations of the research and opportunities for future research are presented in
Section 7.
2. Literature Review and Hypotheses
This research stems from two strands of literature. The first strand deals with the relationship between business obstacles and firm growth and relates to research question 1 and research question 2. The second strand of the literature deals with the relationship between business obstacles and the firm’s choice between permanent and non-permanent workers, thus relating to research question 3.
Each of the research questions was transformed into a set of hypotheses that were tested and reported on in the remainder of the paper.
2.1. Reported Obstacles and Firm Growth
Several studies that examine the relationships between business obstacles and firm growth use macroeconomic measures of the business environment and combine this with firm-level data [
23,
24,
25]. In general, these studies find a positive relationship between a country’s level of financial and institutional development and firm growth and performance. Robust financial and institutional infrastructure facilitates growth at the firm level.
A number of studies rely on firm-level data from the World Bank and other national surveys to examine how reported business obstacles affect firm growth and performance [
18,
19,
26]. Existing studies show the impact of reported obstacles on firm growth depends on the level of financial and institutional development of nations [
19]. In countries with underdeveloped systems, firms are affected by all obstacles to a greater extent than countries with more developed financial and legal systems and less corruption. For example, the financing obstacle negatively affects firm growth in four out of five countries in the European area after controlling for growth opportunities, time, sectoral effects, and other firm-level variables [
27]. Financing and corruption obstacles were found to have no significant impact on sales and employment growth in 27 Eastern European and Central Asian countries during the period 2002–2009 [
28].
Published research on the link between labour regulation and the presence of an under-skilled workforce and firm performance is scant. Labour regulation and under-skilled workforce were found to exert a significant negative effect on employment growth in 30 African countries [
26]. Firms with a higher proportion of educated workers were found to be more productive based on data from the 2015 Enterprise Skill Survey in Tanzania [
29].
Based on the above analysis of the existing literature, research question 1 was proposed and the following set of hypotheses formulated.
Hypothesis 1a (H1a). There is a significant negative relationship between the financing obstacle and firm growth.
Hypothesis 1b (H1b). There is a significant negative relationship between the labour regulation obstacle and firm growth.
Hypothesis 1c (H1c). There is a significant negative relationship between the under-skilled workforce obstacle and firm growth.
The current literature shows a wide dispersion of growth rates among firms [
30,
31,
32]. Many firm-specific, unobservable factors may explain these differences in firm growth, which impies that standard OLS regression models fail to explain the variation in growth rates across firms, leaving the large role to the so-called unpredictable component of growth [
32]. The partial effect of growth factors are different across different segments of employment growth [
22,
33]. Research question 2 addresses the potential differences in the impact of business obstacles on firms with different rates of growth. This study investigated not only how business obstacles systematically affect the mean employment growth rate of the firm, but also their impact on firms in different growth quantiles. To this end, the second set of hypotheses were proposed.
Hypothesis 2a (H2a). The effects of the financing obstacle are different across different quantiles of firm growth.
Hypothesis 2b (H2b). The effects of the labour regulation obstacle are different across different quantiles of growth.
Hypothesis 2c (H2c). The effects of the under-skilled workforce obstacle are different across different quantiles of growth.
2.2. Reported Obstacles and Firm’s Choice between Permanent and Non-permanent Workers
Employment stability is a contributing factor to sustainable development [
7,
8] and is enhanced with the increased incidence of permanent employment. It is widely recognised that substantial costs are associated with recruiting staff and terminating the employment of staff. Recruitment costs include search costs (e.g., fees for recruitment agencies; advertising expenses), recruitment costs (e.g., sorting application, conducting interviews), and training costs for new employees. Layoff costs include severance allowances and legal fees. Labour regulations govern the extent of layoff costs, with permanent employees normally attracting higher layoff costs than non-permanent employees [
34]. An increase in layoff costs associated with permanent employees encourages firms to use more non-permanent workers. Recent empirical evidence shows higher permanent protection regulations create higher costs of layoffs and thus reduce the use of permanent workers at the firm level [
20,
35]. It has been observed that permanent protection reform in Europe, which aims to ease restrictions on terminating the employment of permanent workers, increased the proportion of permanent workers [
20].
Permanent and non-permanent workers are perfect substitutes, and the former is more productive [
34,
36,
37]. The financing obstacle has two contradictory effects on the choice between permanent and non-permanent workers. On the one hand, a higher financing obstacle requires firms to increase labour productivity to increase the profitability of outstanding capital, leading to increased demand for permanent workers [
36]. On the other hand, firms with higher financing obstacles are uncertain about their future financing opportunities, leading to a higher demand for non-permanent workers to ensure greater flexibility [
37]. Based on these theoretical and empirical considerations, research question 3 was formulated and the following set of hypotheses was proposed.
Hypothesis 3a (H3a). There is a significant negative relationship between the financing obstacle and the percentage of permanent workers in a firm’s workforce.
Hypothesis 3b (H3b). There is a significant negative relationship between the labour regulation obstacle and the percentage of permanent workers in a firm’s workforce.
Hypothesis 3c (H3c). There is a significant negative relationship between the under-skilled workforce obstacle and the percentage of permanent workers in a firm’s workforce.
3. Data and Variables
This study used the most current data from the World Bank Enterprise Surveys of 17 countries in East Asia and the Pacific (Available at
http://www.enterprisesurveys.org accessed on 11 September 2021). The World Bank Enterprise Surveys aim to assess the impact of the business environment on business growth. The sample consists of private sector registered companies with five or more employees in the sampled countries. The World Bank applies a stratified random sampling method to select firms in the sample. All eligible and registered firms in each country are divided into homogeneous groups. The strata for the surveys are firm size (small, medium, and large), business sector (manufacturing, retail, and other services), and geographic region within a country (distribution of firms by industry in each country is presented in
Table A1 in the
Appendix A). A simple random sampling method was used to determine which firms were surveyed in each group. This technique ensured that the samples were representative of all firms in each country and no weighting of the observation was required.
The World Bank Enterprise Surveys used in this research span the period from 2009 to 2019. Some countries were surveyed multiple times between 2009 and 2019 and some countries were surveyed only once. Only the most recent survey of each country was included in this research. The original sample comprises 8284 firms; however, some firms did not answer all the questions used in the empirical analysis, so firms that have missing values were excluded. The final sample size was 6232 firms across 17 countries in East Asia and the Pacific (See
Table A1 for the number of manufacturing and service firms in each country).
Table 1 shows the number of firms surveyed from each country. Three countries, Indonesia, the Philippines, and Vietnam, made up more than 47% of the total number of firms surveyed. At the other extreme, six countries had less than 100 surveyed firms (each country having less than 1.1% of the total number of firms surveyed).
The data collected by the World Bank Enterprise Surveys consists of business owners’ perceptions of the obstacles facing their business. Business owners rate each of 15 obstacles in terms of their perceived impact on the operation and growth of their business. The questions take the following form:
“To what degree is ________ an obstacle to the current operations of this establishment?”
where the blank space represents the reported business obstacles. The business owners rank the obstacles on a scale from 0 to 4, with 0 denoting no obstacle; 1 denoting a minor obstacle; 2 denoting a moderate obstacle; 3 denoting a major obstacle; and 4 denoting a very severe obstacle.
A potential shortcoming of relying on business owners’ perceptions is that unsuccessful business owners may blame their poor performance on the presence of business obstacles [
19,
24]. However, the purpose of World Bank Enterprise Surveys is to evaluate the business environment, not business performance and accordingly, questions on business performance are asked at the end of the interview after completing the business environment section of the survey. This sequence reduces respondents’ possibility to justify their unsuccessful performance when answering questions about the business environment [
19]. It is acknowledged that it is impossible to eliminate bias in self-reporting data. However, it is not likely to be a significant source of deviation in this study.
For each country, macro-level data on GDP growth, GDP per capita, and inflation were used as country-level controls. Annual GDP growth was used as a control variable in the model because it positively correlates to investment opportunities and firm growth. Average inflation rate was included as a control variable in the employment growth model as it is an indicator of whether the local currency provides a stable measure of value in contracts between firms [
38,
39]. Country-level variables are averages of the three years prior to the year of the survey. Detailed definitions of these measures and data sources are provided in
Table A2 in the
Appendix A.
Table 1 summarises the level of economic development indicators and reported obstacles. Countries in the sample had significant differences in GDP per capita. The lowest per capita income nations were Timor-Leste and Cambodia, with an average income of less than
$1000 per year, equal to about one-tenth of the highest per capita income country, Malaysia.
Table 1 also reports the country average of the business owner perceived levels (0–5) of financing, labour regulation, and under-skilled workforce obstacles. Interestingly, there were no country average levels of two or more, suggesting that at a country level, on average, the three obstacles were perceived to be moderate. Except for Malaysia, reported obstacles tended to be lower in countries with higher levels of GDP per capita.
Table 2 presents summary statistics of the dependent and firm-specific control variables used in this study. The measure of employment growth at the firm level is the change in the number of permanent workers employed by the firm over the past three years [
24,
40]. Growth in permanent workers reflects business performance and is of interest to policymakers [
24]. The method used to calculate employment growth at the firm level, based on [
40], was as follows:
where
is the average employment growth of firm
i in the surveyed year
t.
lnEi,t and
lnEi,t-3 are the natural logarithm of the number of permanent employees of firm
i in year
t and three year prior (
t−3), respectively. The main benefits of using the logarithm form in Equation (1) are (i) it minimises the number of outliers that usually appear when firms have few employees and (ii) the firm growth is closer to the normal distribution.
Employment in a business comprises permanent and non-permanent workers. In general, non-permanent workers receive less training and overall income compared with permanent workers and are less preferred [
41,
42]. In this paper, the percentage of permanent workers out of the total number of workers was used to measure job stability. The total number of non-permanent workers was adjusted by the number of months they worked in a year.
Some variables in the regression models are ratios and may take extreme values when the denominator is small. Statistical measures such as mean and standard deviation are sensitive to the outlier. For this reason, values that were smaller than the 2.5th percentile or greater than the 97.5th percentile of these variables were removed.
Table 2 shows that the average employment growth and percentage of permanent workers were 2.958 percent and 96.367 percent, respectively. Variation in employment growth rate was significant, with 7.944 percent standard deviation; meanwhile, the percentage of permanent workers had less variation with a standard deviation of 8.829 percent. Financing, labour regulation, and under-skilled workforce obstacles were, on average, 0.981, 0.670, and 0.982, respectively.
Table A3, in
Appendix A, presents the Pearson pairwise correlation matrix of the 16 firm-level variables listed in
Table 2. All three obstacles were significantly and positively correlated, implying that firms that report higher in one obstacle are also likely to report higher in other obstacles.
4. Research Method
The relationship between the reported impact of the financing, labour regulations, and under-skilled workforce obstacles on firm growth and percentage of permanent workers were explored. Firm growth and percentage of permanent workers at the firm level were regressed against the reported obstacles. All regressions were estimated using firm-level data. The regressions were estimated with controls for year, country, and firm-specific variables. The firm-specific variables used in this study were firm size and age, CEO experience, ownership, certified financial statements, labour cost per sale, and sales growth. The firm-specific variables were selected based on the potential impact each has on firm performance.
Firm size: The World Bank size classifications of firms was used; as such, the total number of workers was used to categorise companies into three groups: small (<20), medium (20–99), and large (>100) with the reference group being a large category. Larger firms are generally associated with more stable sales, more collateralised equipment, greater potential to generate and utilise big data, being less risky to investors, and having higher growth opportunity [
43,
44]. Two variables, Small and Medium, were included, small firms taking the value of one and medium firms taking the value of zero.
CEO experience: CEO experience was measured by the number of years of management experience in a similar business sector. The firm performance and growth are influenced by the expertise of the owner and the chief executive officer (CEO) [
45,
46].
Certified financial statements: Externally verified financial statements are a fundamental aspect of financial reporting. Audited financial statements are considered more reliable and informative than uncertified financial statements and this significantly influences the decision of investors and lenders. Audited firms pay significantly lower interest rates and thus have higher growth opportunity than firms producing unaudited financial statements [
47,
48]. The reliability of the company’s financial statements was estimated by the presence (or not) of financial statements that were audited by an independent auditor. The dummy variable took the value of 1 if the financial statements were audited by an independent auditor and 0 if not.
Business ownership: The impact of ownership on employment growth and the percentage of permanent workers was controlled for. Government-owned companies may grow at a different rate than companies without a government stake because of their other goals and government supports. Firms with foreign capital may have dissimilar growth than those without foreign ownership. Foreign-owned firms may have better access to finance; however, they may have more trouble with local regulation.
Other firm-level variables, including industry, firm age, labour cost per sales dollar, and sales growth were also controlled for. These variables are widely used in the literature when examining the determinants of employment growth and choices between permanent and temporary workers (for example, see [
49,
50,
51]).
Table A2 in
Appendix A provides detailed descriptions and sources of each variable.
This paper examined the impact of financing, labour regulation, and under-skilled workforce obstacles on employment growth and percentage of permanent workers. This was achieved by firstly estimating standard ordinary least square (OLS) regressions as follows:
where
is the dependent variables of interest, either firm growth or percentage of permanent workers of firm
observed in country
and year
;
are country fixed effects;
are year fixed effects;
denotes the error term.
The OLS regression in Equation (2) estimates the average relationship between the set of regressors and the outcome variables based on the conditional mean function .
The main challenge in estimating the impact of the obstacles on employment growth and the percentage of permanent workers is the endogeneity problem induced by the non-random assignment of obstacles. It is possible that unobserved firm characteristics may make some firms grow faster and use more permanent workers than the others and this unobservable component may not be randomly assigned between firms. The source of the endogeneity problem is identified as the correlation between the error term and one or more independent variables. As a result, the OLS may produce biased and inconsistent estimates [
17]. The strategy adopted to address the endogeneity issue is the application of instrumental variables (IV) to cut the correlations between the error term and independent variables. To apply IV estimation with two-stage least squares (2SLS), it is necessary to find instrumental variables that are firstly uncorrelated with the error term and secondly partially and sufficiently strongly correlated with predicted variables. It is impractical to test the first assumption, since the error term is unobservable. The second condition can be tested by regressing the endogenous firm level obstacles on the instruments and other exogenous variables. The second condition implies that that changes in instrumental variables are associated with changes in endogenous variables but do not lead to change in outcome variables aside from the indirect route via endogenous variables. It is still the case that the instrumental variables and outcome variables are correlated, but the only source of such a correlation is the indirect path of IVs being correlated with endogenous variables. The technique of [
21] was used in the empirical analysis, where the average value of the obstacle across firm sizes in each industry in each geographic location became instrumental variables. Instrumenting the obstacles with the average obstacle for each size, industry, and location isolates the exogenous part of the possibly endogenous obstacle the firm reports, which can be used to predict employment growth and the percentage of permanent workers. Additionally, when the obstacles are measured at the firm size, industry, and location level of aggregation, causality is likely to run from the average obstacles to individual firms, not vice versa.
In Equation (2), financing obstacle, labour regulation obstacle, and under-skilled workforce obstacle are endogenous variables. As discussed, three corresponding instrumental variables are proposed in the 2SLS estimate. In the first stage, each of the endogenous variables are regressed on all exogenous independent variables and instrumental variables as follows:
where
is each of the firm-reported financing, labour regulation and under-skilled workforce obstacles.
and
are each of the endogenous variables and their linear projections, respectively. Since
is projected with all exogenous variables which are not correlated with the error term,
in Equation (2),
is not correlated with
while
is correlated with
. By estimating individual endogenous variables in Equations (3)–(5) with all exogenous (independent and instrumental) variables, the reported obstacles are separated into two parts: one is correlated with the error term,
and the other is not.
In the second stage regression, linear projection of obstacles was used, instead of the reported obstacle in Equation (2) to estimate firm growth and the percentage of permanent workers against
and all exogenous independent variables as follows:
It is possible that the partial effect of reported obstacles may be different across different segments of employment growth [
22,
33]. The quantile estimation method used by [
52,
53] to investigate such effects was applied to this study. The regression model for quantiles level
of the response is as follow
where
is the
quantile of employment growth firm
observed in country
and year
.
is a vector of firm-level control variables. The slopes and the intercepts in the quantile model
depend on
.
To test the hypotheses that a reported obstacle is related to firm employment growth and permanent employment ratio, a t-test was performed to determine if its corresponding coefficient was significantly different from zero.
5. Results and Discussion
Table 3 reports the estimated relationship of financing, labour regulation, and under-skilled workforce obstacles with employment growth at the firm level. All regressions were estimated using firm-level data in 17 countries and country-year fixed effects. Columns (1) and (2) provide OLS and IV estimates for the conditional mean. Both OLS and IV estimates show that financing obstacle has a negative and significant effect on employment growth. Each additional level of financing obstacle is associated with a fall in firm employment growth of 0.332 percentage points, thus supporting
H1a: There is a significant negative relationship between the financing obstacle and employment growth. The result is consistent with current literature, confirming that the financing obstacle is a relevant factor in explaining firm employment growth and therefore firm growth [
27,
54].
Labour regulation and under-skilled workforce obstacles were not statistically significant in the OLS and IV models holding other control variables fixed. This suggests that the impact of labour regulation and under-skilled workforce obstacles may be captured by the financing obstacle. This result does not support H1b: There is a significant negative relationship between the labour regulation obstacle and employment growth or H1c: There is a significant negative relationship between the under-skilled workforce obstacle and employment growth.
Columns (3)–(6) of
Table 3 provide estimates of regressions for the 10th, 25th, 75th, and 90th quantiles, showing that the negative relationship between the financing obstacle and employment growth differs across quantiles. The relationship between the financing obstacle and employment growth was strongest at the lowest level of the employment growth distribution (at 10th quantile). On average, for firms in the 10th quantile, each additional level of financing obstacle was associated with a fall of 0.982 percentage points in employment. This coefficient was much higher than the coefficient for the overall IV estimate (−0.332) and for firms in the higher level quantiles. This suggests that slow growing firms rely more heavily on external financing than higher growth firms and therefore obstacles to finance have a stronger impact on employment growth in those firms. Interestingly, the labour regulation only affects fast growth firms. A one-level increase in the reported labour regulation was associated with a drop of 0.258 ad 0.604 percentage point in 75th and 90th quantiles, respectively. These findings support
H2a: The partial effects of the financing obstacle are different across different quantiles of employment growth, and
H2b: The partial effects of the labour regulation obstacle are different across different quantiles of employment growth. They are also consistent with [
22,
33], who find that the partial effects of reported obstacles on employment growth are different across different segments of employment growth.
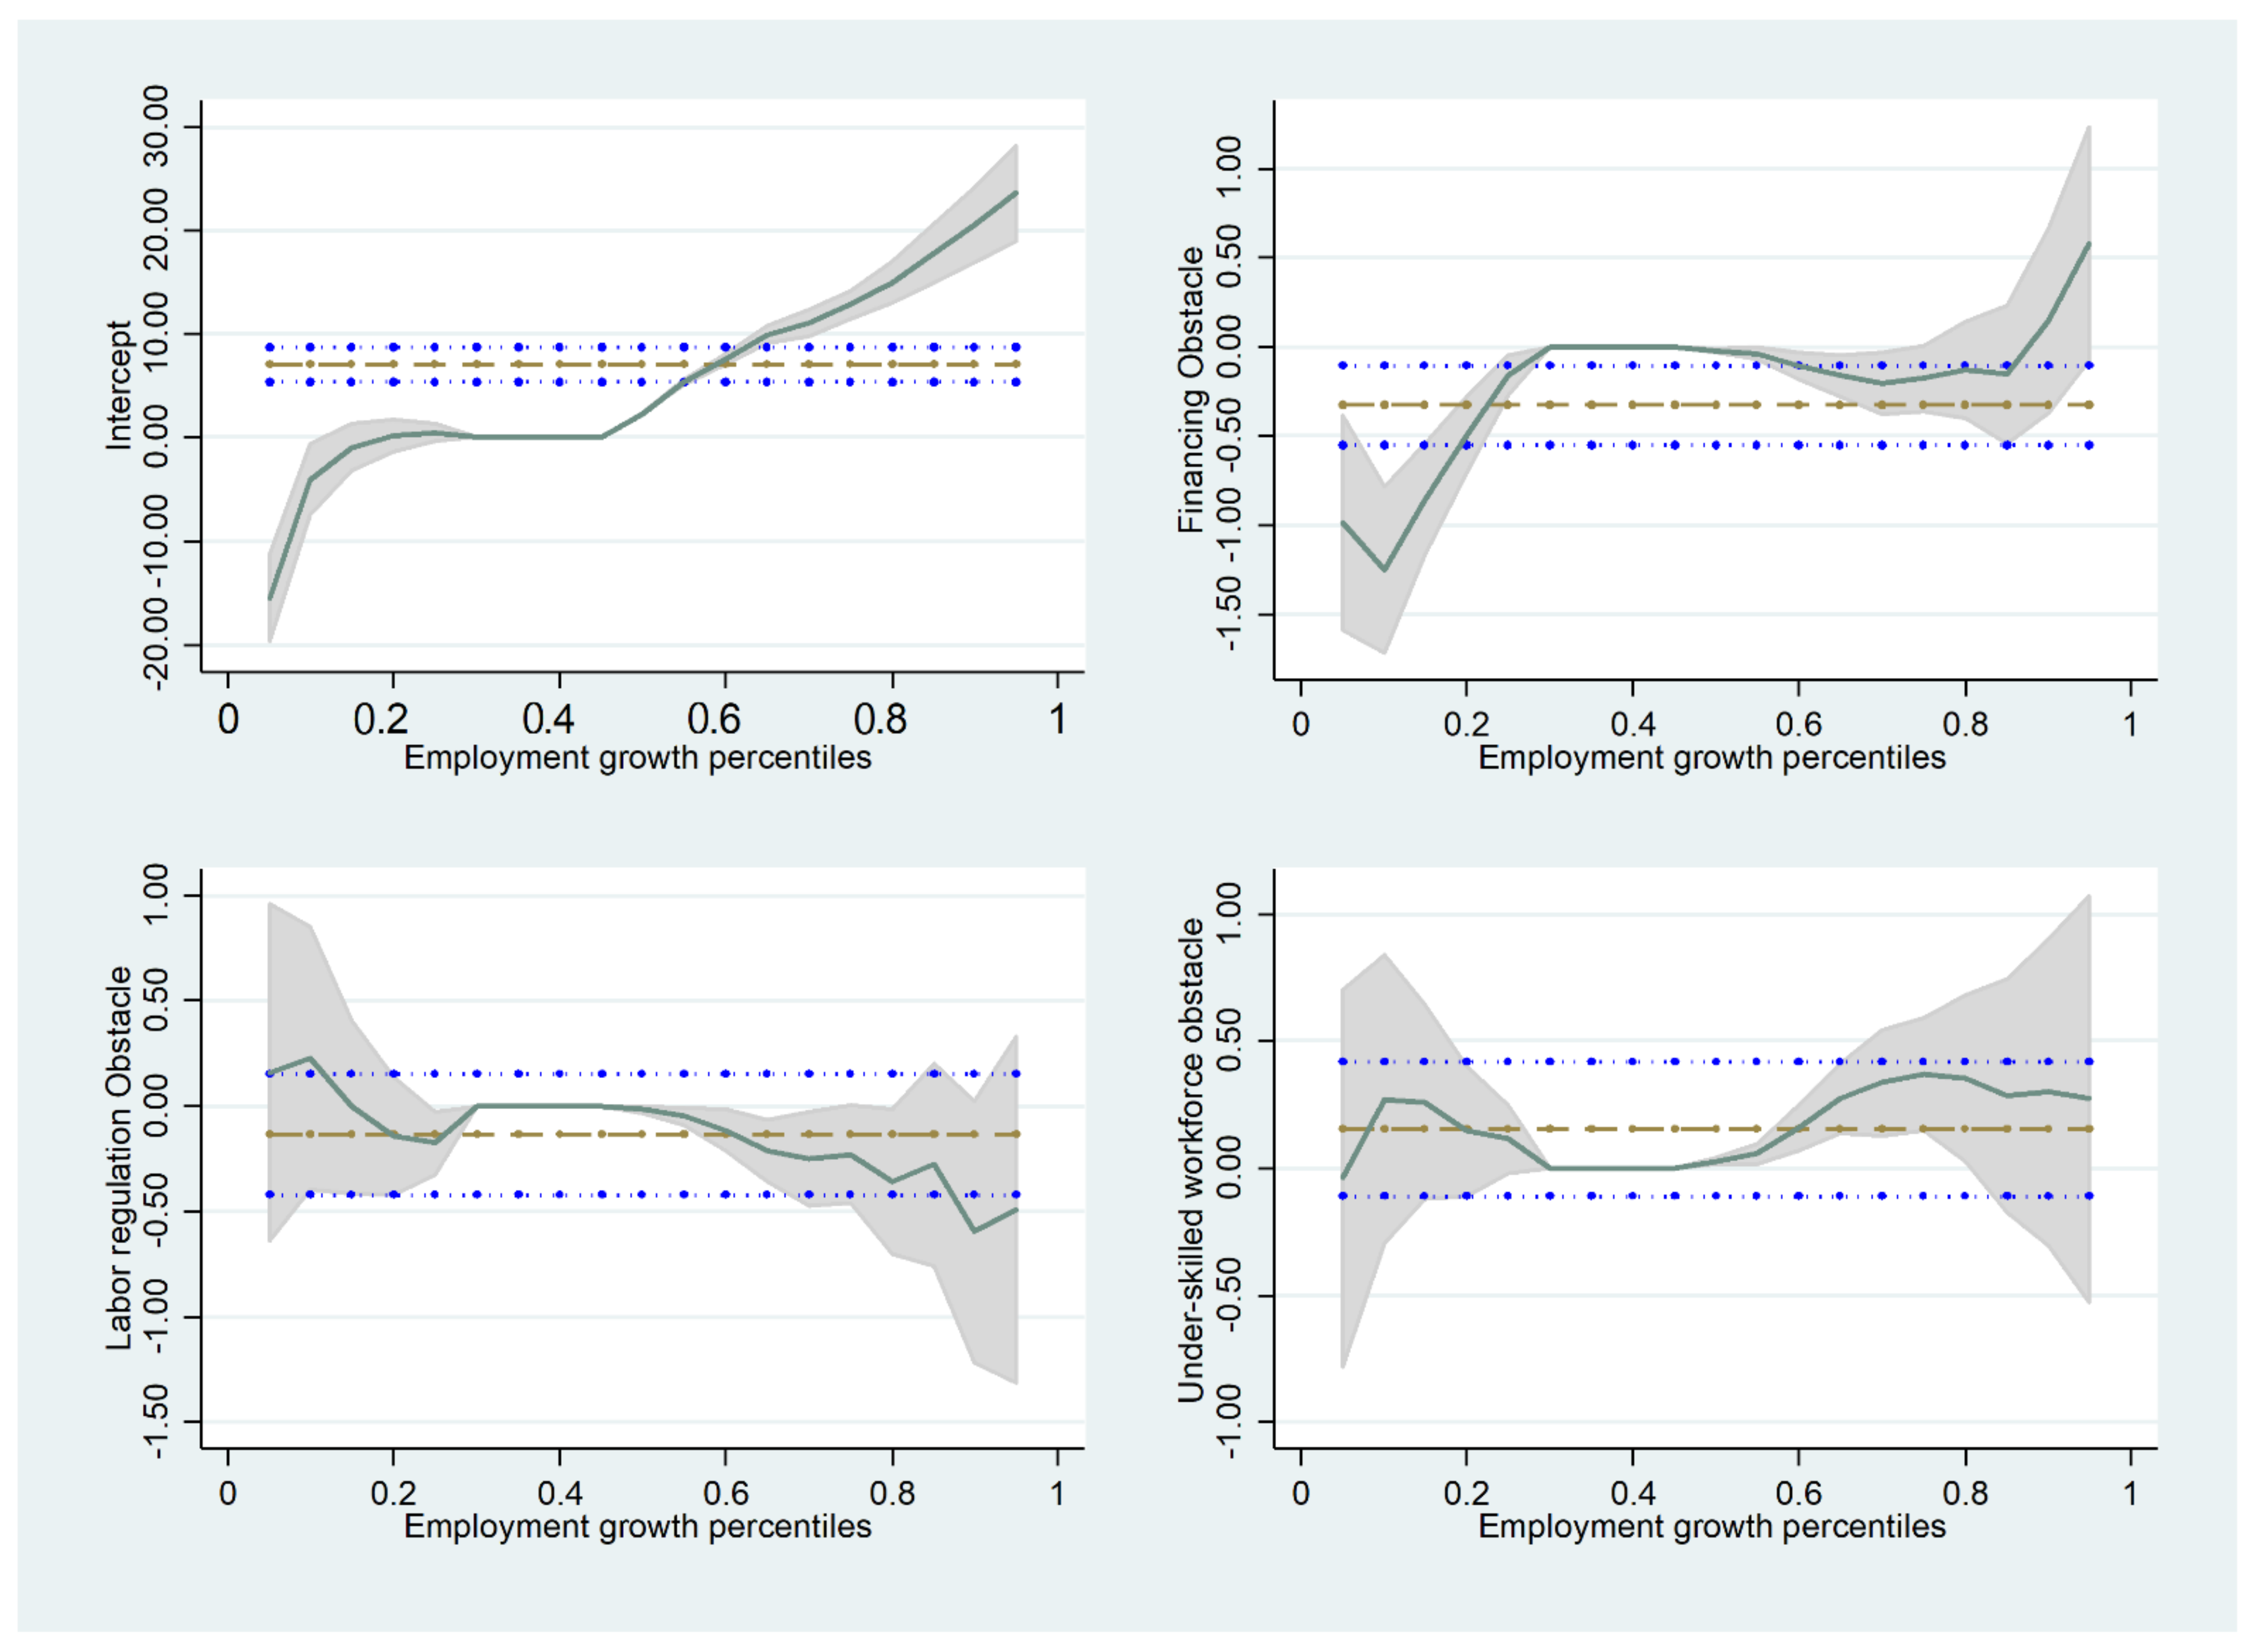
Figure 2 plots estimated financing, labour regulation, and under-skilled workforce obstacles coefficients at different quantiles of the employment growth distribution. The blue and red dashed lines are the OLS estimates of the coefficients and their 95 percent confidence interval, respectively. The effects of obstacles on employment growth on the median (around 50th quantile) was nonexistent. The financing obstacle significantly impacted both the low end and upper end of the employment growth distribution. The coefficients of the under-skilled workforce obstacles were insignificant at 5 percent level across quantiles, suggesting that the two specific obstacles are at most weakly related to employment growth. This finding does not support
H2c: The partial effects of the under-skilled workforce obstacle are different across different quantiles of employment growth.
Table 4 reports how the three obstacles relate to the percentage of permanent workers at the firm level. Five model specifications for robustness tests were estimated. Firstly, the OLS (1) and IV (2) regressions, wherein we incorporated all three obstacles, were run: financing, labour regulation, and under-skilled workforce. Next, the individual effects of each obstacle were investigated using the OLS method (Models 3–5). In all instances, estimates using the IV approach yielded similar results. On average, each additional level of financing obstacle was associated with a 0.208 percentage point reduction in the percentage of permanent workers in a firm’s workforce. This result suggests that, on average, in the presence of a financing obstacle, the demand for workforce flexibility outweighs the demand for increased productivity. This finding supports
H3a: There is a significant negative relationship between the financing obstacle and the percentage of permanent workers in a firm’s workforce. The coefficient of the predicted labour regulation obstacle was insignificant, suggesting that this specific obstacle is only weakly related to firms’ choice of employment contract. Thus, the estimates do not support H3b: There is a significant negative relationship between the labour regulation obstacle and the percentage of permanent workers in a firm’s workforce.
Under-skilled workforce obstacles had a negative and significant effect on the percentage of permanent workers in a firm’s workforce, as expected. The results indicate that increased under-skilled workforce obstacles may create higher costs of recruitment and training of permanent workers. Therefore, firms use fewer permanent workers to minimise these costs. This finding supports H3c: There is a significant negative relationship between the under-skilled workforce obstacle and the percentage of permanent workers in a firm’s workforce.
When looking at the control variables, the results showed that small firms had a lower percentage of permanent workers in their workforce compared with medium and large firms, suggesting that small firms face greater fluctuation in their business activity, requiring greater flexibility in labour resources.
Other control variables had marginal effects on the percentage of permanent workers. The estimate reinforces the argument that the percentage of permanent workers depends primarily on demand for flexibility and the expected costs associated with hiring and layoffs of permanent workers.
Table 5 summarises the relationship between business obstacles, firm growth, and proportion of permanent workers in a firm workforce. Financing obstacle had a negative and significant effect on both firm growth and the percentage of permanent workers in a firm’s workforce. Labour regulation and under-skilled workforce obstacles had a minimal effect on firm growth; however, they inversely affected the percentage of permanent workers in a firm’s workforce.
6. Conclusions
This paper shed light on the role of financing, labour regulations, and under-skilled workforce obstacles on employment growth and therefore firm growth, and on the percentage of permanent workers at the firm level, by addressing the three research questions proffered at the beginning of this article:
Research question 1 asks ‘To what extent do the business obstacles of financing, labour regulation and the presence of an under-skilled workforce impact on the level of firm growth?’ The results indicated that, overall, the financing obstacle had a negative and significant effect on firm growth; however, labour regulation and under-skilled workforce obstacles had little effect on firm growth.
Research question 2 asks ‘To what extent do the business obstacles of financing, labour regulation and the presence of an under-skilled workforce impact on the level of firm growth at different levels of firm growth?’ This research found the relationship between the financing obstacle and firm growth was strongest at the lower end of the growth distribution. Labour regulations were found to impact only fast growth firms and the presence of an under-skilled workforce has no discernable impact on any level of firm growth. Medium growth firms registered no significant impact of any of the three obstacles to their growth.
Research question 3 asks ‘To what extent do the business obstacles of financing, labour regulation and the presence of an under-skilled workforce impact on the percentage of permanent workers in a firm’s workforce?’ The results of this study showed that the financing obstacle and the under-skilled workforce obstacle had a negative and significant impact on the percentage of permanent workers in a firm’s workforce. No significant relationship was found to exist between the labour regulation obstacle and the percentage of permanent workers in a firm’s workforce.
Both employment growth and employment stability contribute to economic sustainability. This study suggested that there is potential to support economic sustainability through employment growth and thereby firm growth by implementing policies to reduce the financing obstacles confronting firms that are experiencing slow growth. Reductions in the financing obstacle and improvements in the skill level of the workforce can bring about improvements in employment stability by enabling firms to use higher proportions of permanent workers. Of the three obstacles, the financing obstacle had the strongest and most pervasive impact on firm growth and employment stability. In the interest of achieving economic sustainability, the financing obstacle needs to be analysed and action taken to counterbalance its impact on firm growth and employment stability.
7. Limitations and Opportunities for Future Research
Economic sustainability is subject to many environmental, political, social, and business factors. This study isolated business obstacles that are considered to be indirectly relevant to economic sustainability through their direct relationship with employment growth and the incidence of permanent employment. Business obstacles are many and varied, and those considered in this research, financing, labour regulation, and the presence of an under-skilled workforce, were chosen because of their prevalence in other, similar economic research and because they can be, to some extent, manipulated by political and business leaders, making the study of interest to such decision makers. One of the limitations of this research rests with the small number of business obstacles included in the models. Potential exists to replicate this study with a different set of business obstacles.
Two limitations arise due to the fact that a single data source, the World Bank Enterprise Survey data, was used to test the hypotheses proposed in this study. Firstly, the World Bank Enterprise Surveys are restricted to 17 countries in East Asia and the Pacific and although it can be argued that this region is the most labour-intensive region in the world and the findings are generalisable to other regions, the finding will be strengthened with replication of the study in other regions, thus presenting an opportunity for future research. The second limitation associated with the data source relates to potential self-reporting bias, since the World Bank Enterprise Surveys collect business-owner perceived impacts of business obstacles on firm growth and the percentage of permanent workers in a firm’s workforce. The presence of self-reporting bias cannot be eliminated entirely; however, reporting bias in the World Bank Enterprise Surveys is considered to be insignificant to this study since it is made clear to respondents that the purpose of the survey is to collect data about the business environment, not the individual firm, and the survey is designed to minimise any such bias [
19]. One possible expansion on this work would be to include objective measures of the business environment. For example, instead of relying only on the extent to which firms complain about financial constraints, other information on the actual access to bank loans or trade credit could be included in the regression models.
The impact of the business environment may not be uniform across firm of different sizes. Market failures or policy distortions can generate fixed costs in the operation of businesses creating more disadvantages for small firms. For example, the costs of dealing with imperfections in credit market information or with a complex and non-transparent regulatory environment are relatively higher for smaller firms [
24]. Another possible extension is to assess whether the effects of obstacles on firm growth and performance vary across firms of different sizes.
Acknowledging the limitations that are implicit in perceptions-based research, opportunities exist to confirm the findings by conducting post-hoc case-study research that investigates changes in employment growth and changes in the percentage of permanent employees following changes in financing, labour regulation, and under-skilled workforce obstacles in a sample of countries. Such in-depth case studies will provide rich information about the behaviour of small business owners in the face of changing business obstacles. Given the importance of the financing obstacle, there is potential for research that investigates in detail the individual aspects of the obstacle and the impact of each aspect on firm growth and employment stability.
Author Contributions
Conceptualization, A.T.B., S.L., T.D.P., G.R.; methodology, A.T.B., S.L.; software, A.T.B.; validation, A.T.B., S.L., T.D.P., G.R.; formal analysis, A.T.B., S.L., G.R.; investigation, A.T.B., S.L., G.R.; resources, A.T.B., S.L.; data curation, A.T.B., T.D.P.; writing—original draft preparation, A.T.B., S.L., G.R.; writing—review and editing, A.T.B., S.L.; visualization, A.T.B., S.L.; supervision, A.T.B.; S.L.; project administration, A.T.B., S.L.; funding acquisition, A.T.B. All authors have read and agreed to the published version of the manuscript.
Funding
This research is funded by Vietnam National Foundation for Science and Technology Development (NAFOSTED) under grant number 502.01-2017.09.
Institutional Review Board Statement
Not applicable.
Informed Consent Statement
Not applicable.
Data Availability Statement
Not applicable.
Conflicts of Interest
The authors declare no conflict of interest.
Appendix A
Table A1.
Distribution of Firms by Manufacturing/Service Sector.
Table A1.
Distribution of Firms by Manufacturing/Service Sector.
| Countries | Manufacturing | Services | Total |
|---|
| Cambodia | 120 | 194 | 314 |
| Fiji | 20 | 41 | 61 |
| Indonesia | 1014 | 238 | 1252 |
| Lao PDR | 105 | 123 | 228 |
| Malaysia | 430 | 264 | 694 |
| Micronesia | 7 | 36 | 43 |
| Mongolia | 120 | 234 | 354 |
| Myanmar | 309 | 192 | 501 |
| Papua New Guinea | 22 | 36 | 58 |
| Philippines | 702 | 196 | 898 |
| Samoa | 19 | 46 | 65 |
| Solomon Islands | 37 | 87 | 124 |
| Thailand | 421 | 187 | 608 |
| Timor-Leste | 58 | 62 | 120 |
| Tonga | 25 | 36 | 61 |
| Vanuatu | 8 | 60 | 68 |
| Vietnam | 547 | 236 | 783 |
| Total | 3964 | 2268 | 6232 |
Table A2.
Variable Definitions and Sources.
Table A2.
Variable Definitions and Sources.
| | Description | Data Source |
|---|
| Percentage of permanent workers | Number of permanent workers over the total number of workers (adjusted for actual number of month non-permanent workers worked). | ES |
| Firm growth | The average growth rate in the number of permanent employees over the last three years. | ES |
| Small | Dummy variable equals one if the firm is small-sized (<20 employees) and equals 0 otherwise. | ES |
| Medium | Dummy variable equals one if the firm is medium-sized (from 21 to 100 employees) and equals 0 otherwise. | |
| Government | Dummy variable that takes the value of 1 if the firm has government ownership. | ES |
| Foreign | Dummy variable that takes the value of 1 if the firm has foreign ownership. | ES |
| Experience | The number of years the firm’s top managers worked in the sector. | ES |
| Mature firm | Firm age is between 6 and 15 years. | ES |
| Old firm | Firm age is 16 year and above. | ES |
| Certified | Dummy that indicates if the firm’s financial statement was checked and certified by an external auditor. | ES |
| Manufacturing | Dummy variable that takes on the value one if the firm is in the manufacturing industry. | ES |
| Labour cost per sales | Total labour cost/total sales. | ES |
| Sales growth | The average sales growth rate in the last three years. | ES |
| Financing obstacle | A measure of the level of access to finance obstacle to the operation and growth of the business. It takes values from 0 (No obstacle) to 4 (Very severe obstacle). | ES |
| Labour regulation obstacle | A measure of the level of labour regulation obstacle to the operation and growth of the business. It takes values from 0 (No obstacle) to 4 (Very severe obstacle). | ES |
| Under-skilled workforce obstacle | A measure of the level of under-skilled workforce obstacle to the operation and growth of the business. It takes values from 0 (No obstacle) to 4 (Very severe obstacle). | ES |
| GDP per capita | Average of real GDP per capita (in US dollars) in the last three years. | WDI |
| GDP growth | Average growth rate of real GDP in US dollars in the last three years. | WDI |
| Inflation | Average of the natural logarithm of the difference in the consumer price index in the last three years. | IFS |
Table A3.
Correlations.
| | | (1) | (2) | (3) | (4) | (5) | (6) | (7) | (8) | (9) | (10) | (11) | (12) | (13) | (14) | (15) |
|---|
| Firm growth | (1) | 1 | | | | | | | | | | | | | | |
| Permanent ratio | (2) | −0.0094 | 1 | | | | | | | | | | | | | |
| Financing obstacle | (3) | −0.0131 | −0.0345 * | 1 | | | | | | | | | | | | |
| Labour regulation obstacle | (4) | 0.0267 * | −0.0175 | 0.3457 * | 1 | | | | | | | | | | | |
| Under-skilled workforce obstacle | (5) | 0.0617 * | −0.0501 * | 0.3771 * | 0.5798 * | 1 | | | | | | | | | | |
| Small | (6) | −0.0791 * | 0.0678 * | 0.0483 * | −0.1186 * | −0.0805 * | 1 | | | | | | | | | |
| Medium | (7) | 0.0387 * | −0.0617 * | 0.000 | 0.011 | 0.0268 * | −0.6082 * | 1 | | | | | | | | |
| Government | (8) | 0.0154 | 0.0172 | 0.016 | 0.0256 * | 0.0132 | −0.0769 * | −0.0207 | 1 | | | | | | | |
| Foreign | (9) | 0.0255 * | −0.0604 * | −0.0507 * | 0.1148 * | 0.0899 * | −0.1903 * | −0.0483 * | 0.0633 * | 1 | | | | | | |
| Experience | (10) | −0.0661 * | 0.0005 | −0.0767 * | −0.1050 * | −0.0935 * | −0.0598 * | 0.0141 | 0.0251 * | −0.0464 * | 1 | | | | | |
| Mature firm | (11) | 0.0486 * | −0.0637 * | 0.0078 | 0.0037 | 0.0345 * | 0.1131 * | −0.0147 | −0.0338 * | −0.0751 * | −0.3075 * | 1 | | | | |
| Old firm | (12) | −0.1030 * | 0.0734 * | −0.0217 | 0.0054 | −0.0409 * | −0.1504 * | 0.0191 | 0.0401 * | 0.0768 * | 0.3779 * | −0.8820 * | 1 | | | |
| Certified | (13) | 0.0746 * | −0.1345 * | 0.023 | 0.1150 * | 0.1188 * | −0.1908 * | 0.0165 | 0.0753 * | 0.2103 * | 0.0142 | −0.0643 * | 0.0735 * | 1 | | |
| Manufacturing | (14) | −0.0720 * | 0.0073 | −0.0546 * | −0.0134 | −0.0688 * | −0.1974 * | 0.0315 * | 0.0275 * | 0.0915 * | 0.0703 * | −0.0744 * | 0.0942 * | −0.0126 | 1 | |
| Labour cost per sale | (15) | −0.0125 | 0.017 | 0.0129 | −0.0277 * | −0.0155 | 0.0546 * | −0.0224 | 0.0058 | −0.0612 * | 0.0007 | 0.0371 * | −0.0371 * | −0.0941 * | 0.0123 | 1 |
| Sales growth | (16) | 0.1932 * | 0.0091 | 0.0394 * | 0.0415 * | 0.0548 * | −0.012 | −0.0055 | −0.004 | −0.0255 * | −0.0448 * | 0.0092 | −0.0384 * | 0.0323 * | 0.0310 * | −0.0695 * |
References
- Oliveira, B.; Fortunato, A. Firm Growth and Liquidity Constraints: A Dynamic Analysis. Small Bus. Econ. 2006, 27, 139–156. [Google Scholar] [CrossRef] [Green Version]
- Bottazzi, G.; Secchi, A.; Tamagni, F. Financial constraints and firm dynamics. Small Bus. Econ. 2012, 42, 99–116. [Google Scholar] [CrossRef]
- Broome, T.; Moore, W.; Alleyne, P. Financing constraints and the R&D decision in the Caribbean. Entrep. Reg. Dev. 2018, 30, 964–986. [Google Scholar] [CrossRef]
- Colman, G.; Dave, D. Exercise, physical activity, and exertion over the business cycle. Soc. Sci. Med. 2013, 93, 11–20. [Google Scholar] [CrossRef] [PubMed]
- Colman, G.; Dave, D. Unemployment and Health Behaviors over the Business Cycle: A Longitudinal View. South. Econ. J. 2018, 85, 93–120. [Google Scholar] [CrossRef]
- Guo, Y.; Shen, M.; Zhang, X.; Xiao, Y.; Zhao, S.; Yin, M.; Bu, W.; Wang, Y.; Chen, X.; Su, J. Unemployment and Health-Related Quality of Life in Melanoma Patients during the COVID-19 Pandemic. Front. Public Health 2021, 9, 630620. [Google Scholar] [CrossRef]
- Beck, U. The Brave New World of Work; John Wiley & Sons: Hoboken, NJ, USA, 2014. [Google Scholar]
- Virtanen, P.; Saloniemi, A.; Vahtera, J.; Kivimaäki, M.; Virtanen, M.; Koskenvuo, M. The Working Conditions and Health of Non-Permanent Employees: Are There Differences between Private and Public Labour Markets? Econ. Ind. Democr. 2006, 27, 39–65. [Google Scholar] [CrossRef]
- Ryder, G. Decent Work and the 2030 Agenda for Sustainable Development; International Labour Organization: Geneva, Switzerland, 2019. [Google Scholar]
- Tsalis, T.A.; Malamateniou, K.E.; Koulouriotis, D.; Nikolaou, I.E. New challenges for corporate sustainability reporting: United Nations’ 2030 Agenda for sustainable development and the sustainable development goals. Corp. Soc. Responsib. Environ. Manag. 2020, 27, 1617–1629. [Google Scholar] [CrossRef]
- Boto-Álvarez, A.; García-Fernández, R. Implementation of the 2030 Agenda Sustainable Development Goals in Spain. Sustainability 2020, 12, 2546. [Google Scholar] [CrossRef] [Green Version]
- Santos-Carrillo, F.; Fernández-Portillo, L.; Sianes, A. Rethinking the Governance of the 2030 Agenda for Sustainable Development in the COVID-19 Era. Sustainability 2020, 12, 7680. [Google Scholar] [CrossRef]
- Frey, D.F.; MacNaughton, G. A Human Rights Lens on Full Employment and Decent Work in the 2030 Sustainable Development Agenda. SAGE Open 2016, 6, 2158244016649580. [Google Scholar] [CrossRef] [Green Version]
- Rosa, W. (Ed.) Goal 8. Promote Sustained, Inclusive, and Sustainable Economic Growth, Full and Productive Employment, and Decent Work for All. In A New Era in Global Health: Nursing and the United Nations 2030 Agenda for Sustainable Development; Springer: Berlin/Heidelberg, Germany, 2017. [Google Scholar]
- Hilson, G. Promote sustained, inclusive and sustainable economic growth, full and productive employment and decent work for all. In Mining, Materials, and the Sustainable Development Goals (SDGs); CRC Press: Boca Raton, FL, USA, 2020; pp. 69–82. [Google Scholar]
- Rai, S.M.; Brown, B.D.; Ruwanpura, K.N. SDG 8: Decent work and economic growth—A gendered analysis. World Dev. 2018, 113, 368–380. [Google Scholar] [CrossRef]
- Wooldridge, J.M. Econometric Analysis of Cross Section and Panel Data; MIT Press: London, UK, 2010. [Google Scholar]
- Beck, T.; Demirguc-Kunt, A. Small and medium-size enterprises: Access to finance as a growth constraint. J. Bank. Financ. 2006, 30, 2931–2943. [Google Scholar] [CrossRef]
- Beck, T.; Demirgüç-Kunt, A.S.L.I.; Maksimovic, V. Financial and legal constraints to growth: Does firm size matter? J. Financ. 2005, 60, 137–177. [Google Scholar] [CrossRef]
- Cahuc, P.; Malherbet, F.; Prat, J. The Detrimental Effect of Job Protection on Employment: Evidence from France; IZA Discussion Papers. No 12384; Institute of Labor Economics: Bonn, Germany, 2019. [Google Scholar]
- Ayyagari, M.; Demirgüç-Kunt, A.; Maksimovic, V. How Important Are Financing Constraints? The Role of Finance in the Business Environment. World Bank Econ. Rev. 2008, 22, 483–516. [Google Scholar] [CrossRef]
- Distante, R.; Petrella, I.; Santoro, E. Gibrat’s law and quantile regressions: An application to firm growth. Econ. Lett. 2018, 164, 5–9. [Google Scholar] [CrossRef] [Green Version]
- Beck, T.; Demirguc-Kunt, A.S.L.I.; Laeven, L.; Levine, R. Finance, Firm Size, and Growth. J. Money Credit. Bank. 2008, 40, 1379–1405. [Google Scholar] [CrossRef] [Green Version]
- Aterido, R.; Hallward-Driemeier, M.; Pagés, C. Big Constraints to Small Firms’ Growth? Business Environment and Employment Growth across Firms. Econ. Dev. Cult. Chang. 2011, 59, 609–647. [Google Scholar] [CrossRef] [Green Version]
- Daway-Ducanes, S.L.S.; Gochoco-Bautista, M.S. Aspects of financial development and manufacturing and services growth: Which matter? Int. J. Financ. Adn Econ. 2021, 26, 2560–2580. [Google Scholar] [CrossRef]
- Fowowe, B. Access to finance and firm performance: Evidence from African countries. Rev. Dev. Financ. 2017, 7, 6–17. [Google Scholar] [CrossRef]
- Coluzzi, C.; Ferrando, A.; Martinez-Carrascal, C. Financing obstacles and growth: An analysis for euro area non-financial firms. Eur. J. Financ. 2012, 21, 773–790. [Google Scholar] [CrossRef]
- D’Souza, J.; Megginson, W.L.; Ullah, B.; Wei, Z. Growth and growth obstacles in transition economies: Privatized versus de novo private firms. J. Corp. Financ. 2017, 42, 422–438. [Google Scholar] [CrossRef]
- Tan, H.; Bashir, S.; Tanaka, N. Skill Use, Skill Deficits, and Firm Performance in Formal Sector Enterprises: Evidence from the Tanzania Enterprise Skills Survey, 2015; World Bank Policy Research Working Paper. No 7672; World Bank: Washington, DC, USA, 2016. [Google Scholar] [CrossRef] [Green Version]
- Amin, M.; Soh, Y.C. Does Corruption Hurt Employment Growth of Financially Constrained Firms More? World Bank Policy Research Working Paper. No 9286; World Bank: Washington, DC, USA, 2020. [Google Scholar] [CrossRef]
- Trinh, L.Q.; Doan, H.T.T. Internationalization and the growth of Vietnamese micro, small, and medium sized enterprises: Evidence from panel quantile regressions. J. Asian Econ. 2018, 55, 71–83. [Google Scholar] [CrossRef]
- Goedhuys, M.; Sleuwaegen, L. High-growth entrepreneurial firms in Africa: A quantile regression approach. Small Bus. Econ. 2009, 34, 31–51. [Google Scholar] [CrossRef] [Green Version]
- Reichstein, T.; Dahl, M.S.; Ebersberger, B.; Jensen, M.B. The devil dwells in the tails. J. Evol. Econ. 2010, 20, 219–231. [Google Scholar] [CrossRef] [Green Version]
- Caggese, A.; Cuñat, V. Financing Constraints and Fixed-term Employment Contracts. Econ. J. 2008, 118, 2013–2046. [Google Scholar] [CrossRef]
- Kahn, L.M. Employment protection reforms, employment and the incidence of temporary jobs in Europe: 1996–2001. Labour Econ. 2010, 17, 1–15. [Google Scholar] [CrossRef] [Green Version]
- Garmaise, M.J. Production in Entrepreneurial Firms: The Effects of Financial Constraints on Labor and Capital. Rev. Financ. Stud. 2007, 21, 543–577. [Google Scholar] [CrossRef]
- Fernandes, A.; Ferreira, P. Financing constraints and fixed-term employment: Evidence from the 2008–2009 financial crisis. Eur. Econ. Rev. 2017, 92, 215–238. [Google Scholar] [CrossRef] [Green Version]
- Tanaka, M.; Bloom, N.; David, J.M.; Koga, M. Firm performance and macro forecast accuracy. J. Monetary Econ. 2019, 114, 26–41. [Google Scholar] [CrossRef]
- Ruiz, J.L. Financial development, institutional investors, and economic growth. Int. Rev. Econ. Financ. 2018, 54, 218–224. [Google Scholar] [CrossRef]
- Dinh, H.T.; Mavridis, D.A. The Binding Constraint on the Growth of Firms in Developing Countries. In Performance of Manufacturing Firms in Africa; World Bank Group: Washington, DC, USA, 2012; pp. 87–137. [Google Scholar]
- Booth, A.L.; Francesconi, M.; Frank, J. Temporary Jobs: Stepping Stones or Dead Ends? Econ. J. 2002, 112, F189–F213. [Google Scholar] [CrossRef] [Green Version]
- Aparicio-Fenoll, A. The effect of product market competition on job security. Labour Econ. 2015, 35, 145–159. [Google Scholar] [CrossRef]
- Begenau, J.; Farboodi, M.; Veldkamp, L. Big data in finance and the growth of large firms. J. Monet. Econ. 2018, 97, 71–87. [Google Scholar] [CrossRef] [Green Version]
- Hennessy, C.A.; Whited, T.M. How Costly Is External Financing? Evidence from a Structural Estimation. J. Financ. 2007, 62, 1705–1745. [Google Scholar] [CrossRef] [Green Version]
- Li, J.; Dutta, D.K. Founding team experience, industry context, and new venture creation. N. Engl. J. Entrep. 2018, 21, 2–21. [Google Scholar] [CrossRef]
- Zheng, Y.; Devaughn, M.L.; Zellmer-Bruhn, M. Shared and shared alike? Founders’ prior shared experience and performance of newly founded banks. Strat. Manag. J. 2015, 37, 2503–2520. [Google Scholar] [CrossRef] [Green Version]
- Minnis, M. The Value of Financial Statement Verification in Debt Financing: Evidence from Private U.S. Firms. J. Account. Res. 2011, 49, 457–506. [Google Scholar] [CrossRef]
- Kim, J.B.; Simunic, D.A.; Stein, M.T.; Yi, C.H. Voluntary Audits and the Cost of Debt Capital for Privately Held Firms: Korean Evidence. Contemp. Account. Res. 2011, 28, 585–615. [Google Scholar] [CrossRef]
- Shibia, A.G.; Barako, D.G. Determinants of micro and small enterprises growth in Kenya. J. Small Bus. Enterp. Dev. 2017, 24, 105–118. [Google Scholar] [CrossRef]
- Grazzi, M.; Moschella, D. Small, young, and exporters: New evidence on the determinants of firm growth. J. Evol. Econ. 2017, 28, 125–152. [Google Scholar] [CrossRef]
- Di Cintio, M.; Ghosh, S.; Grassi, E. Firm growth, R&D expenditures and exports: An empirical analysis of Italian SMEs. Res. Policy 2017, 46, 836–852. [Google Scholar] [CrossRef]
- Koenker, R. Quantile Regression. Econometric Society Monographs; Cambridge University Press: Cambridge, UK, 2005. [Google Scholar]
- Hao, L.; Naiman, D.Q. Quantile Regression; Sage: Thousand Oaks, CA, USA, 2007. [Google Scholar]
- Léon, F. The provision of long-term credit and firm growth in developing countries. Econ. Model. 2020, 90, 66–78. [Google Scholar] [CrossRef]
| Publisher’s Note: MDPI stays neutral with regard to jurisdictional claims in published maps and institutional affiliations. |
© 2021 by the authors. Licensee MDPI, Basel, Switzerland. This article is an open access article distributed under the terms and conditions of the Creative Commons Attribution (CC BY) license (https://creativecommons.org/licenses/by/4.0/).


