Article

Spatial and Temporal Variations of Nitrogen and Phosphorus in Surface Water and Groundwater of Mudong River Watershed in Huixian Karst Wetland, Southwest China

1
College of Environmental Science and Engineering, Guilin University of Technology, Guilin 541004, China
2
Guangxi Key Laboratory of Environmental Pollution Control Theory and Technology, Guilin University of Technology, Guilin 541004, China
3
Collaborative Innovation Center for Water Pollution Control and Water Security in Karst Region, Guilin University of Technology, Guilin 541004, China
*
Authors to whom correspondence should be addressed.
Sustainability 2021, 13(19), 10740; https://doi.org/10.3390/su131910740
Submission received: 22 July 2021 / Revised: 1 September 2021 / Accepted: 22 September 2021 / Published: 27 September 2021
(This article belongs to the Special Issue Pollutant Removal Process in Water Environment)

Abstract

:
When considering the factors affecting the spatial and temporal variation of nitrogen and phosphorus in karst watersheds, the unique karst hydrogeology as an internal influencing factor cannot be ignored, as well as natural factors such as meteorological hydrology and external factors such as human activities. A watershed-scale field investigation was completed to statistically analyze spatial and temporal dynamics of nitrogen and phosphorus through the regular monitoring and collection of surface water and shallow groundwater in the agricultural-dominated Mudong River watershed in the Huixian Karst Wetland over one year (May 2020 to April 2021). Our research found that non-point source pollution of nitrogen (84.5% of 239 samples TN > 1.0 mg/L) was more serious than phosphorus (7.5% of 239 samples TP > 0.2 mg/L) in the study area, and shallow groundwater nitrogen pollution (98.3% of 118 samples TN > 1.0 mg/L) was more serious than surface water (68.6% of 121 samples TN > 1.0 mg/L). In the three regions with different hydrodynamic features, the TN concentration was higher and dominated by NO3-N in the river in the northern recharge area, while the concentrations of TN and TP were the highest in shallow groundwater wells in the central wetland core area and increased along the surface water flow direction in the western discharge area. This research will help improve the knowledge about the influence of karst hydrodynamic features on the spatial patterns of nitrogen and phosphorus in water, paying attention to the quality protection and security of water in karst areas with a fragile water ecological environment.

1. Introduction

Nitrogen and phosphorus from non-point source pollution caused by agricultural activities have led to the degradation of water quality and the destruction of water ecosystem in watersheds, a worldwide environmental concern [1,2,3]. Especially in karst areas, where the ecological environment is uniquely complex and fragile, nitrogen and phosphorus pollution in surface water and groundwater has become an increasingly important issue in the past decades because of its impact on human health, aquatic ecosystems, socio-economic development, and agricultural activities [4,5,6,7]. It is estimated that about a quarter of the Earth’s population lives in 10–15% terrestrial areas covered by carbonate karst [8]. However, water is at high risk of nitrogen and phosphorus pollution, whether in bare carbonate areas with a thin or scarce protective soil layer or in covered carbonate areas with high intensity of human agriculture and living activities.
The existence of karst features, such as swallow holes, sinkholes, karst fissures, and conduits, provide rapid access flow pathways for nitrogen and phosphorus into the carbonate aquifer directly. The scattered and discontinuous protective soil overlaying the exposed carbonate rock is so thin and rare that nitrogen and phosphorus contaminants can enter the karst fissures or pipe network through few or no natural filtration, with little or no abatement or chemical decomposition in the process [9]. The barren soil and limited land resources in the covered carbonate area lead to intensive human agricultural activities, as well as overuse of nitrogen and phosphorus fertilizers. Unfortunately, all this results in the rapid spread of nitrogen and phosphorus pollution in aquifers. In karst areas, where the hydraulic connection between surface water and shallow groundwater is complicated and variable, nitrogen and phosphorus pollution concerns both surface and groundwater. Non-point source pollution of nitrogen and phosphorus in karst areas have been reported across the world, for example, in China [4,10,11], Mexico [12], United States [13,14], Ireland [6], Czech Republic [15], and Turkey [16]. These studies help draw attention to the nitrogen and phosphorus pollution of surface water and groundwater in karst areas and provide some scientific guidance for controlling it.
Wetlands are the kidneys of the earth, but the water quality of wetlands has deteriorated due to the enrichment of large amounts of nitrogen and phosphorus caused by anthropogenic non-point source pollution [17]. Frequent interactions between surface water and groundwater, as well as the biogeochemical behavior of nitrogen and phosphorus in wetlands, negatively affect groundwater quality. Considering global climate change, such as extreme meteorological events, increased precipitation, and the general deterioration of the water environment caused by human activities, wetlands are becoming highly vulnerable, especially in the uniquely complex and fragile karst areas. Therefore, there has been an increasing focus on the impact of surface water and groundwater nitrogen and phosphorus pollution on the wetland system, especially the karst wetland system. The Huixian Karst Wetland, located in the watershed area between Lijiang River and Liujiang River in Guilin, is the largest natural karst wetland at a low altitude in southwest China [18,19]. It has crucial environmental regulation functions and ecological benefits and is one of the karst wetlands with significant research value and urgent conservation needs. Deep research on the spatial and temporal variations of nitrogen and phosphorus in surface water and shallow groundwater affected by special hydrodynamic conditions in an agricultural watershed of Huixian karst wetlands is essential to protect the water ecology and security. However, previous research on nitrogen and phosphorus in water in this region rarely took a catchment-scale watershed as the study area. Few studies focused on both surface water and groundwater combined with hydrogeological characteristics, and few studies attempted to monitor throughout a whole hydrological year [18,19,20,21]. The agricultural-dominated Mudong River watershed is particularly vulnerable to high-intensity human activities and is considered a typical and representative catchment to understand the surface–underground water system in the Huixian Karst Wetland. Therefore, a watershed-scale, comprehensive, field-based monitoring of the spatial and temporal dynamics of nitrogen and phosphorus in surface water and shallow groundwater combined with karst hydrogeology over one year (May 2020 to April 2021) in the Mudong River watershed is an essential supplement to local related research.
In light of the background above, the main objectives of the present research were to (i) describe the variations of nitrogen and phosphorus nutrient concentrations and hydrology in surface water and shallow groundwater in the watershed over time and space during 12 months, (ii) interpret the interrelationship between seasonal variation in nitrogen and phosphorus pollution of rivers and shallow groundwater and meteorological hydrology as well as human activities in karst areas, and (iii) identify the role of the hydrodynamic characteristics associated with karst hydrogeology in controlling the spatial variations of nitrogen and phosphorus in water to provide a scientific basis for the protection of water and ecological in karst wetlands.

2. Materials and Methods

2.1. Study Area

The Mudong River watershed (E 110°09′34″–110°14′19″, N 25°03′43″–25°08′55″, elevation 125–485 m, 30.2 km2) is located in the Huixian Karst Wetland, southwest of Guilin City, Guangxi Province, China (Figure 1). The watershed has a typical subtropical humid monsoon climate, with a mean annual precipitation of 1569.7 mm (about 70–80% of the annual rainfall occurs from April to August) and a mean annual temperature of 20 °C [22]. The landform is characterized by a karst peak forest in the high north with a flat plain (wetland) in the low center and drainage areas in the west. There are four soil categories, i.e., limestone soil, red soil, bog soil, and paddy soil [23]. Limestone soil overlays the exposed carbonate rock area and is thin and discontinuous. Red soil is mainly placed around the wetland and on gentle hillslopes. Bog soil of the wetland is a clay layer formed by the residual weathering of limestone, about 1–2 m thick.
The West Main Canal of the Qingshitan Reservoir, about 40 km far from the north of Mudong River watershed, flows into the watershed from the north and recharges the study area during the irrigation season from April to September each year, while there is no flow during the rest of the year. The Mudong River flows from a spring in the north karst rocky mountains, flows southward through the core area of Huixian Karst Wetland in the center, and finally discharges westward into the lower reaches of the Xiangsi River. The core area of the Huixian Karst Wetland is mainly composed of the ancient Gui-Liu Canal, Mudong Lake, and Fenshui Tang, distributed with lakes, ponds, meadows, and marshes. The ancient Gui-Liu Canal connects to the East with the Fenshui Tang and the South with the Huixian River. Still, due to its age and disrepair, the canal is seriously silted up. Most sections are covered with Eichhornia crassipes, with almost no significant flow except heavy rain events.
There are 18 administrative villages, about 5000 agricultural residents, several fish farms, and livestock farms with hundreds to thousands of animals (mainly pigs, chickens, and ducks) in the study area. About 24.2% of the total area is exposed carbonate rock, and the remaining 75.8% is covered carbonate rock area dominated by human activities. Cultivated land and water bodies are the primary land-use types, accounting for approximately 66.3% and 22.4% of the covered carbonate rock area. Rice is generally cultivated twice a year, in mid-April and mid-July.

2.2. Sampling and Analytical Methods

Two karst springs, nine shallow groundwater wells, and eleven river sections along the Mudong River from the source to the outlet of the watershed were selected as sampling sites to monitor the N and P levels of water in the study area. Detailed information for sampling points is presented in Table 1.
Field sampling work started in May 2020 due to the COVID-19 outbreak. Monthly sampling and observation were carried out from May 2020 to April 2021 in a hydrological year for rivers, springs, and shallow groundwater wells in the watershed. A total of 121 surface water samples and 118 shallow groundwater samples were collected during the monitoring period. Water samples were collected directly from rivers, springs, and wells using collectors and stored in acid-washed 1000 mL polyethylene bottles. Parameters recorded at each site include water temperature, pH, and DO (dissolved oxygen). The water table was measured by a Hand-held Electric Wave Flow Meter (Stalker II SVR, Applied Concept Inc., Brannon, TX, USA) and measuring tape. Once collected, the water samples were transported to the laboratory on the same day, preserved in a fridge at 4 °C, and then processed and analyzed within 48 h of collection.
All water samples were analyzed for total nitrogen (TN), nitrate-nitrogen (NO3-N), ammonium–nitrogen (NH4+-N), total phosphorus (TP), and total soluble phosphate (TDP) following the National Standard Methods [24]. TN concentrations were measured by alkaline potassium persulfate digestion ultraviolet spectrophotometric method (HJ636-2012) [25], NO3-N concentrations were measured by ultraviolet spectrophotometric method (HJ/T 346-2007) [26], and NH4+-N concentrations were measured by Nessler’s reagent spectrophotometric method (HJ535-2009) [27]. Total phosphorus (TP) and total dissolved phosphate (TDP) were determined by potassium persulfate digestion ammonium molybdate spectrophotometric method (GB11893-89) [28].

2.3. Data Analysis

Descriptive statistics were performed to examine the statistical significance of the element concentrations. One-way analysis of variance (ANOVA) at 95% confidence level (p < 0.05) was used to evaluate significant differences in element concentrations between the wet season and dry season. Pearson coefficients were calculated to quantitatively investigate the correlations among element concentrations, where the significance level was set at p < 0.05 (two-tailed). Statistical analyses were performed by Excel 2015 (Microsoft Corporation, Redmond, WA, USA) and IBM SPSS Statistics 25 (IBM Inc., Armonk, NY, USA). Mapping was performed by Origin 9.1 and ArcGIS 12.0 (ESRI—Environmental Systems Research Institute, Redlands, CA, USA).

3. Results

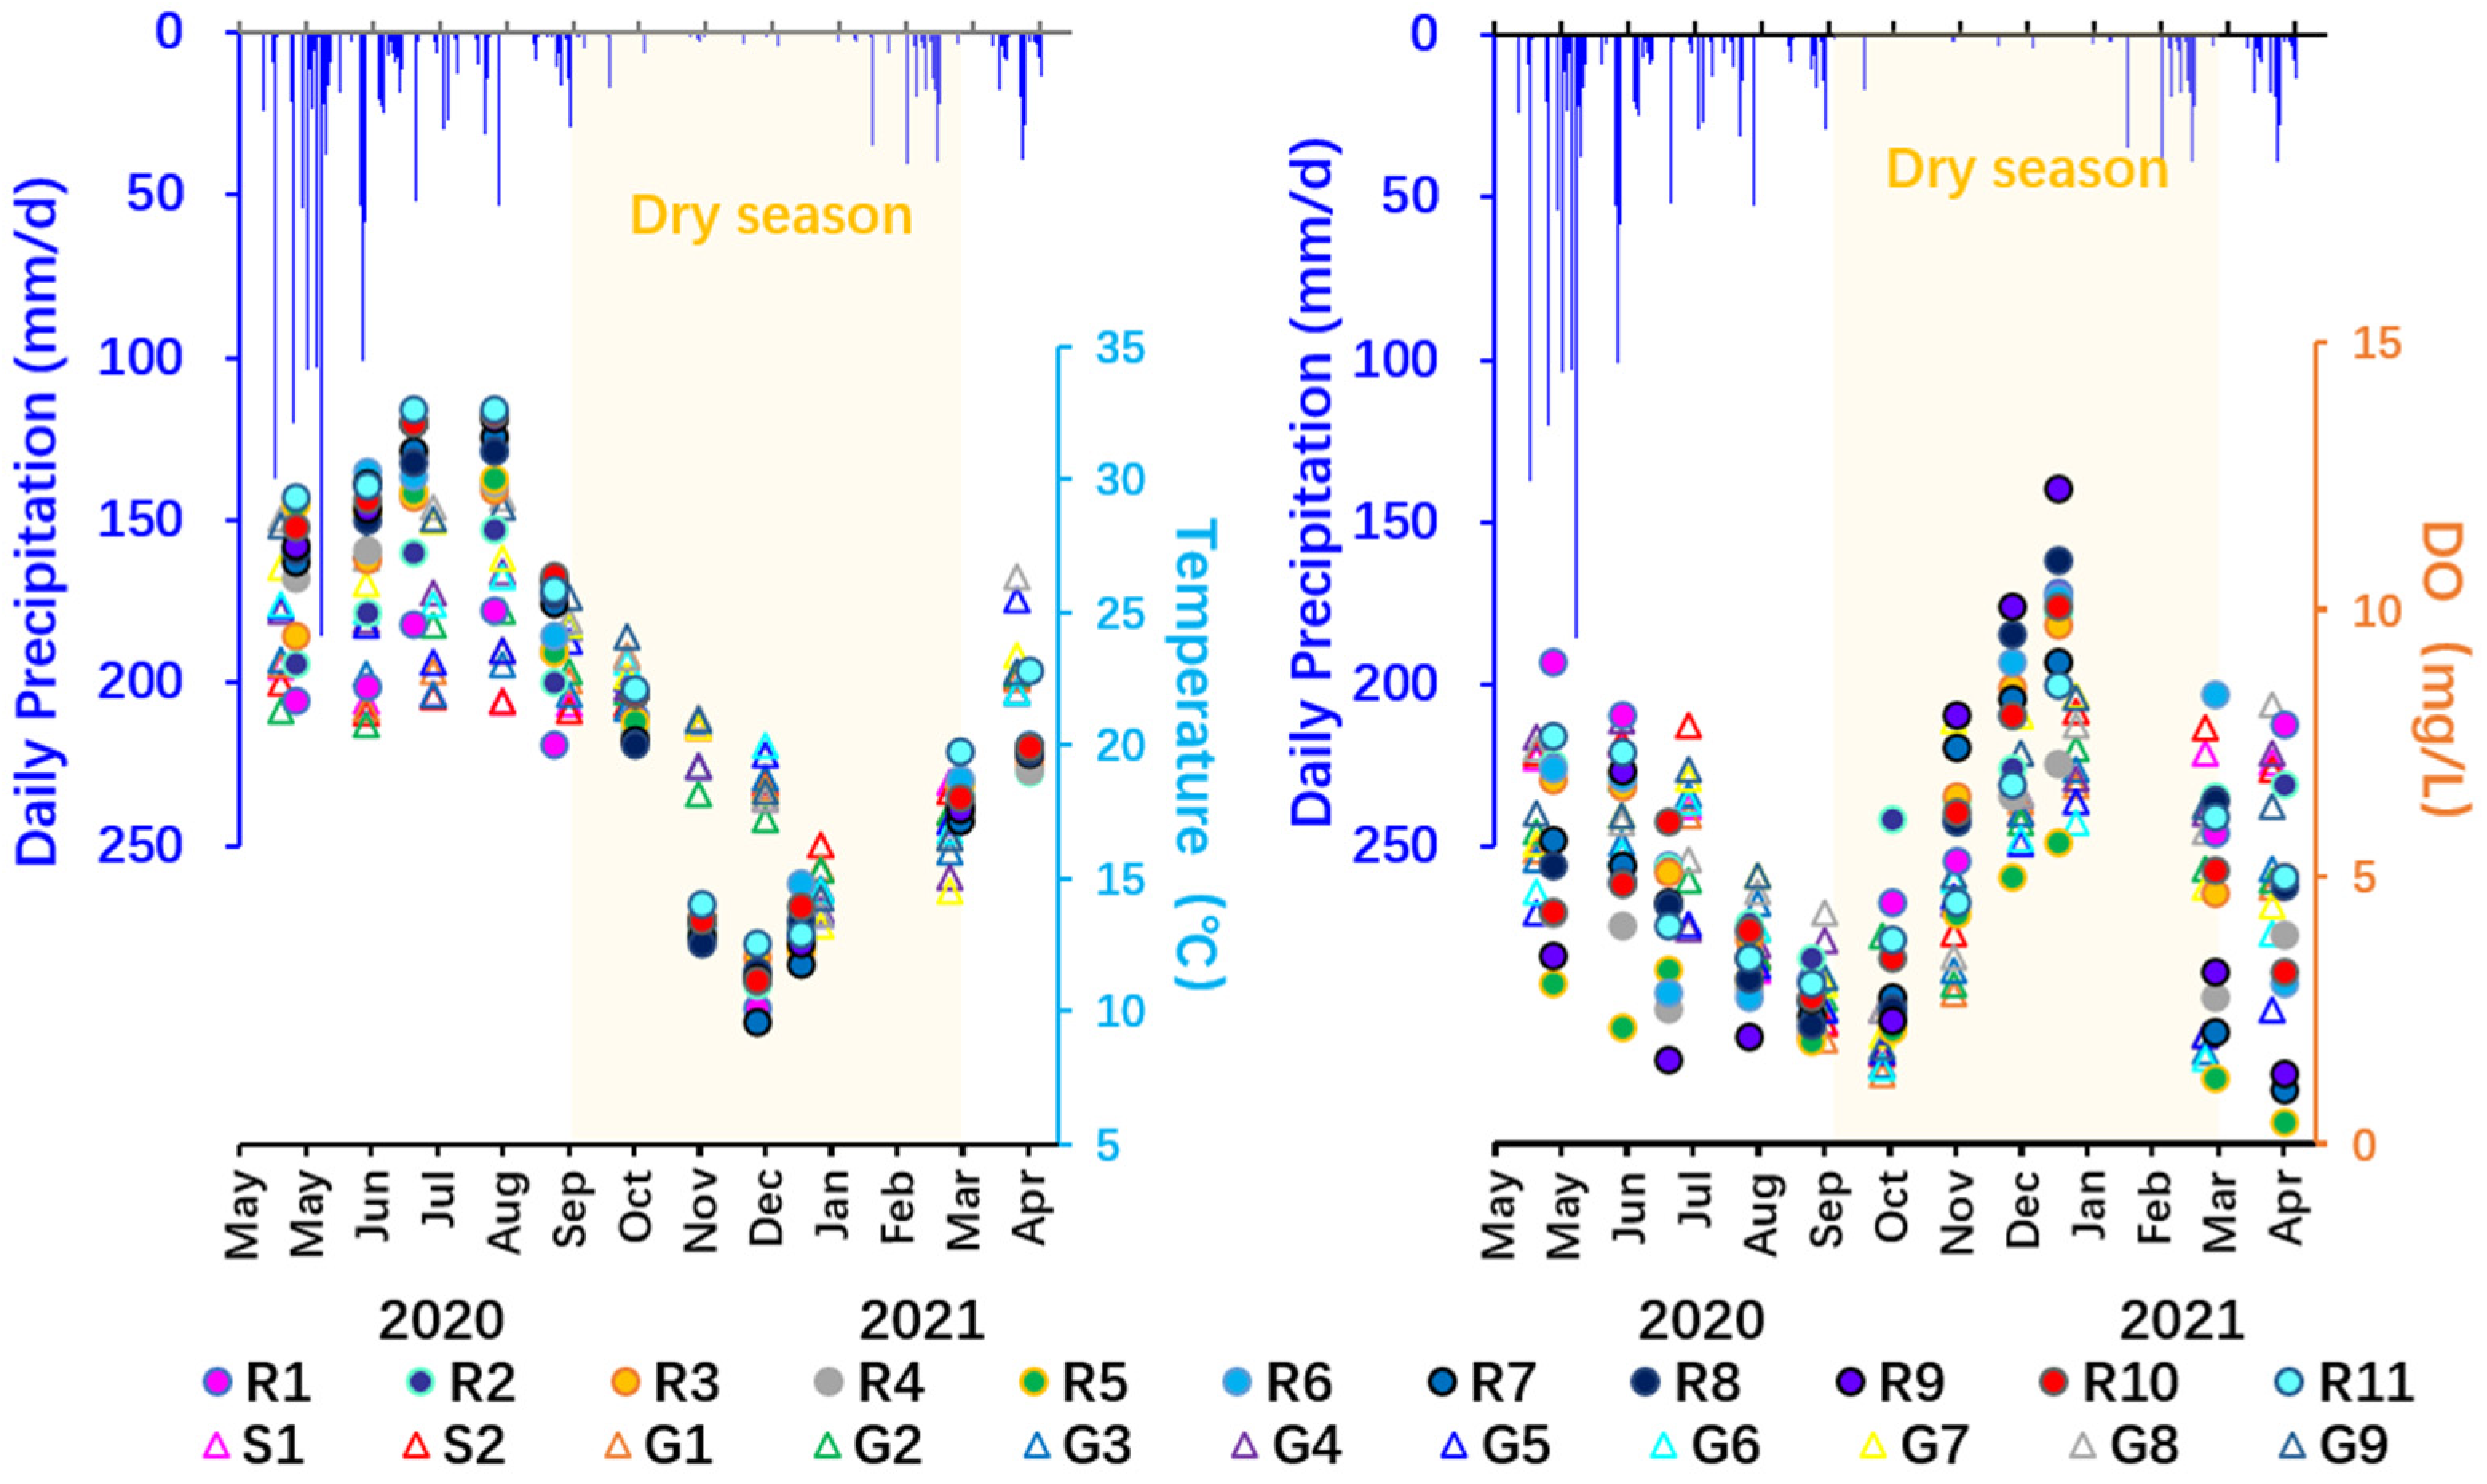
3.1. Spatio-Temporal Distribution of Hydrodynamic

The precipitation from May 2020 to April 2021 was 2158 mm, about 1.14 times the mean annual precipitation. May–September 2020 and April 2021 were defined as the wet season, with monthly precipitation ranging from 148 mm to 665 mm, accounting for 6.86% to 30.82% of the annual precipitation, respectively. October 2020 to March 2021 was defined as the dry season, with monthly precipitation ranging from 6.5 mm to 115 mm, accounting for 0.23% to 5.33% of the annual precipitation, respectively. DO (dissolved oxygen) in surface water and shallow groundwater decreased with a high temperature in the wet season, and increased with a low temperature in the dry season during the monitoring periods (Figure 2). The seasonal variation of water temperature is more visible in surface water than in shallow groundwater. The pH of surface water samples was neutral to alkaline, varying between values of 6.9 and 8.5, while shallow groundwater samples varied from 6.4 to 8.7, without significant seasonal characteristics (Table 2).
Overall, there were distinct seasonal characteristics in the hydrological conditions of surface water and shallow groundwater caused by the uneven seasonal distribution of annual precipitation (Table 1). A significant seasonal difference was presented in the flow of spring sampling points S1 and S2 in the northern recharge area with a maximum of 0.05 L/s in the wet season and a minimum of 0.001 L/s (S2) in the dry season, and the spring water even stopped flowing (S1) from October 2020 to February 2021. In the dry season, the river flow conditions represented the slower mean flow velocity at the lower water table, with minimum flow velocity and water table in December 2020 and January 2021, even presenting discontinuous flow in some reaches. Similarly, the mean water tables monitored in groundwater wells in the dry season, ranging from 147.82 m to 153.39 m, are lower than those in the wet season, ranging from 148.50 m to 154.03 m.
A contour map of the water table based on monitored data at sampling sites shows the significant spatial variation of surface water and shallow groundwater tables (Figure 3). The main drainage directions of the hydrological systems flow from the north and south to the central lowland, and then southward to the outlet of the watershed. Influenced by topography, precipitation, karst development, and the thickness of the quaternary, similar variation characteristics to surface water appeared in the shallow groundwater table, with high water tables in the northern recharge area to low water levels in the western discharge area, and sparse water table contours in the central wetland core area dominated by the dispersed discharge.
In the context of the regional hydrogeological environment, the monitoring sites of surface water and groundwater were divided into three areas with different hydrodynamic conditions: the northern recharge area, the central wetland core area, and the western discharge area, based on the variation of the water table, the characteristics of the flow field, and the interaction between groundwater and surface water (Figure 3).
The temperature of samples from spring (S1 and S2), groundwater (G1, G2, and G3), and surface water (R1 and R2) in the northern recharge area were lower than in other areas, ranging from 18.8 °C to 21.6 °C. The mean water table varied widely from 152.69 m to 189.32 m, indicating the weak interaction among the sampling sites.
The temperature of samples from surface water (R3 to R6) and groundwater (G4 to G7) in the central wetland core area ranged from 20.7 °C to 23.2 °C. The mean surface water table varied between 148.69 m and 150.29 m, close to that of groundwater, ranging from 148.13 °C to 151.10 °C, suggesting a close relationship among the sampling sites in this area. Since the aquifer structure is a closed karst water-storing basin formed by a large-scale fold-fractured composite basin, shallow groundwater flows slowly and discharges dispersedly. (Table 1).
The sample temperatures of surface water (at sites R7 to R11) and groundwater (at sites G8 and G9) in the western discharge area were highest, ranging from 21.4 °C to 24.4 °C. The mean groundwater table of G8 and G9 were 150.45 m and 150.52 m, respectively. Due to the small difference in the water table of R7 and R8 (mean 149.74 m and 150.37 m, respectively) and the hydraulic gradient, the flow velocity of R7 and R8 in the ancient Gui-Liu Canal was so slow that water flowed significantly only during rainfall events in the wet season, with mean values of 0.006 and 0.015 m/s. In the main channel, the water table of R9, R10, and R11 (mean values of 150.37, 148.36, 146.35 m, respectively) and the hydraulic gradient were more variable, with a high westward flow velocity (mean values ranged from 0.231 to 0.450 m/s).

3.2. Seasonal Variation of TN and TP

According to the requirements of the Water Environmental Functional Zone Division in Guilin, the “Chinese Environmental Quality Standards for Surface Water” (GB3838-2002) [29] and “Chinese Environmental Quality Standards for Groundwater” (GB/T14848-2017) [30], TN and TP pollution occur when the concentrations exceed 1.0 mg/L and 0.2 mg/L, respectively. As shown in Table 2 and Figure 4, of the 239 surface water and groundwater samples, 84.5% were categorized as having TN pollution and only 7.5% as having TP pollution, indicating serious non-point source nitrogen pollution in the water. Moreover, 98.3% of shallow groundwater samples were classified as having TN pollution, indicating that human activities have caused the degradation of the shallow groundwater quality.
The TN and TP concentrations of surface water samples showed seasonal variations during the wet and dry seasons (Table 2 and Figure 4). The TN and TP concentration ranges of 55 samples in the dry season (0.33–9.50 mg/L and 0.01–0.41 mg/L, respectively) were higher than those of 66 samples in the wet season (0.31–4.10 mg/L and 0.01–0.23 mg/L, respectively), as well as the mean value, variance, CV (Coefficient Variation), and over-limit ratio. As shown in Table 1, for each monitoring section, the mean TN and TP concentrations in the dry season were higher than those in the wet season, except for the northern upstream section R1 (the average TN concentration of 1.09 mg/L in the dry season was lower than that of 2.58 mg/L in the wet season), and the sections R3, R6, and R7 (the average TP concentrations in the dry season were lower than those in the wet season). One-way analysis of variance (ANOVA) on the TN and TP concentrations in the dry and wet seasons showed significant seasonal variation at the 5% level for points R2 and R11, suggesting significant differences in the sources or input pathways of nitrogen and phosphorus between the two seasons. Seasonal variations in TP concentrations at sampling sites R3, R6, and R7 were not significant (Table 1).
Unlike surface water, the concentration ranges of TN and TP of shallow groundwater samples in the wet season (0.61–25.02 mg/L and 0.01–0.26 mg/L, respectively) were higher than those in the dry season (0.86–23.00 mg/L and 0.002–0.16 mg/L, respectively) (Table 2). For each monitoring site, the average TN and TP concentrations in the wet season were higher than those in the dry season, except for TN concentration in wells G3–G6 and TP concentration in well G6, indicating the more serious nitrogen and phosphorus pollution of shallow groundwater in the wet season. One-way analysis of variance (ANOVA) on the concentration in two seasons showed significant seasonal variation at 5% level of the TN for wells G3 and G6, and significant seasonal variation of the TP at sites S2, G1, G4, G6, and G7 (Table 1).

3.3. Spatial Distribution of TN and TP

Large coefficients of variation indicated a significant spatial variability of nitrogen and phosphorus in the water of the Mudong River watershed (Table 2). At sites R1 and R2 in the northern recharge area, the mean TN concentration (1.90 and 3.11 mg/L, respectively) and the average contribution of NO3-N to TN (59.46% and 83.99%, respectively) were higher than the mean TN concentration at sites R3 to R6 in the central wetland core area (ranging from 1.28 to 2.54 mg/L) and the mean contribution of NO3-N to TN (varied from 25.31% to 49.44%). An increasing trend was shown at sites R7 to R11 in the western discharge area in the mean TN concentration (rose to 2.81 mg/L at point R11) and the average contribution of NO3-N to TN (varied from 24.90% to 58.83%) (Figure 5a,c).
The TP concentration, ranging from 0.01 to 0.14 mg/L with a mean of 0.039 mg/L at point R1 in the northern recharge area, increased gradually along the main channel to 0.09–0.41 mg/L, with an average of 0.218 mg/L at point R11 in the western discharge area. The mean contributions of TDP to TP at points R7 to R11 (varied from 56.20% to 69.87%) in the western discharge area were higher than those of the other two areas (41.90–57.43%) (Figure 5b,d).
It was confirmed that there was a significant correlation between TN and TP concentrations at site R9, with a Pearson correlation coefficient of 0.842, as well as 0.770 at site R2, suggesting the similar sources and input pathways of nitrogen and phosphorus in the water at sites R9 and R2. At the same time, the correlations at the rest of the surface water sampling sites were not significant, except for sites R3 and R5 (0.692 and 0.669, respectively) (Table 2).
For shallow groundwater, the mean TN concentrations (ranging from 10.63–19.52 mg/L) and TP concentrations (ranging from 0.31–0.179 mg/L) at points G4–G7 in the central wetland core area were higher than 2.81–3.61 mg/L (TN) and 0.018–0.033 mg/L (TP) at points S1, S2, and G1–G3 in the northern recharge area and 2.22–2.37 mg/L (TN) and 0.032–0.035 mg/L (TP) at points G8 and G9 in the western discharge area. Unlike surface water, NO3-N has always been predominant in groundwater TN, with its contribution varying from 48.55% to 98.10% (mean 83.04%). There were no significant correlations between TN and TP concentrations in shallow groundwater samples (Figure 5a,b,e,f).

4. Discussion

4.1. Analyses of the Seasonal Variation of TN and TP

Some studies have shown that monthly sampling is sufficient when seasonal fluctuations of nitrogen and phosphorus in water are much more significant than the response to storm events [31,32]. In this study, monthly sampling seemed to be a good approach that was both economically feasible and sufficiently reflected seasonal representations of the concentration range/mean/extreme and over-limit ratio in the watershed outside of storm-flow periods. Previous studies have also shown that seasonal variations in nitrogen and phosphorus concentrations in surface water may occur [33] as precipitation decreases significantly in dry seasons compared to rainy seasons [19,34]. Of course, long monitoring periods and high monitoring frequency of sample data are necessary for further study of nutrients in the watershed. In future research, automatic monitoring equipment is set to be installed at typical and conditional sampling sites [35]. Monitoring data will be collected for the hydrological model to simulate nutrient dynamics in the karst water system [36,37].
In addition to the influence of meteorological and hydrological natural factors, external factors such as human agricultural water and fertilizer management as well as sewage discharge also contribute to the seasonal variation of nitrogen and phosphorus in watershed water. The mean TN concentration in the fertilized wet season was 2.4 times higher than that in the dry season at the sampling site R1, located in the northern karst mountain, which was developed as a citrus orchard for more than ten years. The nitrogen source of point R1 may have a significant difference between the wet season and dry season estimated from the one-way analysis of variance (ANOVA) (Table 1). Excessive nitrogen from fertilization in the wet season migrated to river water with the flow on the surface and underground (Figure 6a). Because the orchard is located in the upper reaches and the aquifer infiltration recharge area, the nitrogen and phosphorus into the water cycle system with rainfall in the wet season will continuously affect the water quality downstream and throughout the watershed. Thus, changes to land-use in the northern karst mountain should be considered to reduce aquifer pollution and stop the downstream drainage system from receiving excess nitrate. Significant seasonal variations in TN and TP concentrations at sites G3 and R2 and R5 and G6 were also due to seasonal differences in pollution sources and input paths caused by changes in interaction patterns between well water and the adjacent river (Figure 6b,c).

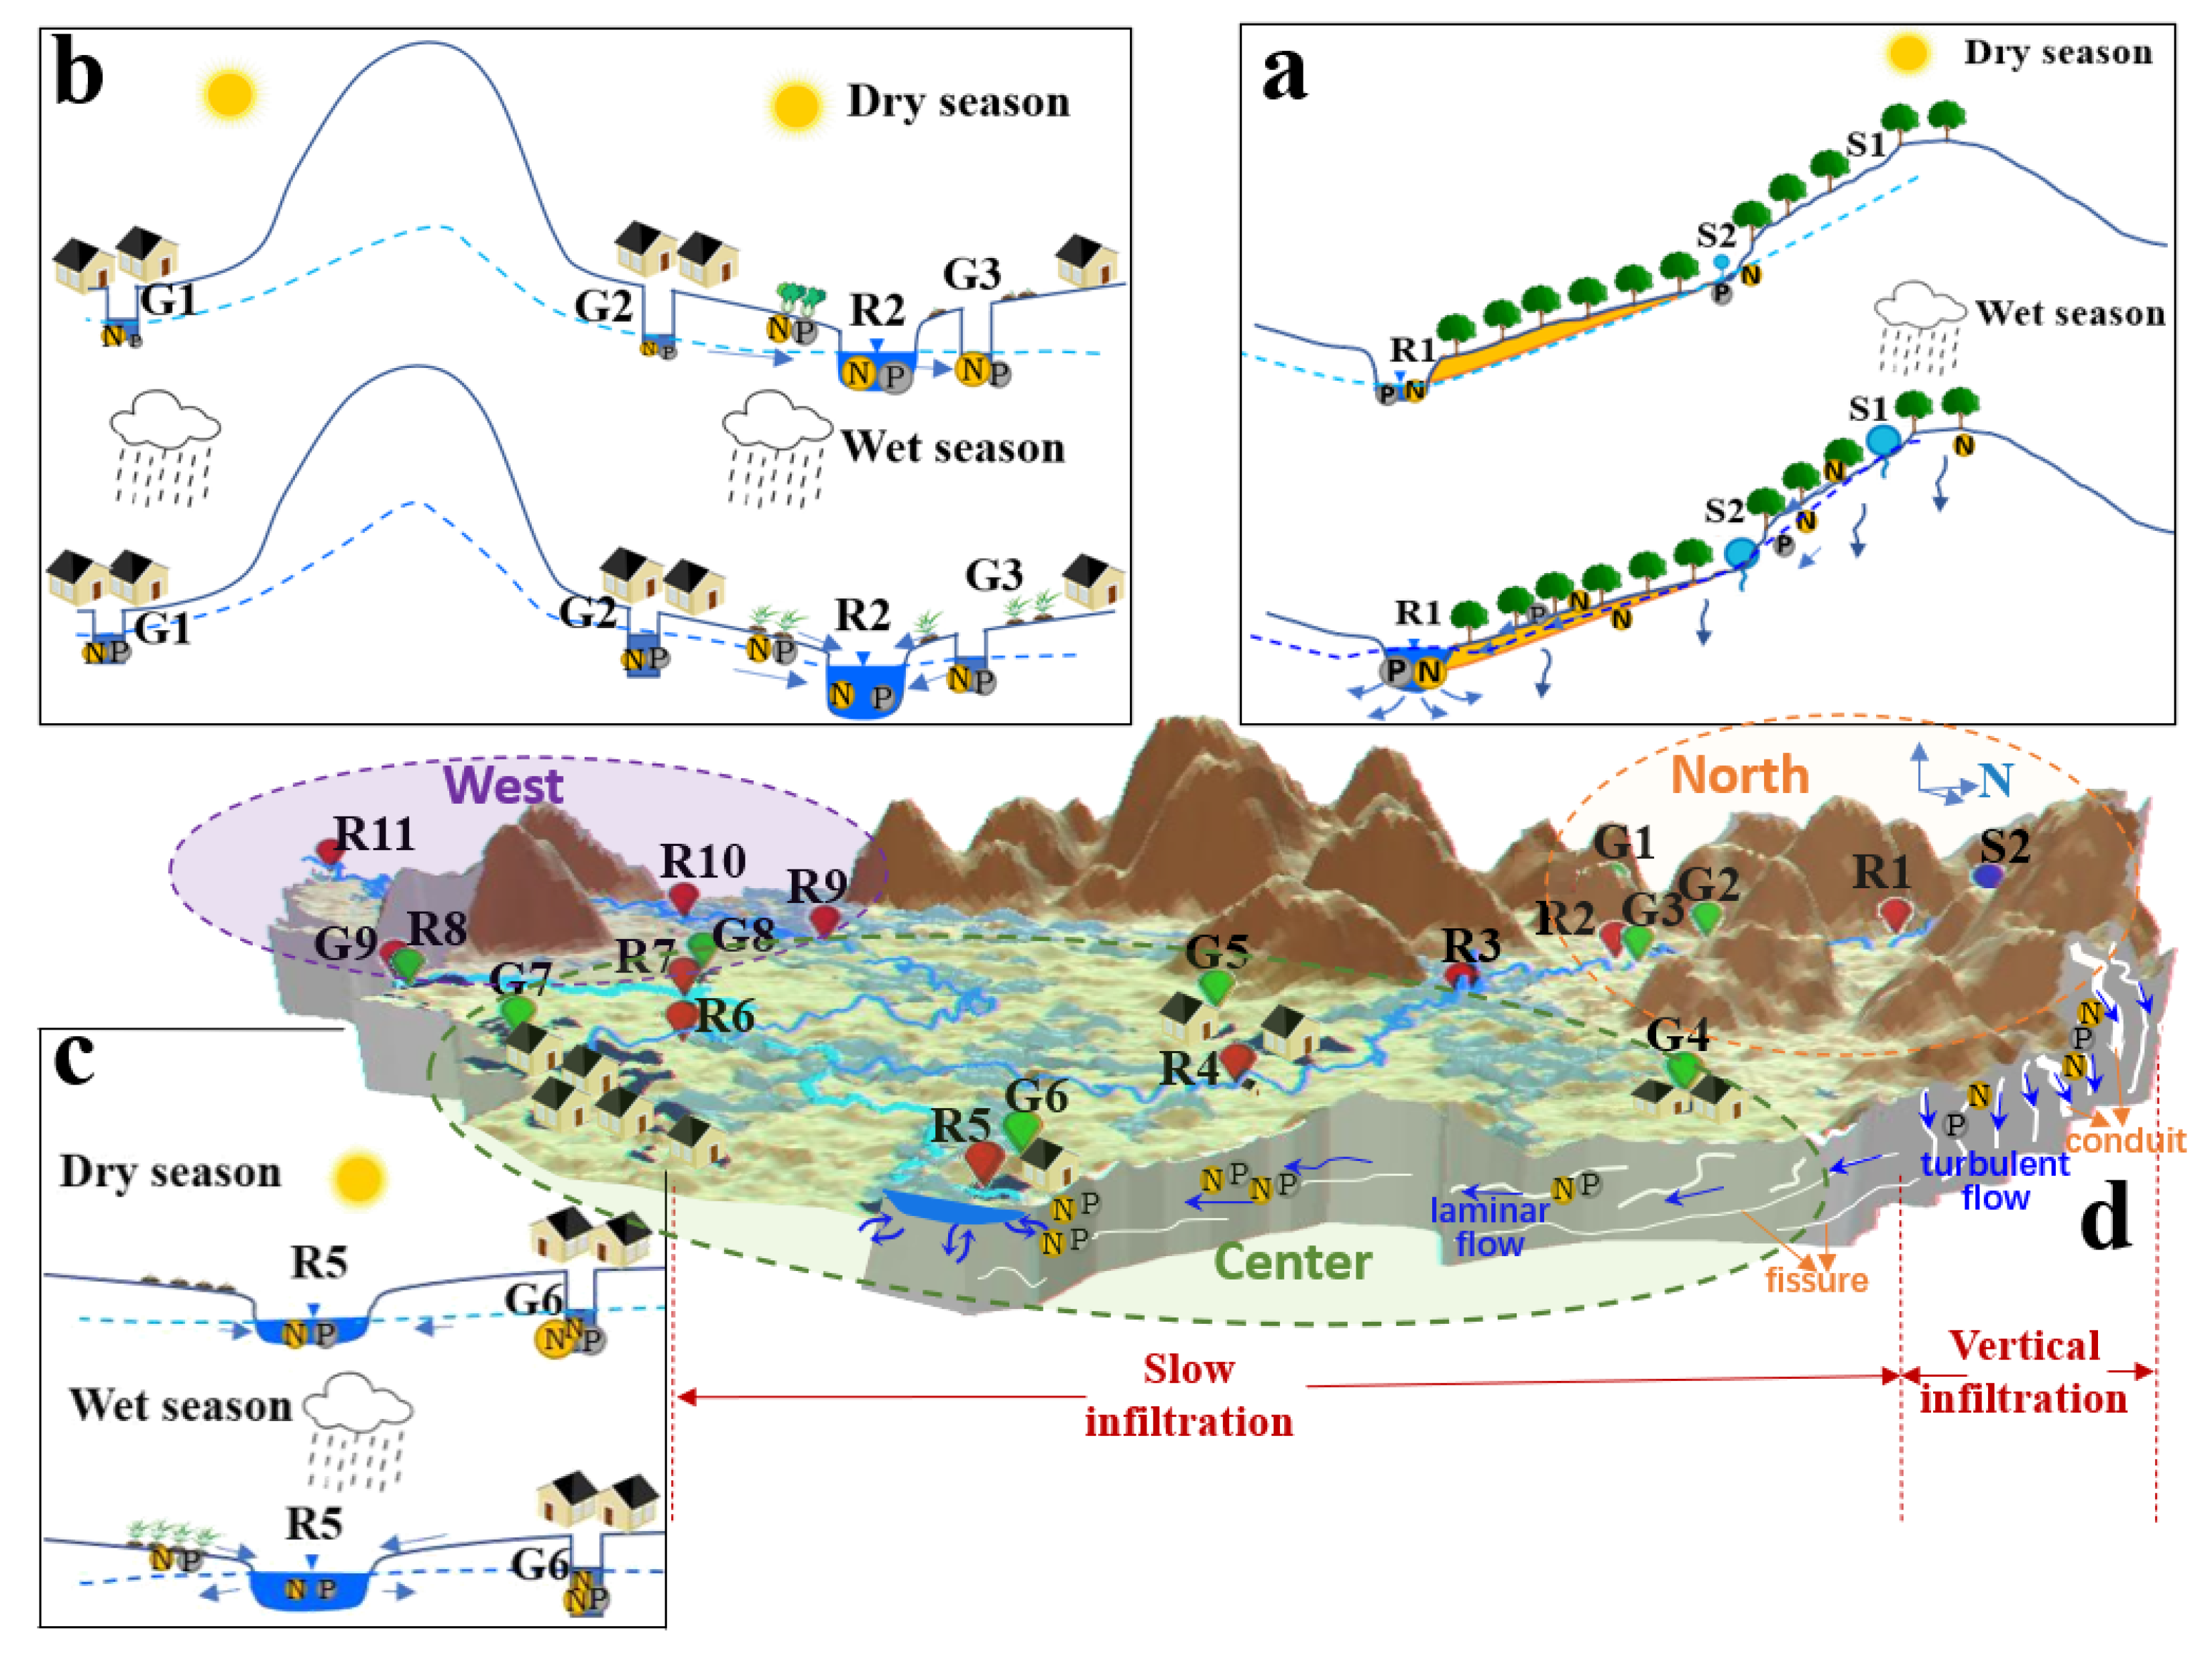
4.2. Analyses of the Spatial Distribution of TN and TP Affected by Karst Hydrodynamic

Karst hydrogeological conditions and associated topography have a strong influence on the hydrodynamic features, making the interaction between surface water and shallow groundwater spatially variable at the watershed scale and indirectly affecting the spatial distribution pattern of nitrogen and phosphorus concentrations in water. The hydrogeology and topography of the study area are characterized by a karst peak forest in the high north as the recharge area for carbonate karst water, with a flat plain in the low center wetland core area distributed with quaternary pore water. Hydrodynamic fields formed by karst aquifer medium composed of bedrock, fissures, and karst conduits are characterized by laminar and turbulent coexistence and alternate circulation of surface water and groundwater [38] (Figure 6d).
The hydrodynamic type of groundwater in the northern recharge area is characterized by fissure flow and conduit flow, so groundwater generally flows turbulently in fissures and conduits, mainly with vertical infiltration. The discontinuous, thin, and scattered surface protective soils developed fissures, and karst conduits make surface nitrogen and phosphorus pollutants into karst aquifers with precipitation quickly, almost without natural filtration. Therefore, the TN concentration of surface water in the wet season in the north was close to that of shallow groundwater, with similar characteristics that were dominated by NO3-N (Figure 5).
The flat central wetland core area is a covered karst area with an overlying soil thickness of about 0.2–6.0 m. The groundwater hydrodynamic type is characterized by pulse and network flow, mainly for laminar flow movement and maintaining a strong hydraulic connection, with a unified underground water surface. The surface water table is more stable than the surrounding area, with less variability and a small hydraulic gradient, and the shallow groundwater table is buried close to the surface and has a strong hydraulic connection with surface water. However, the karst groundwater infiltrates slowly along with the small solution gaps and pores in the aquifer matrix, resulting in a decrease in drainage capacity, an increase in water storage capacity [39], and a decrease in water mobility. Nitrogen and phosphorus pollutants in sewage from residential areas with high intensity of human activities are not easily diluted and are diffused to the surrounding area once they enter shallow groundwater with water movement, resulting in generally high nitrogen concentrations in the water of G4–G7 monitoring wells (Table 1 and Figure 5).
The main stream in the western discharge area is the concentrated drainage zone of surface water and shallow groundwater, with large hydraulic gradient and fast flow velocity (Table 1). With the increase in the catchment area, the load of nitrogen and phosphorus into the river increases, as does the concentration (Figure 5). Although G8 and G9 are also affected by the sewage discharge from residential areas, they are easy to diffuse to the surrounding areas, so the concentration of TN and TP is lower than that of the monitoring wells in the central wetland core area (Figure 5).

4.3. Nitrogen and Phosphorus Pollution of Water in Karst Areas

Nitrogen was the primary nutrient of non-point source pollution in the agriculture-dominated Mudong River watershed, and NO3-N concentrations are highest in shallow groundwater wells in the central wetland core area with a high intensity of human activities. These results are consistent with the similar conclusions of local studies by Peng [18] and Chen [19]. NO3-N pollution is one of the most common and prominent problems of karst groundwater worldwide. Previous studies on NO3-N in water in France (karstic Cretaceous chalk aquifer in Paris) [40], the United States (Edwards karst aquifer, central Texas) [41,42], South Korea [43], Bangladesh [44], China (Houzhai watershed and Guiyang watershed, Guizhou Province) [4,45,46], and other regions also found high nitrate (NO3-N) concentrations in karst areas, especially in agricultural areas. Nitrogen is often found to be transported to groundwater in the form of dissolved nitrate (NO3-N) due to its high solubility and mobility characteristics, while phosphorus is easily retained in soil due to its affinity to particulate matter. Compared to phosphorus, nitrogen is more likely to migrate into groundwater and enrich in the form of nitrate (NO3-N) in karst areas, due to the thin and discontinuous soil layer, the complexity of karst aquifers, the existence of karst fissures and pipes, and the frequent exchange of surface water and groundwater.
Although the TN concentration of water samples was high and dominated by NO3-N in the Mudong River watershed during the monitoring period, NO3-N concentration in surface water was below the “Chinese Environmental Quality Standards for Surface Water” (GB3838-2002) [29] and the “Chinese Standards for Drinking Water Quality” (GB5749-2006) [47] threshold of 10 mg/L, and only a few numbers of groundwater samples exceeded the “Chinese Environmental Quality Standards for Groundwater” (GB/T14848-2017) [30] threshold of 20 mg/L for NO3-N concentration (Table 2), e.g., the NO3-N concentration in G5 well water in November 2020 was 20.11 mg/L (with precipitation of 6.5 mm in November). According to the sampling in this region recorded by Peng [18] and Chen [19], the NO3-N concentration in G7 well water was higher than 70 mg/L in October 2017 (with annual precipitation of 2197 mm in 2017 and 17.5 mm in October). In G5 well water, it was as high as 111 mg/L in July 2018 (with annual precipitation of 1591.5 mm in 2018 and 206.5 mm in July) and reached 89.9 mg/L in February 2019. NO3-N concentration was 71.5 mg/L in site G7 well water monitored by us in December 2019 (with annual precipitation of 2336 mm in 2019, 155 mm in February, and 32 mm in December), indicating that there is real NO3-N contamination in the shallow groundwater in the central wetland core area. Particular attention should be paid to the high concentration of NO3-N in shallow groundwater given the human health damage caused by excessive nitrogen in the water, and it should be noted that some residents directly use groundwater as drinking water (without treatment). In addition, excess nitrogen and high NO3-N concentrations pose a serious threat to the fragile karst water ecosystem due to the limited dilution and self-purification capacity of groundwater in karst areas [48].
In this research, we focused on nitrogen and phosphorus pollution in rivers and shallow groundwater. The soil water and deep groundwater circulating in the hydrology of watersheds should be taken into account in future studies, although the monitoring and analysis work is extremely challenging. Fundamental research describes the basic spatial and temporal variation to understand better, conceptualize, and simulate the mechanisms of nitrogen and phosphorus migration in surface water and groundwater in karst areas. However, given the increased complexity of karst areas compared to non-karst areas, it is not easy to quantitatively describe the close association between elements by conventional compositional statistical analysis. At present, many techniques such as stable isotopes have been used to estimate the pollution of nitrogen and phosphorus in karst water [49]. Related studies have been carried out in the region and similar geological areas [18,19,44]. Based on field monitoring sampling, combined with various techniques such as isotope tracing and model simulation, quantitative analysis is the future research direction of nitrogen and phosphorus migration in karst wetland water ecosystems.

5. Conclusions

Spatial and temporal variations of nitrogen and phosphorus in rivers, springs, and wells in the Mudong River watershed of the Huixian Karst Wetland were revealed by identifying the influence of hydrodynamic features in the karst area on water nutrients. The following conclusions can be drawn based on the results of this research.
Due to natural factors of meteorological and hydrological conditions and external factors of human activities, the TN and TP concentrations of water samples showed seasonal variations during the wet and dry seasons. The ranges of TN and TP concentration from 55 surface water samples in the dry season were higher than those from 66 samples in the wet season, as well as the mean value, variance, CV, and over-limit ratio. The average TN and TP concentrations in the dry season were higher than those in the wet season, except for the TN concentration at point R1 and TP concentrations at points R3, R6, and R7. The ranges of TN and TP concentration from 66 shallow groundwater samples in the wet season were higher than those from 52 samples in the dry season. The mean TN and TP concentrations of sample sites in the wet season were higher than those in the dry season, except for TN concentrations at points G3–G6 and the TP concentration at point G6.
According to the spatial differences in hydrodynamic conditions, the Mudong River watershed was divided into three areas: the northern recharge area, the central wetland core area, and the western discharge area. Influenced by karst hydrodynamic features and human activities, the mean TN concentration of surface water samples in the northern recharge area was high and dominated by NO3-N, then decreased along the flow direction to a stable level in the central wetland core area and increased in the western discharge area. The mean TP concentration of surface water samples increased gradually from the northern recharge area to the western discharge area. The mean TN and TP concentrations of shallow groundwater samples in the central wetland core area were higher than that of the other two areas.
The data indicate severe N pollution in the waters of the Mudong River watershed during the monitoring period—with 84.5% of the 239 surface water samples and 98.3% of 118 shallow groundwater samples categorized as TN > 1.0 mg/L—and high NO3-N concentration of shallow groundwater in the central wetland core area. Due to intensive fertilization of fruit trees during the wet season, the TN concentration of surface water in the northern recharge area is high and dominated by NO3-N, having a negative impact on the water quality downstream, indicating the importance of scientific and reasonable land use to protect surface water and groundwater from eutrophication in karst-influenced watersheds dominated by agriculture with a fragile water ecological environment.

Author Contributions

Methodology, L.P. and J.D.; investigation, L.P., L.H., and Z.W. (Zupeng Wan); resources, Z.W. (Zhiqiang Wu) and J.D.; data curation, L.P., J.H., and Z.L.; writing—original draft preparation, L.P.; writing—review and editing, Z.W. (Zhiqiang Wu) and J.D.; supervision, Z.W. (Zhiqiang Wu); project administration, L.H.; funding acquisition, J.D. All authors have read and agreed to the published version of the manuscript.

Funding

This research was funded by the National Natural Science Foundation of China (grant no. 51979046), the National Key Research and Development Program of China (grant no. 2019YFC0507500), the Science and Technology Major Project of Guangxi, China (grant no. AA20161004), and the Natural Science Foundation of Guangxi Province, China (grant no. 2018GXNSFAA050022).

Institutional Review Board Statement

Not applicable.

Informed Consent Statement

Not applicable.

Data Availability Statement

Not applicable.

Conflicts of Interest

The authors declare no conflict of interest.

References

  1. Huang, J.C.; Zhang, Y.J.; Bing, H.J.; Peng, J.; Arhonditsis, G.B. Characterizing the river water quality in china: Recent progress and on-going challenges. Water Res. 2021, 201, 117309. [Google Scholar] [CrossRef] [PubMed]
  2. Chen, X.; Strokal, M.; Van Vliet, M.T.H.; Stuiver, J.; Wang, M.; Bai, Z.; Ma, L.; Kroeze, C. Multi-scale modeling of nutrient pollution in the rivers of China. Environ. Sci. Technol. 2019, 53, 9614–9625. [Google Scholar] [CrossRef] [PubMed] [Green Version]
  3. Jarvie, H.P.; Smith, D.R.; Norton, L.R.; Edwards, F.K.; Bowes, M.J.; King, S.M.; Scarlett, P.; Davies, S.; Dils, R.M.; Bachiller-Jareno, N. Phosphorus and nitrogen limitation and impairment of headwater streams relative to rivers in Great Britain: A national perspective on eutrophication. Sci. Total Environ. 2018, 621, 849–862. [Google Scholar] [CrossRef] [PubMed] [Green Version]
  4. Yue, F.J.; Waldron, S.; Li, S.L.; Wang, Z.J.; Zeng, J.; Xu, S.; Zhang, Z.C.; Oliver, D.M. Land use interacts with changes in catchment hydrology to generate chronic nitrate pollution in karst waters and strong seasonality in excess nitrate export. Sci. Total Environ. 2019, 696, 134062. [Google Scholar] [CrossRef]
  5. Amin, M.; Veith, T.L.; Collick, A.S.; Karsten, H.D.; Buda, A.R. Simulating hydrological and nonpoint source pollution processes in a karst watershed: A variable source area hydrology model evaluation. Agric. Water Manag. 2016, 180, 212–223. [Google Scholar] [CrossRef] [Green Version]
  6. McCormack, T.; Naughton, O.; Johnston, P.M.; Gill, L.W. Quantifying the influence of surface water-groundwater interaction on nutrient flux in a lowland karst catchment. Hydrol. Earth Syst. Sci. 2016, 20, 2119–2133. [Google Scholar] [CrossRef] [Green Version]
  7. Jones, R.R.; Weyer, P.J.; Dellavalle, C.T.; Inoue-Choi, M.; Anderson, K.E.; Cantor, K.P.; Krasner, S.; Robien, K.; Freeman, L.E.B.; Silverman, D.T.; et al. Nitrate from drinking water and diet and bladder cancer among postmenopausal women in Iowa. Environ. Health Perspect. 2016, 124, 1751–1758. [Google Scholar] [CrossRef] [PubMed]
  8. Ford, D.; Williams, P.D. Karst Hydrogeology and Geomorphology; John Wiley & Sons Ltd.: Chichester, UK, 2007. [Google Scholar]
  9. Coxon, C. Agriculture and Karst. In Karst Management; Van Beynen, P., Ed.; Springer: Dordrecht, The Netherlands, 2011; pp. 103–138. [Google Scholar]
  10. Gao, R.; Dai, Q.; Gan, Y.; Yan, Y.; Peng, X. The mechanisms of nutrient output through water flow from sloping farmland with slight rocky desertification in a karst region. Environ. Res. Lett. 2020, 15, 094085. [Google Scholar] [CrossRef]
  11. Wang, Z.J.; Li, S.L.; Yue, F.J.; Qin, C.Q.; Buckerfield, S.; Zeng, J. Rainfall driven nitrate transport in agricultural karst surface river system: Insight from high re-solution hydrochemistry and nitrate isotopes. Agric. Ecosyst. Environ. 2020, 291, 106787. [Google Scholar] [CrossRef]
  12. Lagomasino, D.; René, M.P.; Jorge, H.S.; Fernando, M.W.; Gonzalo, M.A.; Yadira, G.H. Connecting Groundwater and Surface Water Sources in Groundwater Dependent Coastal Wetlands and Estuaries: Sian Ka’an Biosphere Reserve, Quintana Roo, Mexico. Estuar Coast. 2015, 38, 1–20. [Google Scholar] [CrossRef]
  13. Maas, B.J.; Oberhelman, A.; Watson, A.; Honings, J.; Peterson, E.W. Differentiation of surface water and groundwater in a karst system using anthropogenic signatures. Geosciences 2019, 9, 148. [Google Scholar] [CrossRef] [Green Version]
  14. Liao, X.; Nair, V.D.; Canion, A.; Dobberfuhl, D.R.; Foster, D.K.; Inglett, P.W. Subsurface transport and potential risk of phosphorus to groundwater across different land uses in a karst springs basin, Florida, USA. Geoderma 2018, 338, 97–106. [Google Scholar] [CrossRef]
  15. Malá, J.; Hübelová, D.; Schrimpelová, K.; Kozumplíková, A.; Lejska, S. Surface watercourses as sources of karst water pollution. Int. J. Environ. Sci. Technol. 2021, 1–10. [Google Scholar] [CrossRef]
  16. Davraz, A.; Karaguzel, R.; Soyaslan, I.; Sener, E.; Seyman, F.; Sener, S. Hydrogeology of karst aquifer systems in SW Turkey and an assessment of water quality and contamination problems. Environ. Geol. 2009, 58, 973–988. [Google Scholar] [CrossRef]
  17. Ma, J.; Liu, Y.; Yu, G.B.; Li, H.B.; Yu, S.; Jiang, Y.P.; Li, G.L.; Lin, J.C. Temporal Dynamics of Urbanization- Driven Environmental Changes Explored by Metal Contamination in Surface Sediments in a Restoring Urban Wetland Park. J. Hazard. Mater. 2016, 309, 228–235. [Google Scholar] [CrossRef]
  18. Peng, C.; Pan, X.D.; Jiao, Y.J.; Ren, K.; Zeng, J. Identification of nitrate pollution sources through various isotopic methods: A case study of the Huixian Wetland. Environ. Sci. 2018, 39, 5410–5417. (In Chinese) [Google Scholar]
  19. Chen, J.; Luo, M.; Ma, R.; Zhou, H.; Zuo, S.Z.; Gan, Y.Q. Nitrate distribution under the influence of seasonal hydrodynamic changes and human activities in Huixian karst wetland, South China. J Contam. Hydrol. 2020, 234, 103700. [Google Scholar] [CrossRef] [PubMed]
  20. Li, L.X.; Li, J.C.; Wei, C.M.; Zhou, J.; Zhang, Q.; Liu, H.L. Analysis and evaluation of water quality status in Huixian wetland of Guangxi. J. Guilin Univ. Technol. 2019, 39, 693–699. (In Chinese) [Google Scholar]
  21. Xing, M.L.; Li, H.X.; Jiang, L.; Tu, Y.; Zeng, H.F.; Wang, D.Q. Spatio-temporal characteristics of water pollutants in surrounding water system of Lingui and Huixian karst wetlands. J. Guilin Univ. Technol. 2019, 39, 168–176. (In Chinese) [Google Scholar]
  22. Xiao, H.; Shahab, A.; Li, J.; Xi, B.; Sun, X.; He, H.; Yu, G. Distribution, ecological risk assessment and source identification of heavy metals in surface sediments of Huixian karst wetland, China. Ecotoxicol. Environ. Saf. 2019, 185, 109700.1–109700.10. [Google Scholar] [CrossRef]
  23. Soil Survey Staff. Keys to Soil Taxonomy, 12th ed.; USDA-Natural Resources Conservation Service: Washington, DC, USA, 2014. [Google Scholar]
  24. National Environmental Protection Bureau (NEPB). Standard Methods for the Examination of Water and Wastewater (Version 4) (HJ/T 91-2002); China Environmental Science Press: Beijing, China, 2002; pp. 1–48. (In Chinese) [Google Scholar]
  25. National Environmental Protection Bureau (NEPB). Water Quality—Determination of Total Nitrogen–Alkaline Potassium Persulfate Digestion UV Spectrophotometric Method (HJ636-2012); China Environmental Science Press: Beijing, China, 2012; pp. 1–8. (In Chinese) [Google Scholar]
  26. National Environmental Protection Bureau (NEPB). Water Quality—Determination of Nitrate-Nitrogen–Ultraviolet Spectrophotometric Method (HJ/T 346-2007); China Environmental Science Press: Beijing, China, 2007; pp. 1–2. (In Chinese) [Google Scholar]
  27. National Environmental Protection Bureau (NEPB). Water Quality—Determination of Ammonia Nitrogen–Nessler’s Reagent Spectrophotometric Method (HJ535-2009); China Environmental Science Press: Beijing, China, 2009; pp. 1–6. (In Chinese) [Google Scholar]
  28. National Environmental Protection Bureau (NEPB). Water Quality—Determination of Phosphorus–Ammonium Molybdate Spectrophotometric Method (GB11893-89); China Environmental Science Press: Beijing, China, 1989; pp. 1–4. (In Chinese) [Google Scholar]
  29. Ministry of Environmental Protection of China. The Chinese Environmental Quality Standards for Surface Water (GB3838–2002); China Environmental Science Press: Beijing, China, 2002; pp. 1–8. (In Chinese) [Google Scholar]
  30. Ministry of Environmental Protection of China. The Chinese Environmental Quality Standards for Groundwater (GB/T 14848-2017); China Standard Press: Beijing, China, 2017; pp. 1–13. (In Chinese) [Google Scholar]
  31. Dupas, R.; Musolf, A.; Jawitz, J.W.; Rao, P.S.C.; Jaeger, C.G.; Fleckenstein, J.H.; Rode, M.; Borchardt, D. Carbon and nutrient export regimes from headwater catchments to downstream reaches. Biogeosciences 2017, 14, 4391–4407. [Google Scholar] [CrossRef] [Green Version]
  32. Dupas, R.; Minaudo, C.; Gruau, G.; Ruiz, L.; Gascuel-Odoux, C. Multidecadal trajectory of riverine nitrogen and phosphorus dynamics in rural catchments. Water Resour. Res. 2018, 54, 5327–5340. [Google Scholar] [CrossRef]
  33. Rhodes, A.L.; Newton, R.M.; Pufall, A. Influences of land use on water quality of a diverse New England watershed. Environ. Sci. Technol. 2001, 35, 3640–3645. [Google Scholar] [CrossRef] [PubMed]
  34. Chen, R.H.; Mo, D.Q.; Li, J.C.; Deng, Z.Q.; Wang, H.F.; Qin, Y.H.; Qin, J.H. Huixian karst wetland water quality monitoring. Shandong Chem. Ind. 2018, 6, 156–160. (In Chinese) [Google Scholar]
  35. Nardo, A.D.; Natale, M.D.; Iervolino, M.; Musmarra, D.; Santonastaso, G.F. Convolution integral vs. finite difference for the inverse problem of detection of a contamination source in rivers. Desalination Water Treat. 2017, 86, 277–284. [Google Scholar] [CrossRef]
  36. Capell, R.; Bartosova, A.; Tonderski, K.; Arheimer, B.; Pedersen, S.M.; Zilans, A. From local measures to regional impacts: Modelling changes in nutrient loads to the baltic sea. J. Hydrol. 2019, 36, 100867. [Google Scholar]
  37. Zeiger, S.J.; Owen, M.R.; Pavlowsky, R.T. Simulating nonpoint source pollutant loading in a karst basin: A swat modeling application. Sci. Total Environ. 2021, 785, 147295. [Google Scholar] [CrossRef]
  38. Ghasemizadeh, R.; Hellweger, F.; Butscher, C.; Padilla, I.; Vesper, D.; Field, M.; Alshawabkeh, A. Review: Groundwater flow and transport modeling of karst aquifers, with particular reference to the north coast limestone aquifer system of Puerto Rico. J. Hydrol. 2012, 20, 1441–1461. [Google Scholar] [CrossRef] [Green Version]
  39. Zhang, R.R.; Shu, L.C.; Zhu, J.T.; Yu, Z.B.; Jiang, P. Storage and drainage characteristics of a highly heterogeneous karst aquifer in Houzhai Basin. Groundwater 2016, 54, 878–887. [Google Scholar] [CrossRef]
  40. EI Gaouzi, F.Z.J.; Sebilo, M.; Ribstein, P.; Plagnes, V.; Boeckx, P.; Xue, D.M.; Derenne, S.; Zakeossian, M. Using δ15N and δ18O values to identify sources of nitrate in karstic springs in the Paris basin (France). Appl. Geochem. 2013, 35, 230–243. [Google Scholar] [CrossRef]
  41. Musgrove, M.; Opsahl, S.P.; Mahler, B.J.; Herrington, C.; Sample, T.L.; Banta, J.R. Source, variability, and transformation of nitrate in a regional karst aquifer: Edwards aquifer, central Texas. Sci. Total Environ. 2016, 568, 457–469. [Google Scholar] [CrossRef] [PubMed] [Green Version]
  42. Opsahl, S.P.; Musgrove, M.; Slattery, R.N. New insights into nitrate dynamics in a karst groundwater system gained from in situ high-frequency optical sensor measurements. J. Hydrol. 2017, 546, 179–188. [Google Scholar] [CrossRef]
  43. Kim, H.S.; Park, S.R. Hydrogeochemical characteristics of groundwater highly polluted with nitrate in an agricultural area of Hongseong, Korea. Water 2016, 8, 345. [Google Scholar] [CrossRef] [Green Version]
  44. Ahmed, A.; Ghosh, P.K.; Hasan, M.; Rahman, A. Surface and groundwater quality assessment and identification of hydrochemical characteristics of a south-western coastal area of Bangladesh. Environ. Monit. Assess. 2020, 192, 258. [Google Scholar] [CrossRef] [PubMed]
  45. Yue, F.J.; Li, S.L.; Liu, C.Q.; Lang, Y.C.; Ding, H. Sources and transport of nitrate constrained by the isotopic technique in a karst catchment: An example from Southwest China. Hydrol. Processes 2015, 29, 1883–1893. [Google Scholar] [CrossRef]
  46. Liu, C.Q.; Li, S.L.; Lang, Y.C.; Xiao, H.Y. Using δ15N and delta δ18O values to identify nitrate sources in karst ground water, Guiyang, Southwest China. Environ. Sci. Technol. 2006, 40, 6928–6933. [Google Scholar] [CrossRef] [PubMed]
  47. Ministry of Health of the People’s Republic of China. Standardization Administration of P.R. China MOH & SAC. In Chinese National Standards (GB 5749–2006): Standards for Drinking Water Quality; Standards Press of China: Beijing, China, 2006; pp. 1–9. [Google Scholar]
  48. Magal, E.; Arbel, Y.; Caspi, S.; Glazman, H.; Grseenbaum, N.; Yechiel, Y. Determination of pollution and recovery time of karst springs, an example from a carbonate aquifer in Israel. J Contam. Hydrol. 2013, 145, 26–36. [Google Scholar] [CrossRef]
  49. Venkiteswaran, J.J.; Boeckx, P.; Gooddy, D.C. Towards a global interpretation of dual nitrate isotopes in surface waters. J. Hydrol. 2019, 4, 100037. [Google Scholar] [CrossRef]
Figure 1. Location of the Mudong River watershed showing the sampling sites.
Sustainability 13 10740 g001
Figure 2. The time series of temperature and DO at all the sampling sites. The light-yellow area represents the dry season.
Sustainability 13 10740 g002
Figure 3. Water table contours map of the Mudong River watershed.
Sustainability 13 10740 g003
Figure 4. The time series of TN and TP concentrations at all the sampling sites.
Sustainability 13 10740 g004
Figure 5. Spatial distribution of TN (a) and TP (b) concentration (a: PN = TN − (NO3-N + NH4+-N), b: PP = TP − TDP), boxplots of TN (c,e) and TP (d,f) concentration in surface water and shallow groundwater.
Sustainability 13 10740 g005aSustainability 13 10740 g005b
Figure 6. Variations of nitrogen and phosphorus at: (a) R1, S1, and S2 sites in the northern recharge area, (b) R2, G1, G2, and G3 sites in the northern recharge area, (c) R5 and G6 sites in the central wetland core area during the wet and dry season, and (d) in karst fissures and conduits.
Sustainability 13 10740 g006
Table 1. Statistical description of hydrological indicators and TN and TP concentration at all the sampling sites during the wet and dry seasons.
TypeNo.LatitudeLongitudeSection Width (m)Flow Velocity (m/s) Water Table (m)TN (mg/L)TP (mg/L)
Wet SeasonDry
Season
Wet Season Dry SeasonWet Season Dry Season Wet Season Dry Season p-ValueWet Season Dry Season p-Value
SW R1110°12′25″ E25°08′27″ N 2.5−3.02.0−2.50.001−0.100 (0.053)<0.001157.54−157.93 (157.77)157.40−157.47 (157.47)2.581.090.0240.0360.0420.813
R2110°12′16″25°07′46″3.5−4.03.0−3.50.020−0.100 (0.048)<0.02152.62−152.95 (152.73)152.58−152.7 (152.65)1.914.550.0010.0140.0920.000
R3110°12′26″25°07′15″5.0−5.54.0−4.50.020−0.150 (0.082)<0.02150.18−150.65 (150.40)150.02−150.47 (150.16)2.003.190.4460.0740.0650.812
R4110°12′58″25°06′23″ 3.0−7.5<3.00.010−0.250 (0.085)<0.01149.30−150.11 (149.53)148.15−149.44 (149.03)1.082.050.1600.0760.0980.383
R5110°13′28″25°05′33″8.0−9.08.00.008−0.013 (0.010)≤0.010148.58−151.21 (150.01)148.44−148.67 (148.50)0.522.190.0180.1070.1260.061
R6110°11′54″25°05′42″ 19−20.018−190.010−0.100 (0.035)0.02−0.01148.80−149.86 (149.25)148.90−149.20 (149.05)1.511.990.3620.1340.1170.608
R7110°11′29″25°05′54″12.0−14.010−120.008−0.012 (0.01)≤0.010149.54−150.50 (149.96)149.34−149.66 (149.48)1.301.400.7400.1730.1380.190
R8110°10′55″25°05′29″4.5−9.01.6−5.00.010−0.030 (0.016)≤0.010150.30−150.90 (150.44)150.25−150.30
(150.29)
1.711.680.9290.1830.1880.780
R9110°11′03″25°06′26″10.0−27.0<6.00.014−0.750 (0.398)≤0.150148.55−149.20 (148.85)148.50−148.70
(148.57)
0.600.860.2450.0790.0980.519
R10110°10′34″25°06′19″ 7.0−11.3<5.00.100−0.430 (0.271)≤0.150148.24−149.32 (148.55)148.00−148.30
(148.13)
0.751.430.1350.1050.1250.431
R11110°09′21″25°05′56″3.5−6.03.50.200−0.900 (0.450)0.09−0.45 (0.150)146.20−147.15 (146.63)145.75−145.95
(145.81)
1.374.530.0320.1550.2940.008
TypeNo.LatitudeLongitudeElevation (m)Flow (L/s)TN (mg/L)TP (mg/L)
Wet SeasonDry SeasonWet SeasonDry Seasonp-ValueWet SeasonDry Seasonp-Value
GW S1110°12′16″25°08′55″189.320.010−0.05≤0.0102.92.30.7370.0210.0280.364
S2110°12′18″25°08′44″160.130.010−0.050.001−0.0103.333.300.9780.0230.0380.013
No.LatitudeLongitudeDepth (m)Water Table (m)Wet SeasonDry Seasonp-ValueWet SeasonDry Seasonp-Value
Wet Season Dry Season
G1110°11′36″25°08′14″3.9152.80−154.00 (153.44)153.10−153.88 (153.39)3.923.490.7990.0240.0110.010
G2110°12′11″25°08′05″4.2153.10−155.01 (154.03)152.84−153.90 (153.32)3.472.930.4060.0420.0190.071
G3110°12′27″25°07′42″2.9152.33−154.02 (153.19)152.01−152.75 (152.30)2.375.030.0220.0270.0270.980
G4110°13′32″25°07′03″2.9149.90−151.80 (151.17)150.05−151.30 (150.99)15.2615.680.7670.0770.0450.044
G5110°12′25″25°06′40″4.9149.50−152.01 (150.20)149.39−150.66 (149.70)18.9820.330.4480.0350.0270.286
G6110°13′27″25°05′39″5.6148.70−150.10 (148.91)148.52−149.22 (148.82)7.9414.700.0020.0270.0450.024
G7110°11′53″25°05′22″4.2149.08−151.13 (150.61)148.98−150.92 (150.24)15.5512.920.1100.2060.1360.003
G8110°11′17″25°06′02″3.3149.85−151.00 (150.62)149.73−150.78 (150.20)2.692.000.3500.0380.0240.128
G9110°10′59″25°05′29″6.5149.60−152.00 (150.87)149.54−151.19 (150.39)2.961.120.0680.0380.0300.612
Note: SW: surface water. GW: groundwater. min−max (mean): the minimum and maximum (mean) value of the sample set during the monitoring period. mean value.
Table 2. Environmental standards and seasonal variation of N and P indicators of surface water and shallow groundwater in the study area.
TypeIndicatorUnitClass III Standard Limits [29,30]Wet SeasonOver-Limit Ratio (%)Dry SeasonOver-Limit Ratio
(%)
Concentration
(mg/L)
Min−Max (Mean)
VarianceCV Concentration
(mg/L)
Min−Max (Mean)
VarianceCV
SWpH/6−96.9−8.5 (7.6)///6.4−8.7 (7.6)///
TNmg/L1.00.31−4.10 (1.39)0.710.6063.6%0.33−9.50 (2.27)3.770.8574.5%
NO3-N100.01−3.73 (0.68)0.531.080%0.12−4.70 (1.04)1.281.090%
NH4+-N1.00.005−1.56 (0.40)0.110.823.0%0.005−5.69 (0.72)0.841.2720.0%
TP0.20.01−0.23 (0.10)0.0040.619.1%0.01−0.41 (0.13)0.0060.6314.5%
GWpH/6.5−8.56.8−8.0 (7.3)///7.0−8.0 (7.5)///
TNmg/L1.0 0.61−25.02 (7.25)41.770.8998.5%0.86−23.00 (7.89)45.820.8698.2%
NO3-N200.52−18.35 (6.09)30.020.900%0.60−20.11 (5.55)31.161.011.8%
NH4+-N0.50.01−0.20 (0.05)0.0010.720%0.01−0.17 (0.05)0.0010.680%
TP0.2 0.01−0.26 (0.05)0.0031.086.1%0.002−0.16 (0.04)0.0010.890%
CV: coefficient of variation. There is no limit of TN and TP in the “Chinese Environmental Quality Standards for Groundwater” (GB/T14848-2017) [30], the value refers to the same limit value as surface water in the “Chinese Environmental Quality Standards for Surface Water” (GB3838-2002) [29].
Publisher’s Note: MDPI stays neutral with regard to jurisdictional claims in published maps and institutional affiliations.

