
Carpooling Platforms as Smart City Projects: A Bibliometric Analysis and Systematic Literature Review


Abstract
:1. Introduction
2. Background
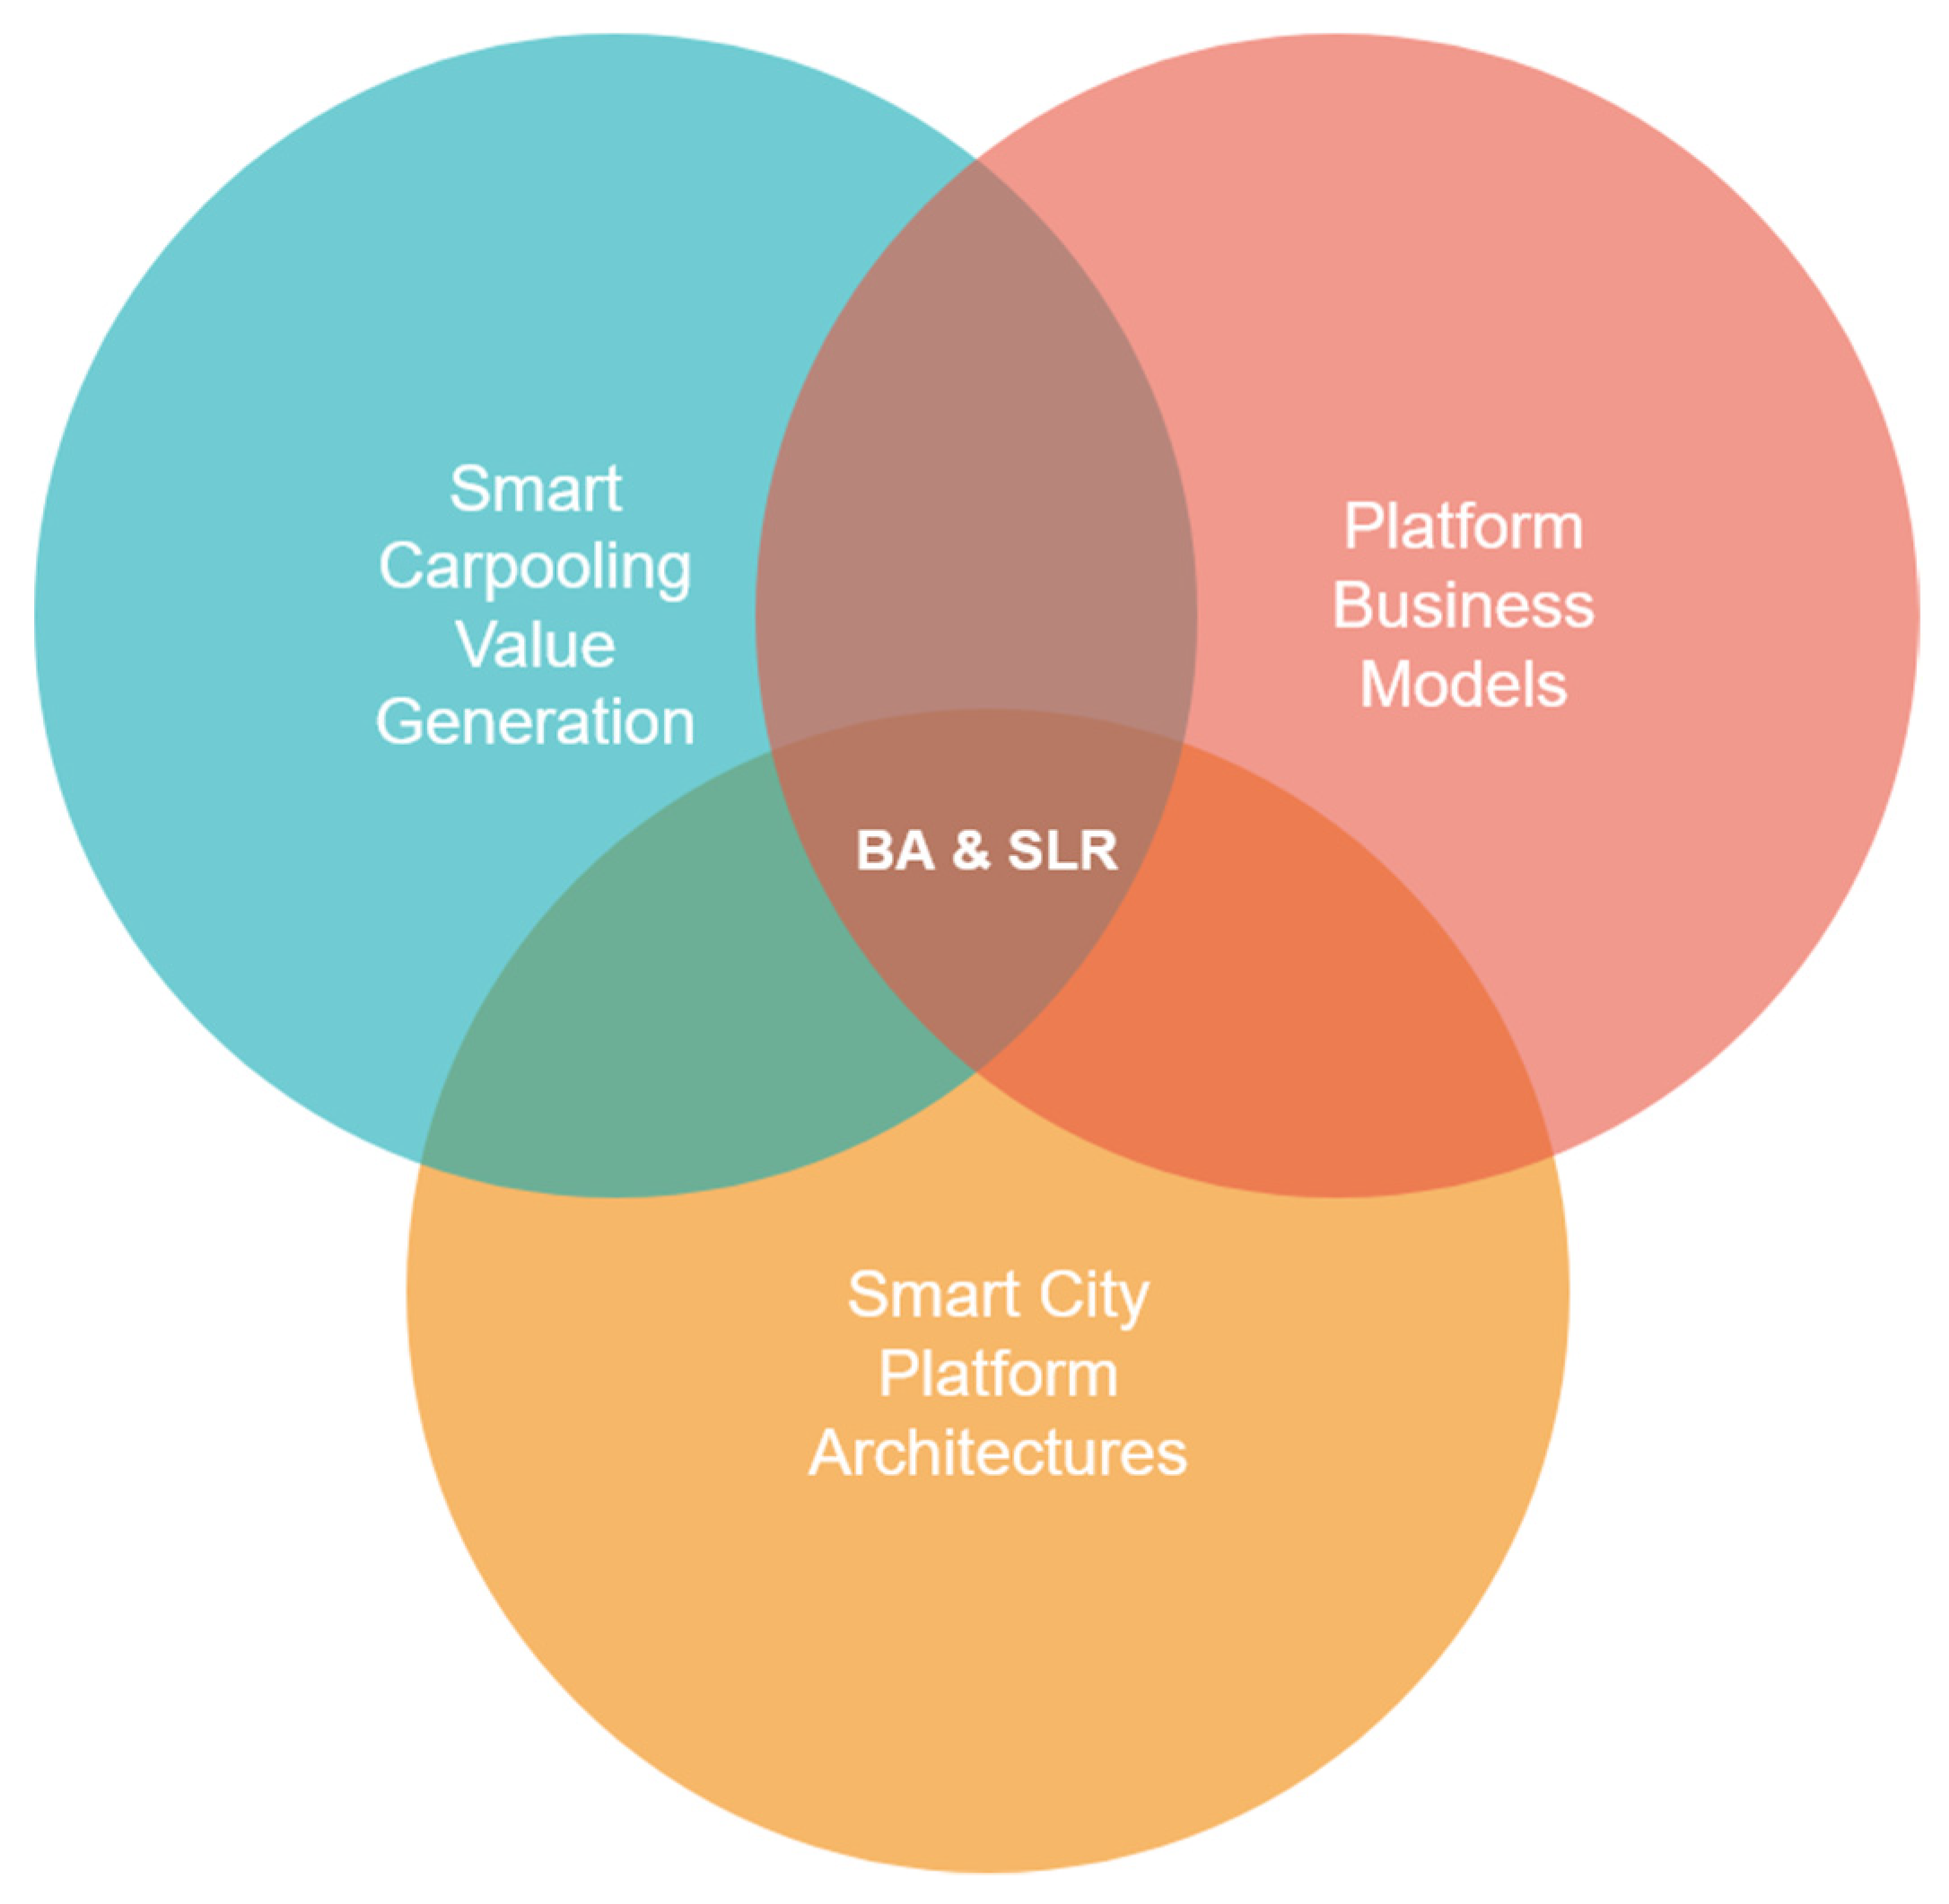
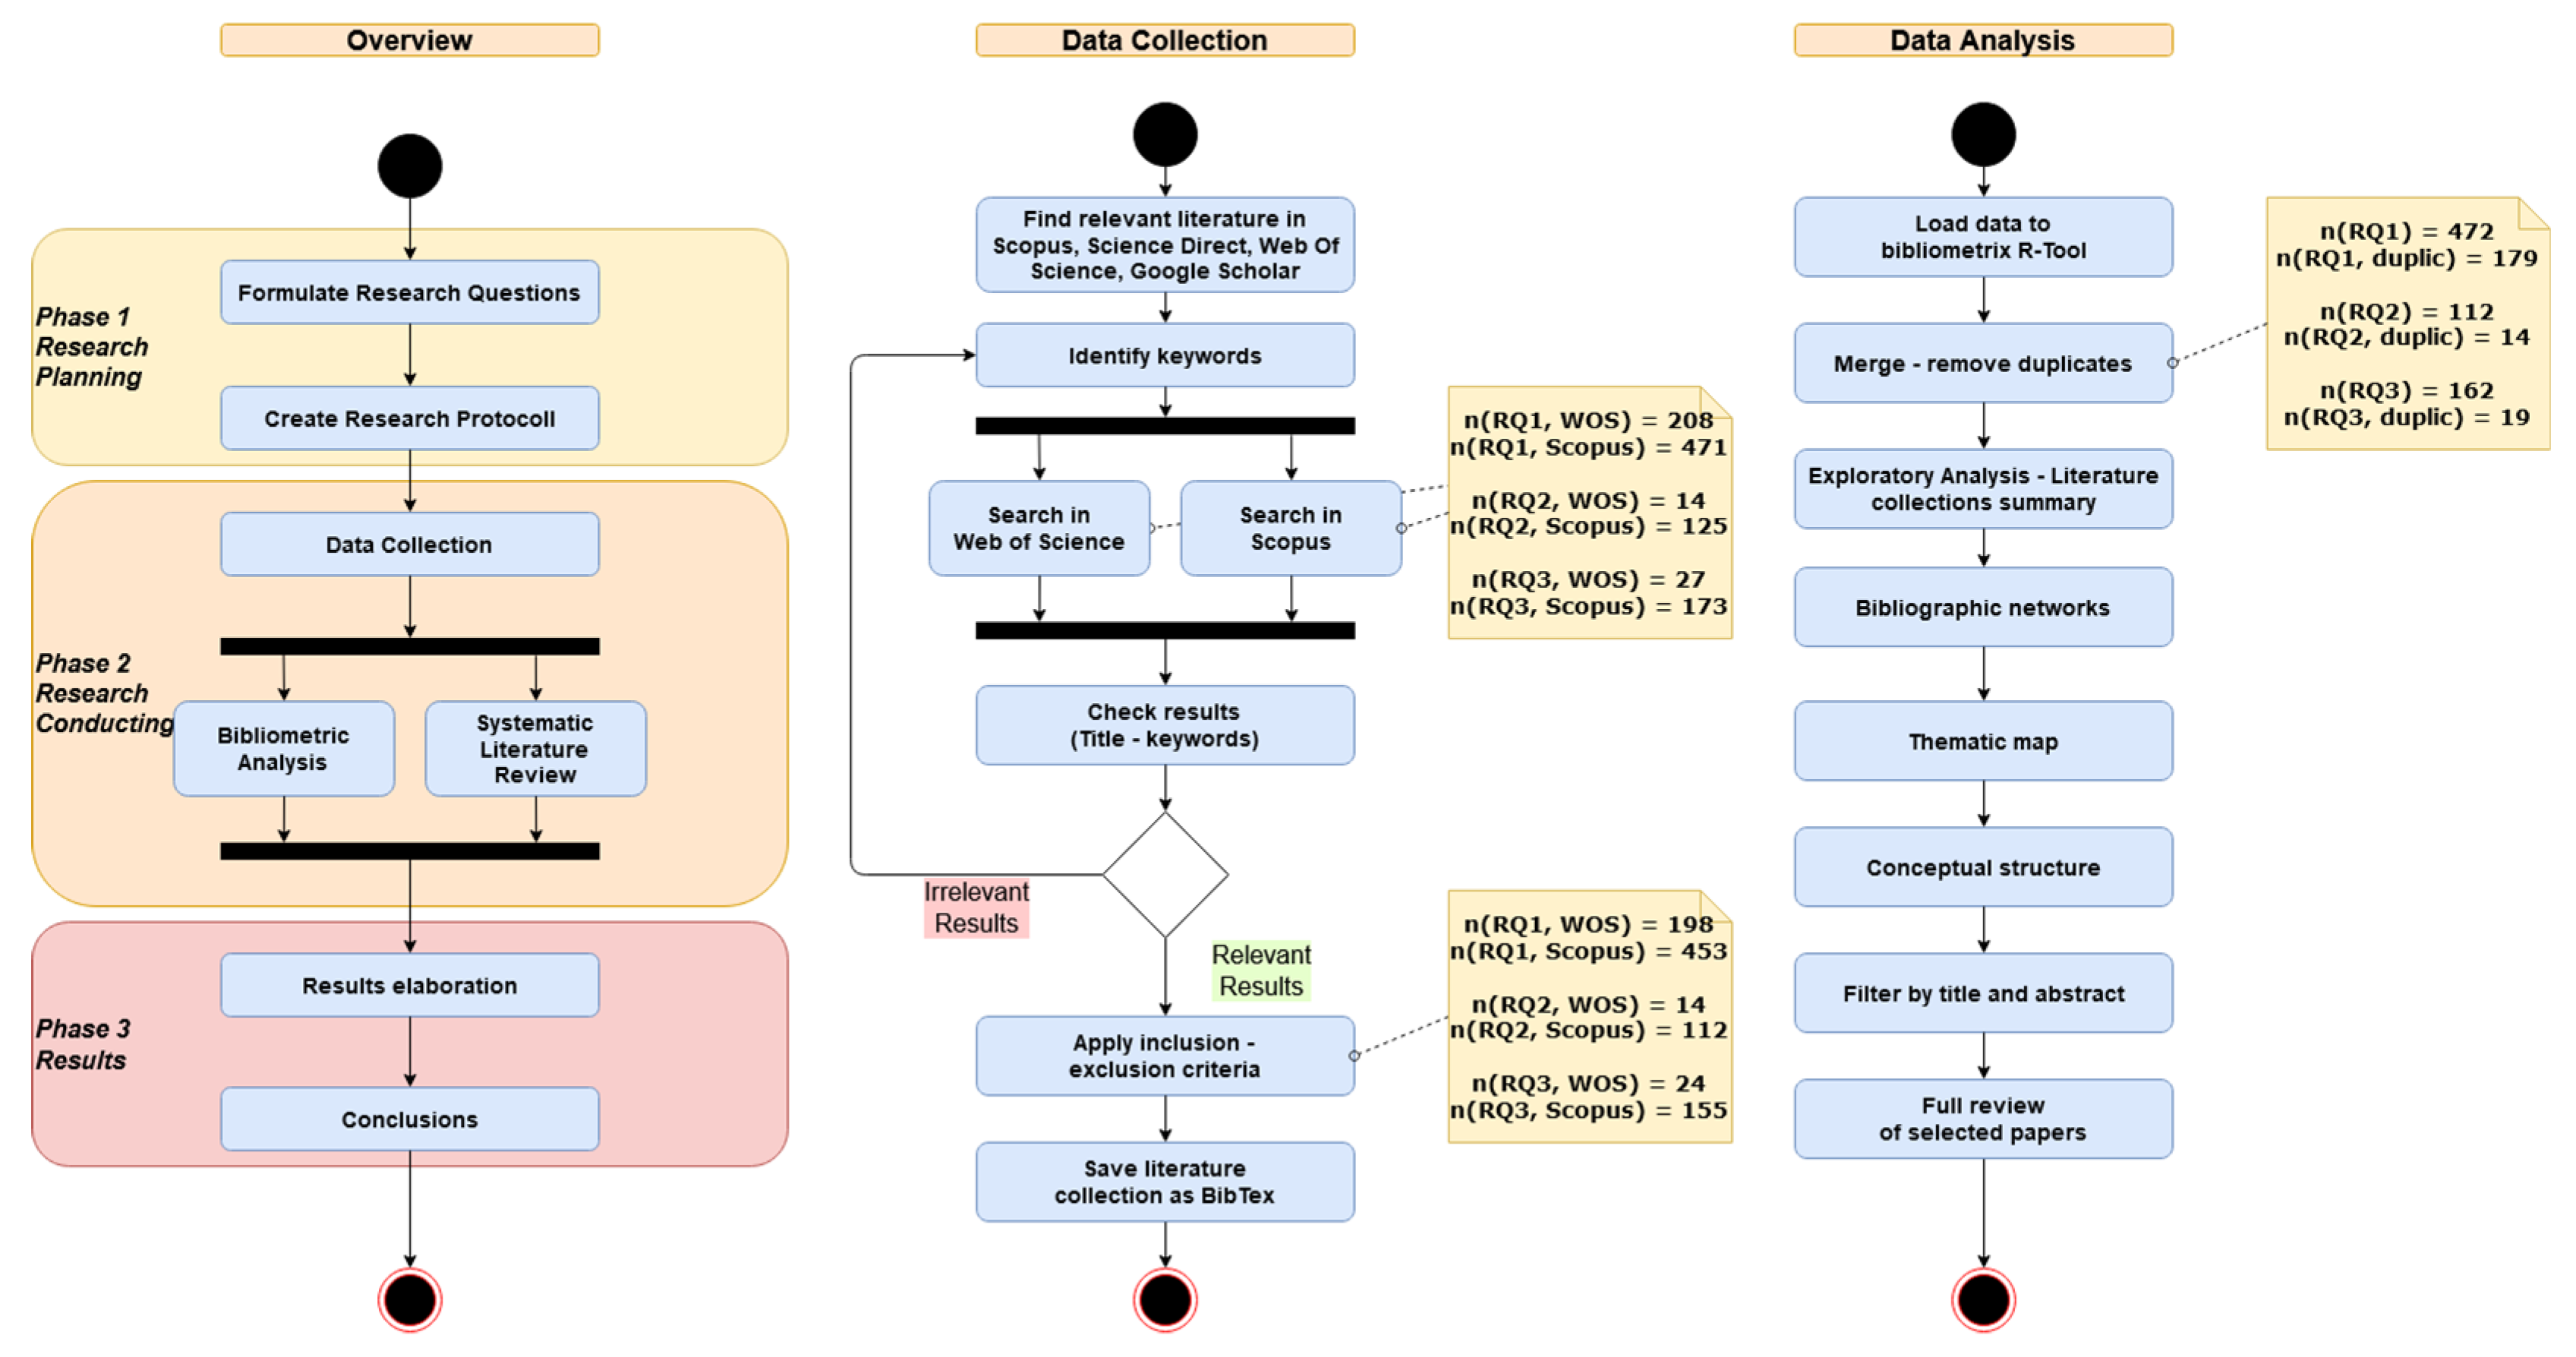
3. Methodology
3.1. Bibliometric Analysis
3.2. Systematic Literature Review
3.3. Research Protocol
3.4. Data Collection
“business model”, (“business model” AND “carpooling”), (“business model” AND “smart mobility”), (“business model” AND “smart transportation”)
- Literature collection #1 for RQ1: ((carpooling OR “smart mobility” OR “smart transportation”) AND (value OR incentive OR benefit))
- Literature collection #2 for RQ2: (“business model” AND (platform OR application) AND (carpooling OR “smart mobility” OR “smart transportation” OR “shared economy” OR “smart city”))
- Literature collection #3 for RQ3: (architecture AND (platform OR application) AND project AND “smart city”)
- Articles in scientific journals (articles)
- Conference Papers
- Reviews
- Book chapters
- Conference reviews
- Documents not written in English
3.5. Data Analysis
3.5.1. Bibliographic Networks
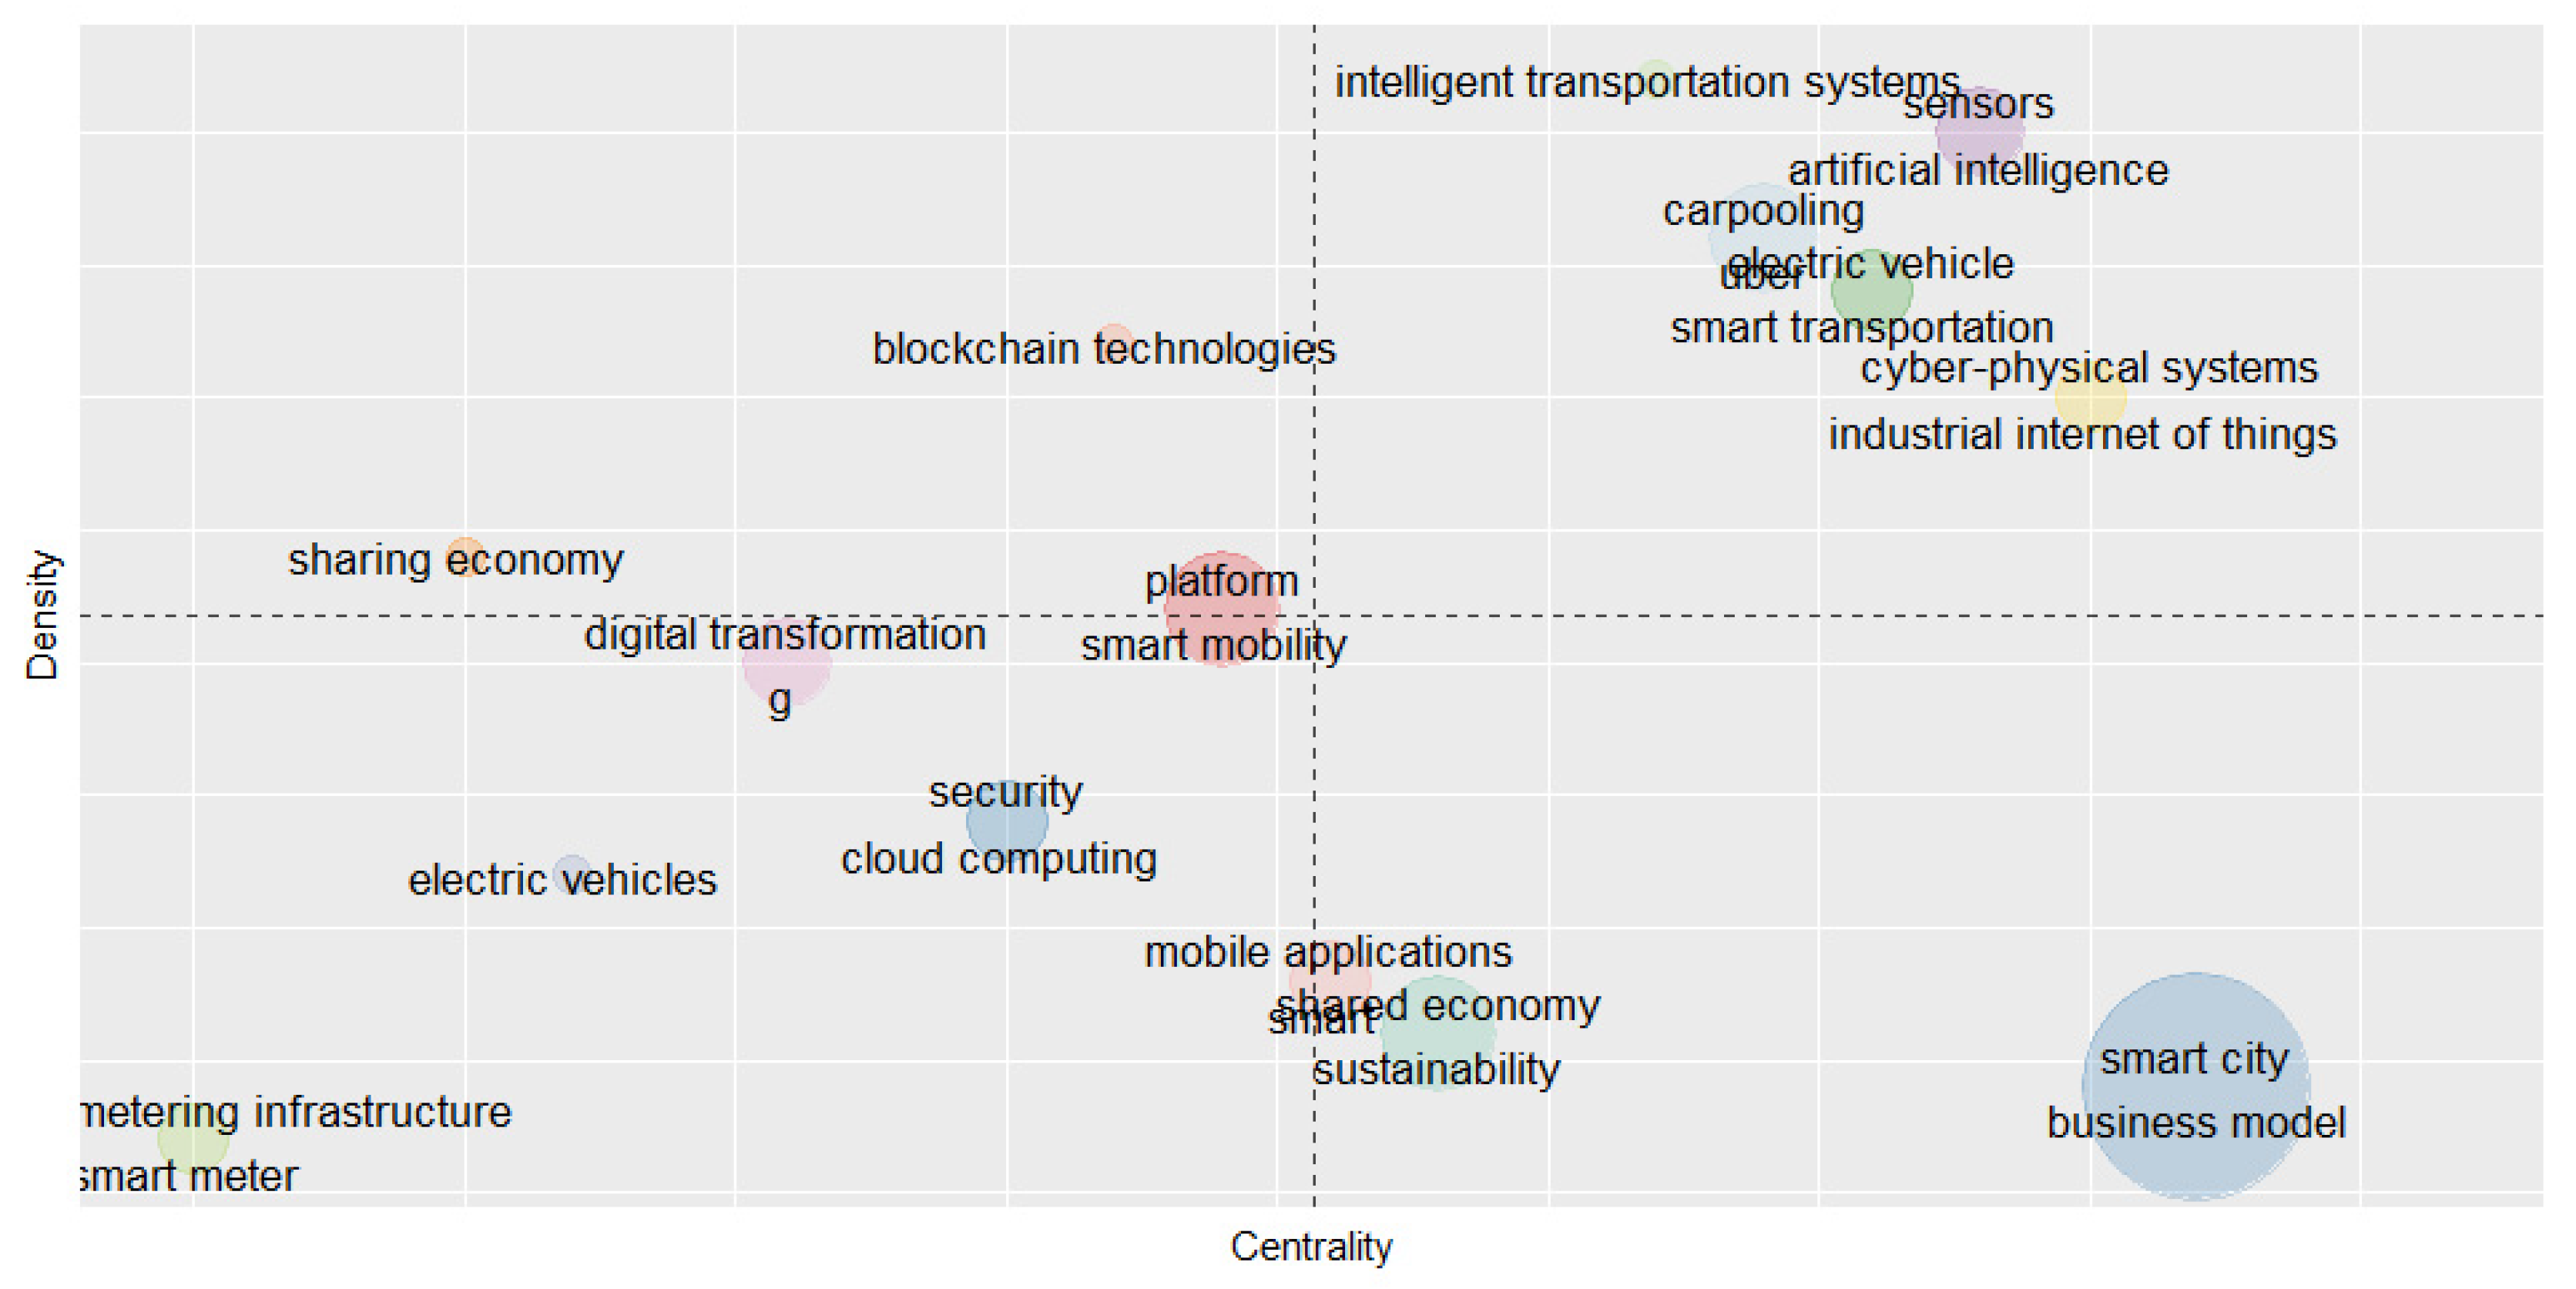
3.5.2. Thematic Map
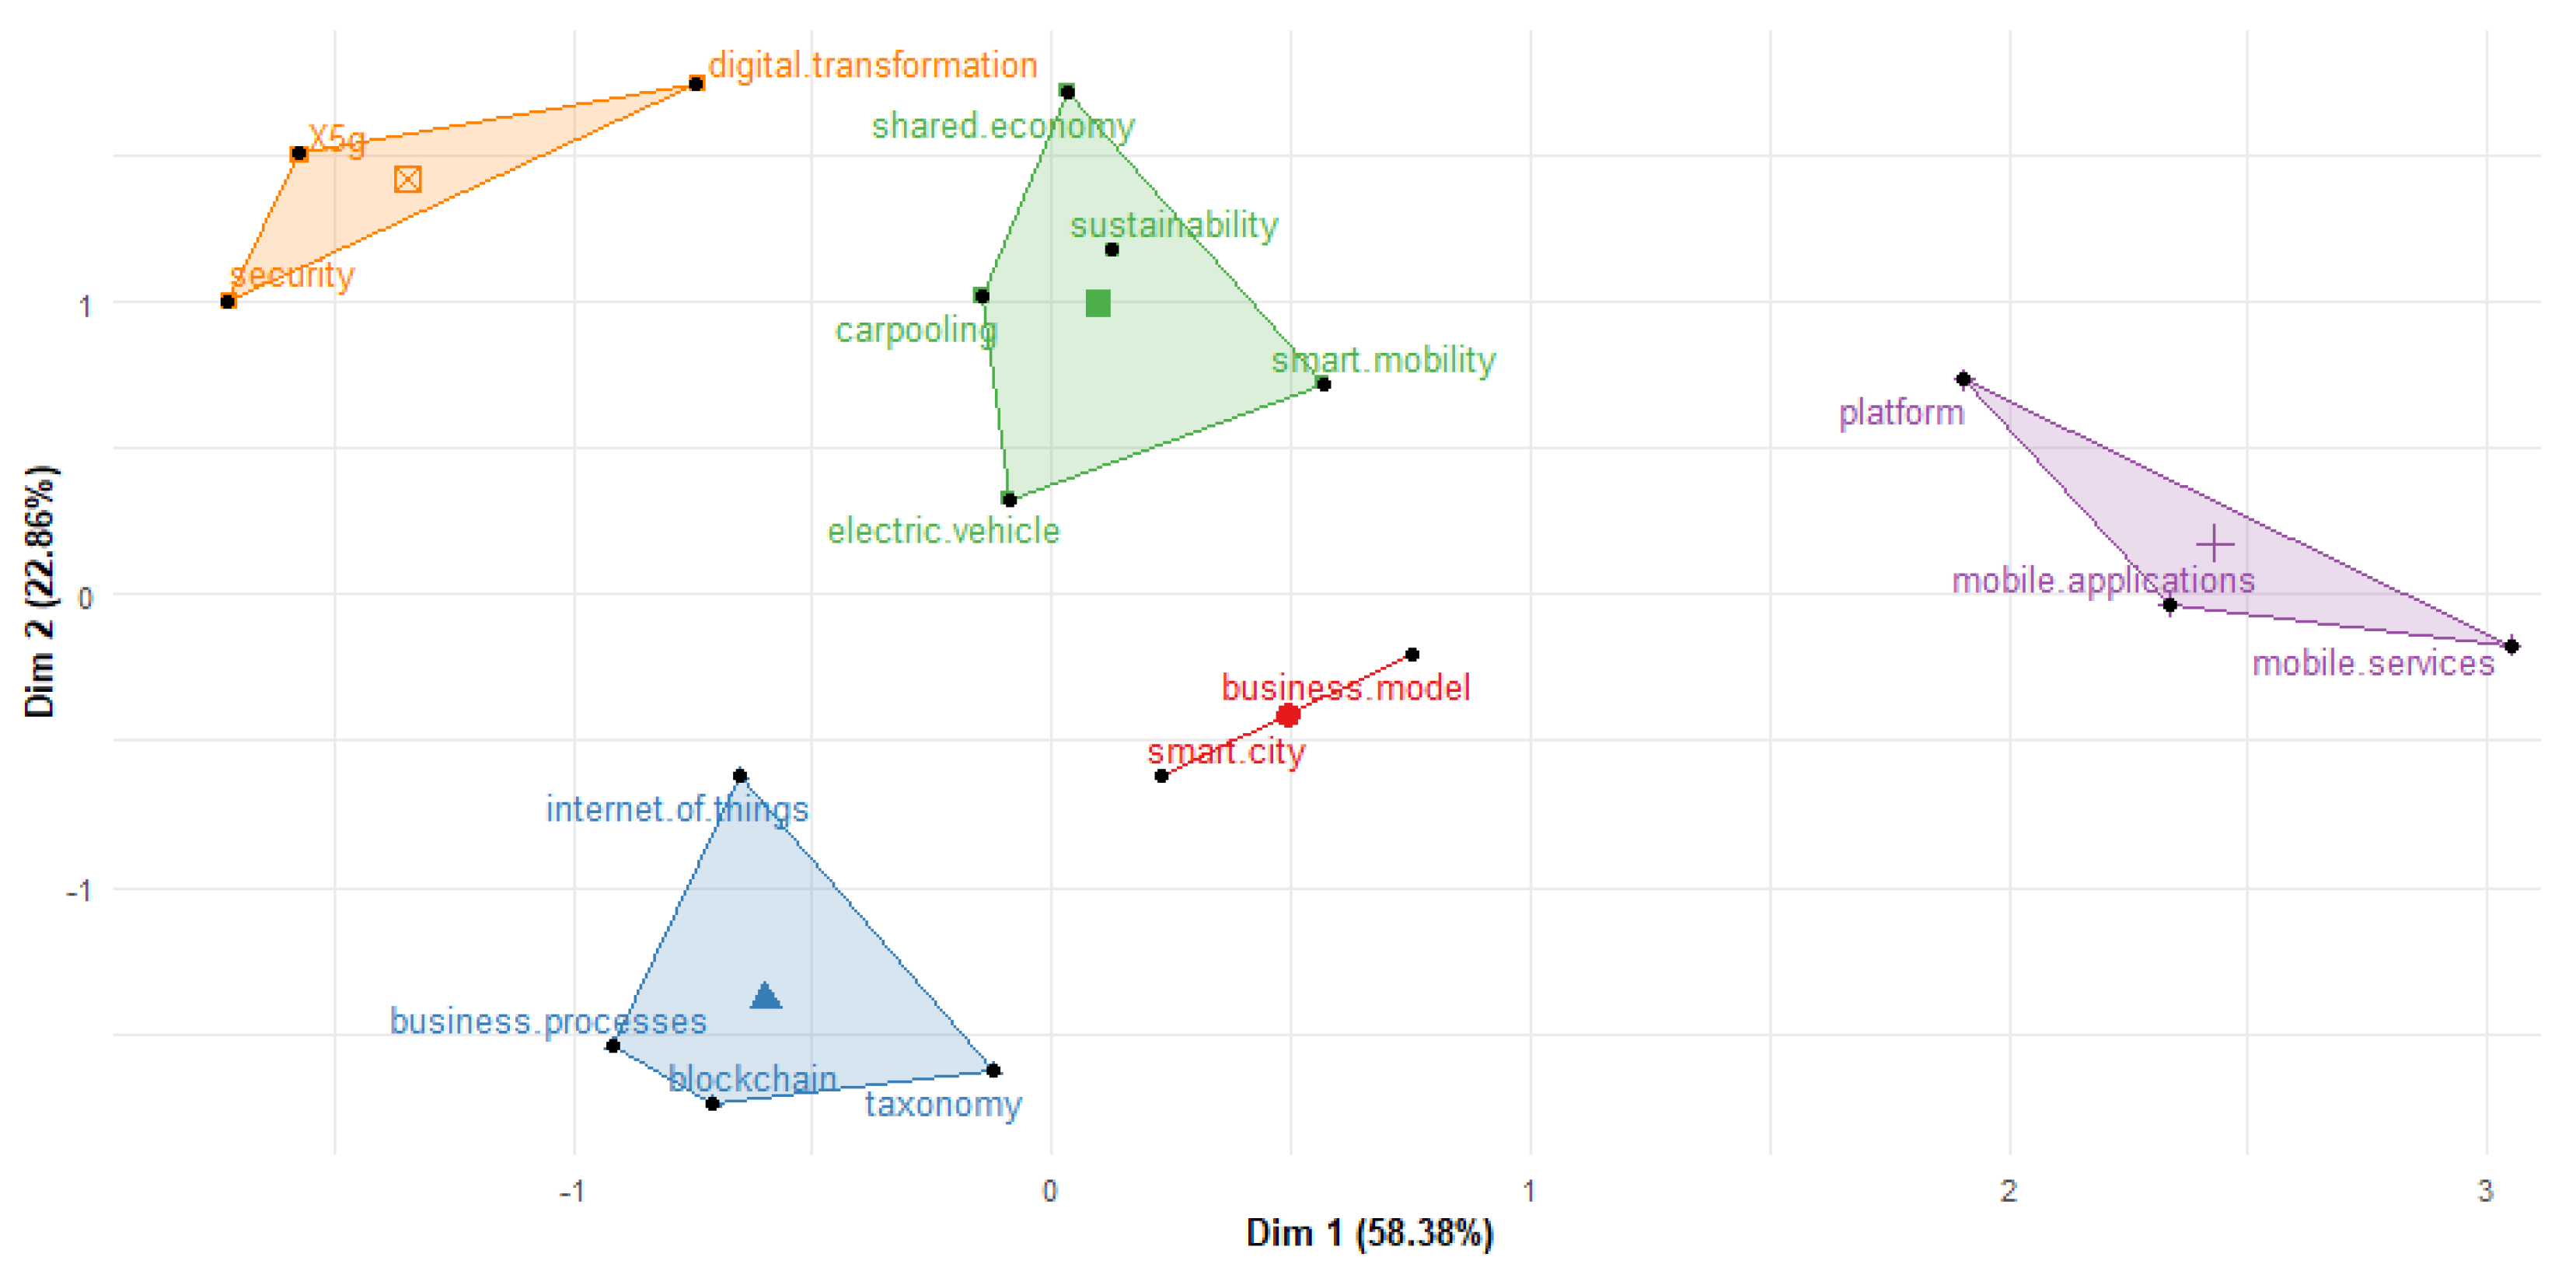
3.5.3. Conceptual Structure
3.5.4. Full Review
4. Results
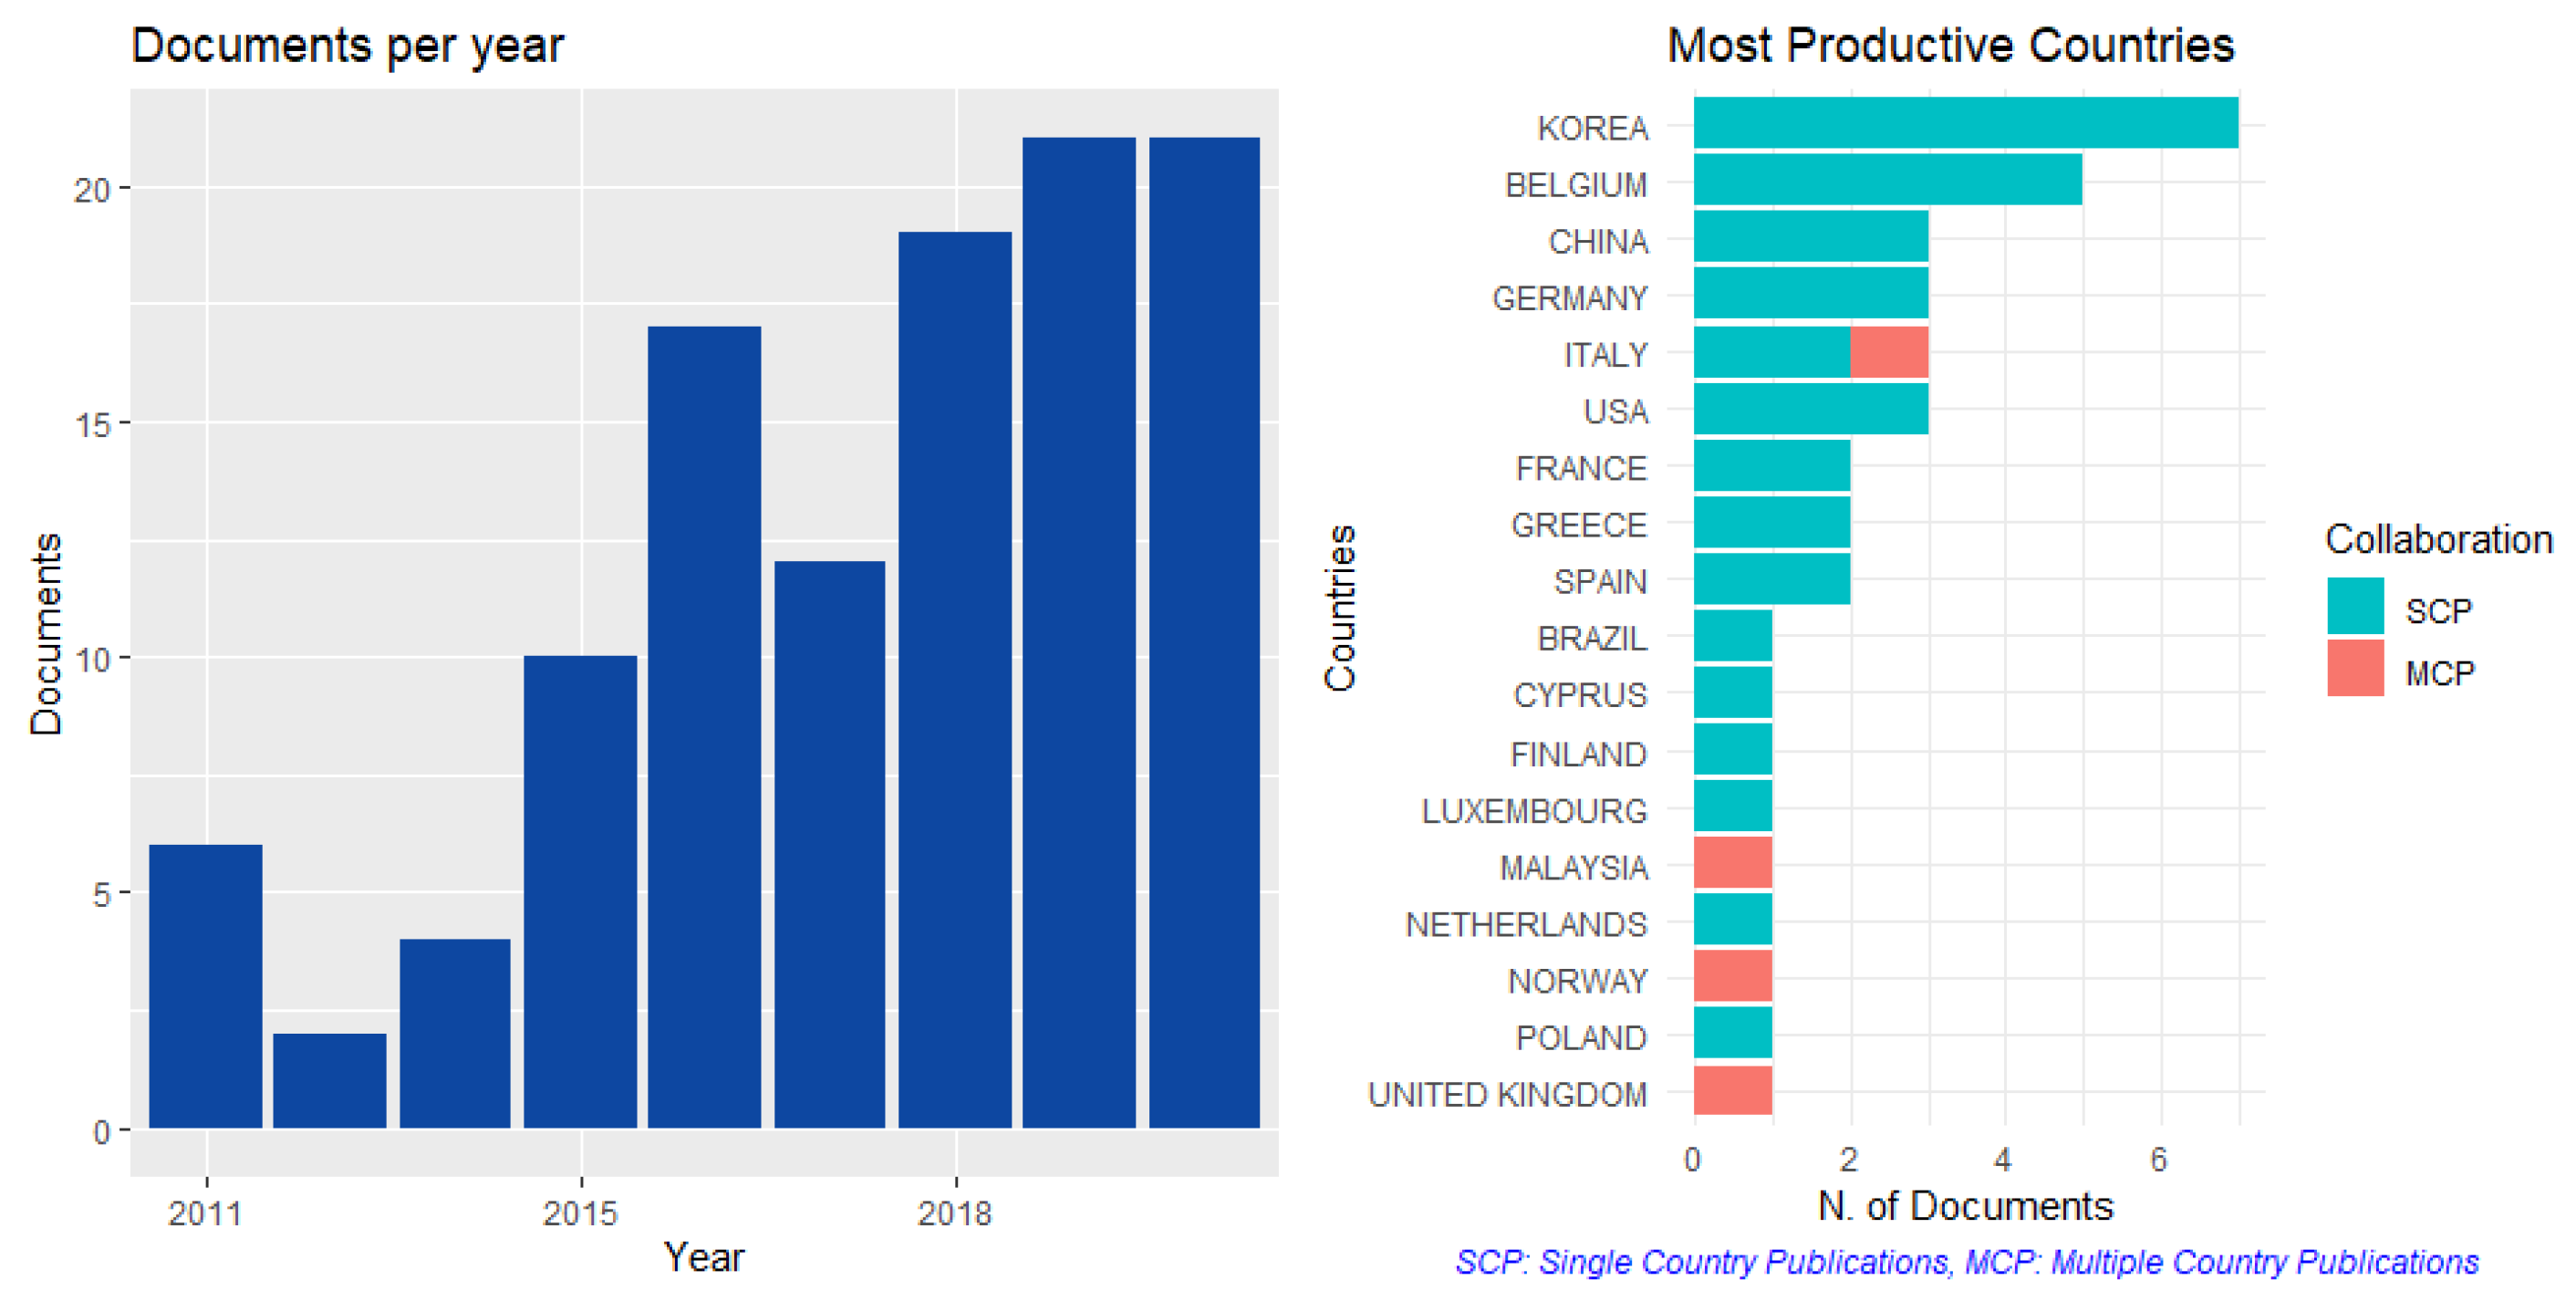
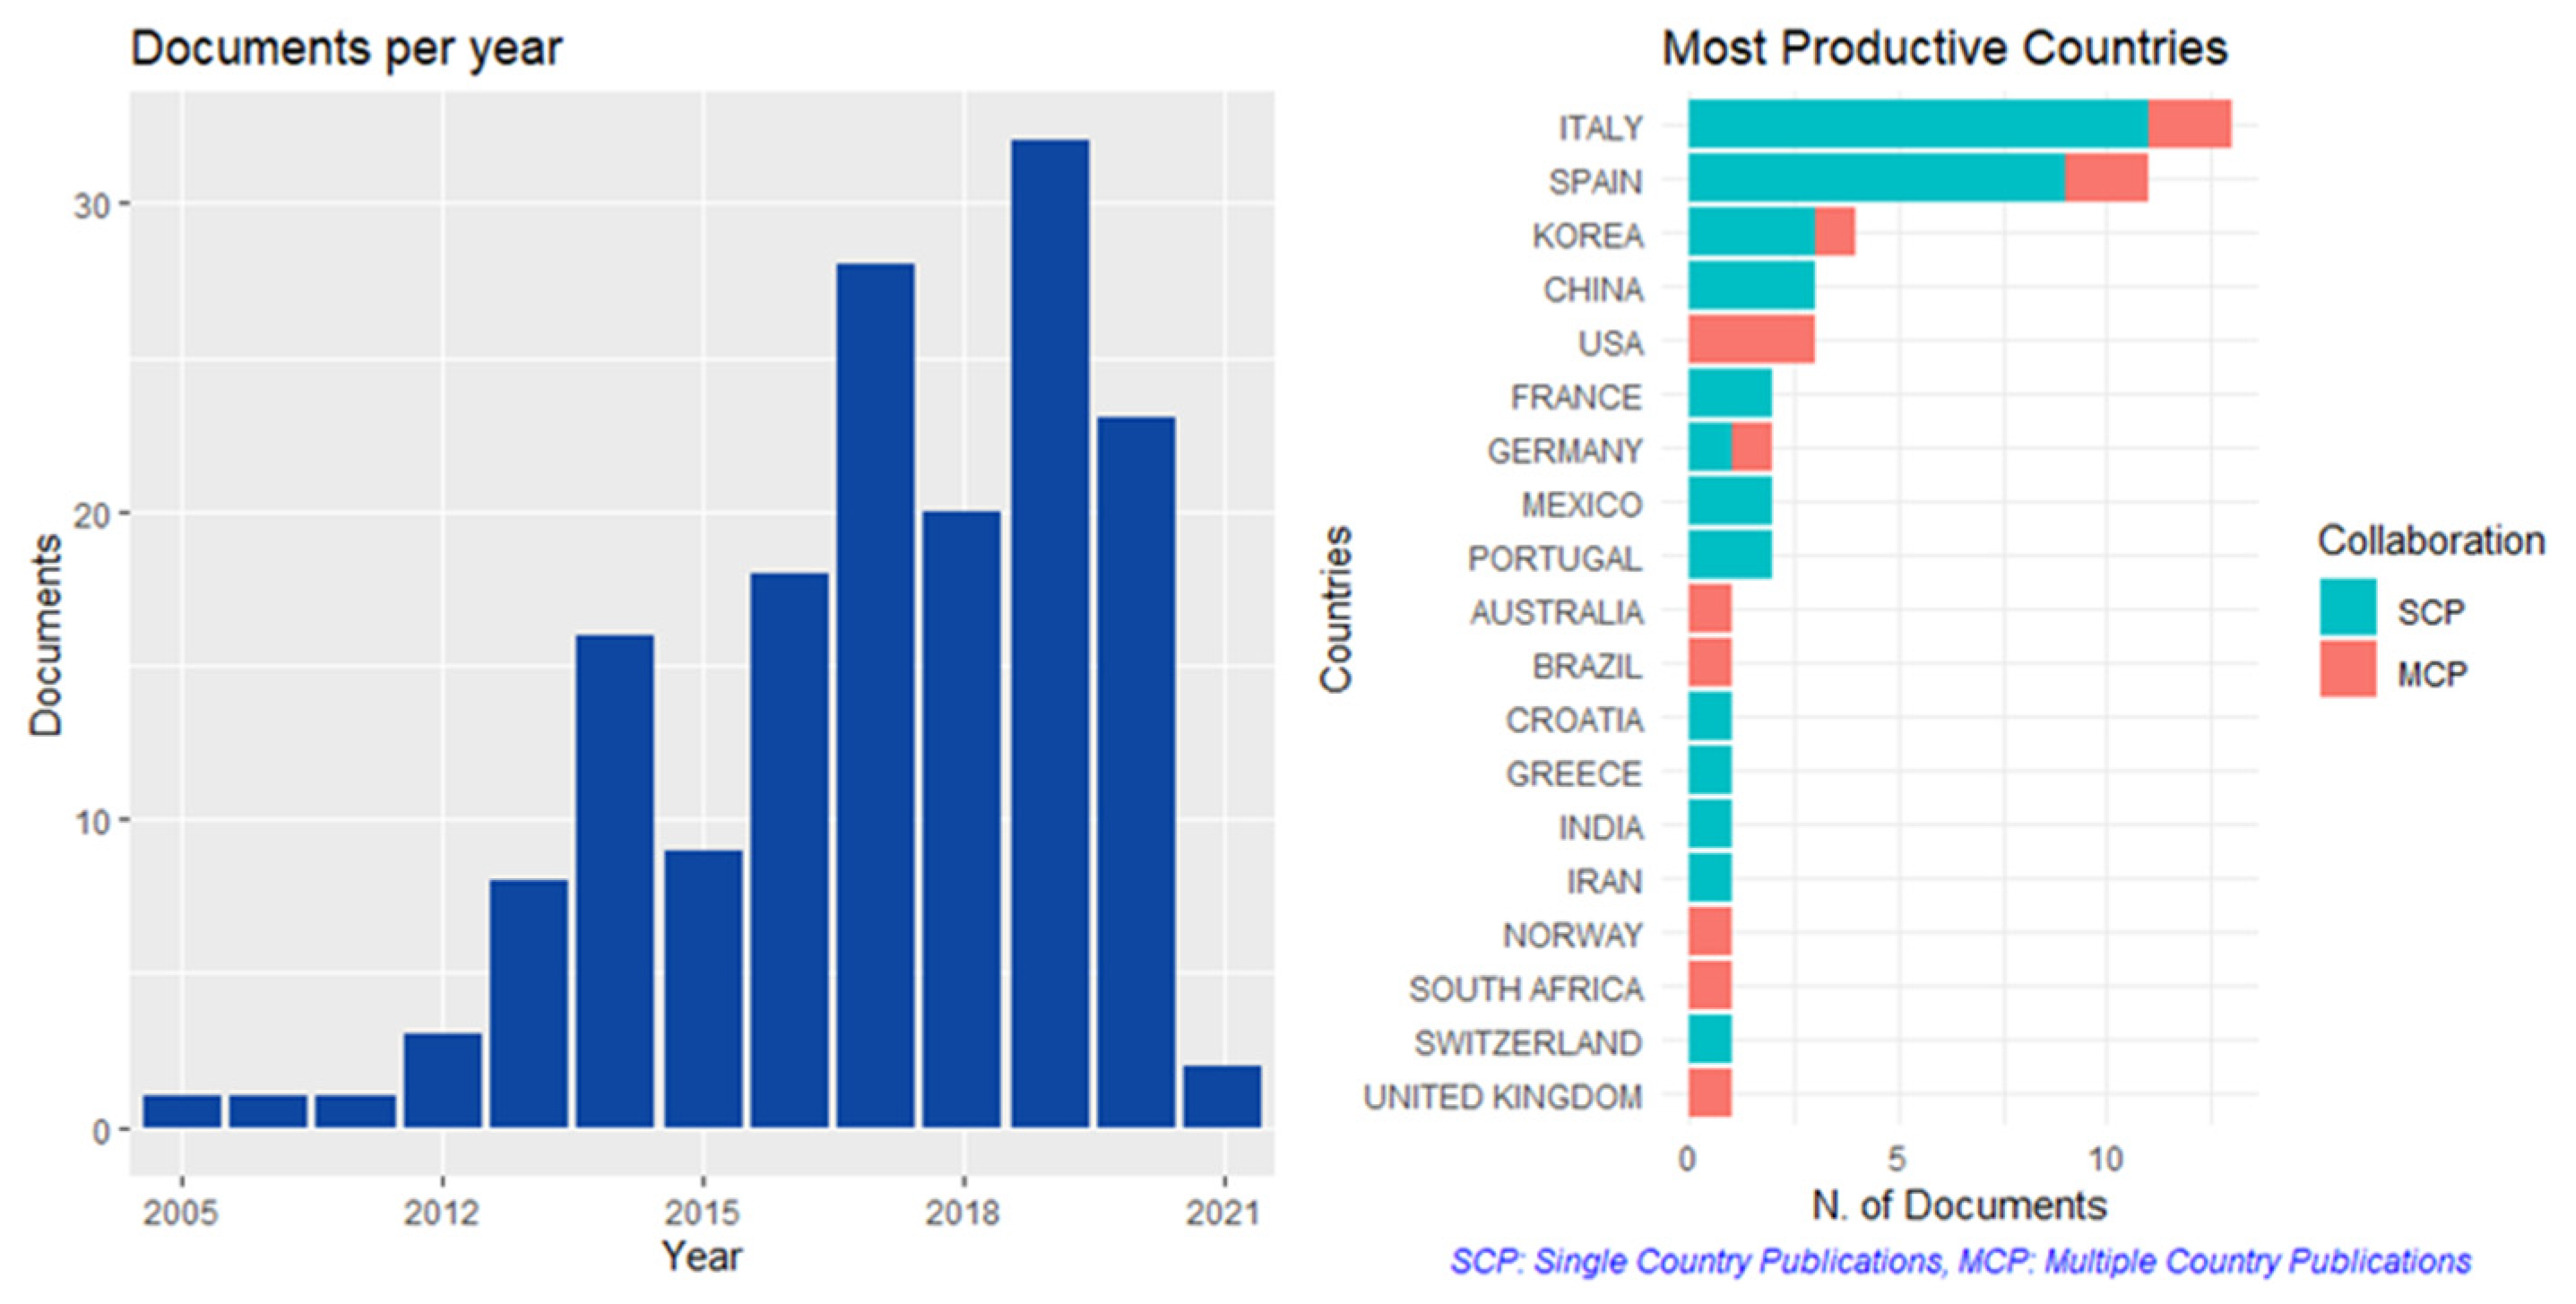
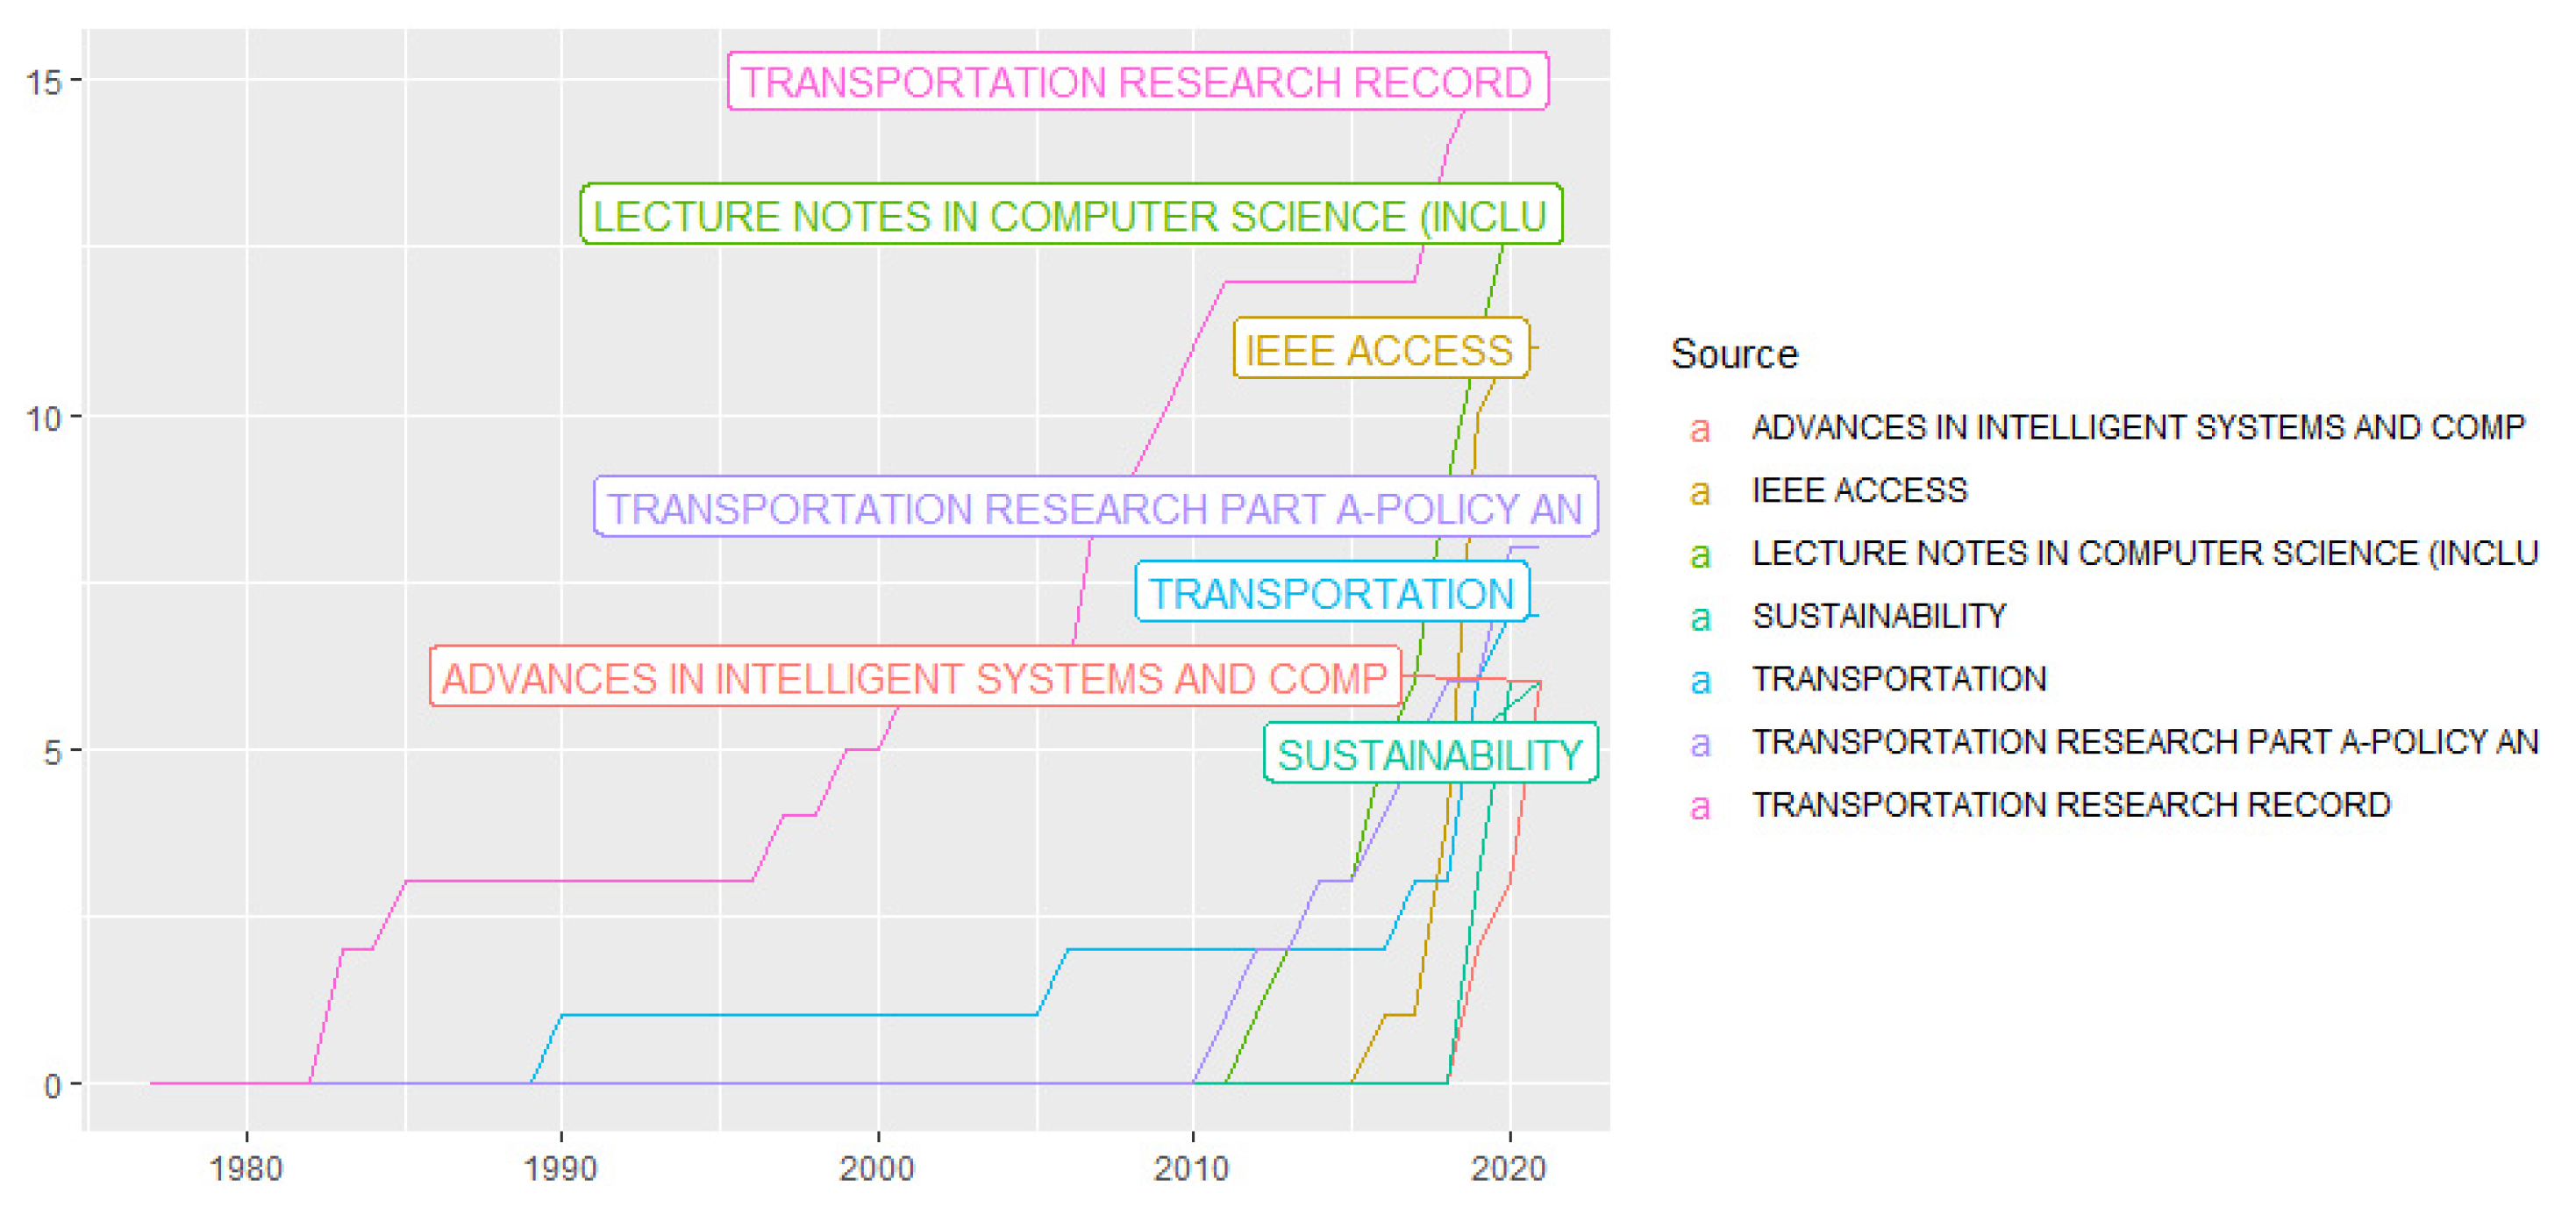
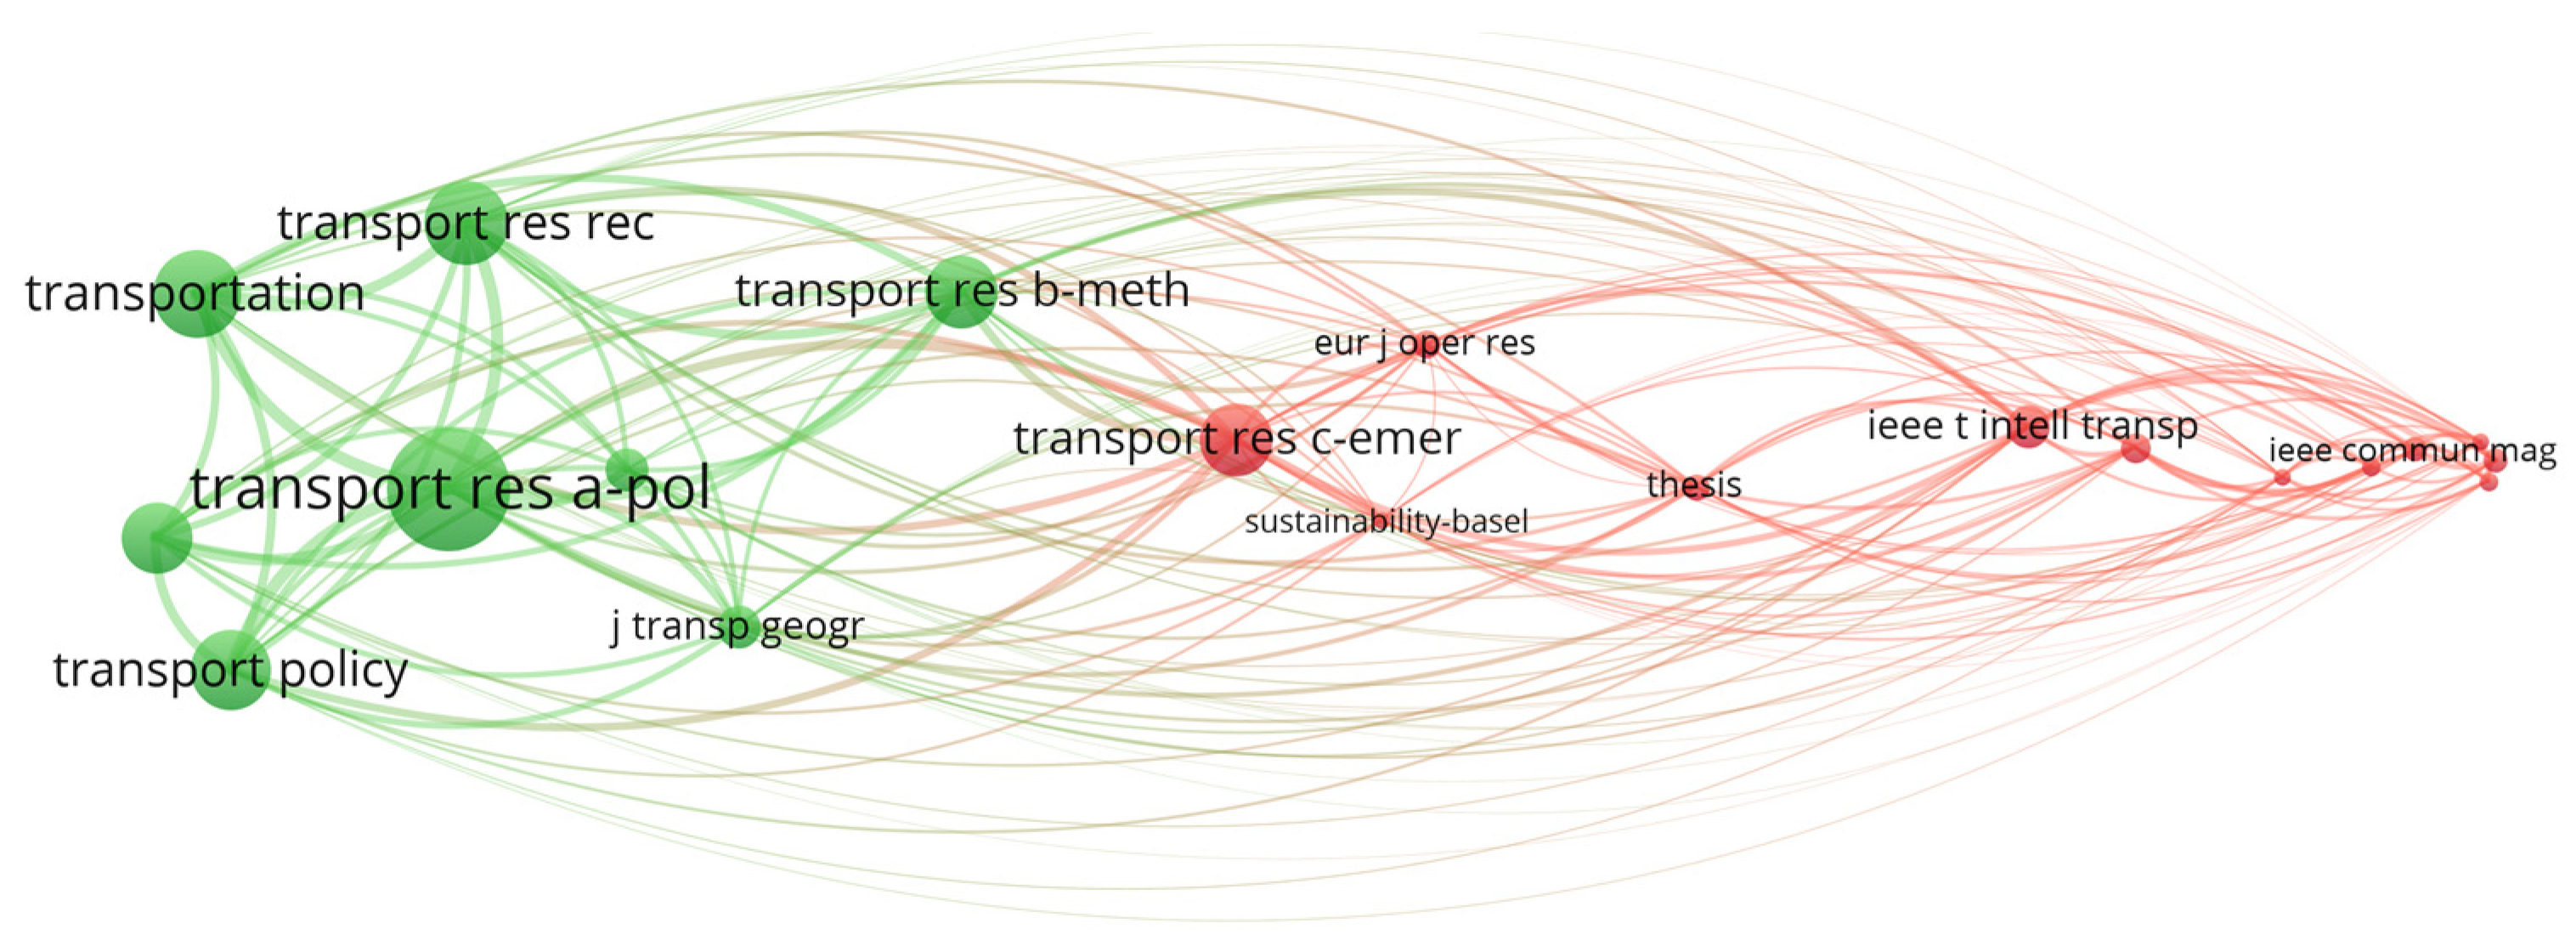
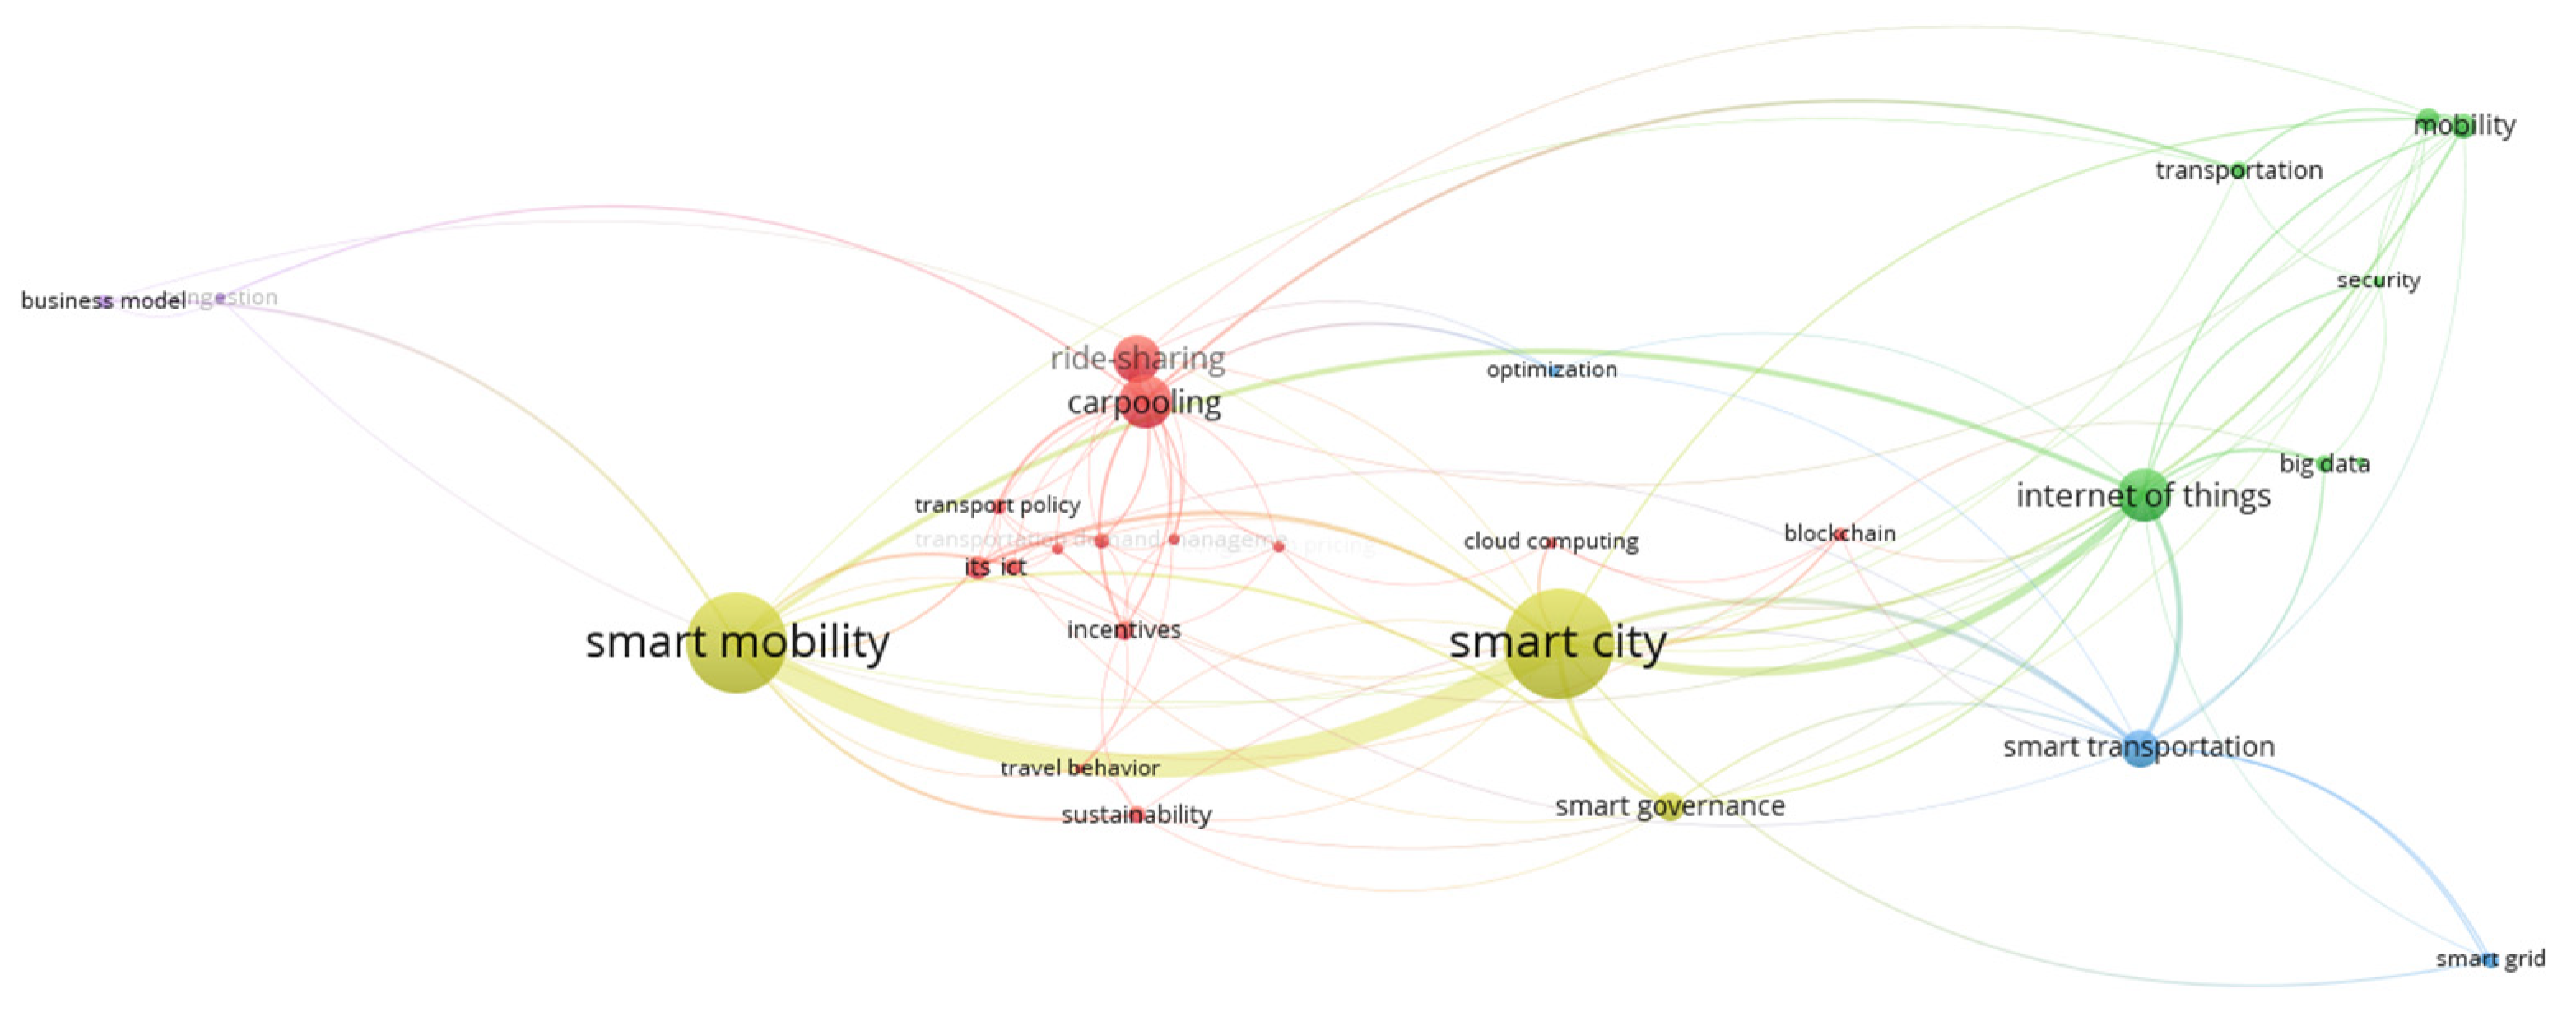
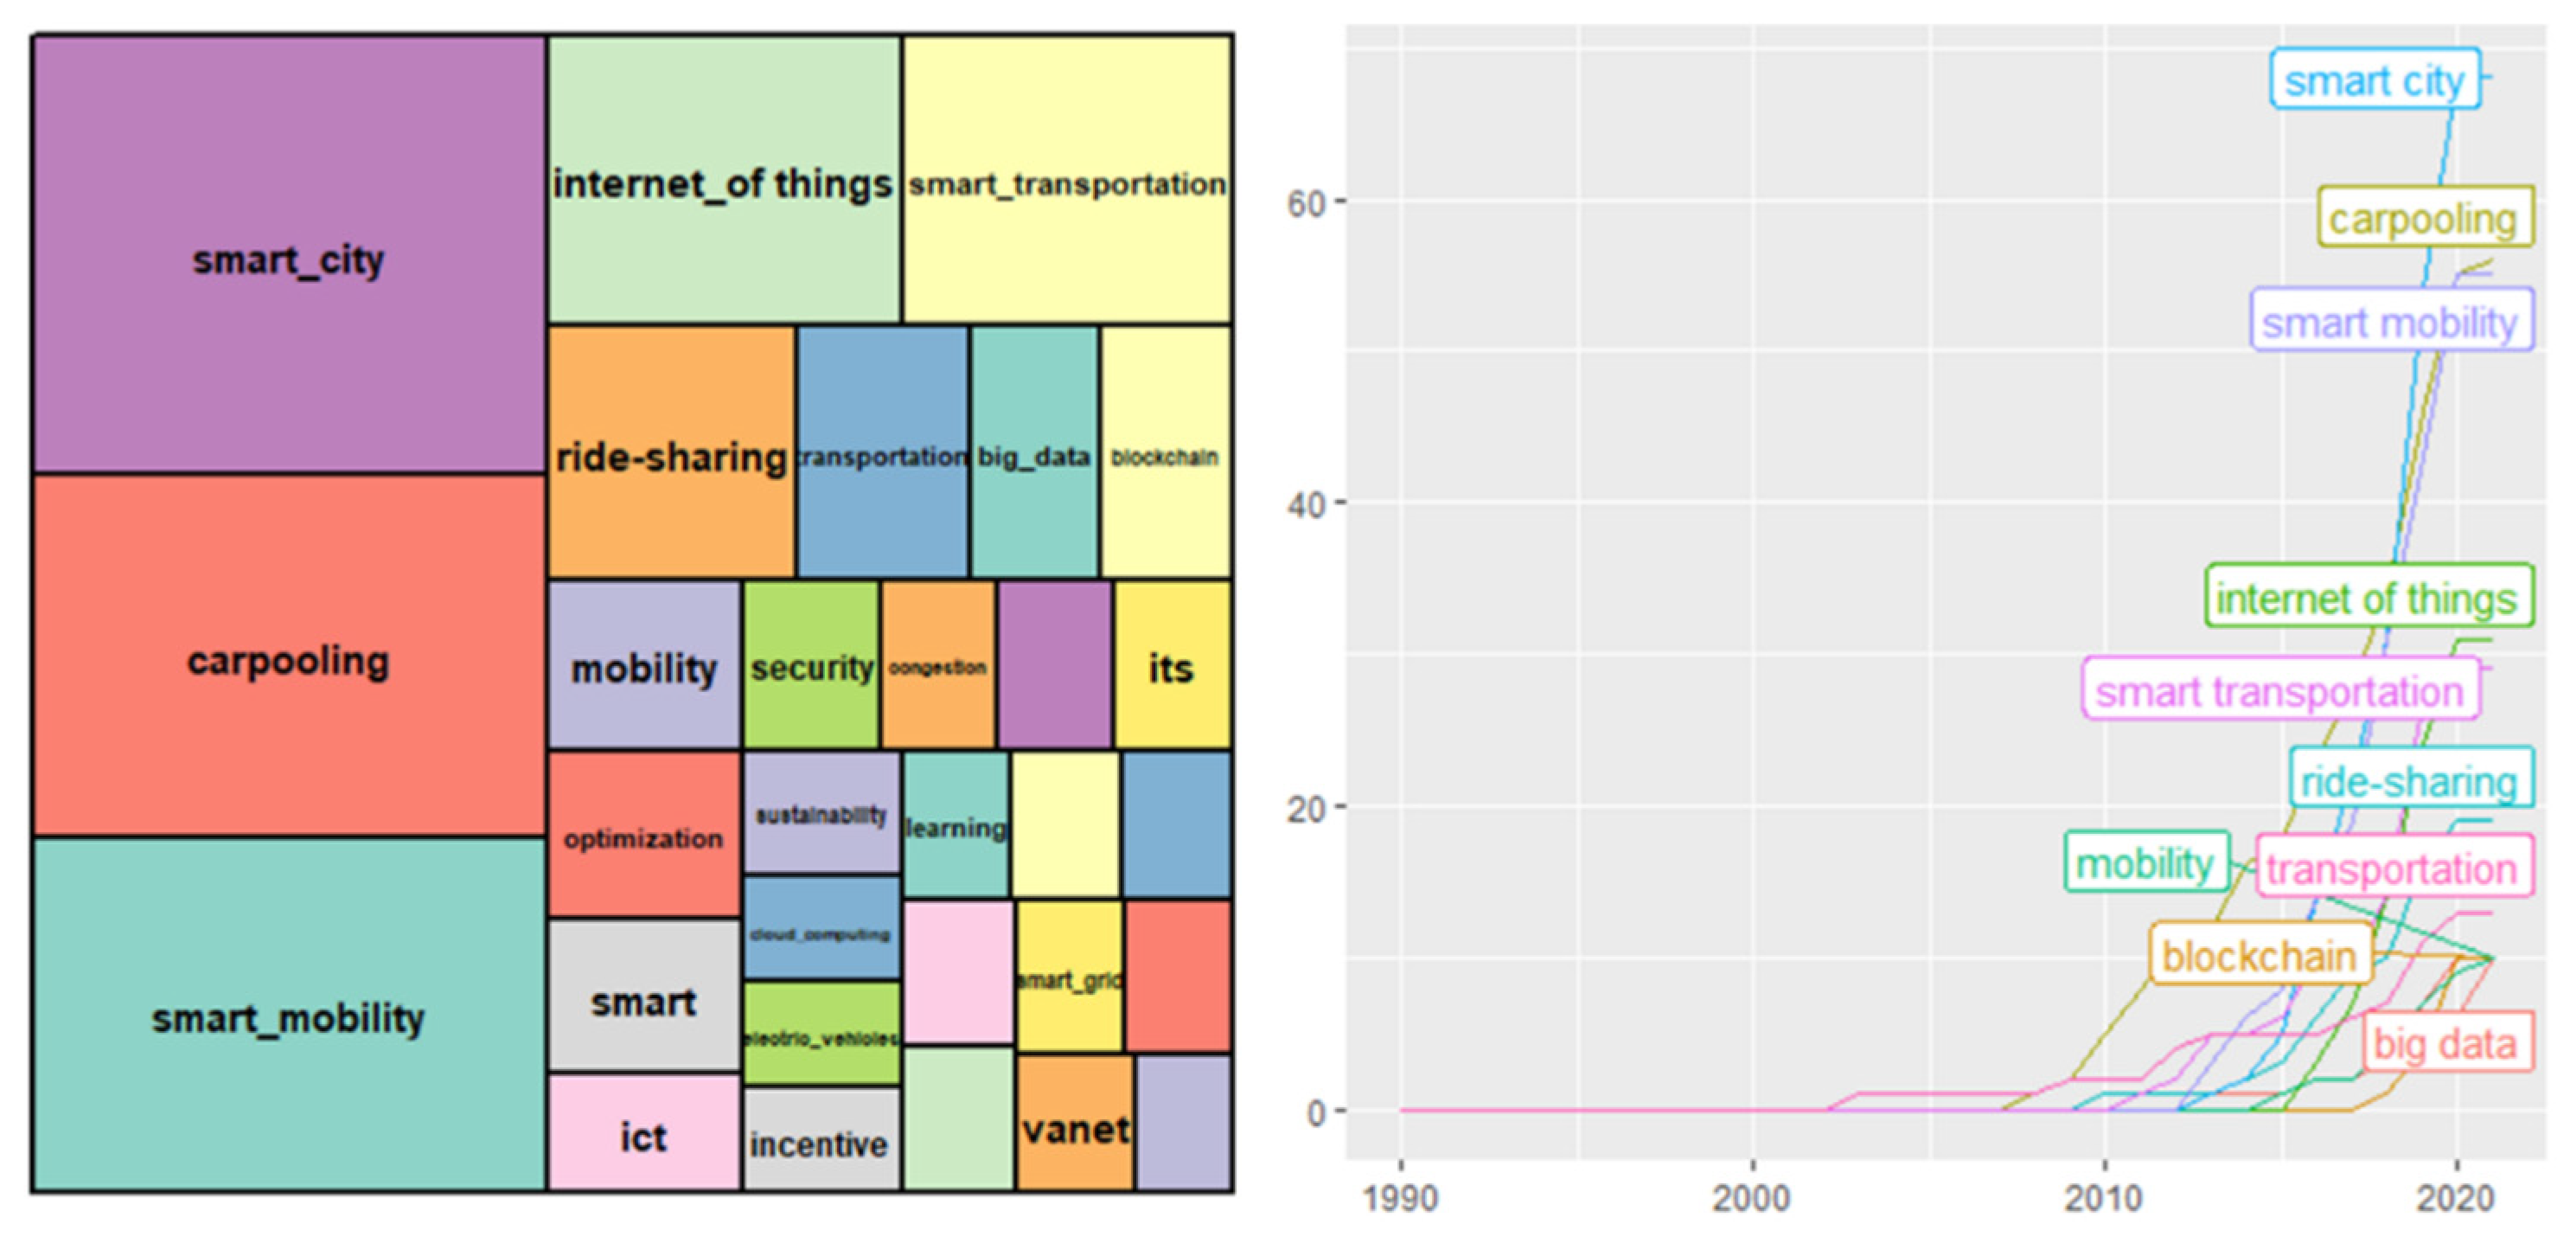
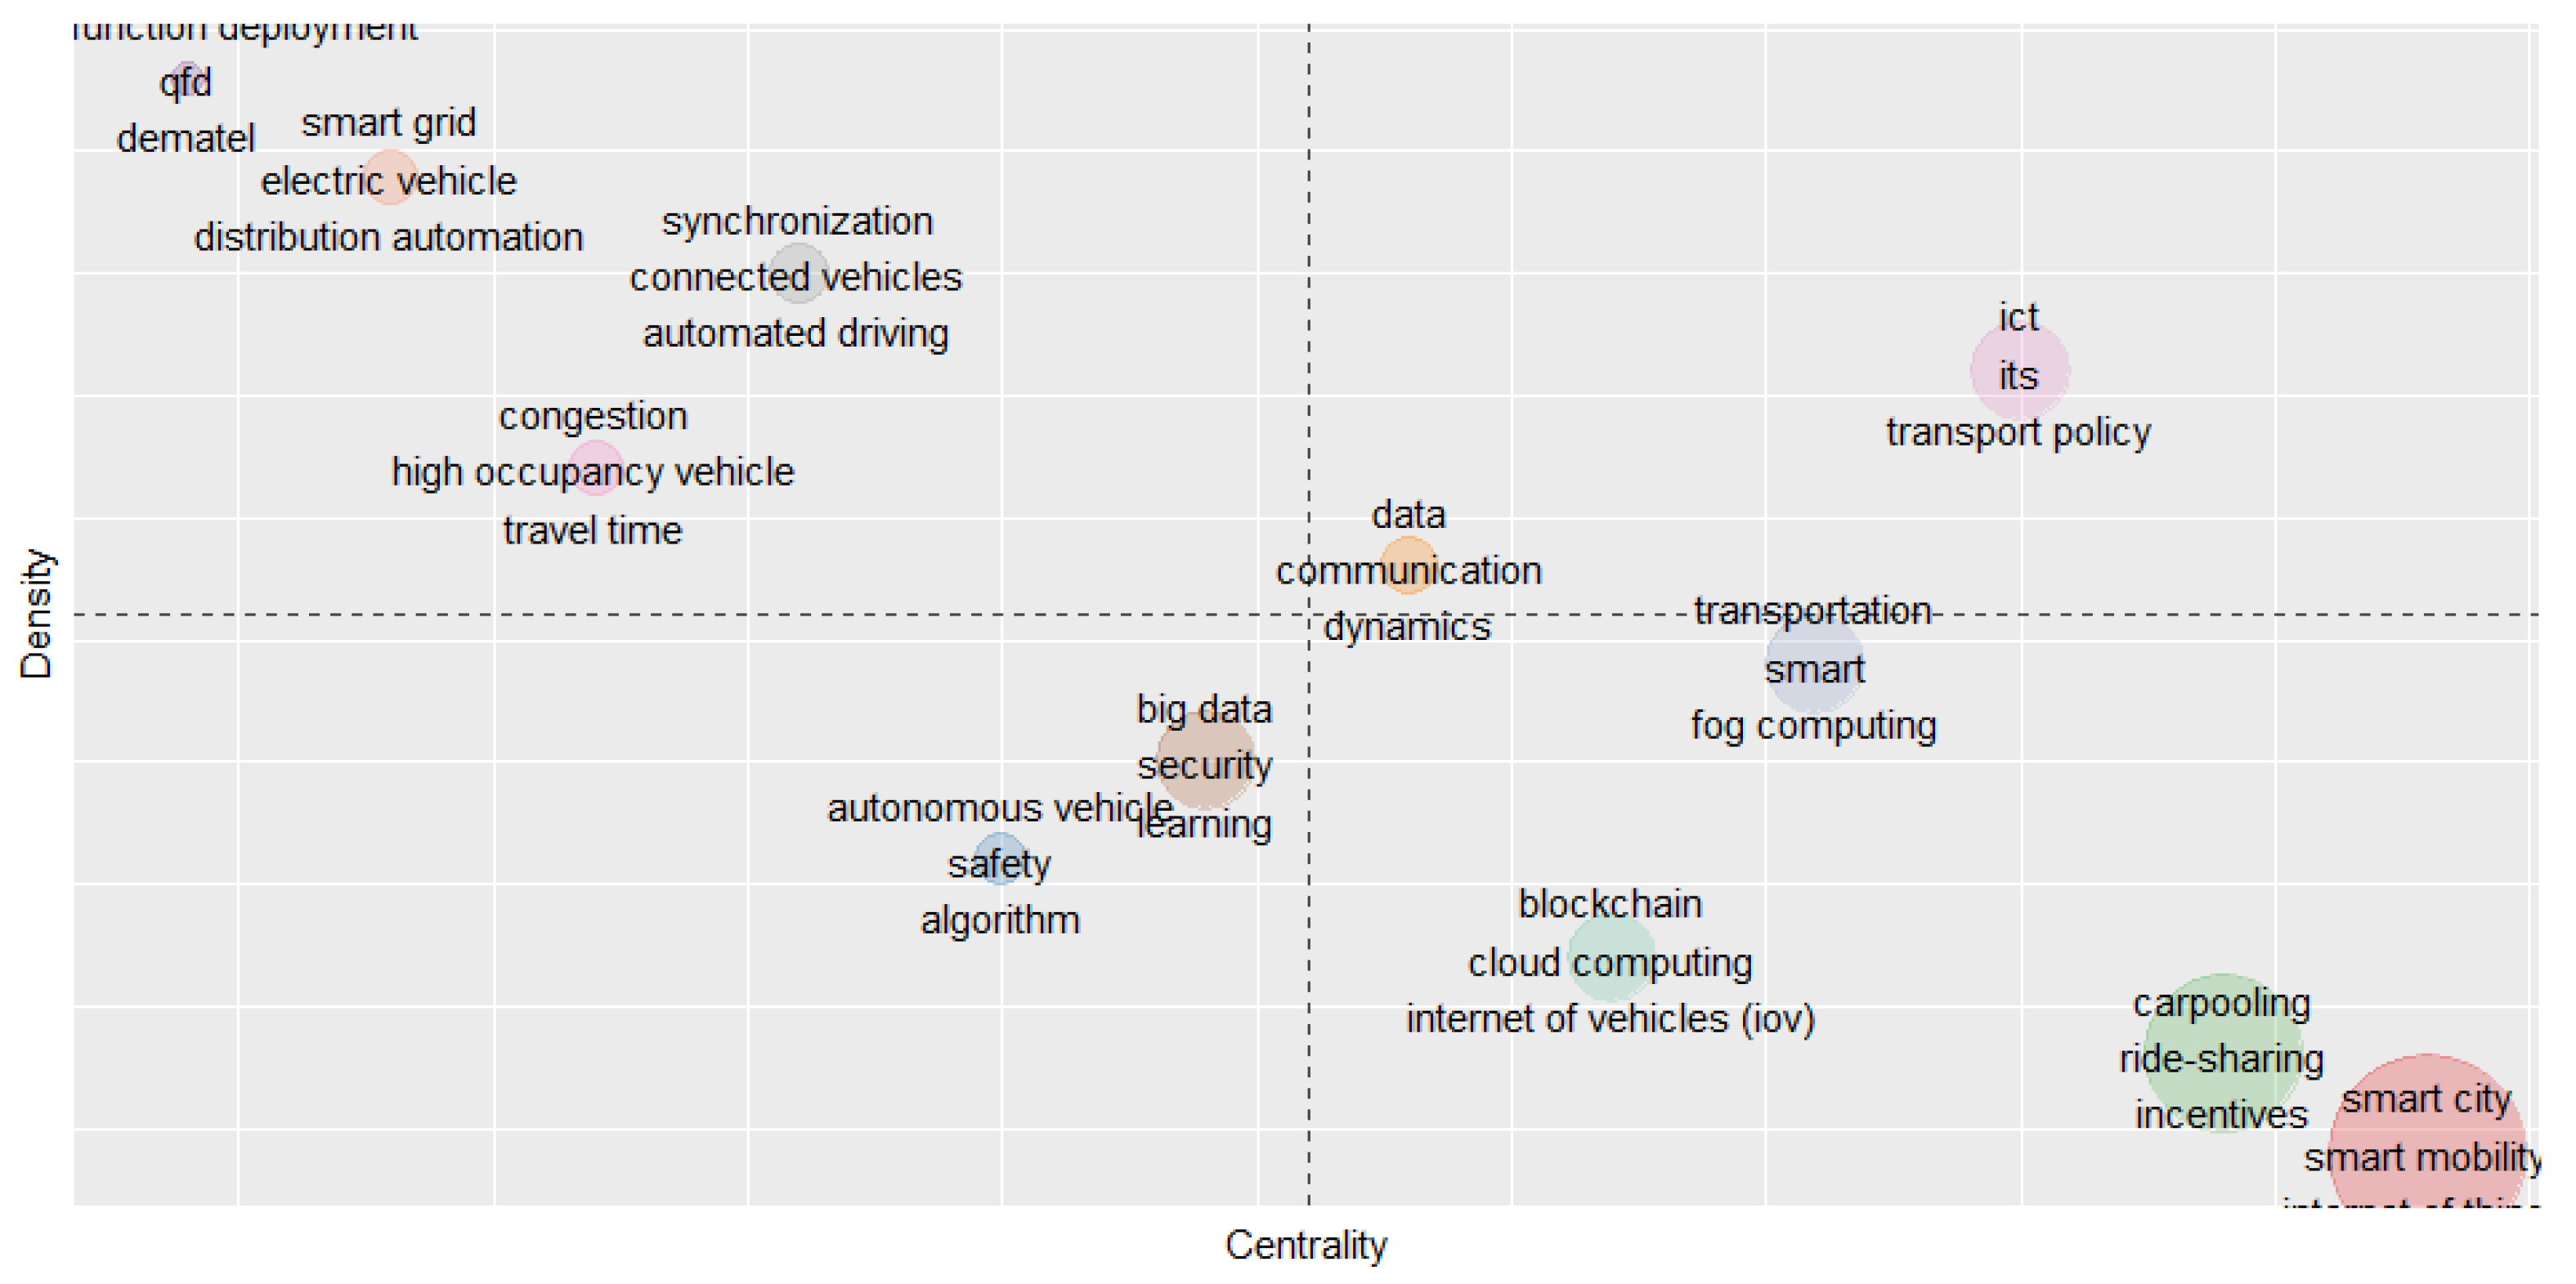
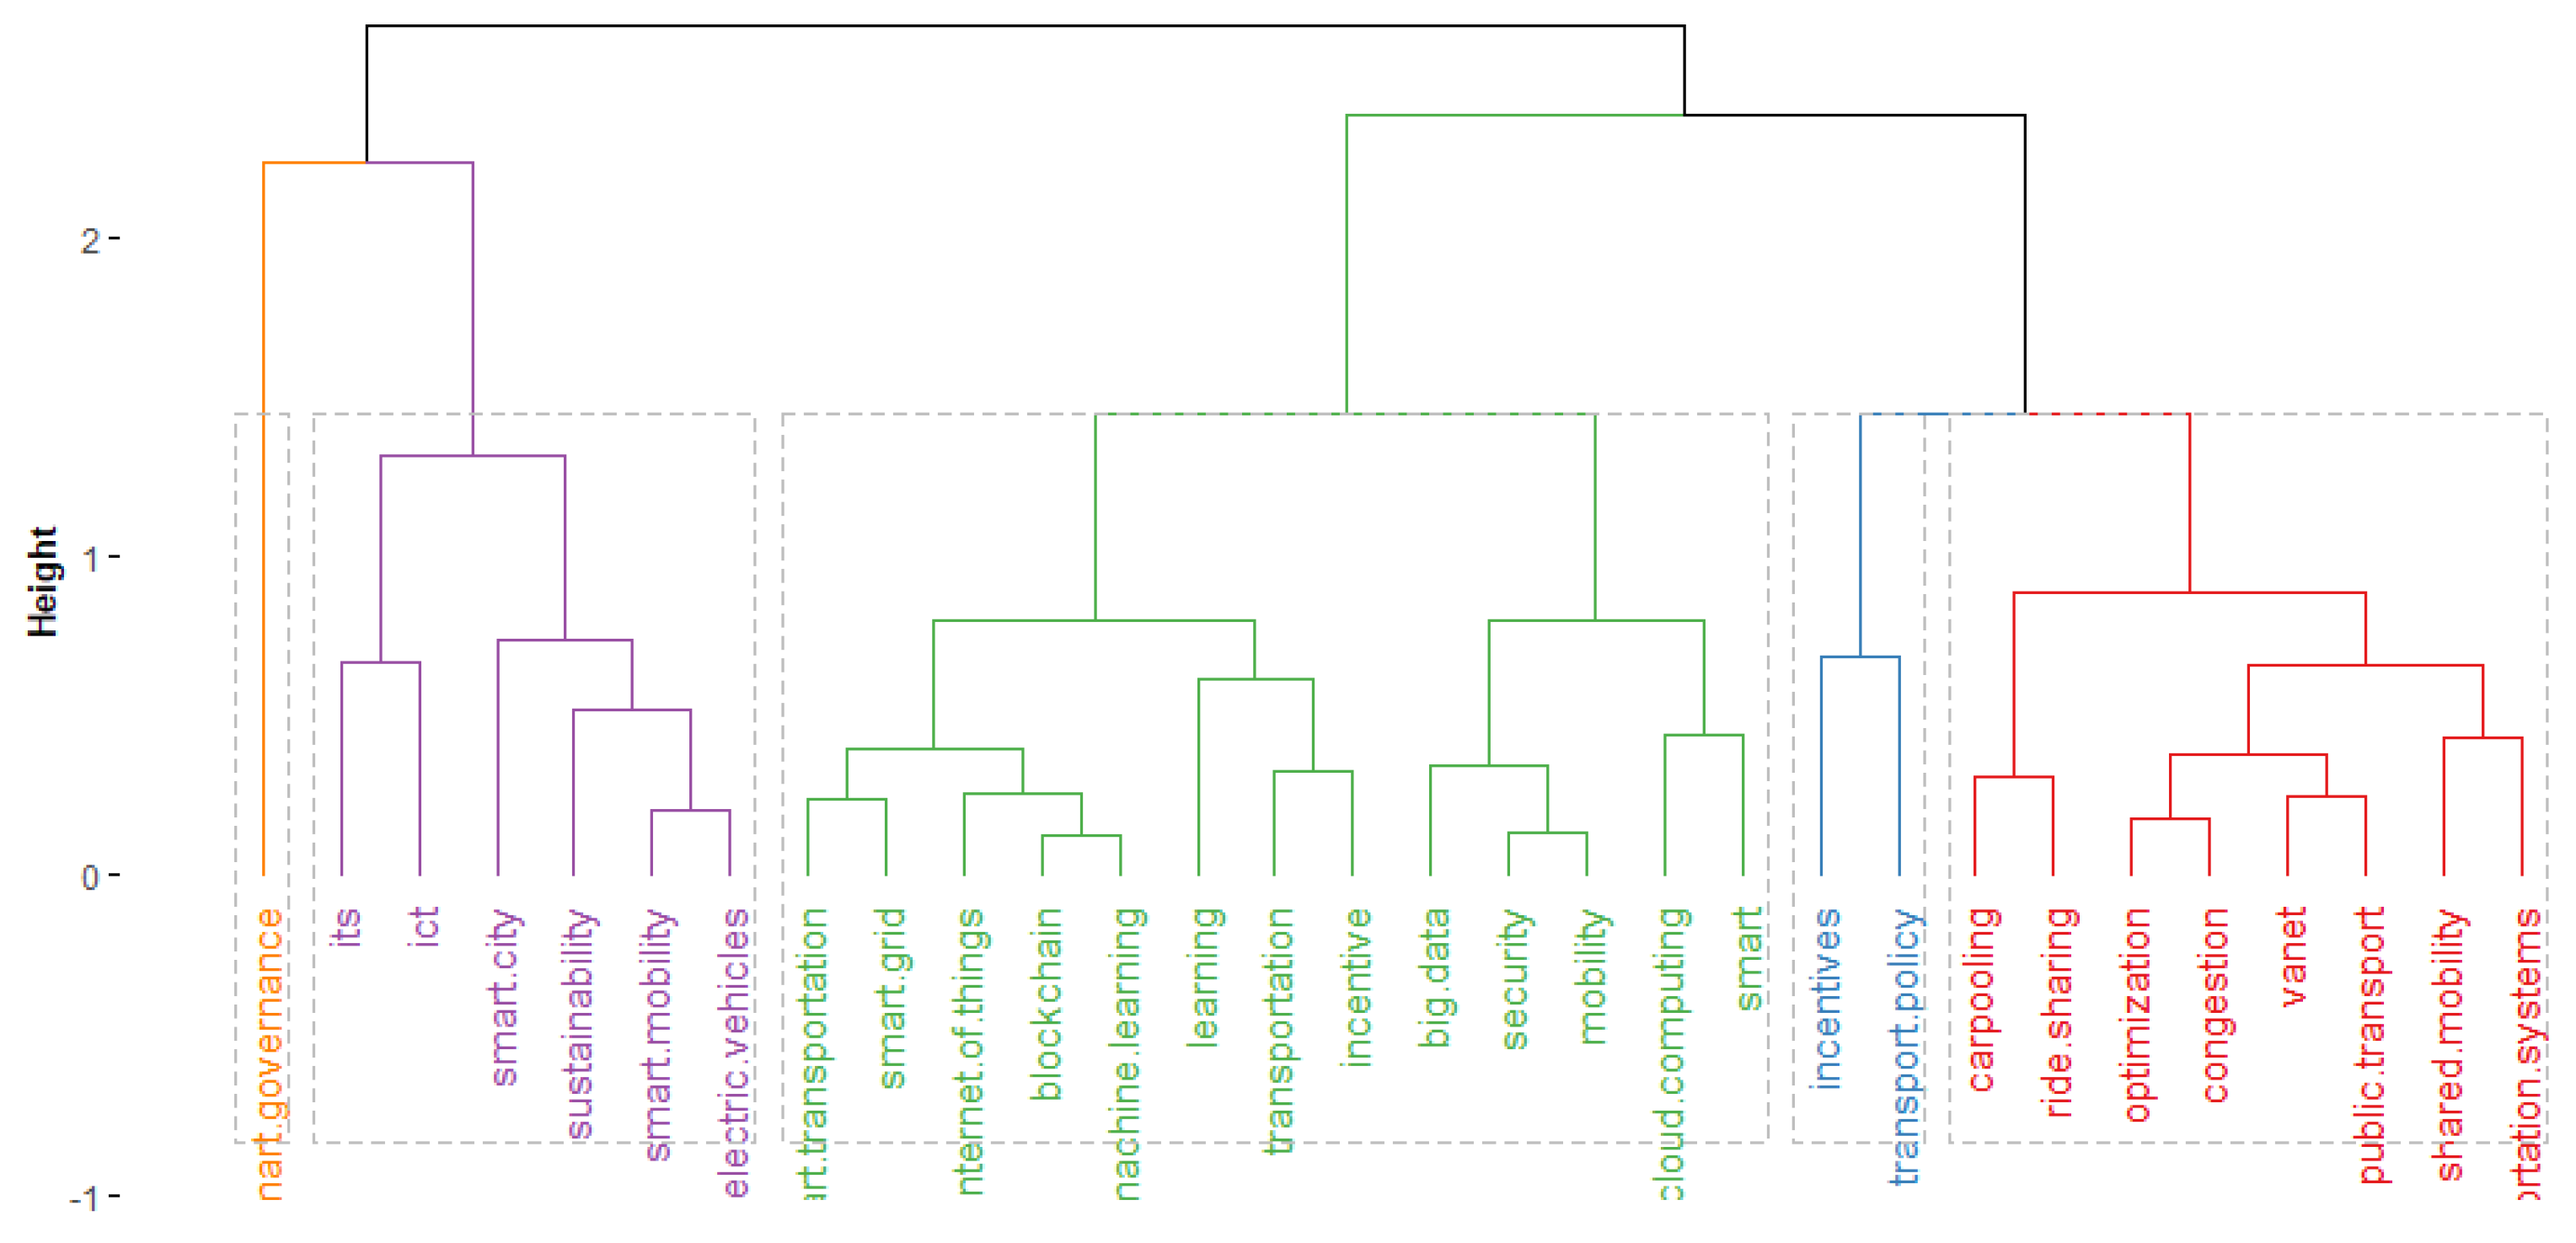
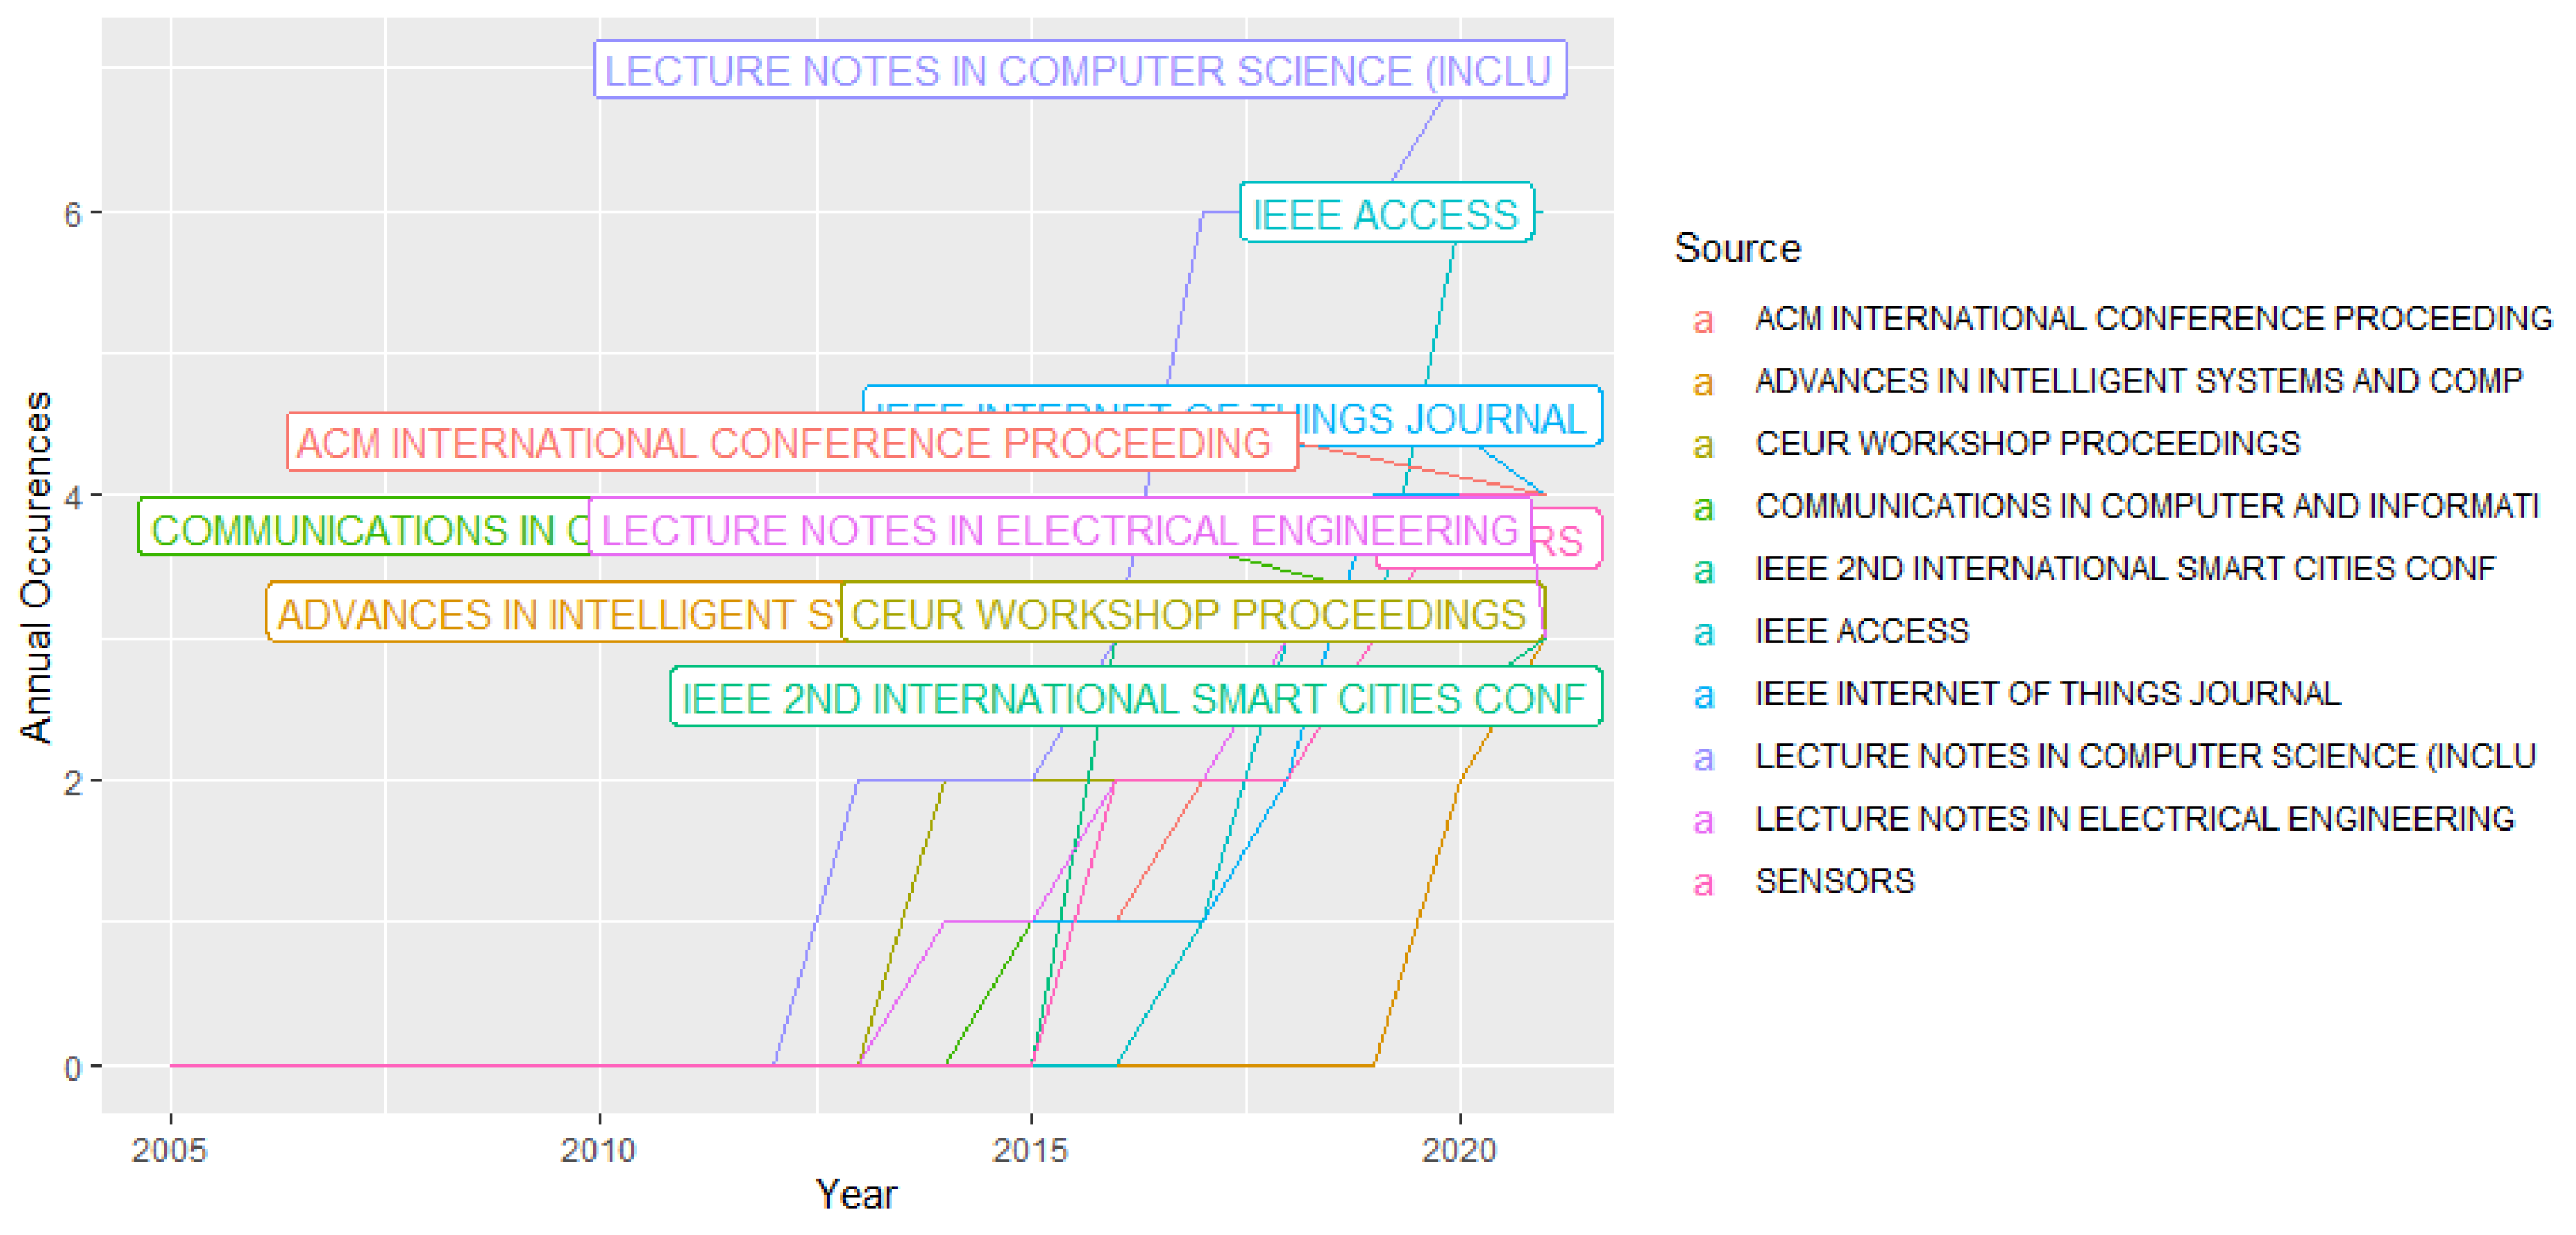
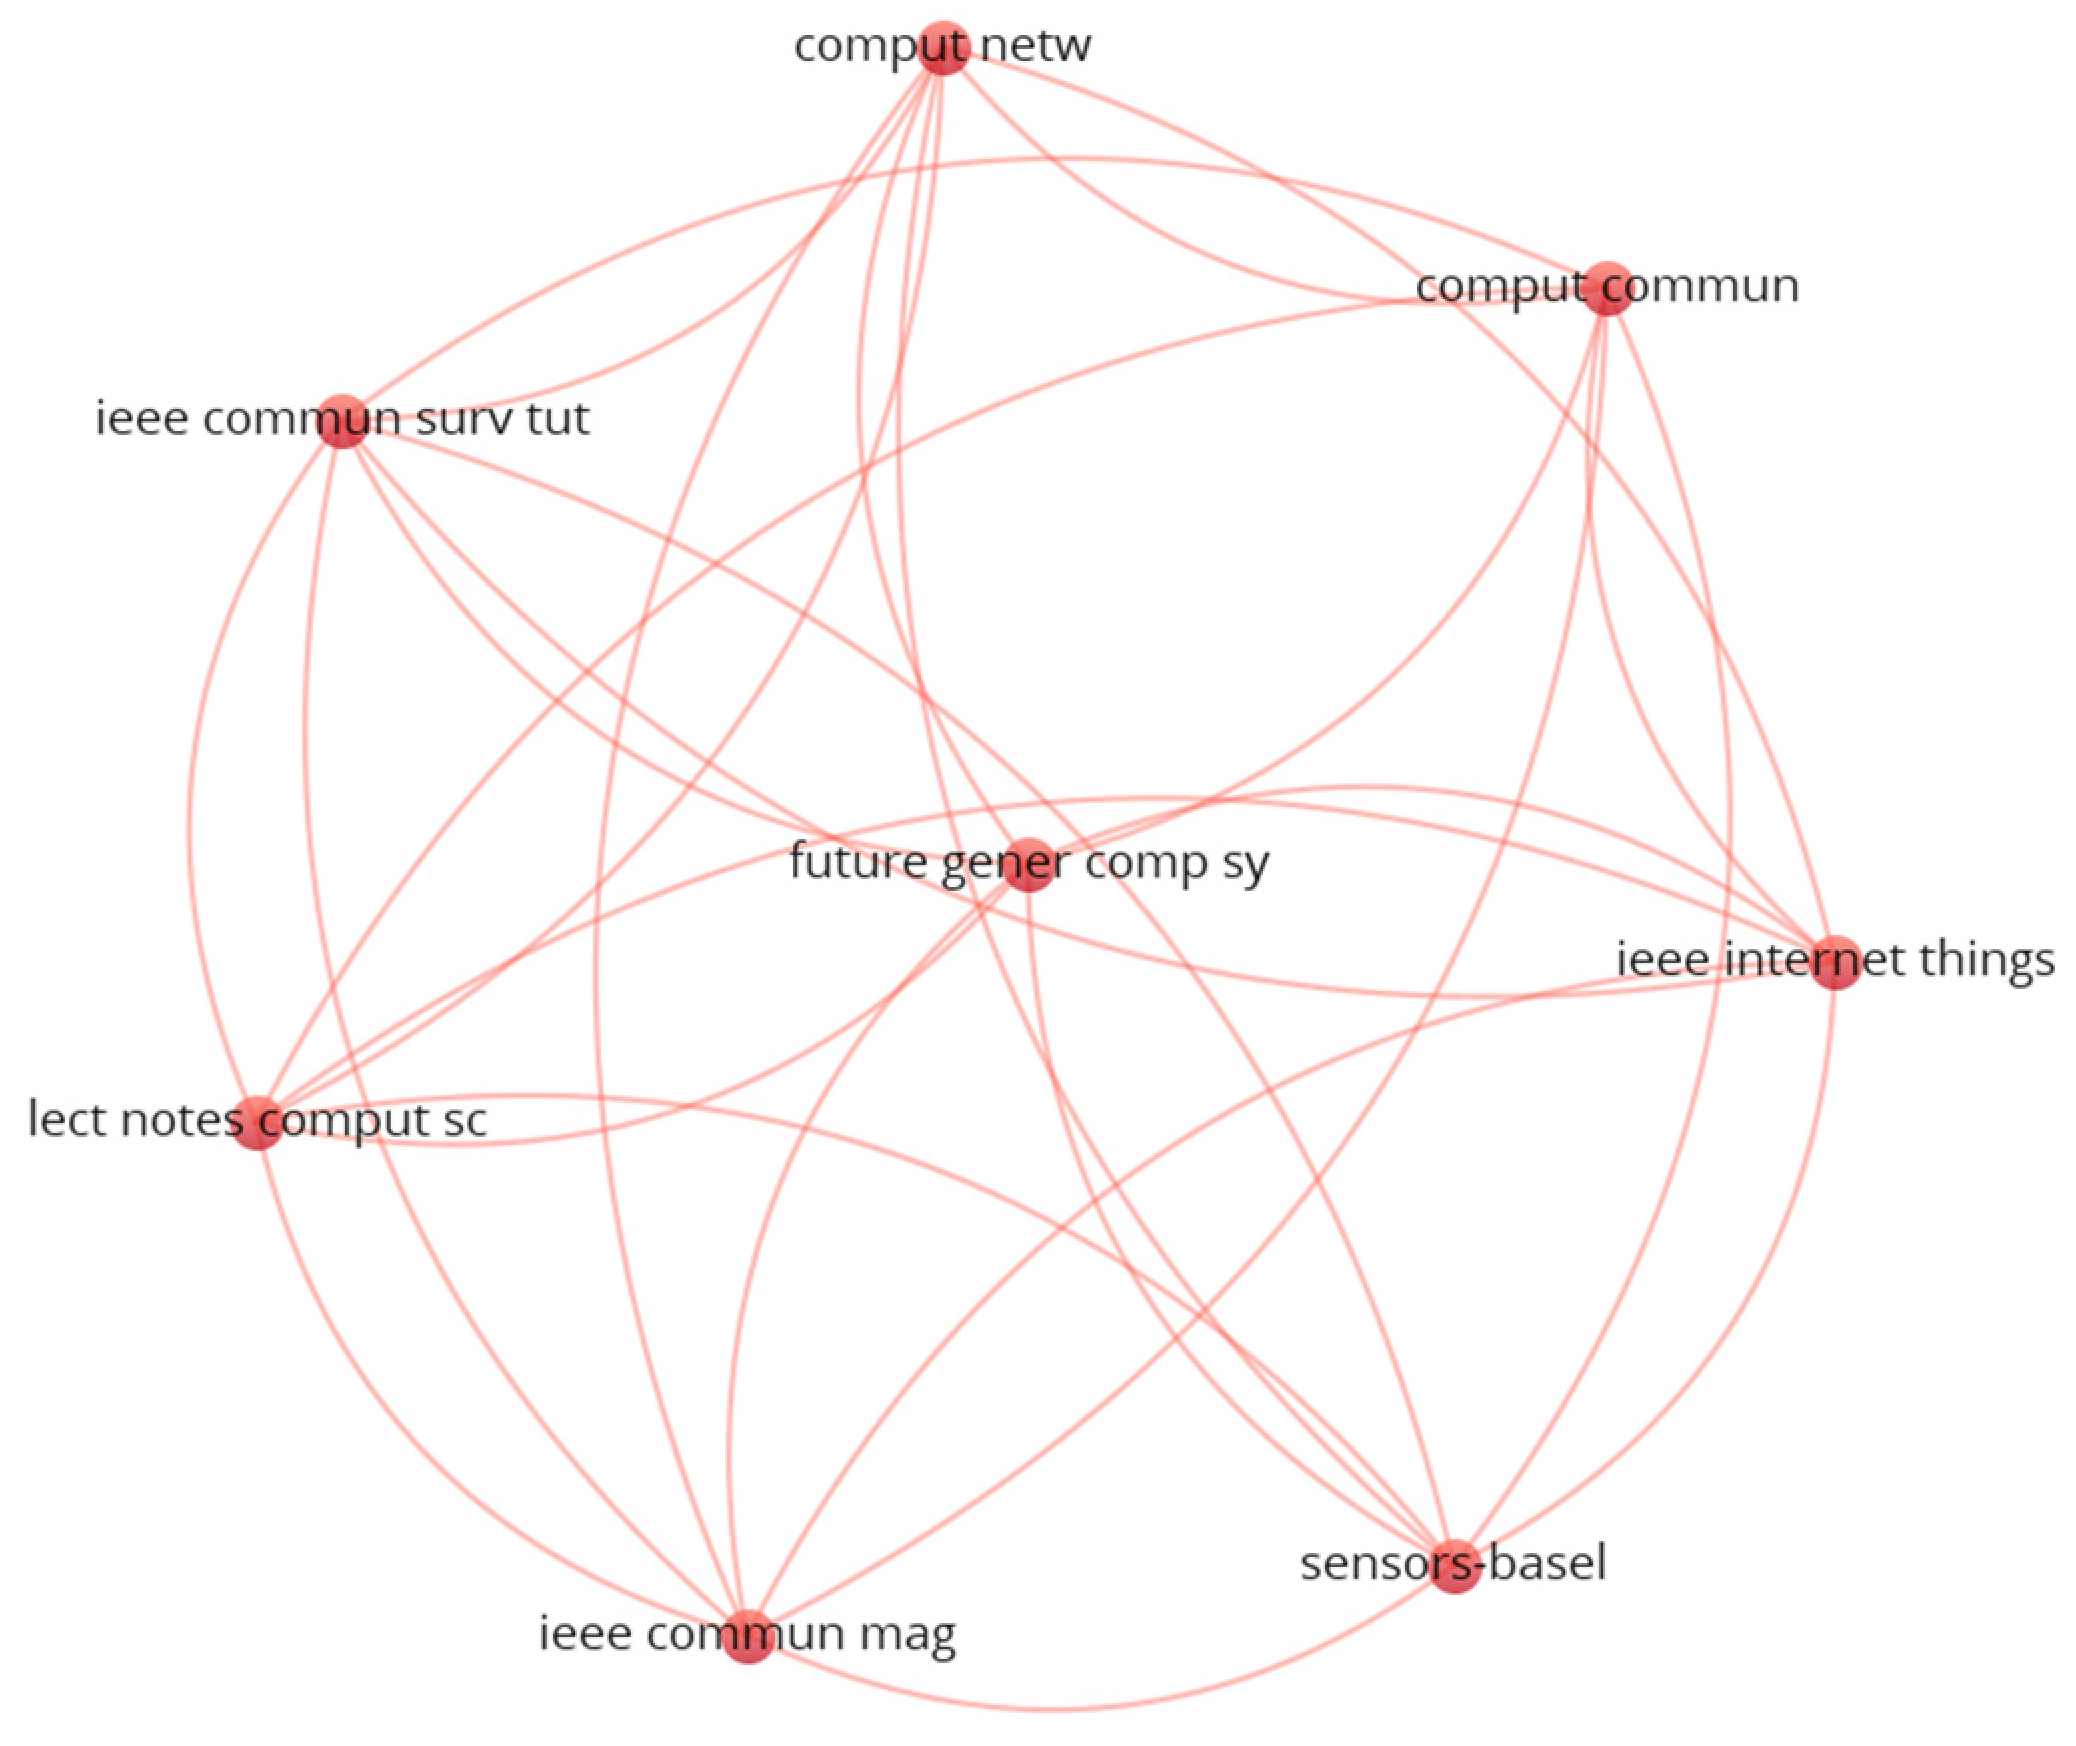
4.1. Bibliometric Analysis
4.1.1. Literature Collection #1
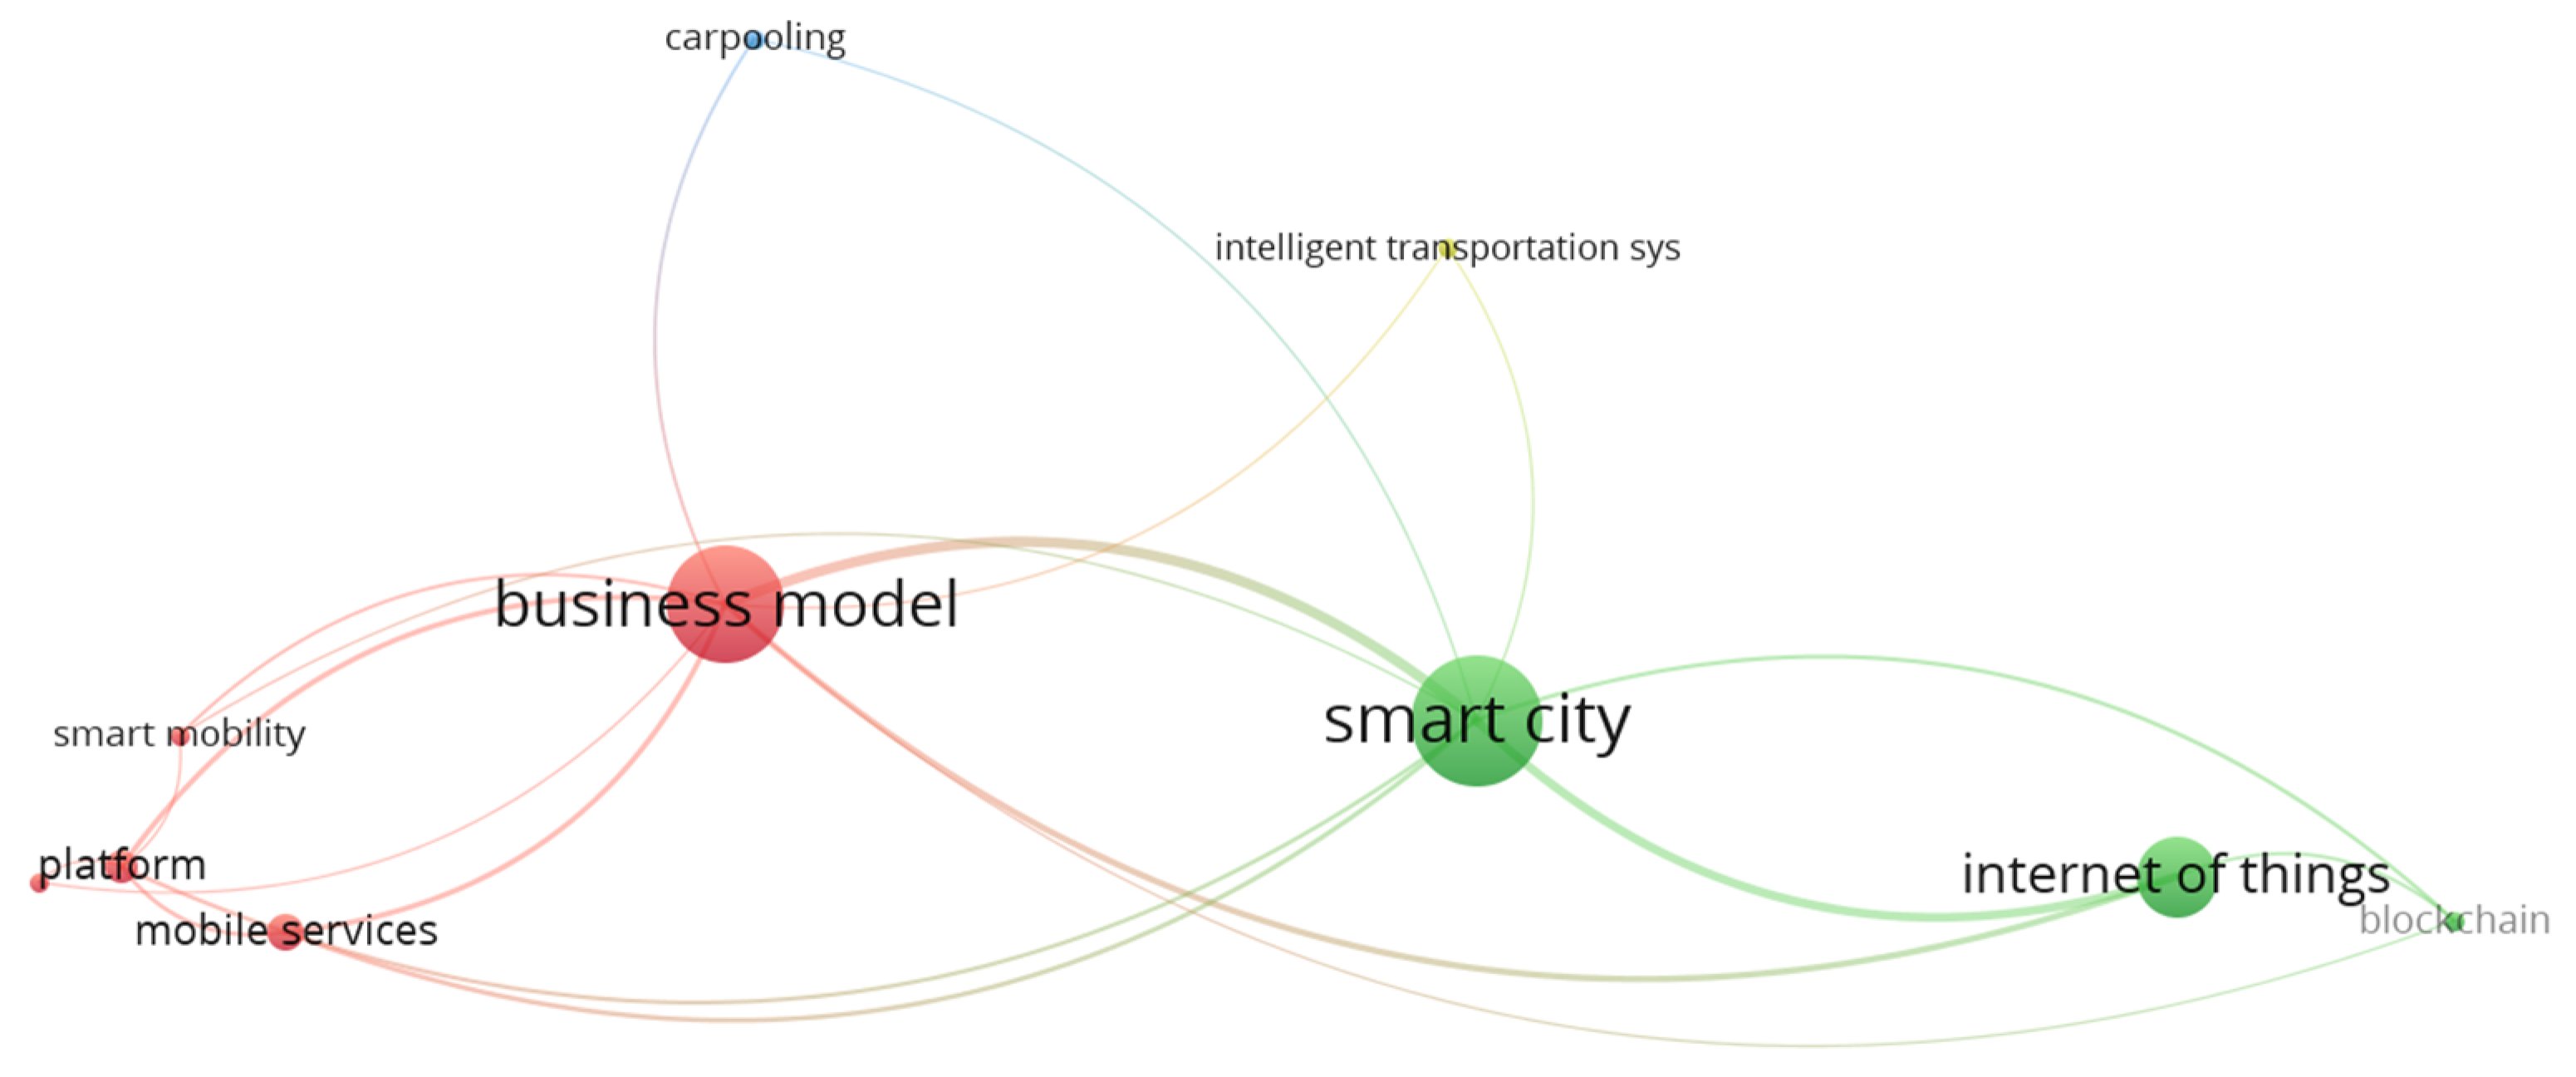
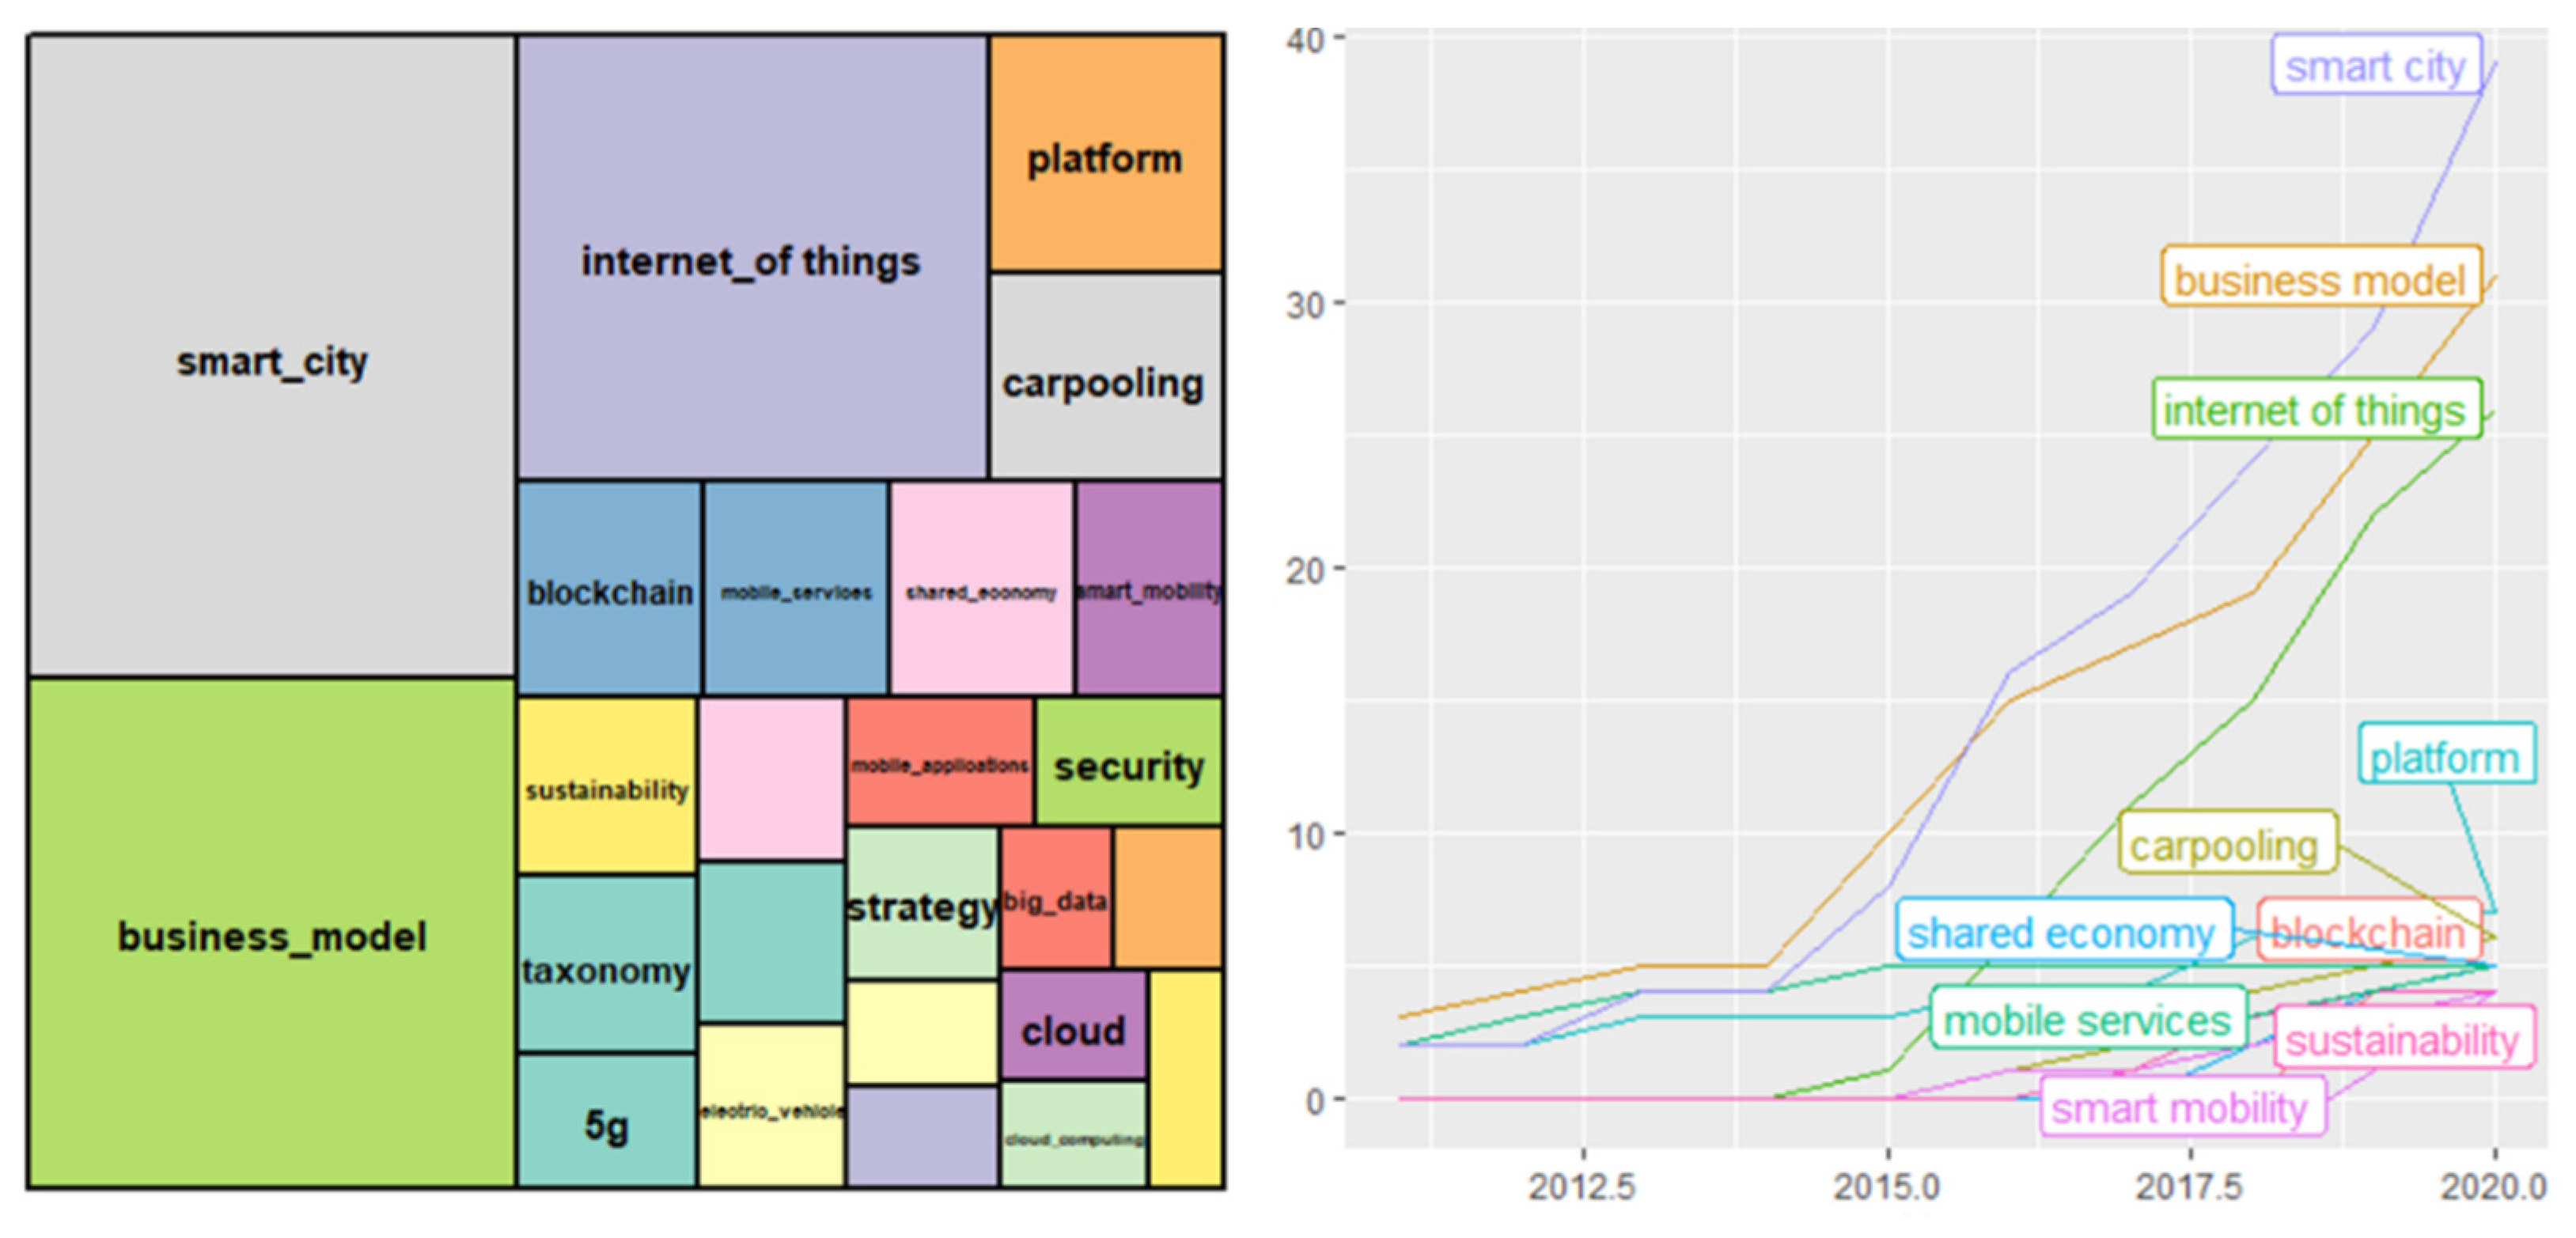
4.1.2. Literature Collection #2
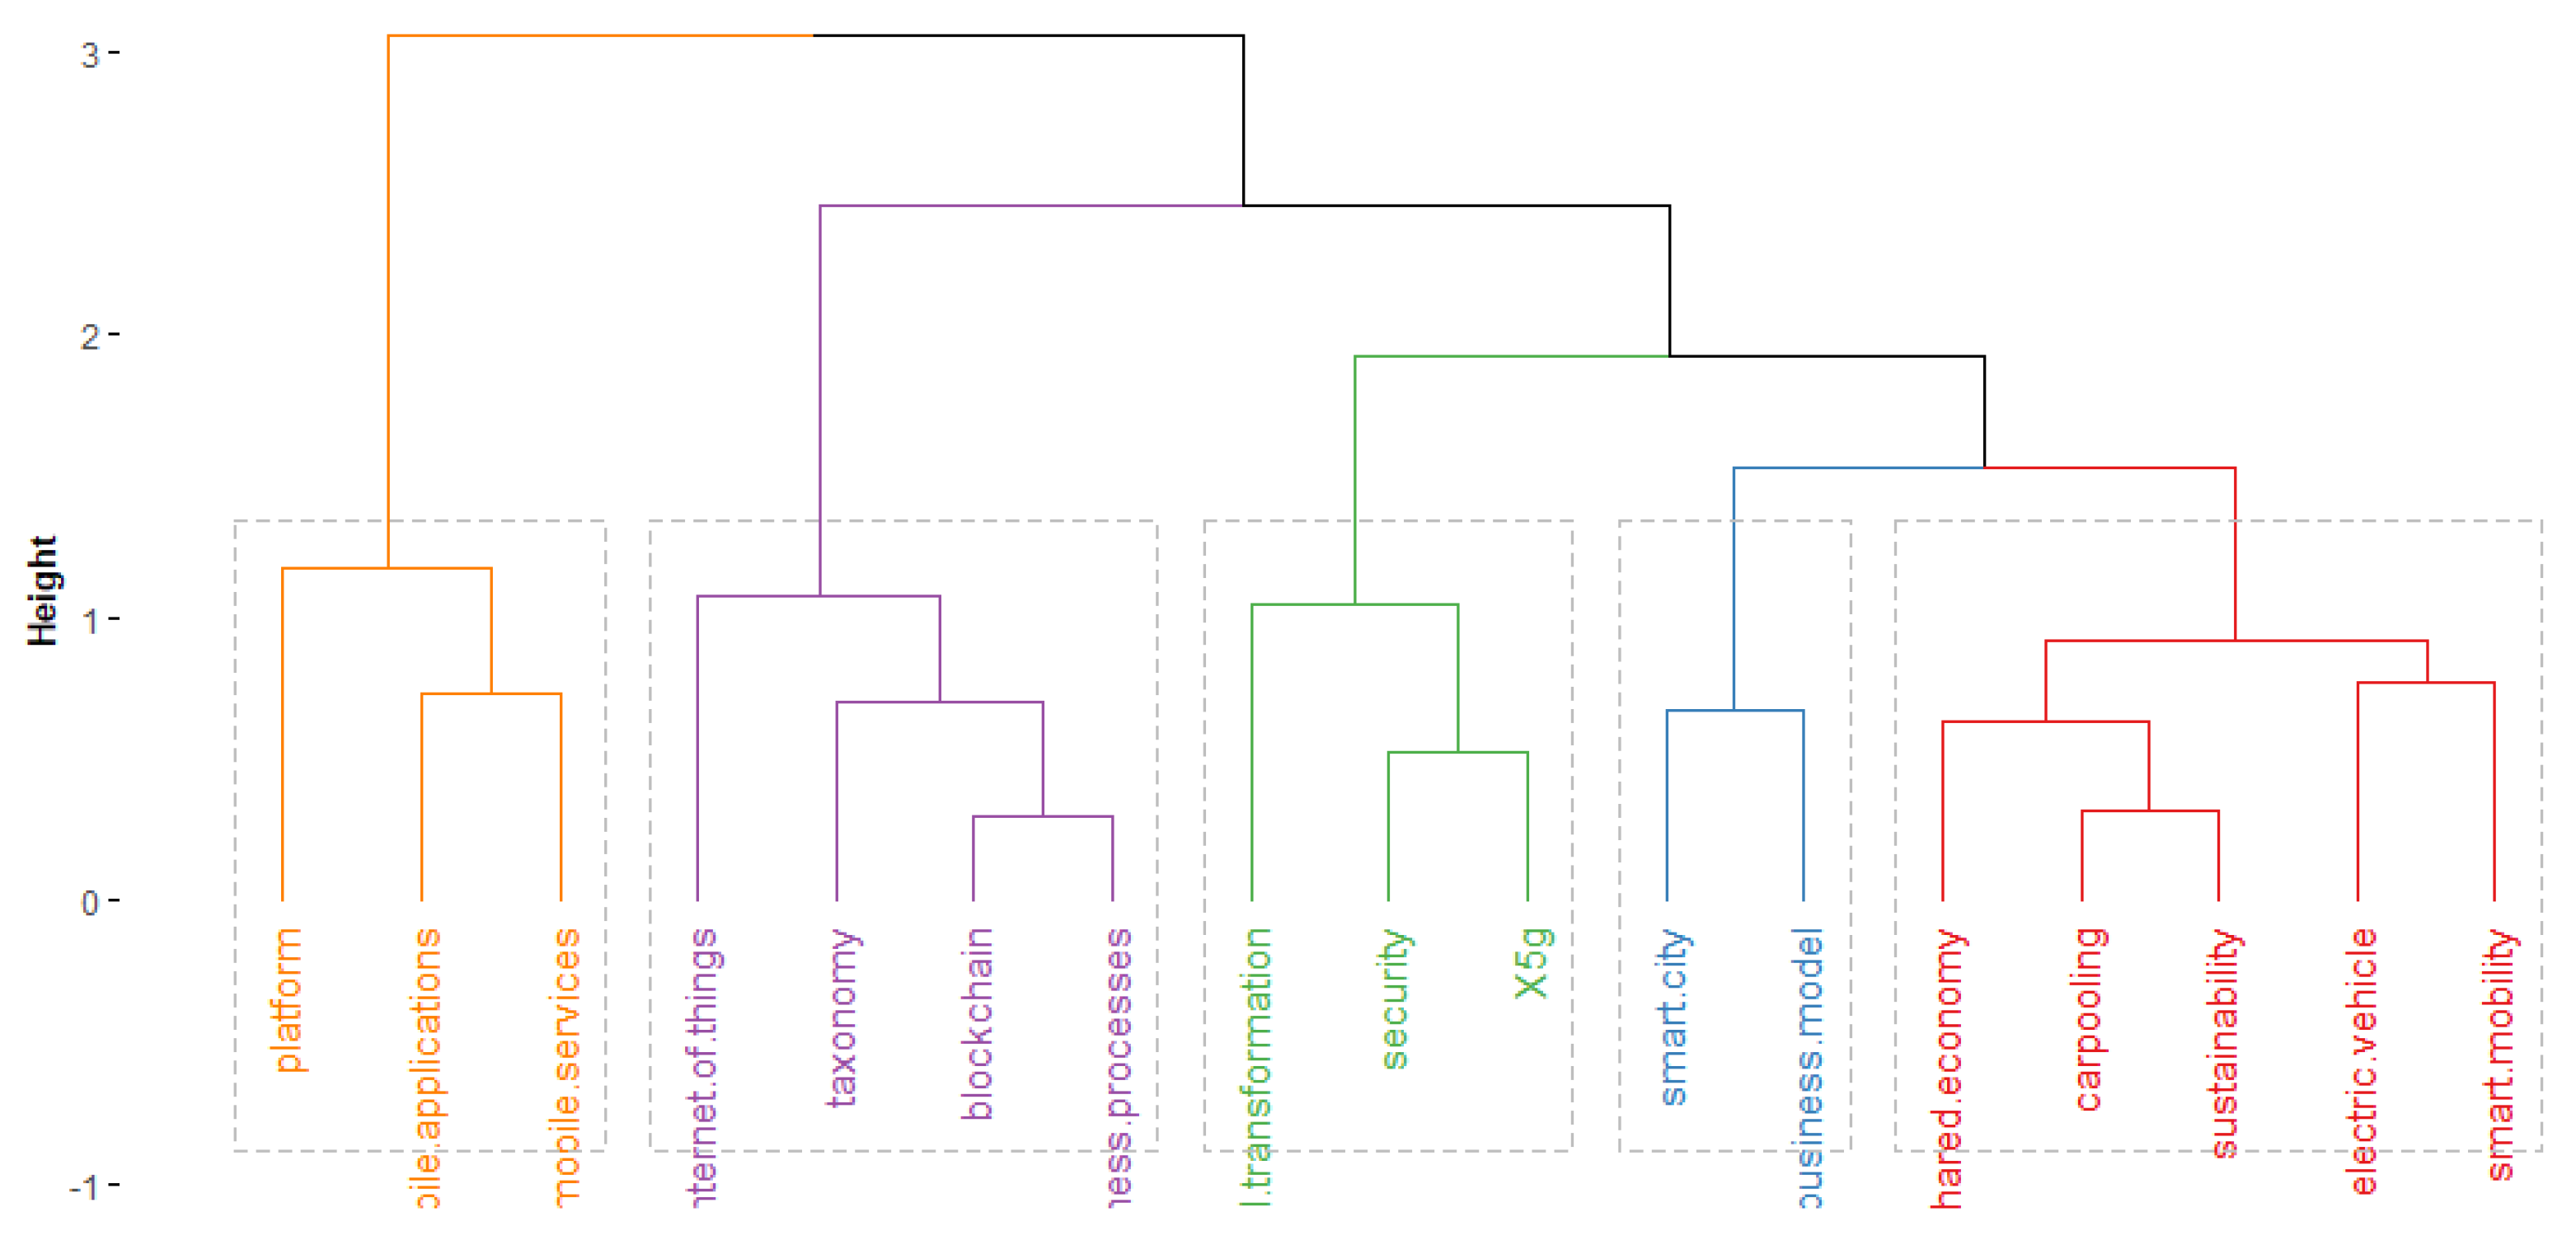
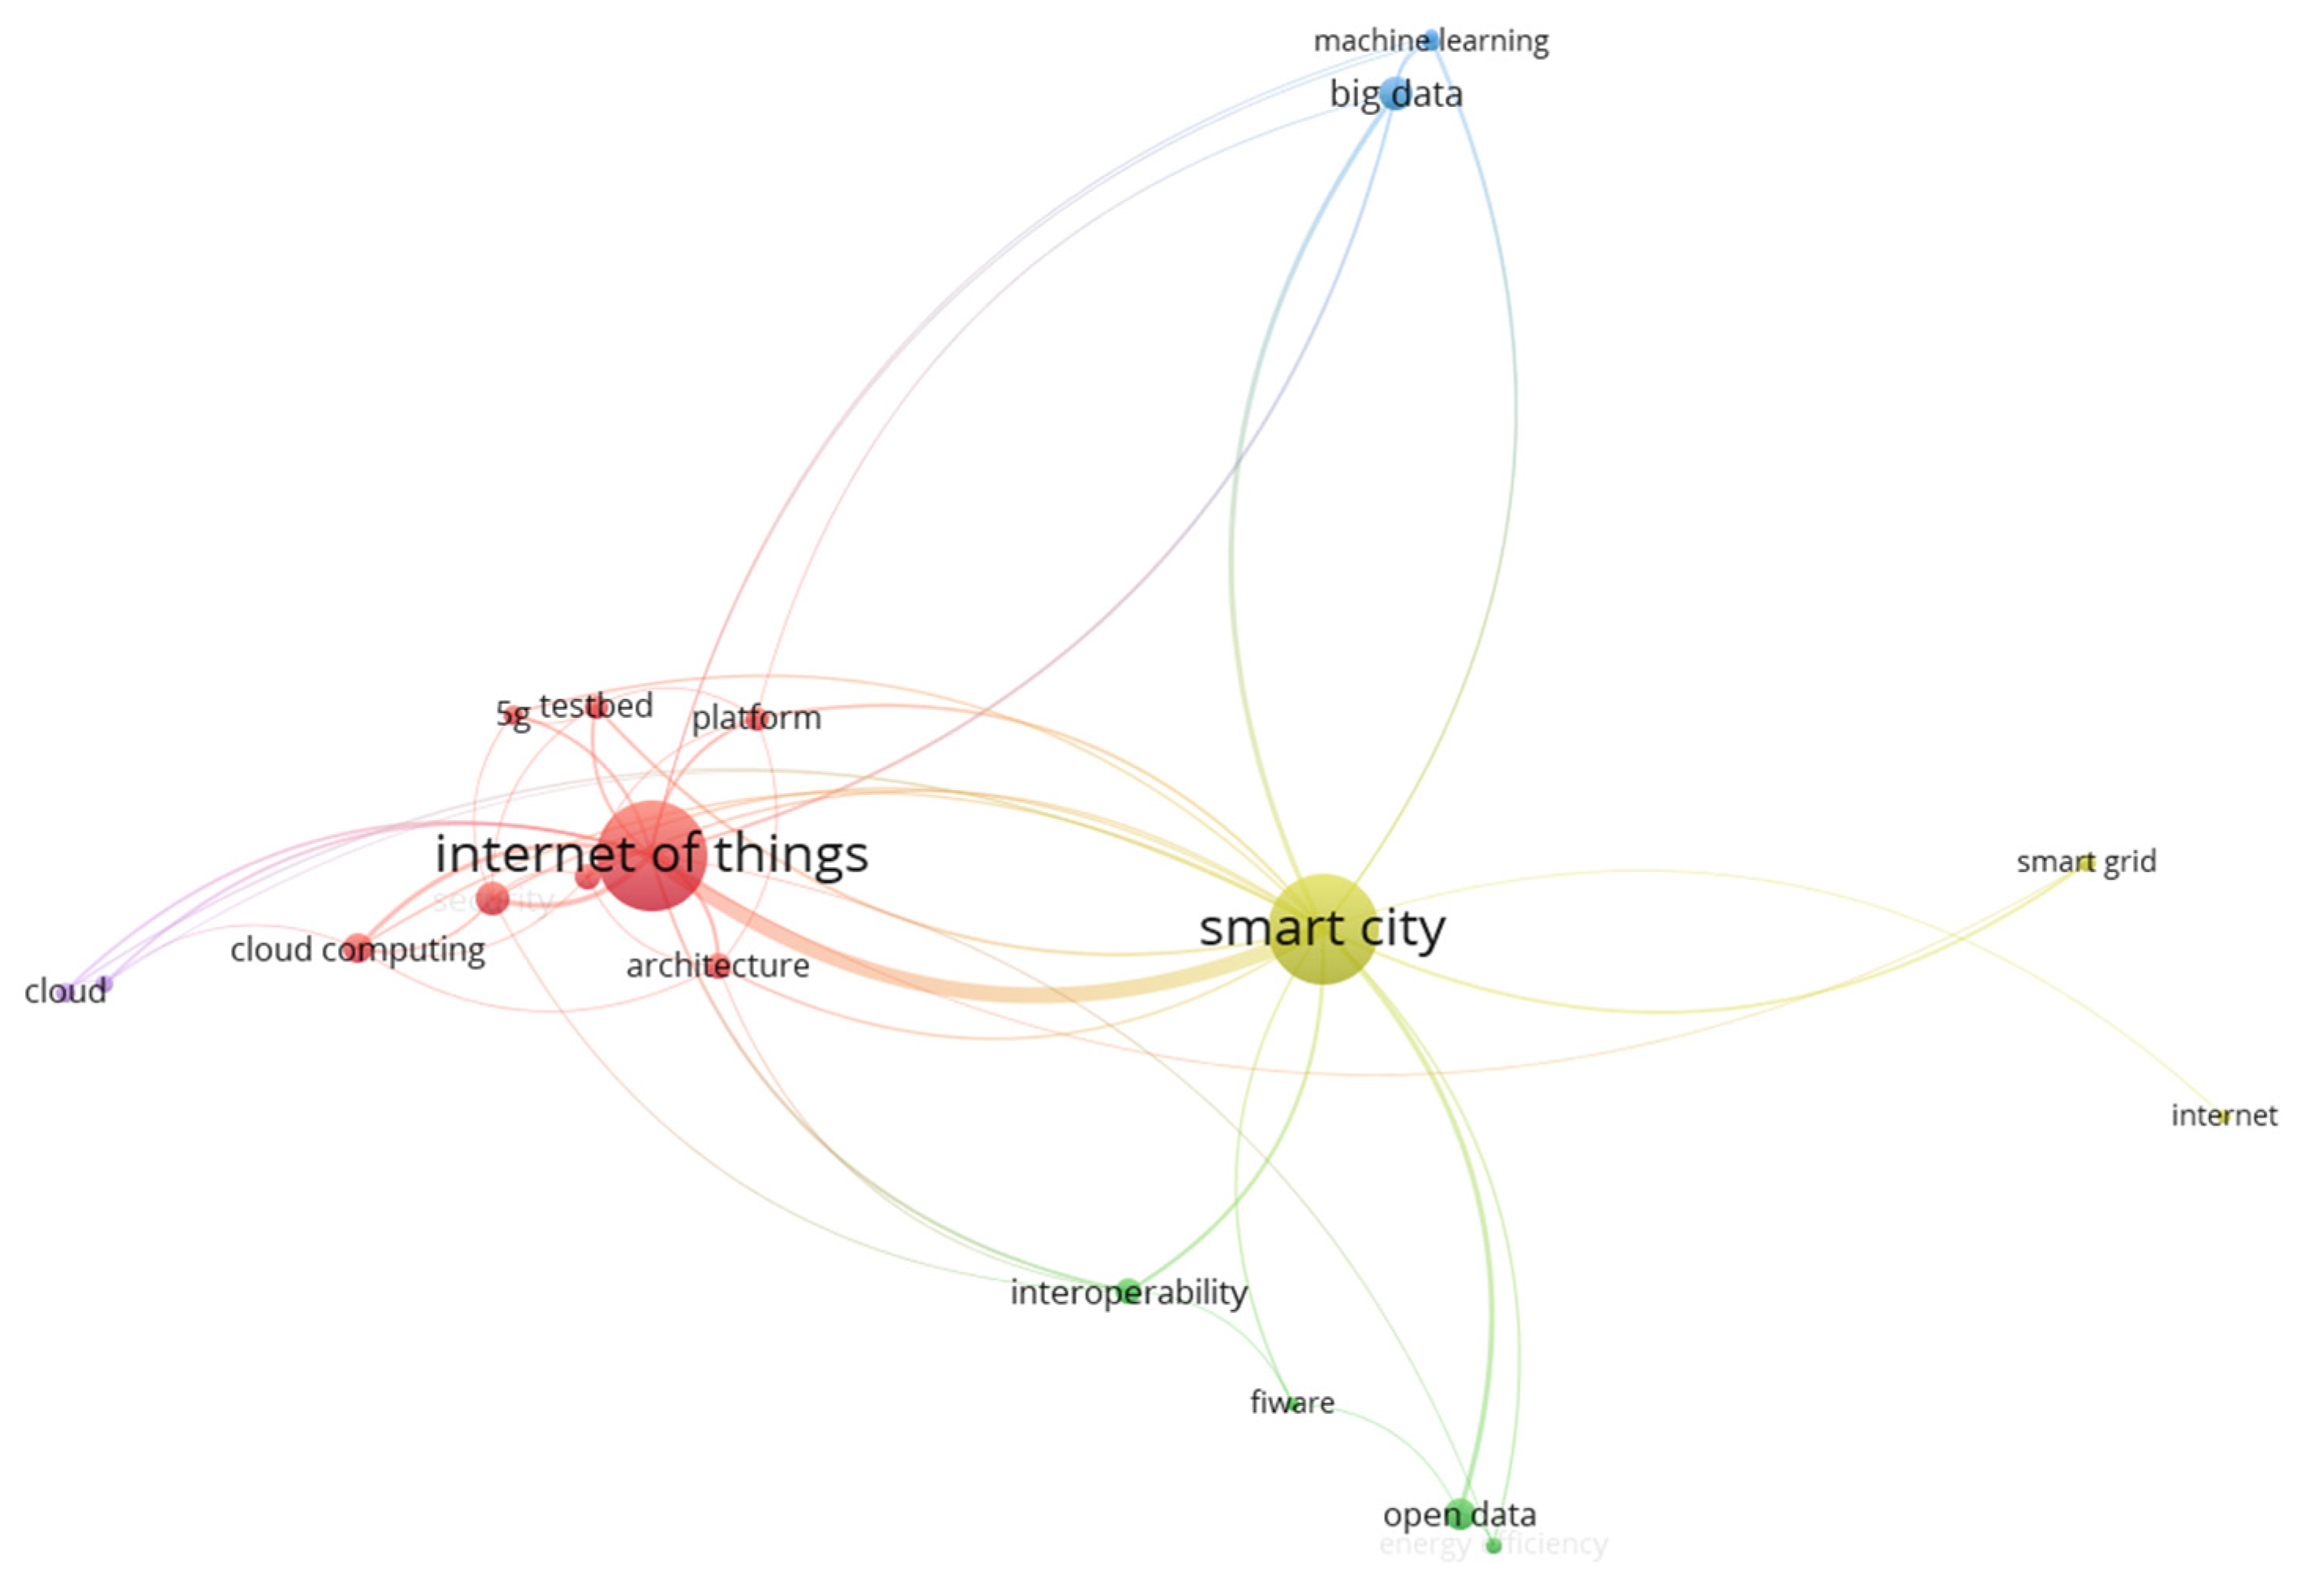
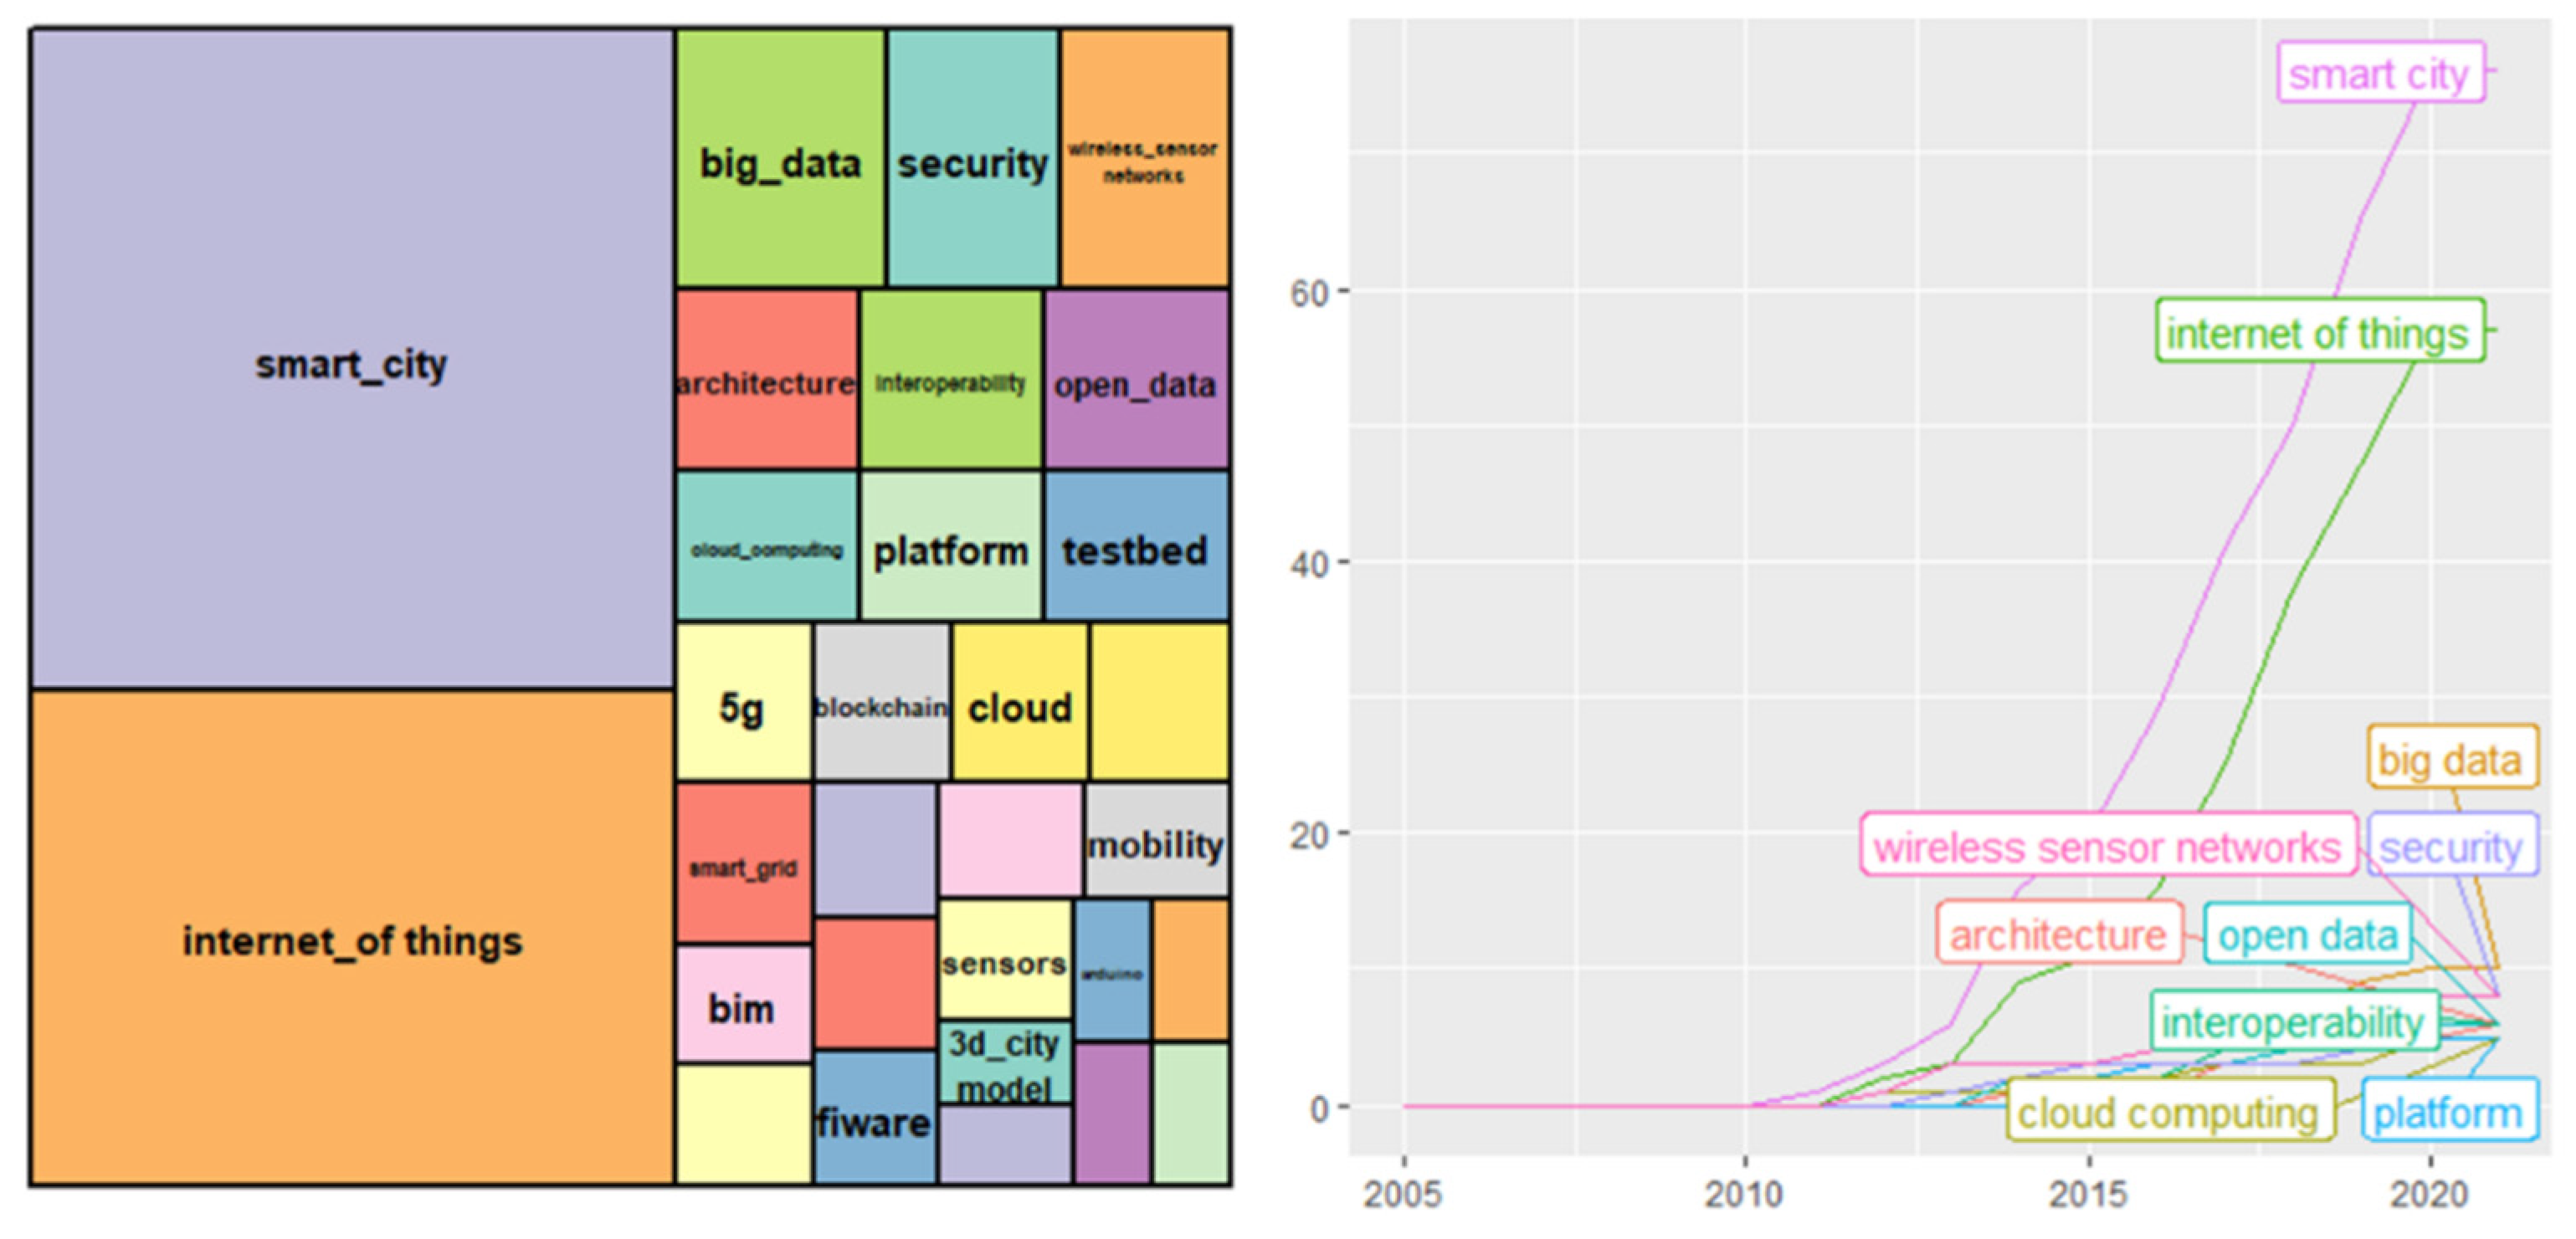
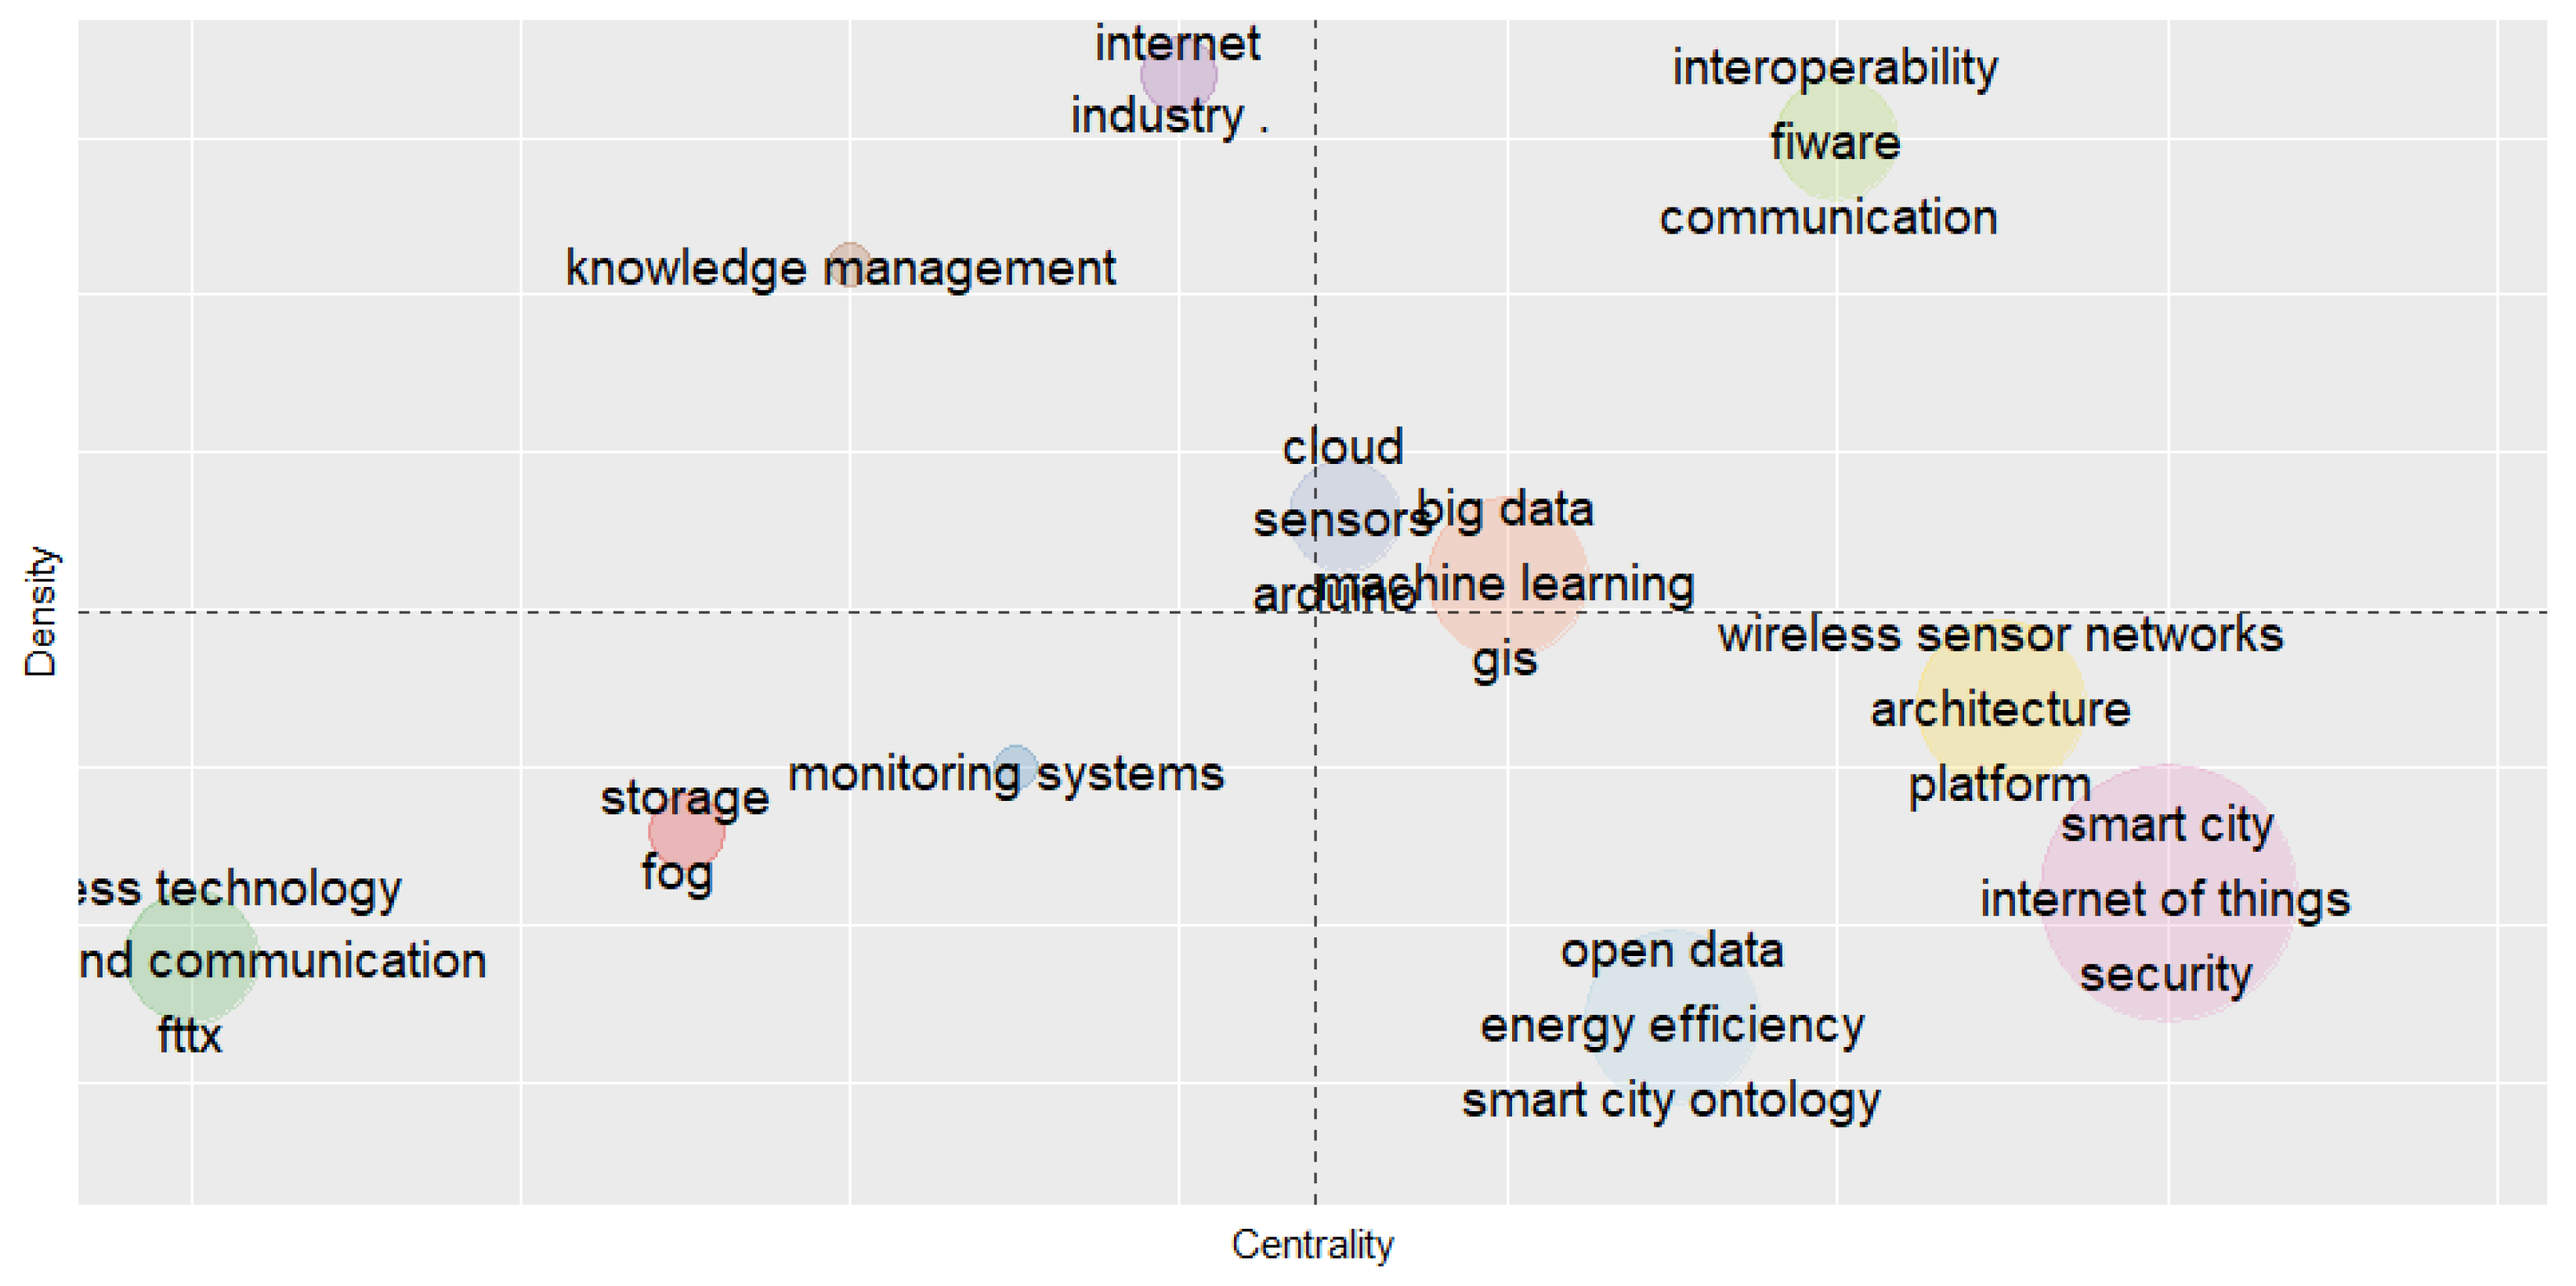
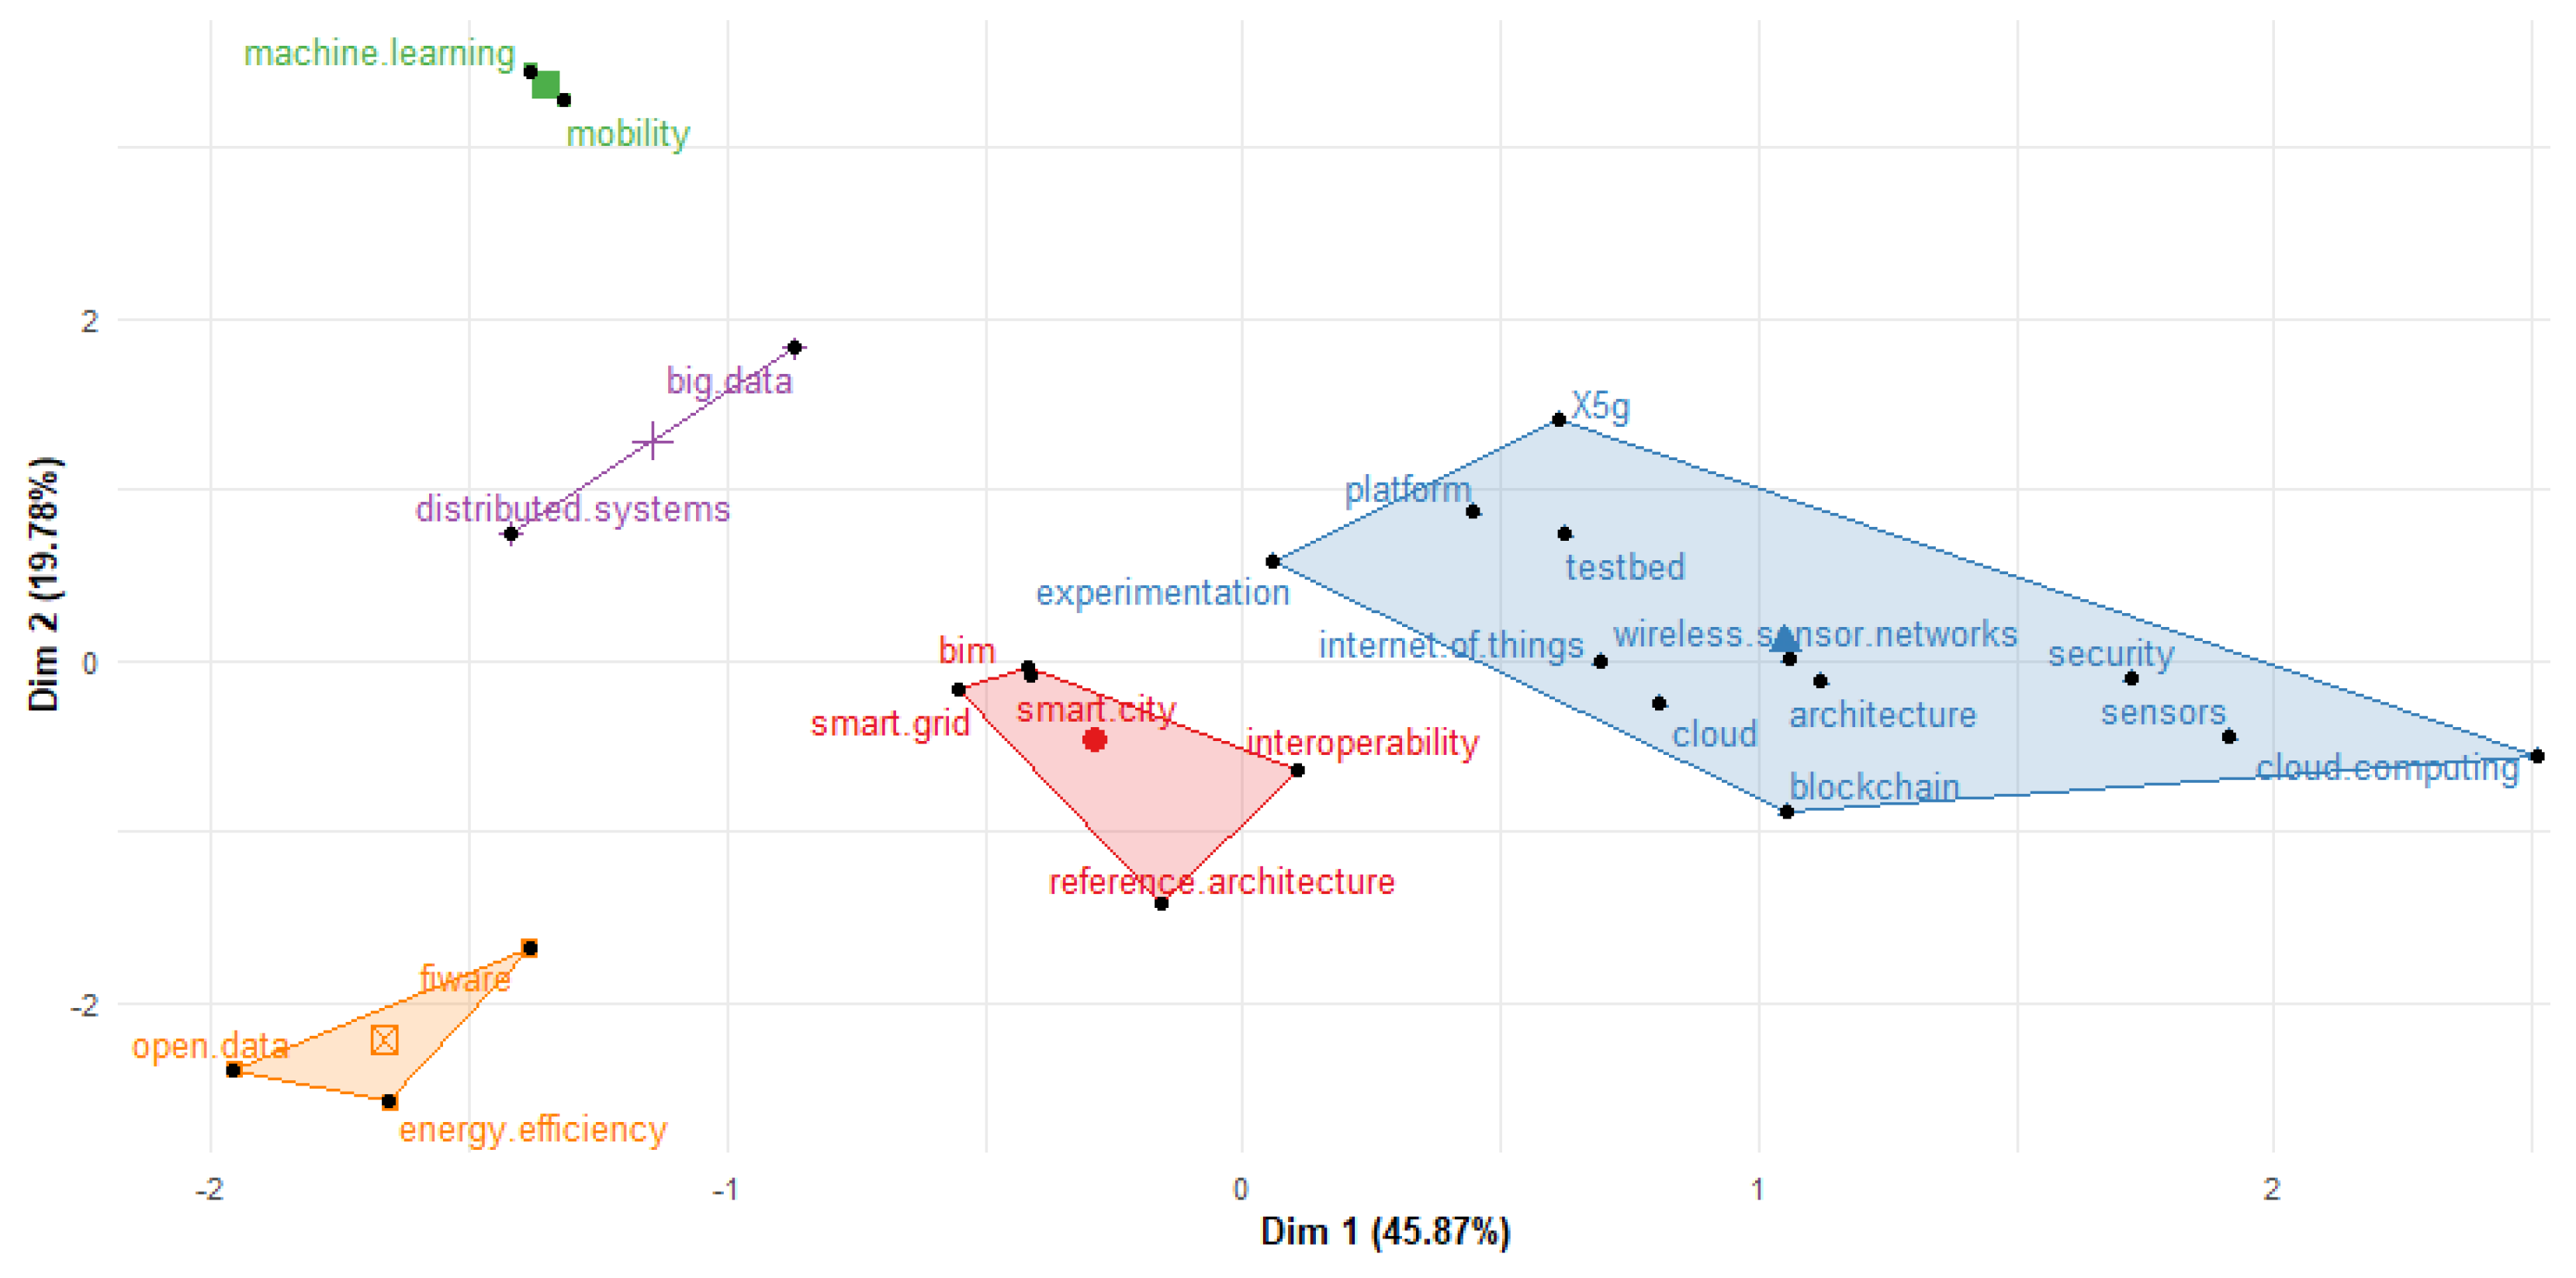
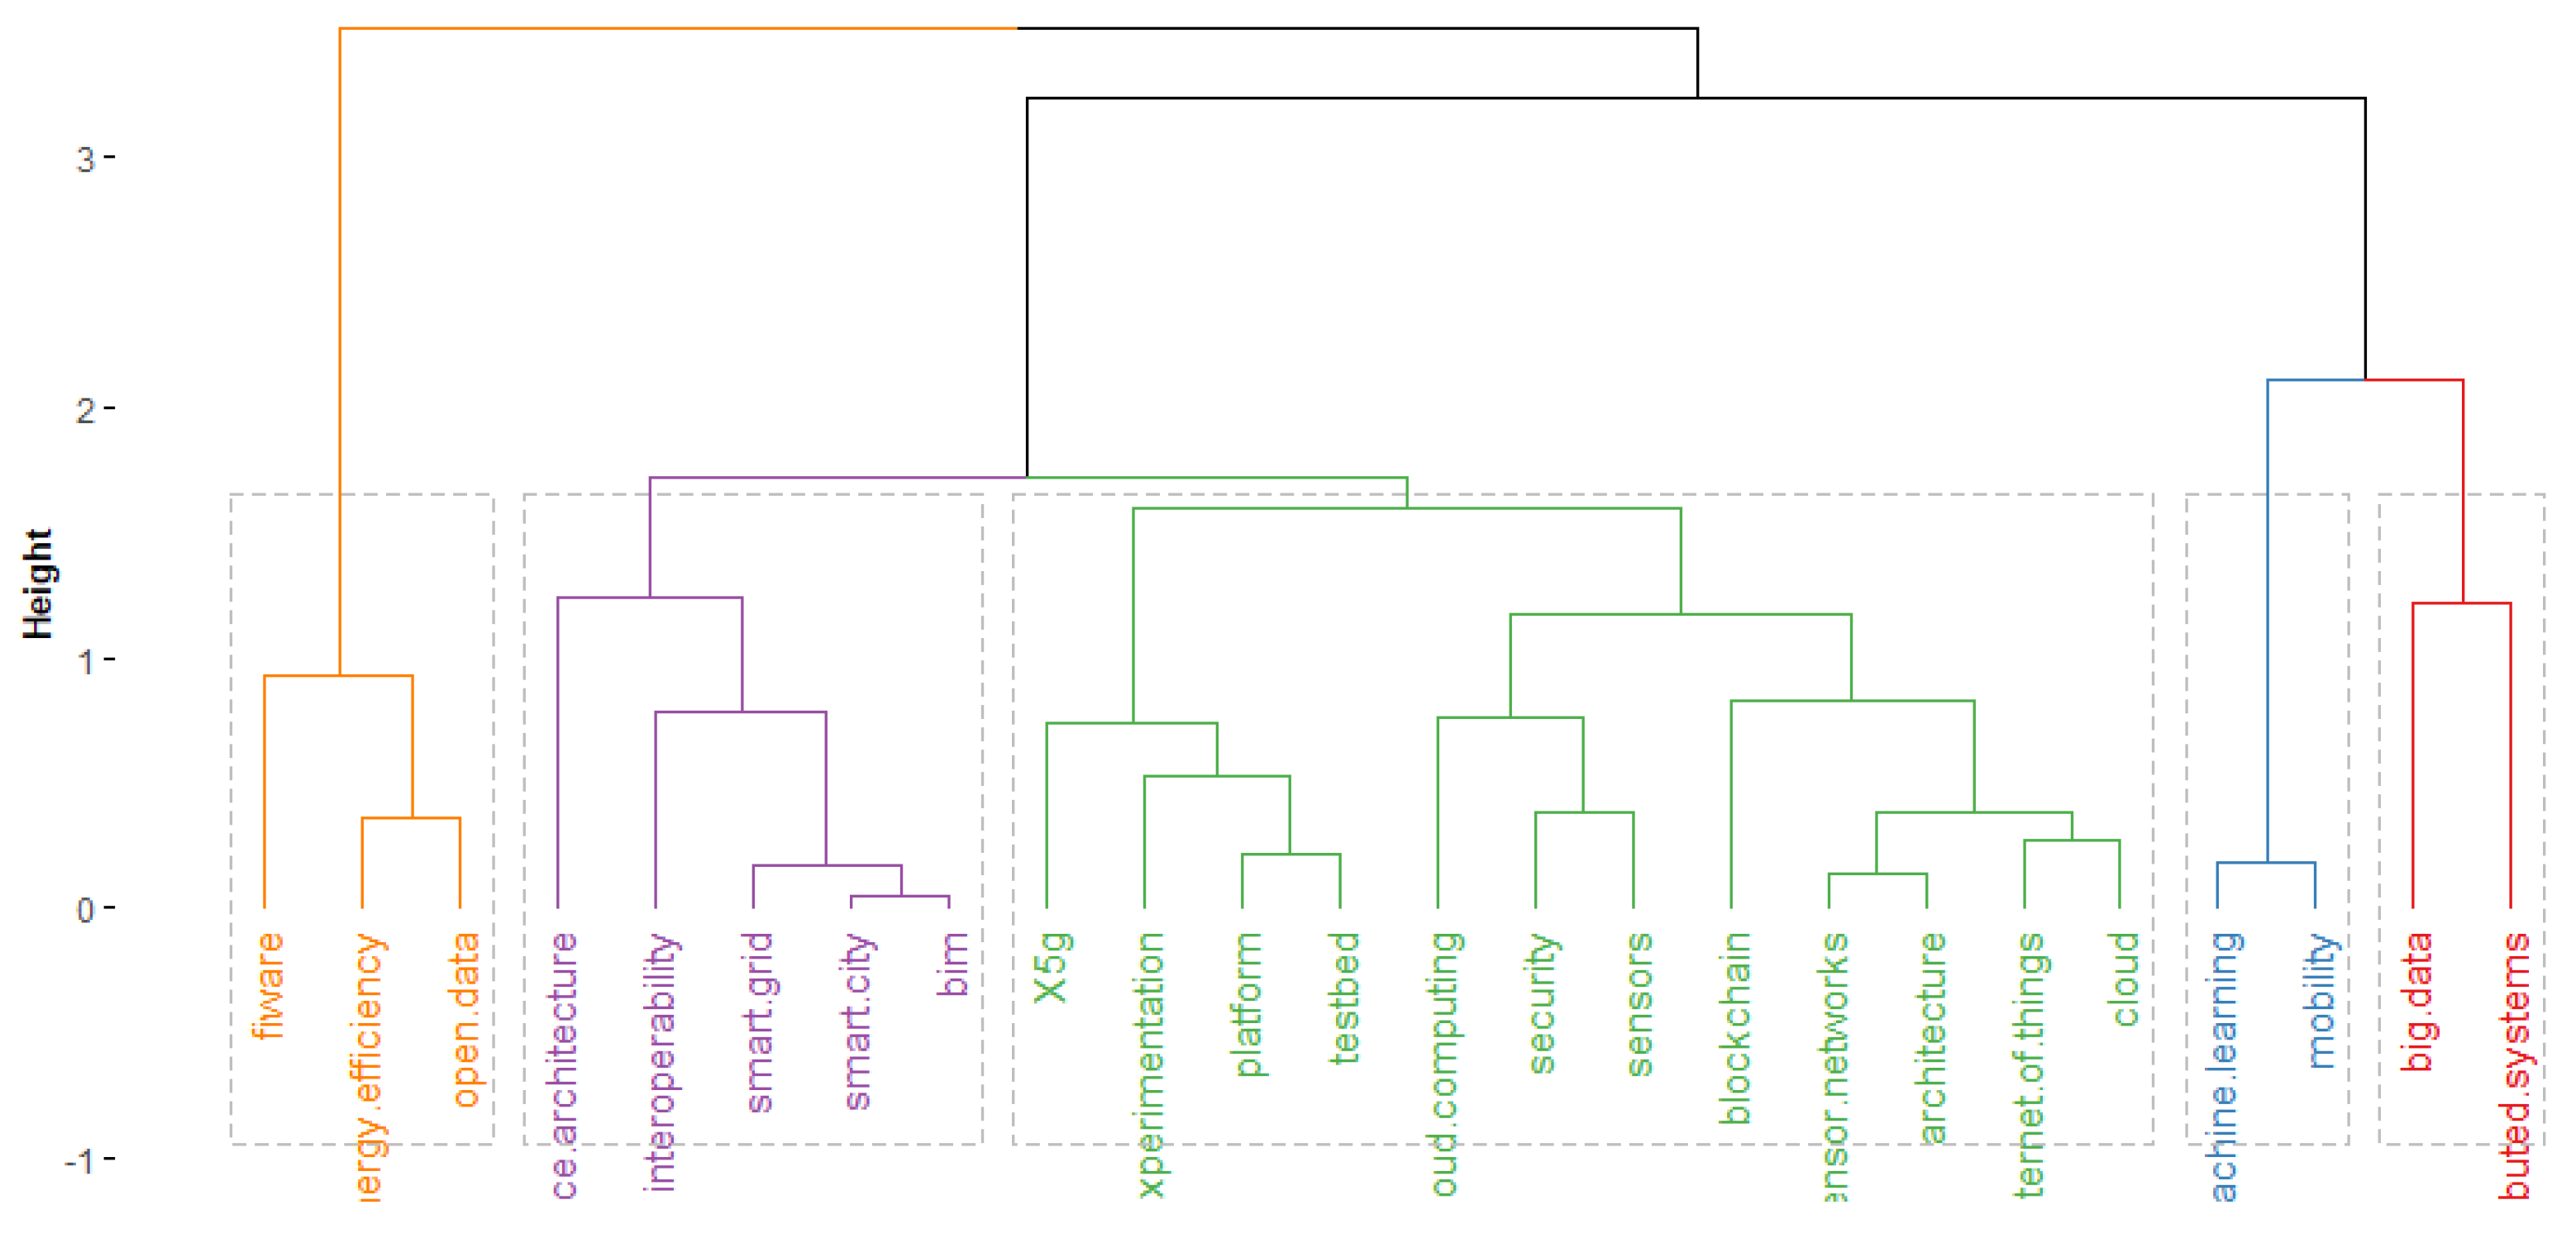
4.1.3. Literature Collection #3
4.2. Systematic Literature Review
4.2.1. Literature Collection #1

| Category | References |
|---|---|
| Demographics | [28,31,33,34,38,42,43,44,45] |
| Cost | [10,12,28,32,34,35,37,41,43,46,47,48,49,50,51,52,53,54] |
| Time | [10,28,32,33,34,37,38,41,43,46,48,50,52,54,55] |
| Environment | [12,48,49,52] |
| Socializing | [36,37,48] |
| Trust | [34,38,39,41,43,47,48,49,56,57] |
| Scheme availability | [32,33,47,51,52,55,56] |
| Public Transportation Integration | [10,28,41,45,58,59] |
4.2.2. Literature Collection #2
4.2.3. Literature Collection #3
4.3. Discussion
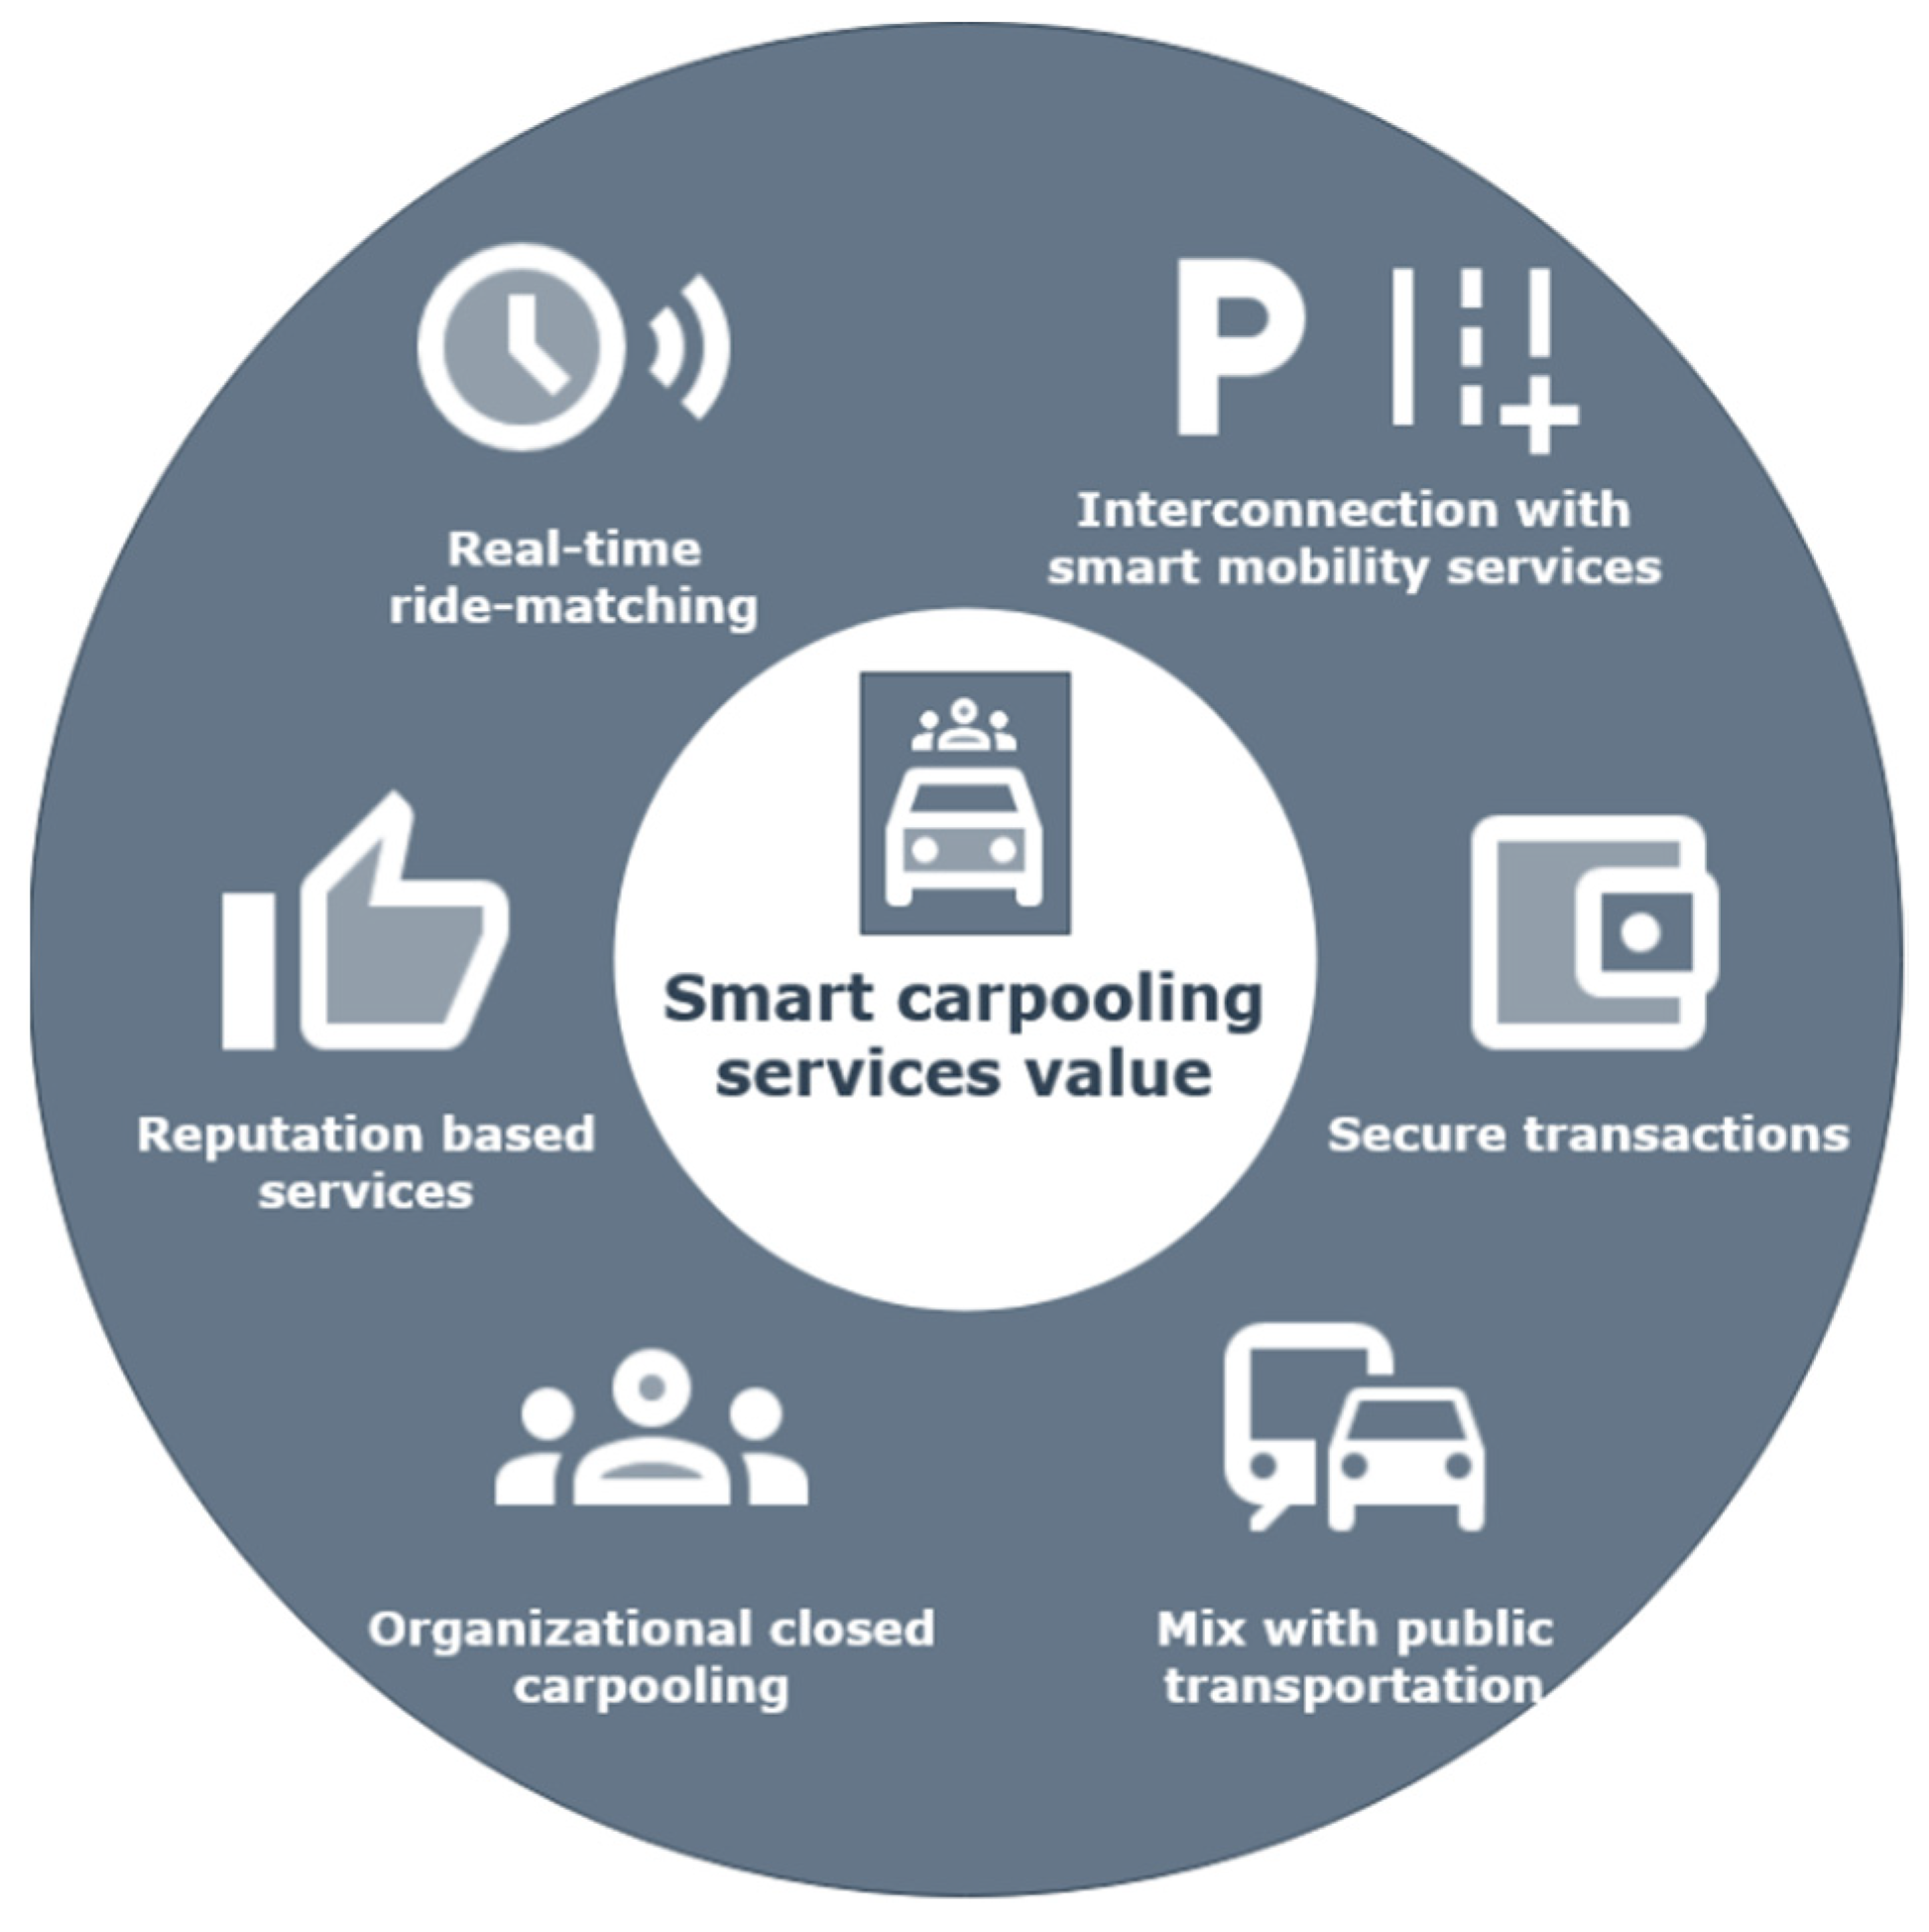
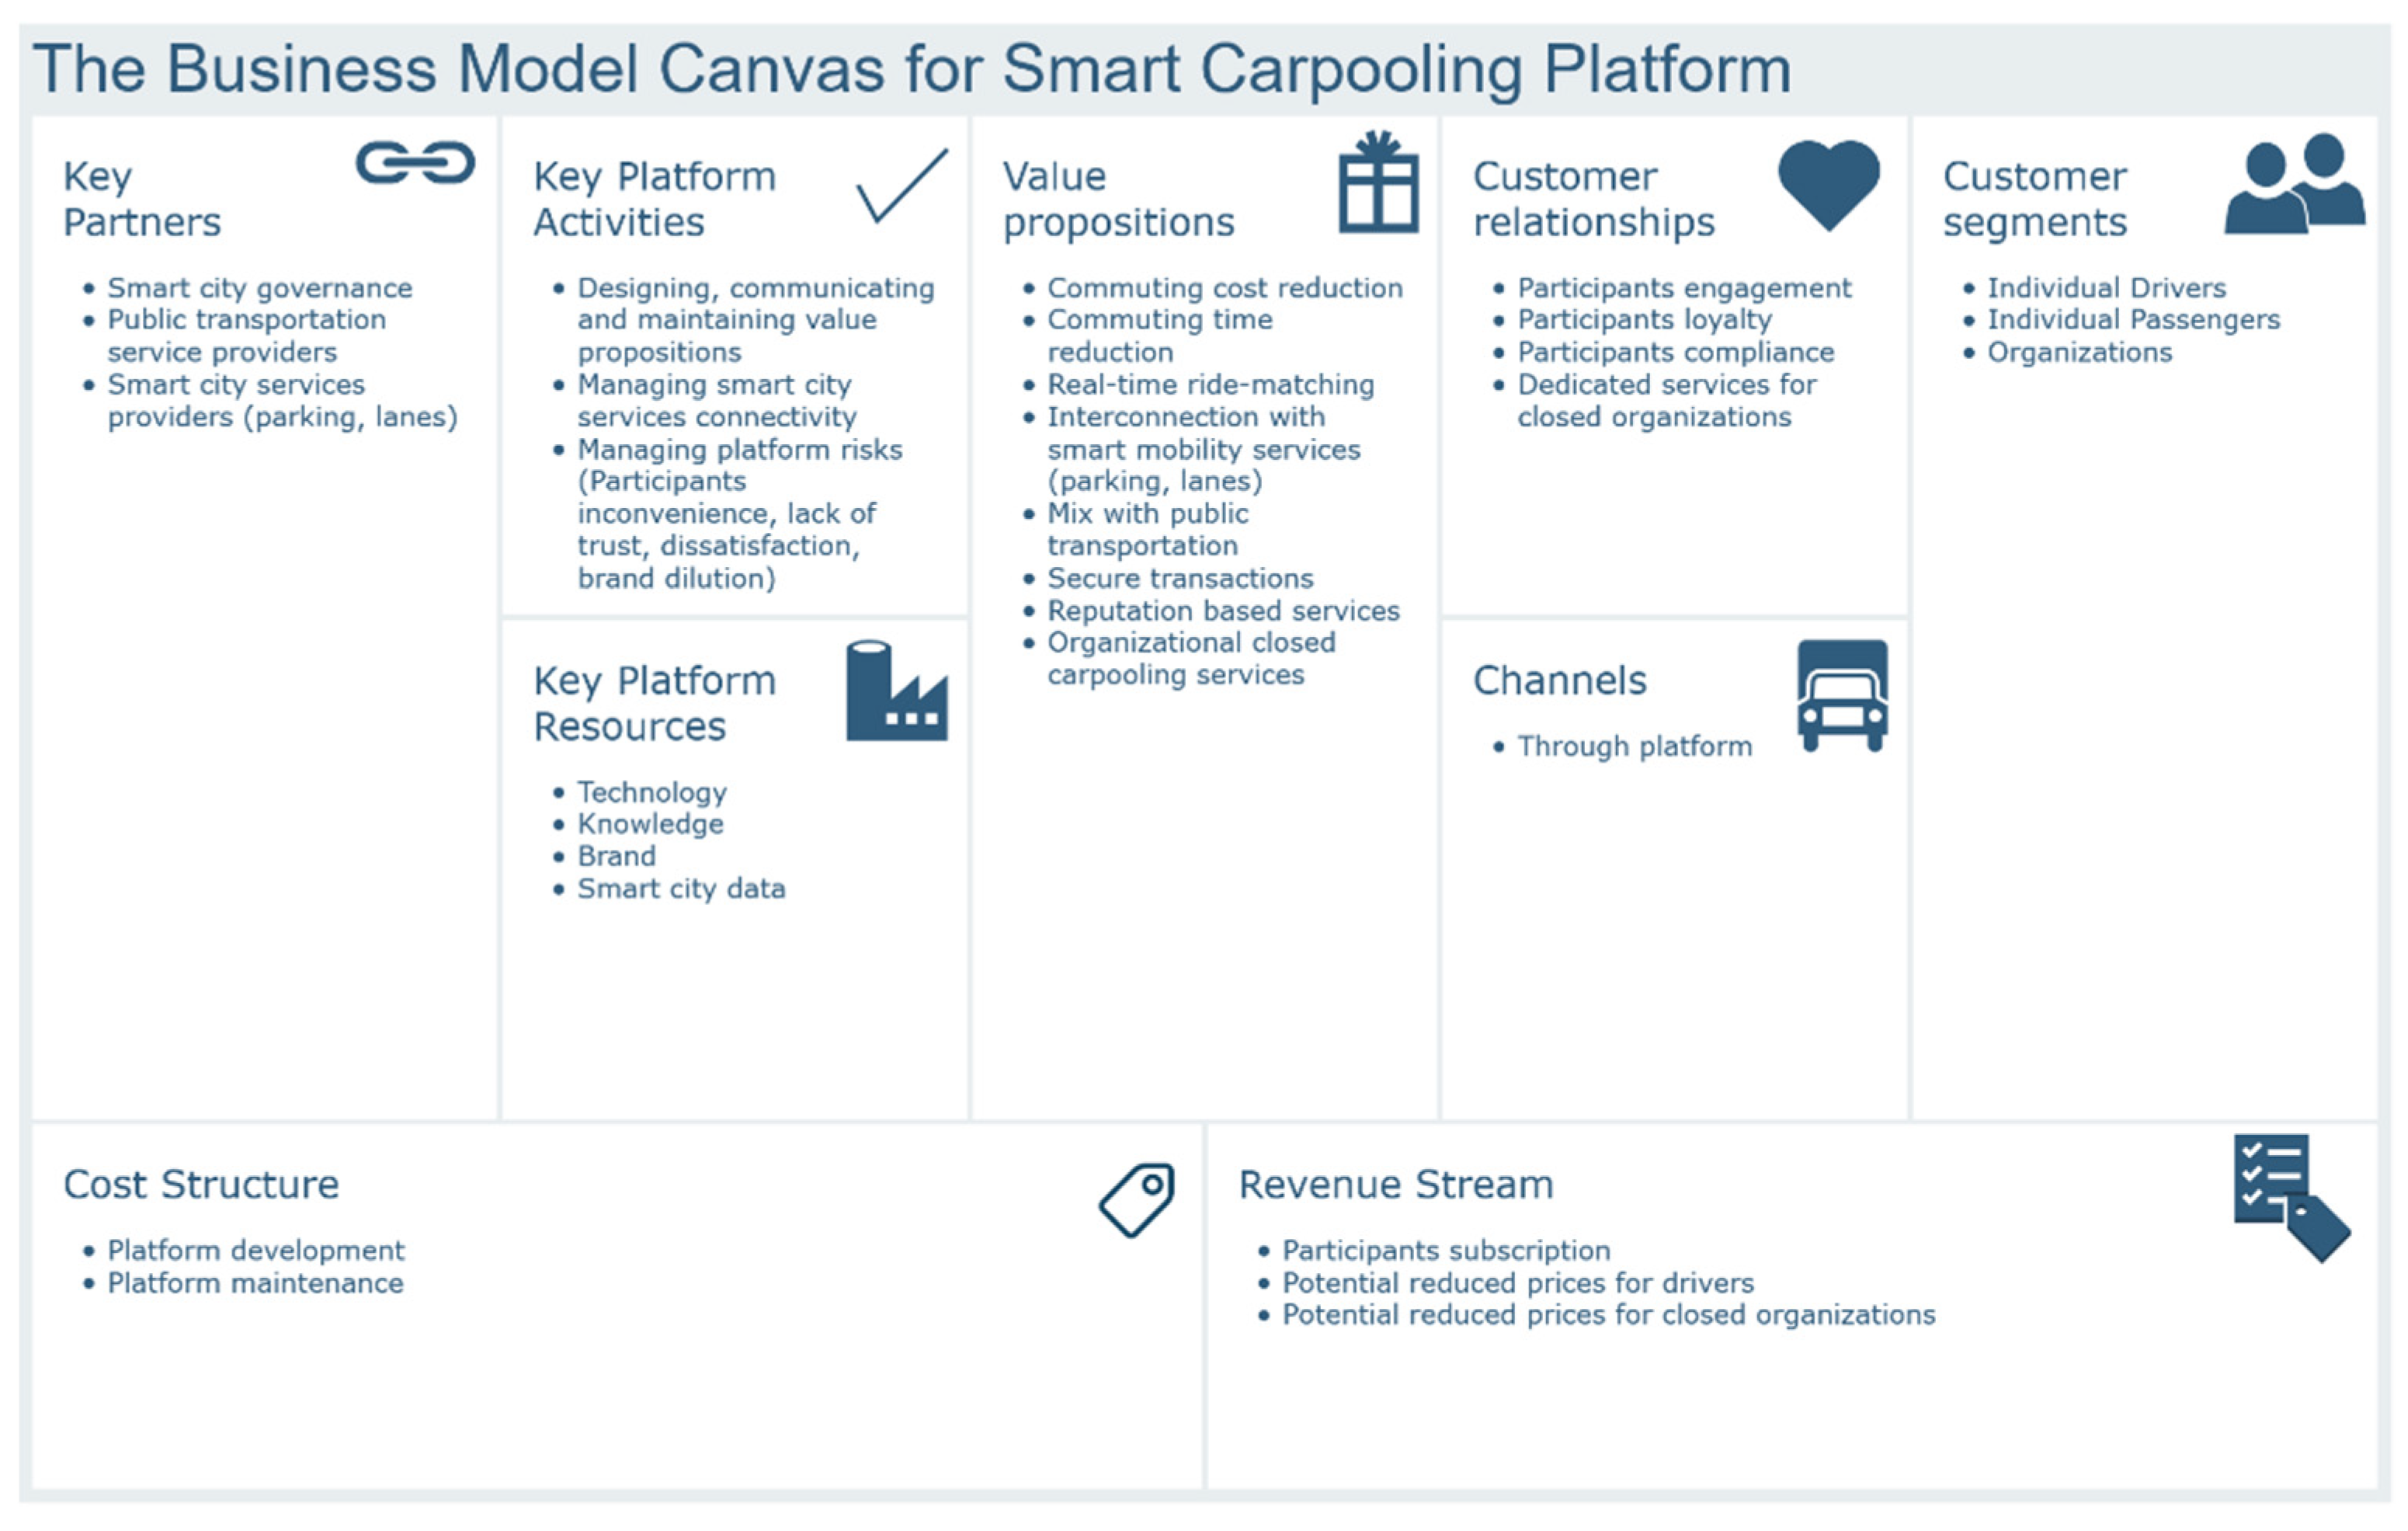
- Real-time ride matching is more possible as the user base gets larger. This is feasible by using matching techniques and appropriate processing of the big data stemming from citizen mobility in the context of smart cities.
- The IoT facilitates the interconnection of carpooling vehicles with other smart city mobility services like parking and access to dedicated lanes, which are proven carpooling incentives.
- Reputation-based services and social networks help improve trust between carpooling participants and reduce safety concerns.
- Organizational closed carpooling helps alleviate the inconvenience of traveling with strangers.
- Technologies such as the blockchain enable secure transactions between participants.
- Smart transportation and the MaaS concept enable route planning using a mix of carpooling and other transportation methods.
- To identify the co-created value in a carpooling scheme, the perspective of the car owner (driver) and the perspective of the passenger are examined separately.
- The customer segments include both individuals (drivers or passengers) and organizations who want to organize carpooling schemes for their participants.
- The smart city governance and the service providers are considered as partners. However, the smart city could be a candidate organization who wants to introduce carpooling for the citizens, and, in this case, it should be added to the customer segments.
- The revenue streams must be considered for each customer segment separately, while the participants’ transactions for the trip cost sharing are considered part of the platform operation.
- The risks are added to the key platform activities and must be examined thoroughly for both the platform provider and for the participants.
- The city infrastructure.
- The sensors that collect the data depicting the conditions of the infrastructure.
- The connectivity and network services for the data transmission.
- The data management, including storage, processing, and sharing.
- The applications for end users such as smart city citizens or governance organizations.
5. Conclusions
Author Contributions
Funding
Institutional Review Board Statement
Informed Consent Statement
Data Availability Statement
Acknowledgments
Conflicts of Interest
References
- Chehabeddine, M.; Tvaronavičienė, M. Securing regional development. Insights Reg. Dev. 2020, 2, 430–442. [Google Scholar] [CrossRef]
- Anthopoulos, L.; Tzimos, D. Carpooling platforms in smart cities for COVID-19 pandemic: A bibliometric analysis. In Companion Proceedings of the Web Conference 2021; Association for Computing Machinery: New York, NY, USA, 2021; pp. 661–666. [Google Scholar] [CrossRef]
- Turetken, O.; Grefen, P.; Gilsing, R.; Adali, O.E. Service-Dominant Business Model Design for Digital Innovation in Smart Mobility. Bus. Inf. Syst. Eng. 2019, 61, 9–29. [Google Scholar] [CrossRef] [Green Version]
- Yunus, E.; Susilo, D.; Riyadi, S.; Indrasari, M.; Putranto, T.D. The effectiveness marketing strategy for ride-sharing transportation: Intersecting social media, technology, and innovation. Entrep. Sustain. Issues 2019, 7, 1424–1434. [Google Scholar] [CrossRef]
- Giffinger, R.; Fertner, C.; Kramar, H.; Kalasek, R.; Milanović, N.; Meijers, E. Smart Cities—Ranking of European Medium-Sized Cities; Vienna University of Technology: Vienna, Austria, 2007. [Google Scholar]
- Caragliu, A.; Del Bo, C.; Nijkamp, P. Smart Cities in Europe. J. Urban Technol. 2011, 18, 65–82. [Google Scholar] [CrossRef]
- Anthopoulos, L.; Attour, A. Smart Transportation Applications’ Business Models: A Comparison. In Proceedings of the Companion Volume of the WWW ’18: The Web Conference 2018, Lyon, France, 23–27 April 2018; International World Wide Web Conferences Steering Committee: Geneva, Switzerland, 2018; pp. 927–928. [Google Scholar] [CrossRef]
- Guyader, H.; Piscicelli, L. Business model diversification in the sharing economy: The case of GoMore. J. Clean. Prod. 2019, 215, 1059–1069. [Google Scholar] [CrossRef]
- Mouftah, H.T.; Erol-Kantarci, M. Smart Grid: Networking, Data Management, and Business Models; CRC Press: Boca Raton, FL, USA, 2016. [Google Scholar]
- Shaheen, S.A.; Chan, N.D.; Gaynor, T. Casual carpooling in the San Francisco Bay Area: Understanding user characteristics, behaviors, and motivations. Transp. Policy 2016, 51, 165–173. [Google Scholar] [CrossRef] [Green Version]
- United States Department Of Transportation. Bureau Of Transportation Statistics. Commute Mode by Percentage; 2019. Available online: https://www.bts.gov/commute-mode (accessed on 8 August 2021).
- Delhomme, P.; Gheorghiu, A. Comparing French carpoolers and non-carpoolers: Which factors contribute the most to carpooling? Transp. Res. Part D Transp. Environ. 2016, 42, 1–15. [Google Scholar] [CrossRef]
- Osterwalder, A.; Pigneur, Y.; Clark, T. Business Model Generation: A Handbook for Visionaries, Game Changers, and Challengers; Wiley: Hoboken, NJ, USA, 2010. [Google Scholar]
- Montero, J.J. Regulating Transport Platforms: The Case of Carpooling in Europe. In The Governance of Smart Transportation Systems; Finger, M., Audouin, M., Eds.; Springer International Publishing: Cham, Switzerland, 2019; pp. 13–35. [Google Scholar] [CrossRef]
- Pritchard, A. Statistical bibliography or bibliometrics? J. Doc. 1969, 25, 348–349. [Google Scholar]
- Tranfield, D.; Denyer, D.; Smart, P. Towards a Methodology for Developing Evidence-Informed Management Knowledge by Means of Systematic Review. Br. J. Manag. 2003, 14, 207–222. [Google Scholar] [CrossRef]
- Aria, M.; Cuccurullo, C. bibliometrix: An R-tool for comprehensive science mapping analysis. J. Informetr. 2017, 11, 959–975. [Google Scholar] [CrossRef]
- RStudio Team. RStudio: Integrated Development for R. RStudio; PBC: Boston, MA, USA, 2020; Available online: http://www.rstudio.com/ (accessed on 8 August 2021).
- R Core Team. R: A Language and Environment for Statistical Computing; R Foundation for Statistical Computing: Vienna, Austria, 2017; Available online: https://www.R-project.org/ (accessed on 8 August 2021).
- Moher, D.; Liberati, A.; Tetzlaff, J.; Altman, D.G.; The PRISMA Group. Reprint—Preferred Reporting Items for Systematic Reviews and Meta-Analyses: The PRISMA Statement. Phys. Ther. 2009, 89, 873–880. [Google Scholar] [CrossRef]
- Denyer, D.; Tranfield, D. Producing a systematic review. In The Sage Handbook of Organizational Research Methods; SAGE Publications Ltd.: Thousand Oaks, CA, USA, 2009; pp. 671–689. Available online: https://psycnet.apa.org/record/2010-00924-039 (accessed on 8 August 2021).
- Kitchenham, B.A.; Charters, S.M. Guidelines for Performing Systematic Literature Reviews in Software Engineering; Technical report No. EBSE-2007-01; 2007. [Google Scholar]
- Kitchenham, B.A.; Budgen, D.; Brereton, P. Evidence-Based Software Engineering and Systematic Reviews; CRC Press: Boca Raton, FL, USA, 2016. [Google Scholar]
- Chapman, K.; Ellinger, A.E. An evaluation of Web of Science, Scopus and Google Scholar citations in operations management. Int. J. Logist. Manag. 2019, 30, 1039–1053. [Google Scholar] [CrossRef]
- Koseoglu, M.A. Growth and structure of authorship and co-authorship network in the strategic management realm: Evidence from the Strategic Management Journal. BRQ Bus. Res. Q. 2016, 19, 153–170. [Google Scholar] [CrossRef] [Green Version]
- Cobo, M.J.; López-Herrera, A.G.; Herrera-Viedma, E.; Herrera, F. An approach for detecting, quantifying, and visualizing the evolution of a research field: A practical application to the Fuzzy Sets Theory field. J. Informetr. 2011, 5, 146–166. [Google Scholar] [CrossRef]
- Dahlgren, J. High occupancy vehicle lanes: Not always more effective than general purpose lanes. Transp. Res. Part A Policy Pract. 1998, 32, 99–114. [Google Scholar] [CrossRef] [Green Version]
- Monchambert, G. Why do (or don’t) people carpool for long distance trips? A discrete choice experiment in France. Transp. Res. Part A Policy Pract. 2020, 132, 911–931. [Google Scholar] [CrossRef]
- Bansal, P.; Kockelman, K.M.; Singh, A. Assessing public opinions of and interest in new vehicle technologies: An Austin perspective. Transp. Res. Part C Emerg. Technol. 2016, 67, 1–14. [Google Scholar] [CrossRef]
- Zanella, A.; Bui, N.; Castellani, A.; Vangelista, L.; Zorzi, M. Internet of Things for Smart Cities. IEEE Internet Things J. 2014, 1, 22–32. [Google Scholar] [CrossRef]
- Teal, R.F. Carpooling: Who, how and why. Transp. Res. Part A Gen. 1987, 21, 203–214. [Google Scholar] [CrossRef]
- Ferguson, E. The rise and fall of the American carpool: 1970–1990. Transportation 1997, 24, 349–376. [Google Scholar] [CrossRef]
- Neoh, J.G.; Chipulu, M.; Marshall, A. What encourages people to carpool? An evaluation of factors with meta-analysis. Transportation 2017, 44, 423–447. [Google Scholar] [CrossRef]
- Olsson, L.E.; Maier, R.; Friman, M. Why Do They Ride with Others? Meta-Analysis of Factors Influencing Travelers to Carpool. Sustainability 2019, 11, 2414. [Google Scholar] [CrossRef] [Green Version]
- Washbrook, K.; Haider, W.; Jaccard, M. Estimating commuter mode choice: A discrete choice analysis of the impact of road pricing and parking charges. Transportation 2006, 33, 621–639. [Google Scholar] [CrossRef]
- Librino, F.; Renda, M.E.; Santi, P.; Martelli, F.; Resta, G.; Duarte, F.; Ratti, C.; Zhao, J. Home-work carpooling for social mixing. Transportation 2020, 47, 2671–2701. [Google Scholar] [CrossRef]
- Park, Y.; Chen, N.; Akar, G. Who is Interested in Carpooling and Why: The Importance of Individual Characteristics, Role Preferences and Carpool Markets. Transp. Res. Rec. J. Transp. Res. Board 2018, 2672, 708–718. [Google Scholar] [CrossRef]
- Bruglieri, M.; Ciccarelli, D.; Colorni, A.; Luè, A. PoliUniPool: A carpooling system for universities. Procedia Soc. Behav. Sci. 2011, 20, 558–567. [Google Scholar] [CrossRef] [Green Version]
- Wu, M.; Neill, S. Trust transfer and the intention to use app-enabled carpooling service. Asia Pac. J. Mark. Logist. 2020, 33, 1498–1512. [Google Scholar] [CrossRef]
- Wright, S.; Nelson, J.D.; Cottrill, C.D. MaaS for the suburban market: Incorporating carpooling in the mix. Transp. Res. Part A Policy Pract. 2020, 131, 206–218. [Google Scholar] [CrossRef]
- Carrese, S.; Giacchetti, T.; Patella, S.M.; Petrelli, M. Real time ridesharing: Understanding user behavior and policies impact: Carpooling service case study in Lazio Region, Italy. In Proceedings of the 5th IEEE International Conference on Models and Technologies for Intelligent Transportation Systems (MT-ITS), Napoli, Italy, 26–28 June 2017; pp. 721–726. [Google Scholar] [CrossRef]
- Blumenberg, E.; Smart, M. Brother can you Spare a Ride? Carpooling in Immigrant Neighbourhoods. Urban Stud. 2014, 51, 1871–1890. [Google Scholar] [CrossRef]
- Correia, G.; Viegas, J.M. Carpooling and carpool clubs: Clarifying concepts and assessing value enhancement possibilities through a Stated Preference web survey in Lisbon, Portugal. Transp. Res. Part A Policy Pract. 2011, 45, 81–90. [Google Scholar] [CrossRef]
- Molina, J.A.; Giménez-Nadal, J.I.; Velilla, J. Sustainable Commuting: Results from a Social Approach and International Evidence on Carpooling. Sustainability 2020, 12, 9587. [Google Scholar] [CrossRef]
- Neoh, J.G.; Chipulu, M.; Marshall, A.; Tewkesbury, A. How commuters’ motivations to drive relate to propensity to carpool: Evidence from the United Kingdom and the United States. Transp. Res. Part A Policy Pract. 2018, 110, 128–148. [Google Scholar] [CrossRef] [Green Version]
- Canning, P.E.; Hughes, S.J.; Hellawell, E.E.; Gatersleben, B.C.M.; Fairhead, C.J. Reasons for participating in formal employer-led carpool schemes as perceived by their users. Transp. Plan. Technol. 2010, 33, 733–745. [Google Scholar] [CrossRef]
- Chan, N.D.; Shaheen, S.A. Ridesharing in North America: Past, Present, and Future. Transp. Rev. 2012, 32, 93–112. [Google Scholar] [CrossRef]
- Ciasullo, M.V.; Troisi, O.; Loia, F.; Maione, G. Carpooling: Travelers’ perceptions from a big data analysis. TQM J. 2018, 30, 554–571. [Google Scholar] [CrossRef]
- Do, M.; Jung, H. The Socio-Economic Benefits of Sharing Economy: Colleague-Based Carpooling Service in Korea. J. Open Innov. Technol. Mark. Complex. 2018, 4, 40. [Google Scholar] [CrossRef] [Green Version]
- Huang, K.; Liu, Z.; Kim, I.; Zhang, Y.; Zhu, T. Analysis of the Influencing Factors of Carpooling Schemes. IEEE Intell. Transp. Syst. Mag. 2019, 11, 200–208. [Google Scholar] [CrossRef]
- Kaplowitz, S.A.; Slabosky, A. Trying to Increase Carpooling at a Major U.S. University: A Survey and an Intervention. Sustain. J. Rec. 2018, 11, 74–80. [Google Scholar] [CrossRef] [Green Version]
- Li, J.; Embry, P.; Mattingly, S.P.; Sadabadi, K.F.; Rasmidatta, I.; Burris, M.W. Who Chooses to Carpool and Why? Examination of Texas Carpoolers. Transp. Res. Rec. J. Transp. Res. Board 2007, 2021, 110–117. [Google Scholar] [CrossRef] [Green Version]
- Liu, X.; Yan, X.; Liu, F.; Wang, R.; Leng, Y. A trip-specific model for fuel saving estimation and subsidy policy making of carpooling based on empirical data. Appl. Energy 2019, 240, 295–311. [Google Scholar] [CrossRef]
- Malodia, S.; Singla, H. A study of carpooling behaviour using a stated preference web survey in selected cities of India. Transp. Plan. Technol. 2016, 39, 538–550. [Google Scholar] [CrossRef]
- Pinto, G.A.; Vieira, K.C.; Carvalho, E.G.; Sugano, J.Y. Applying the lazy user theory to understand the motivations for choosing carpooling over public transport. Sustain. Prod. Consum. 2019, 20, 243–252. [Google Scholar] [CrossRef]
- Li, R.; Liu, Z.; Zhang, R. Studying the benefits of carpooling in an urban area using automatic vehicle identification data. Transp. Res. Part C Emerg. Technol. 2018, 93, 367–380. [Google Scholar] [CrossRef]
- Kristal, A.S.; Whillans, A.V. What we can learn from five naturalistic field experiments that failed to shift commuter behaviour. Nat. Hum. Behav. 2020, 4, 169–176. [Google Scholar] [CrossRef] [PubMed]
- Wu, C.; Shankari, K.; Kamar, E.; Katz, R.; Culler, D.; Papadimitriou, C.; Horvitz, E.; Bayen, A. Optimizing the diamond lane: A more tractable carpool problem and algorithms. In Proceedings of the IEEE 19th International Conference on Intelligent Transportation Systems (ITSC), Rio de Janeiro, Brazil, 1–4 November 2016; pp. 1389–1396. [Google Scholar] [CrossRef]
- Wei, X.; Yu, W.; Wang, W.; Zhao, D.; Hua, X. Optimization and Comparative Analysis of Traffic Restriction Policy by Jointly Considering Carpool Exemptions. Sustainability 2020, 12, 7734. [Google Scholar] [CrossRef]
- Minett, P.; Niles, J.; Lee, R.; Bogue, B.; Schaefer, M.D. Congestion-clearing payments to passengers. Transp. Res. Procedia 2020, 45, 668–675. [Google Scholar] [CrossRef]
- Hughes, J.E.; Kaffine, D. When should drivers be encouraged to carpool in hov lanes? Carpooling in hov lanes. Econ. Inq. 2019, 57, 667–684. [Google Scholar] [CrossRef]
- Banerjee, D.; Srivastava, B. Promoting Carpooling with Distributed Schedule Coordination and Incentive Alignment of Contacts. In Proceedings of the IEEE 18th International Conference on Intelligent Transportation Systems, Washington, DC, USA, 15–18 September 2015; pp. 1837–1842. [Google Scholar] [CrossRef]
- Burris, M.; Alemazkoor, N.; Benz, R.; Wood, N.S. The impact of HOT lanes on carpools. Res. Transp. Econ. 2014, 44, 43–51. [Google Scholar] [CrossRef]
- Arellano-Verdejo, J.; Alonso-Pecina, F.; Alba, E.; Guzmán Arenas, A. Optimal allocation of public parking spots in a smart city: Problem characterisation and first algorithms. J. Exp. Theor. Artif. Intell. 2019, 31, 575–597. [Google Scholar] [CrossRef]
- Shen, T.; Hua, K.; Liu, J. Optimized Public Parking Location Modelling for Green Intelligent Transportation System Using Genetic Algorithms. IEEE Access 2019, 7, 176870–176883. [Google Scholar] [CrossRef]
- Liu, X.; Titheridge, H.; Yan, X.; Wang, R.; Tan, W.; Chen, D.; Zhang, J. A passenger-to-driver matching model for commuter carpooling: Case study and sensitivity analysis. Transp. Res. Part C Emerg. Technol. 2020, 117, 102702. [Google Scholar] [CrossRef]
- Xiao, Q.; He, R.; Ma, C.; Zhang, W. Evaluation of urban taxi-carpooling matching schemes based on entropy weight fuzzy matter-element. Appl. Soft Comput. 2019, 81, 105493. [Google Scholar] [CrossRef]
- Chen, W.; Mes, M.; Schutten, M.; Quint, J. A Ride-Sharing Problem with Meeting Points and Return Restrictions. Transp. Sci. 2019, 53, 401–426. [Google Scholar] [CrossRef] [Green Version]
- Zhang, W.; He, R.; Chen, Y.; Gao, M.; Ma, C. Research on Taxi Pricing Model and Optimization for Carpooling Detour Problem. J. Adv. Transp. 2019, 2019, 1–11. [Google Scholar] [CrossRef]
- Jamal, J.; Rizzoli, A.E.; Montemanni, R.; Huber, D. Tour Planning and Ride Matching for an Urban Social Carpooling Service. MATEC Web Conf. 2016, 81, 04010. [Google Scholar] [CrossRef] [Green Version]
- Hsieh, F.-S.; Zhan, F.-M.; Guo, Y.-H. A solution methodology for carpooling systems based on double auctions and cooperative coevolutionary particle swarms. Appl. Intell. 2019, 49, 741–763. [Google Scholar] [CrossRef]
- Huang, S.-C.; Jiau, M.-K.; Liu, Y.-P. An Ant Path-Oriented Carpooling Allocation Approach to Optimize the Carpool Service Problem with Time Windows. IEEE Syst. J. 2019, 13, 994–1005. [Google Scholar] [CrossRef]
- Jadhao, R.B.; Patil, J.M. Recommendation system for carpooling and regular taxicab services. In Proceedings of the International Conference on Inventive Systems and Control (ICISC), Coimbatore, India, 19–20 January 2017; pp. 1–8. [Google Scholar] [CrossRef]
- Jiang, S.; Chen, W.; Li, Z.; Yu, H. Short-Term Demand Prediction Method for Online Car-Hailing Services Based on a Least Squares Support Vector Machine. IEEE Access 2019, 7, 11882–11891. [Google Scholar] [CrossRef]
- Tafreshian, A.; Masoud, N.; Yin, Y. Frontiers in Service Science: Ride Matching for Peer-to-Peer Ride Sharing: A Review and Future Directions. Serv. Sci. 2020, 12, 44–60. [Google Scholar] [CrossRef]
- Xia, J.; Curtin, K.M.; Li, W.; Zhao, Y. A New Model for a Carpool Matching Service. PLoS ONE 2015, 10, e0129257. [Google Scholar] [CrossRef] [Green Version]
- Xia, X.; Liu, H.; Li, J.; Liu, X.; Zhu, R.; Zong, C. Carpooling Algorithm with the Common Departure. In Proceedings of the IEEE International Conferences on Ubiquitous Computing & Communications (IUCC) and Data Science and Computational Intelligence (DSCI) and Smart Computing, Networking and Services (SmartCNS), Shenyang, China, 21–23 October 2019; pp. 513–520. [Google Scholar] [CrossRef]
- Zhang, D.; Li, Y.; Zhang, F.; Lu, M.; Liu, Y.; He, T. coRide: Carpool service with a win-win fare model for large-scale taxicab networks. In Proceedings of the 11th ACM Conference on Embedded Networked Sensor Systems—SenSys ’13, Rome, Italy, 11–15 November 2013; pp. 1–14. [Google Scholar] [CrossRef]
- Andreassen, T.W.; Lervik-Olsen, L.; Snyder, H.; Van Riel, A.C.R.; Sweeney, J.C.; Van Vaerenbergh, Y. Business model innovation and value-creation: The triadic way. J. Serv. Manag. 2018, 29, 883–906. [Google Scholar] [CrossRef] [Green Version]
- Díaz-Díaz, R.; Muñoz, L.; Pérez-González, D. The Business Model Evaluation Tool for Smart Cities: Application to Smart Santander Use Cases. Energies 2017, 10, 262. [Google Scholar] [CrossRef] [Green Version]
- Díaz-Díaz, R.; Muñoz, L.; Pérez-González, D. Business model analysis of public services operating in the smart city ecosystem: The case of SmartSantander. Future Gener. Comput. Syst. 2017, 76, 198–214. [Google Scholar] [CrossRef] [Green Version]
- Timeus, K.; Vinaixa, J.; Pardo-Bosch, F. Creating business models for smart cities: A practical framework. Public Manag. Rev. 2020, 22, 726–745. [Google Scholar] [CrossRef] [Green Version]
- Abbate, T.; Cesaroni, F.; Cinici, M.C.; Villari, M. Business models for developing smart cities. A fuzzy set qualitative comparative analysis of an IoT platform. Technol. Forecast. Soc. Chang. 2019, 142, 183–193. [Google Scholar] [CrossRef]
- Anthopoulos, L.; Fitsilis, P.; Ziozias, C. What is the Source of Smart City Value? A Business Model Analysis. Int. J. Electron. Gov. Res. 2016, 12, 56–76. [Google Scholar] [CrossRef] [Green Version]
- Walravens, N. Qualitative indicators for smart city business models: The case of mobile services and applications. Telecommun. Policy 2015, 39, 218–240. [Google Scholar] [CrossRef]
- Walravens, N.; Ballon, P. Platform business models for smart cities: From control and value to governance and public value. IEEE Commun. Mag. 2013, 51, 72–79. [Google Scholar] [CrossRef]
- Walravens, N. Mobile Business and the Smart City: Developing a Business Model Framework to Include Public Design Parameters for Mobile City Services. J. Theor. Appl. Electron. Commer. Res. 2012, 7, 21–22. [Google Scholar] [CrossRef] [Green Version]
- Callon, M.; Courtial, J.-P.; Turner, W.A.; Bauin, S. From translations to problematic networks: An introduction to co-word analysis. Soc. Sci. Inf. 1983, 22, 191–235. [Google Scholar] [CrossRef]
- Mulligan, C.E.; Olsson, M. Architectural implications of smart city business models: An evolutionary perspective. IEEE Commun. Mag. 2013, 51, 80–85. [Google Scholar] [CrossRef]
- Badii, C.; Bellini, P.; Difino, A.; Nesi, P. Sii-Mobility: An IoT/IoE Architecture to Enhance Smart City Mobility and Transportation Services. Sensors 2018, 19, 1. [Google Scholar] [CrossRef] [PubMed] [Green Version]
- Martins, P.; Albuquerque, D.; Wanzeller, C.; Caldeira, F.; Tomé, P.; Sá, F. CityAction a Smart-City Platform Architecture. In Advances in Information and Communication; Arai, K., Bhatia, R., Eds.; Springer International Publishing: Cham, Switzerland, 2020; Volume 69, pp. 217–236. [Google Scholar] [CrossRef]
- Pop, E.; Puscoci, S. Considerations Regarding E-services development platforms for Smart Cities. In Proceedings of the 12th International Conference on Electronics, Computers and Artificial Intelligence (ECAI), Bucharest, Romania, 25–27 June 2020; pp. 1–5. [Google Scholar] [CrossRef]
- Santana, E.F.Z.; Chaves, A.P.; Gerosa, M.A.; Kon, F.; Milojicic, D.S. Software Platforms for Smart Cities: Concepts, Requirements, Challenges, and a Unified Reference Architecture. ACM Comput. Surv. 2018, 50, 1–37. [Google Scholar] [CrossRef]
- Abreu, D.P.; Velasquez, K.; Curado, M.; Monteiro, E. A resilient Internet of Things architecture for smart cities. Ann. Telecommun. 2017, 72, 19–30. [Google Scholar] [CrossRef]
- Sanchez, L.; Muñoz, L.; Galache, J.A.; Sotres, P.; Santana, J.R.; Gutierrez, V.; Ramdhany, R.; Gluhak, A.; Krco, S.; Theodoridis, E.; et al. SmartSantander: IoT experimentation over a smart city testbed. Comput. Netw. 2014, 61, 217–238. [Google Scholar] [CrossRef] [Green Version]


| Collection #1 | Collection #2 | Collection #3 | |
|---|---|---|---|
| Web of Science | 198 | 14 | 26 |
| Scopus | 453 | 112 | 155 |
| Duplicates | −179 | −14 | −19 |
| Total | 472 | 112 | 162 |
| #1 | #2 | #3 | |
|---|---|---|---|
| Main Information | |||
| Timespan | 1977:2021 | 2011:2020 | 2005:2020 |
| Sources (journals, books, etc.) | 332 | 103 | 120 |
| Documents | 472 | 112 | 162 |
| Average years from publication | 4.08 | 2.78 | 2.97 |
| Average citations per documents | 10.37 | 12.18 | 26.27 |
| Average citations per year per doc | 2.308 | 3.841 | 5.074 |
| References | 14,727 | 4559 | 4949 |
| Document Types | |||
| Article | 235 | 35 | 44 |
| Book chapter | 20 | 8 | 14 |
| Conference paper | 191 | 60 | 96 |
| Review | 15 | 4 | 4 |
| Document Contents | |||
| Keywords plus | 2417 | 807 | 1189 |
| Author’s keywords | 1383 | 392 | 563 |
| Authors | |||
| Authors | 1417 | 316 | 656 |
| Author appearances | 1683 | 338 | 751 |
| Authors of single-authored documents | 37 | 16 | 11 |
| Authors of multi-authored documents | 1380 | 300 | 645 |
| Authors Collaboration | |||
| Single-authored documents | 41 | 20 | 11 |
| Documents per author | 0.333 | 0.354 | 0.247 |
| Authors per document | 3 | 2.82 | 4.05 |
| Co-authors per documents | 3.57 | 3.02 | 4.64 |
| Collaboration index | 3.2 | 3.26 | 4.27 |
| Category | References |
|---|---|
| Traffic policy | [28,40,59,60,61] |
| HOV/HOT lanes | [57,60,62] |
| Parking | [34,37,63,64,65] |
| Category | References |
|---|---|
| Passenger, schedule, route optimization | [53,66,67,68,70,71,72,73,74,75,76,77,78,79] |
Publisher’s Note: MDPI stays neutral with regard to jurisdictional claims in published maps and institutional affiliations. |
© 2021 by the authors. Licensee MDPI, Basel, Switzerland. This article is an open access article distributed under the terms and conditions of the Creative Commons Attribution (CC BY) license (https://creativecommons.org/licenses/by/4.0/).
Share and Cite
Anthopoulos, L.G.; Tzimos, D.N. Carpooling Platforms as Smart City Projects: A Bibliometric Analysis and Systematic Literature Review. Sustainability 2021, 13, 10680. https://doi.org/10.3390/su131910680
Anthopoulos LG, Tzimos DN. Carpooling Platforms as Smart City Projects: A Bibliometric Analysis and Systematic Literature Review. Sustainability. 2021; 13(19):10680. https://doi.org/10.3390/su131910680
Chicago/Turabian StyleAnthopoulos, Leonidas G., and Dimitrios N. Tzimos. 2021. "Carpooling Platforms as Smart City Projects: A Bibliometric Analysis and Systematic Literature Review" Sustainability 13, no. 19: 10680. https://doi.org/10.3390/su131910680