Article

Integrating Political Science into Climate Modeling: An Example of Internalizing the Costs of Climate-Induced Violence in the Optimal Management of the Climate

by
Shiran Victoria Shen
1,2
1
Hoover Institution, Stanford University, Stanford, CA 94305-6003, USA
2
Woodrow Wilson Department of Politics, University of Virginia, Charlottesville, VA 22904, USA
Sustainability 2021, 13(19), 10587; https://doi.org/10.3390/su131910587
Submission received: 4 August 2021 / Revised: 9 September 2021 / Accepted: 14 September 2021 / Published: 24 September 2021
(This article belongs to the Topic Climate Change and Environmental Sustainability)

Abstract

:
Extant modeling of the climate has largely left out political science; that needs to change. This paper provides an example of how a critical political concept—human security—can be accounted for in climate modeling. Scientific evidence points to an active link between climate change and the incidence of interpersonal and inter-group violence. This paper puts forth a new method to internalize the costs of climate-induced violence in the optimal management of the climate. Using the established MERGE integrated assessment model, this paper finds that based on the median estimates of the climate–violence relationship, such internalization can roughly double the optimal carbon price—the carbon price at which the net social benefit of carbon emissions would be maximized—consistently over time in most sensitivity scenarios. Sub-Saharan Africa is estimated to be the biggest beneficiary of such internalization in terms of avoided damages related to climate-induced violence as a percentage of the regional GDP, avoiding up to a 27 percent loss of GDP by 2200 under high-end estimates. That is significant for many African countries that have been suffering from underdevelopment and violence. The approach of this paper is a first for the climate modeling community, indicating directions for future modeling that could further integrate relevant political science considerations. This paper takes empirical findings that climate change mitigation can reduce violence-related damages to the next step toward understanding required to reach optimal policy decisions.

1. Introduction

Identifying the optimal ways to tackle climate change, which poses one of the biggest threats to human survival and well-being, is more crucial and timelier than ever. To provide important information to policymakers, natural scientists and economists have developed what are known as “integrated assessment models” (IAMs), which combine different strands of knowledge to illuminate how human development, societal choices, and the natural world affect each other in complex systems [1,2]. Works using IAMs have been recognized with two Nobel Prizes, awarded to the Intergovernmental Panel on Climate Change (IPCC) in 2007 and William Nordhaus in 2018, respectively. Extant modeling work has integrated economic, technological, and biophysical processes that produce greenhouse gas (GHG) emissions, but political science—despite its high relevance—has mostly been left out of the picture. This is not entirely surprising because political phenomena can be very challenging to model.
Making reasonable assumptions about human behaviors can provide essential insights into alternative future climates. A critical step towards achieving that goal is to conceptualize and quantify political science ideas, such as power, violence, and legitimacy, in a way that they can be incorporated into existing models. These concepts are consequential yet unincorporated or under-incorporated in existing modeling efforts. Violence is destructive to social order and economic growth [3]. The annual total cost of violence is estimated to be USD 9.4 trillion, which is equivalent to 11 percent of the world’s GDP [4,5,6]. While violence has shaped social and economic development tremendously across human history, most extant economic models have failed to take violence into account, and the impact of security on prosperity remains mostly understudied [3] (It is important to differentiate between “carbon price” and “optimal carbon price.” A carbon price is a cost imposed on carbon emissions to discourage polluters from emitting, which usually takes the form of a carbon tax or a requirement to purchase emissions permits. The optimal carbon price is the carbon price at which the net social benefit of carbon emissions would be maximized). Some recently published econometric studies are paving the way, and this study showcases how a critical political concept—human security—can and must be integrated into policy-relevant climate modeling.
Some scientific studies have established an active link between climate change and the incidence of interpersonal and inter-group conflicts. Hotter temperatures lead to higher levels of aggression and violence [7,8,9,10]. Increasing temperatures can also indirectly contribute to more violence by decreasing agricultural production, industrial outputs, and political stability [11]. After surveying 60 of the most rigorous quantitative studies of the relationship between temperature change and the incidence of violence, Hsiang, Burke, and Miguel identify strong evidence that climatic events change the frequency or intensity of human violence across substantial spatial and temporal scales [12].
In that spirit, this paper utilizes a new method to internalize the costs of climate-induced violence in the established MERGE integrated assessment model and evaluate how such internalization affects the optimal carbon price returned by the model, along with associated projections of temperature and damages under climate policy (It is important to differentiate between “carbon price” and “optimal carbon price.” A carbon price is a cost imposed on carbon emissions to discourage polluters from emitting, which usually takes the form of a carbon tax or a requirement to purchase emissions permits. The optimal carbon price is the carbon price at which the net social benefit of carbon emissions would be maximized). It is based on my working paper that previously appeared in a World Bank report [13]. Deploying recent econometric findings on the costs of different types of violence for different global regions, this paper finds that internalizing the damages from climate-induced violence can roughly double the carbon externality that is priced by the model, and this relationship holds across time and different specifications regarding climate sensitivity, GDP growth rate, and the catastrophic temperature. This relationship can be sensitive when (1) the willingness to pay (WTP) to avoid nonmarket damages (e.g., damages related to mortality, health, quality of life) is low, (2) the nonmarket damages are excluded, or (3) the magnitude of climate-violence damage is at a high boundary of the uncertainty range in empirical studies. Under the assumption that the WTP to avoid nonmarket damages equates to 1 percent of regional income, the avoided damages from climate-induced violence in sub-Saharan Africa is modeled to reach about 0.5 percent of the region’s GDP in 2050, 2 percent in 2100, and almost 4 percent in 2200. When the magnitude of climate damage reaches the high-end, the avoided damages from climate-induced violence in sub-Saharan Africa are projected to reach close to 2 percent in 2050, 10 percent in 2100, and 30 percent in 2200 in terms of the region’s GDP. This exercise shows that socially contingent damages, such as human violence, can and must be integrated into policy-relevant climate models. Thus, there is vast space for political scientists to integrate their insights and make significant contributions to the climate modeling enterprise.
The rest of the paper is organized as follows. Section 2 provides an overview of the existing literature on the externality of climate-induced violence and the motivation behind this modeling exercise. Section 3 describes the methods and procedures. Section 4 presents modeling results from scenarios under different assumptions. Section 5 concludes with policy implications and future research directions.

2. The Externality of Climate-Induced Violence

Scientific evidence suggests that climate change contributes to a more violent society. On an interpersonal scale, higher temperature has demonstrably led to increased rates of a variety of personal violence [14], including violent crimes [15] and domestic violence [16]. On a collective or intergroup level, empirical evidence points to an active link between climate change and conflicts in both sub-Saharan Africa [17,18,19,20,21] and elsewhere [22]. The causal mechanisms behind the effects of weather shocks on conflicts are sundry: crop yields [20], economic growth [17], government revenue [23], and migration [24].
A model that assesses carbon externality trades off the benefits associated with carbon emissions, largely stemming from associated energy use, with the costs, which can be categorized into market and nonmarket damages. Market damages refer to damages for marketed goods and services, such as property losses due to increased flood risks and declines in agricultural production due to temperature increases. Nonmarket damages include mortality, health, quality of life, as well as effects on environmental goods and services, habitats and ecosystems, and biodiversity. The discount rate captures the temporal dimension of paying at present to avoid future climate damages. To study this tradeoff, researchers have employed integrated assessment models (IAMs), one of whose many functions is to simulate a “causal chain” where carbon emissions lead to climate change and finally to climate damages [25].
Greater unpredictability of temperature resulting from climate change will likely lead to sustained increases in violence. Nevertheless, there does not yet exist any study that considers the cost of climate change-induced violence in computing the optimal carbon price systematically. Existing studies that assess the impact of climate change on mortality and morbidity effects focus on thermal stress, ozone exposure, diarrhea, labor productivity loss, and disease—but not violence [26]. To the author’s knowledge, there is only one study that considers one of the many forms of climate change-induced violence—violent crime—in the damage function, but the other types of climate-induced violence damages remain unaccounted [27] (Another study that is broadly related to the climate–conflict relationship focuses instead on a positive sociopolitical feedback loop [28]. Using the Dynamic Integrated Climate-Economy (DICE) model, it illustrates that climate-induced violence makes it harder to sign environmental treaties, including global climate treaties, which, in turn, jeopardizes climate change mitigation further. However, the study does not explicitly model the costs of violence, but it provides further evidence that the estimates of carbon externality reached in this paper are lower bounds).
Thanks to finely disaggregated and newly available data on the costs of a wide range and types of violence for different regions of the world, this paper seeks to internalize the costs of climate-induced violence in the IAM’s damage function to calculate the optimal carbon price. This paper then examines how the newly priced carbon externality impacts future temperature and the avoided damages from climate-induced violence for different regions of the world. To assess the effect of uncertainties inherent to projecting future carbon externalities, models are run for multiple sets of scenarios that differ in climate sensitivity, GDP growth rate, the WTP to avoid nonmarket climate damages, the inclusion/exclusion of nonmarket damages, the magnitude of the climate–violence relationship, and the catastrophic temperature—the temperature at which the entire regional product is wiped out.
It shall be noted that the relationship between climate change and the incidence of interpersonal and intergroup violence is under ongoing debate. Including a wider range of studies and deploying clearer methodological standards, the more recent reviews have concluded a significant and robust relationship between climate change and conflict across a wide range of spatial and temporal scales [12,29]. In the meantime, some question the criteria for case inclusion and the appropriateness of meta-analysis as a method to quantify climate-induced violence in these studies [30]. The debate continued in subsequent papers [31,32].
However, it is still a worthwhile exercise to calculate the optimal carbon price by incorporating the damage costs of a plausible relationship between climate and violence. The purpose of this exercise is not to provide precise predictions or propose a new carbon pricing policy. Rather, this study seeks to understand how any increased risk of violence associated with climate change may affect the tradeoff in choices relating to carbon emissions. It assesses model outputs under different assumptions about climate damages.

3. Methods

3.1. Definition and Data

This paper follows the World Health Organization (WHO), which defines violence as “the intentional use of physical force or power, threatened or actual, against oneself, another person, or against a group or community, that either results in or has a high likelihood of resulting in injury, death, psychological harm, maldevelopment or deprivation” [33]. The WHO records deadly violence in three general categories: self-directed violence, collective violence, and interpersonal violence. Here, the latter two types of violence are in focus, which correspond with the data on the costs of violence published in recent years by James Fearon and Anke Hoeffler [4,5,6]. Collective violence refers to violence perpetrated by organized groups, such as states, rebel organizations, terrorists, street mobs, or criminal organizations. Interpersonal violence refers to violence committed by an individual, which, depending on the relationship between the perpetrator and the victim, can be further broken down into intimate partner violence and child abuse.
This paper uses the cost estimations by Hoeffler [6], who relied on unit cost estimates for various types of violence (e.g., homicides, assaults, and rapes) in the United States by McCollister et al. [34] to estimate the cost of violence for the year 2013. Hoeffler extended the cost estimations to other countries by multiplying the US cost of homicide by the ratio of a country’s GDP to US GDP and then used data on violent events by global region to develop regional cost estimates of violence. There are assumptions associated with both the approach taken by Hoeffler and that by McCollister et al. McCollister et al. combined several approaches to pricing crimes, such as the cost of illness, contingent valuation, and jury compensation methods, and all of these approaches assume that the impacts of crimes are fully understood (The cost of illness approach tries to quantify the tangible costs of crime on outcomes of interest based on the best available information, which usually comes from self-reports from the victims and assigned prices. Similarly, the jury award approach seeks to assess the total social cost of crime by employing actual compensation from civil personal injury cases. Contingent valuation involves surveys to gauge respondents’ willingness to pay to avoid different crimes, which, in theory, should provide a measure of both tangible and intangible costs). Hoeffler’s approach also comes with nontrivial assumptions. First, applying social costs of homicide to calculate the costs of deaths from collective violence equates two drastically different types of death, which generate different social losses. Second, using the ratio of GDPs to map US-based estimates into other countries, especially non-high-income countries, ignores fundamental differences across geographies such as life expectancy, which would affect the social loss of homicidal and non-homicidal offenses. Violence is often of greater concern to and considered “worse” for richer countries than lower-income ones.
Despite these nuances, the estimates made by Hoeffler and Fearon are arguably the most comprehensive at the time of this writing. There is also a long tradition of using simple benefit transfer in the IAM literature to develop first-order approximations [35,36]. Specifically, IAMs often require transferring estimates from developed countries with greater data availability to developing countries with less availability of data.
With that in mind, it is worth noting that the cost estimates of violence likely lie on the lower-bound of the real costs. As detailed by McCollister et al. [34], which estimates most tangible and intangible losses, excludes such costs as psychological injury and additional costs associated with sexual violence (e.g., sexually transmitted infections, pregnancy, suicide, and substance abuse) [34]. This exclusion is transported into Hoeffler’s estimates. Furthermore, in Hoeffler’s calculation, self-directed violence costs are excluded and so are some relevant costs in cases where data is unavailable. These include the cost of war injuries, widespread destruction of infrastructure in a war, and economic and security concerns resulting from war, in addition to the costs of nonfatal domestic violence against women and children, violence perpetrated by women against their male partners, and violence amongst homosexual couples. In addition to the missing items specified by Hoeffler, scholarly classics in the social sciences enlighten us that one critical example of valuing the invaluable or pricing the priceless involves measuring the decline or loss of social capital. First put forth by Alexis de Tocqueville, the concept of social capital was developed further by Robert Putnam [37,38]. Social capital refers to “features of social organization such as networks, norms, and social trust that facilitate coordination and cooperation for mutual benefit” [38]. The benefit of social capital is complicated to quantify because measures such as the number and membership size of associations cannot precisely fathom the frequency and quality of association. Violence provides a negative drag on social capital. Hence, any empirical attempt to quantify the costs of violence will lack most intangible costs, and existing estimates are best understood as appropriate underestimates.
I group the various costs into market damages (e.g., GDP losses from war, economic costs of medical care, criminal justice system, and lost income) and nonmarket damages (e.g., deaths from war, fear) as percentages of GDP for seven regions of the world in Table 1. (It is plausible that war deaths entail both nonmarket and market losses. Losses from deaths from war are grouped into nonmarket damages to stay consistent with Hoeffler’s method of using intangible costs. Hoeffler calculated the costs of the lives lost in civil wars by “multiplying the number of fatalities by the cost of homicide,” whose “intangible cost…is assumed to be $8.44 million, and this value is inflated to 2013 prices and scaled by the relative GDP ratio to approximate the cost of homicide across different countries” [34]).

3.2. The Relationship between Climate Change and the Incidence of Violence

In their meta-analysis of the 60 most quantitatively rigorous studies of 45 different conflict datasets, Hsiang, Burke, and Miguel collected findings across a wide range of conflict outcomes that spanned from 10,000 BCE to the present day and across all major regions of the world [12]. They identify that the median effect of a one-standard-deviation increase from normal temperature (i.e., 0.5 °C) induces a 14 percent rise in the frequency of intergroup conflict and a 4 percent increase in the incidence of interpersonal violence globally (While the median effect on intergroup conflict is higher than that on interpersonal violence, the base number of incidents of interpersonal violence is substantially higher; in other words, a small percentage rise can entail a massive increase in total incidents). Based on these figures, the rate of the incidence of climate-induced violence at time t , υ ( t ) , can be expressed as a function of temperature increase at time t from the pre-industrial level, a t p ( t ) , and as a multiple of the rate of climate-induced violence in the pre-industrial period (In the version of MERGE used in this paper, a t p ( t ) does not include annual variability. This is an area where future research can improve). Suppose that the rate for the pre-industrial period is “1,” the median rate of intergroup violence, υ ( g r o u p ,   t ) , and the median rate of interpersonal violence, υ ( p e r s o n ,   t ) , can be expressed as the following (While some studies identify climate change to have an approximately linear effect on conflicts [39], Hsiang, Burke, and Miguel elaborate that reported linear relationships should be interpreted as local linearizations of a global relationship that is nonlinear and possibly curved [12]. Future extensions of this study can evaluate carbon externality under the assumption of a linear climate-conflict relationship):
υ ( g r o u p ,   t ) = 1.14 a t p ( t ) 0.5
υ ( p e r s o n ,   t ) = 1.04 a t p ( t ) 0.5
In order to factor in the uncertainty represented in Hsiang et al.’s estimates, I would expect to run the model to optimize over the uncertainty in the climate–violence response. This feature is not yet built-in for the version of the model used in this paper. Nevertheless, this paper will try to account for uncertainty by replacing the median estimates in Equations (1) and (2) with high- and low-bound estimates of the climate–violence response in Section 4.6.

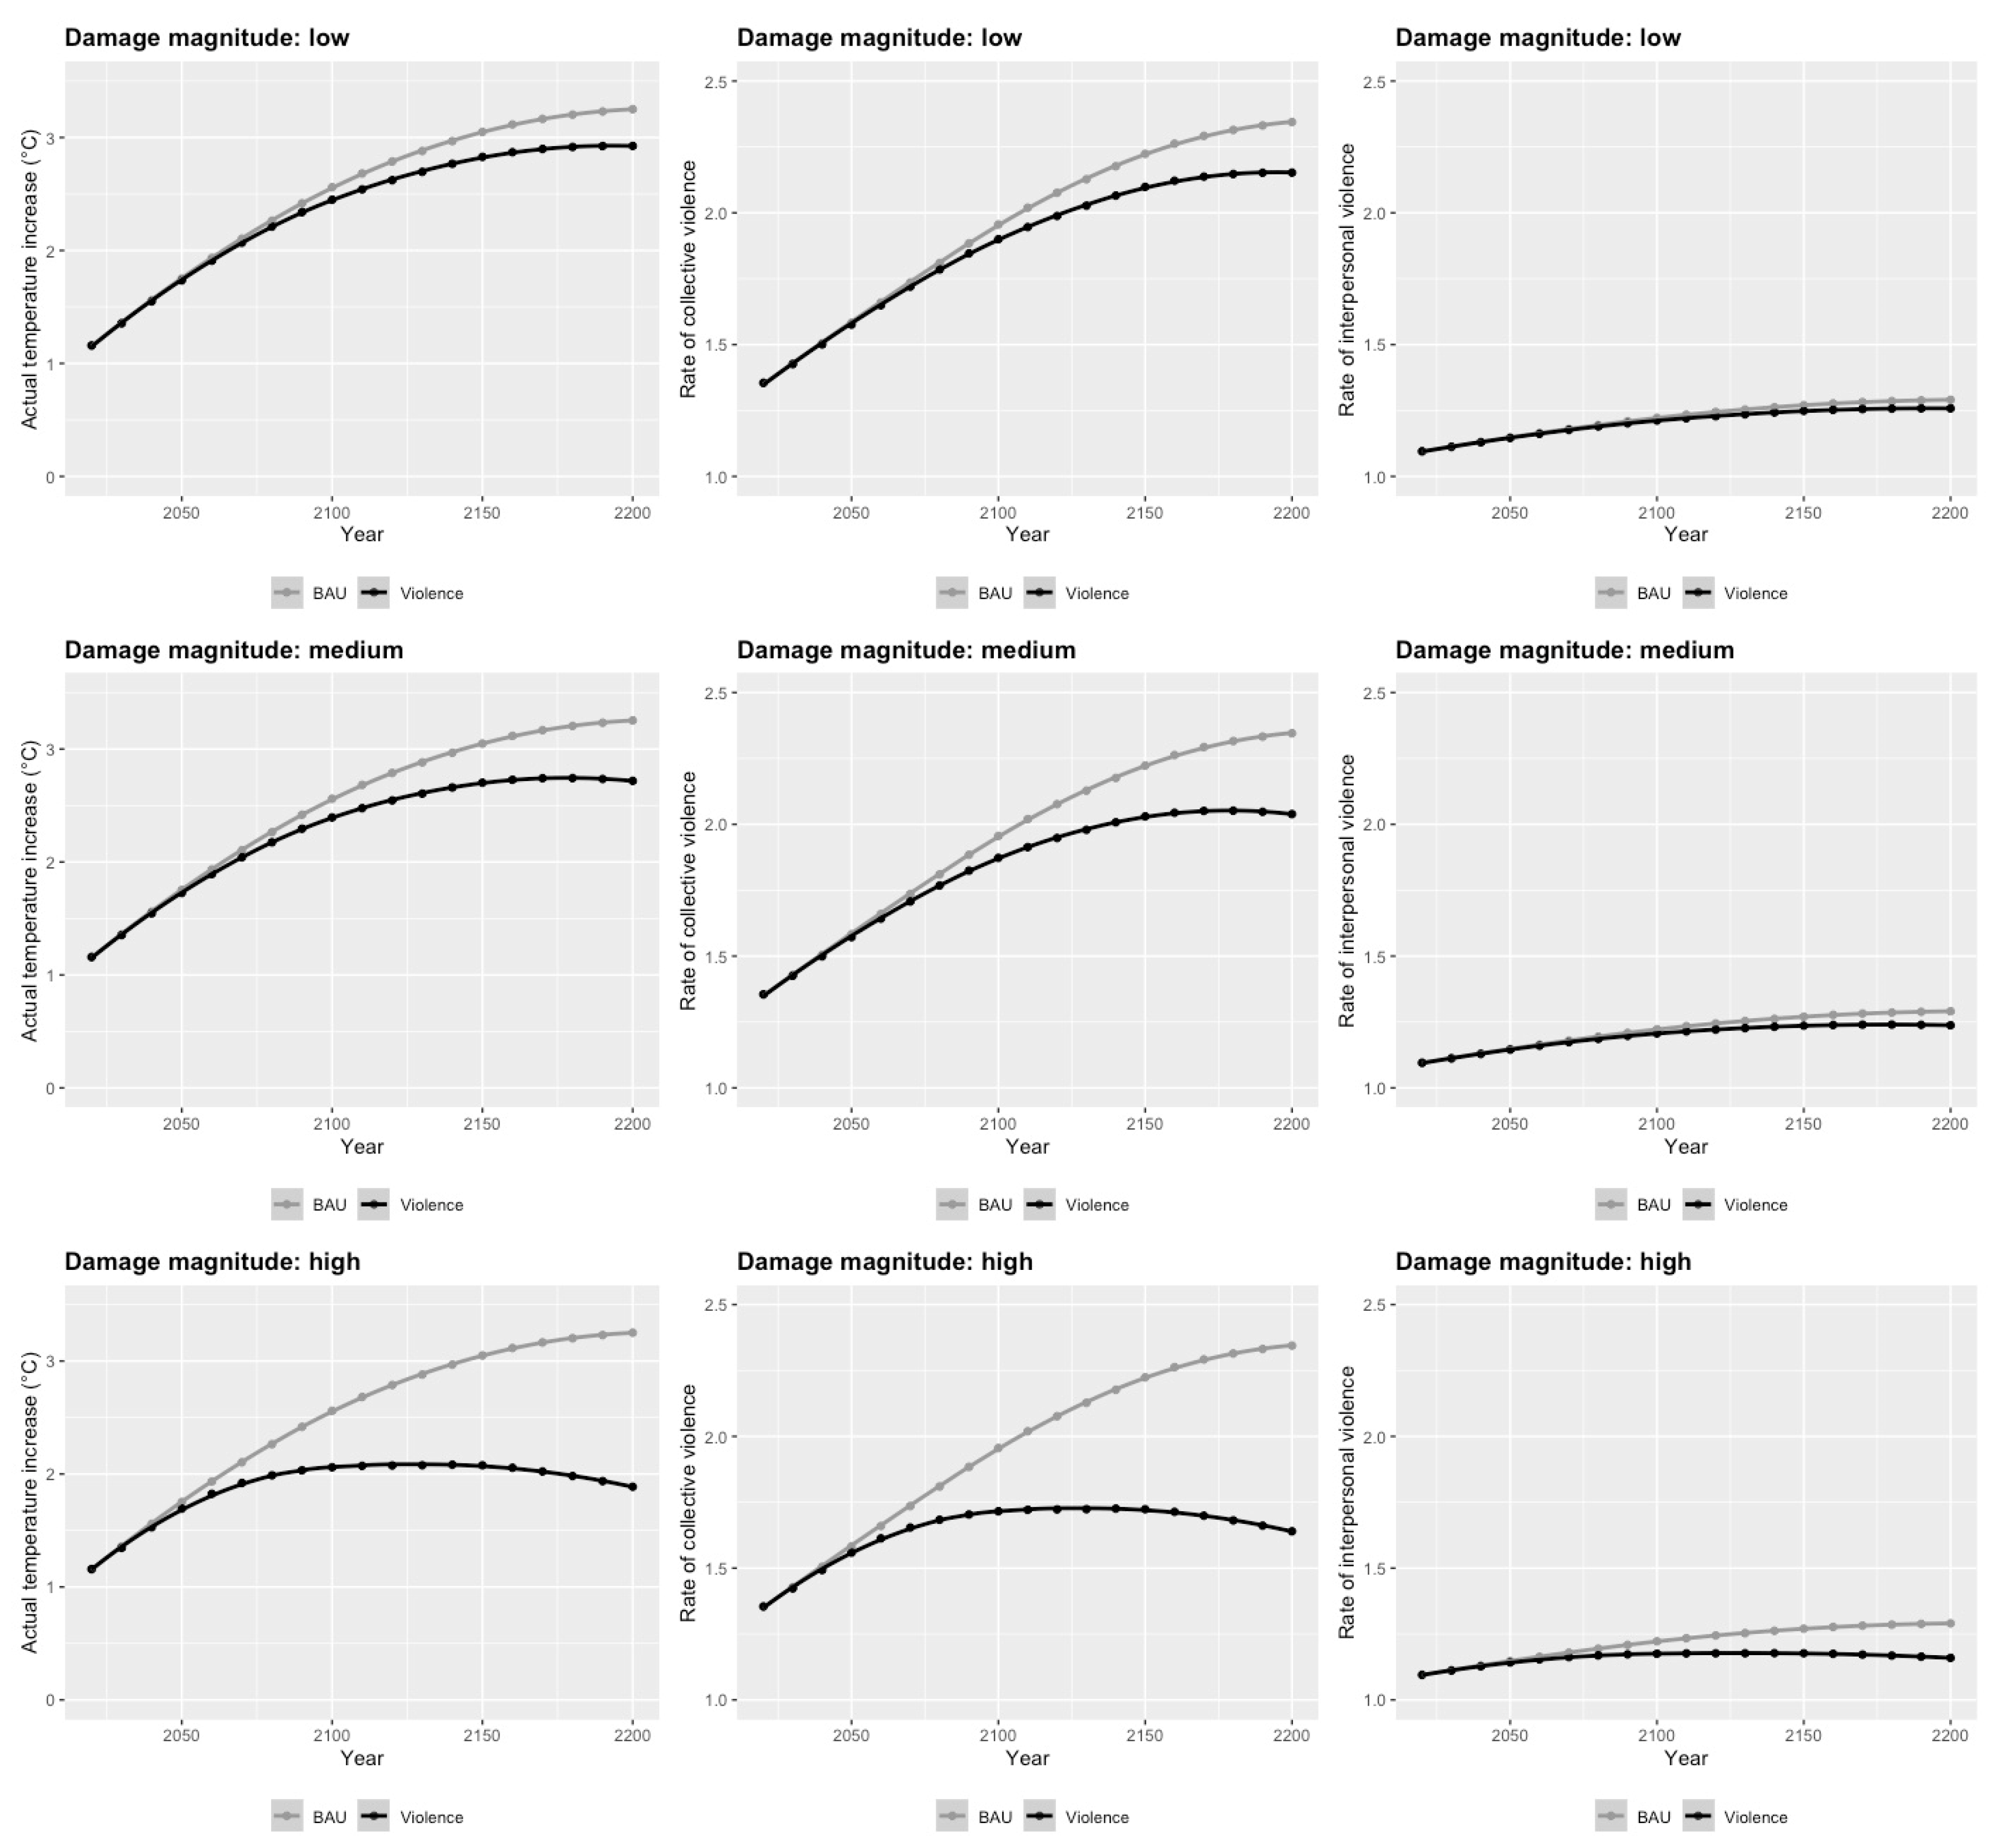
3.3. Internalization of the Costs of Climate-Induced Violence into the Damage Function of the IAM

The IAM chosen for this research is Model for Evaluating Regional and Global Effects (MERGE) of GHG reduction policies, an intertemporal general equilibrium model that optimizes discounted utility. It was initially developed at Stanford University and has led to a significant amount of scholarship. It has a relatively detailed climate module, allowing for sufficient flexibility for an alternative view on a wide range of contentious issues, including damages from climate change. The version of the model used in this paper is the same version used in the Stanford Energy Modeling Forum Study (EMF 27) [40], which modified the original version [41] by incorporating more features, refining the global regions, and updating some data. More details on the EMF 27 MERGE model can be found in the online appendix of Blanford et al. (2014) [40]. The EMF 27 global regions include Canada–Australia–New Zealand (Other OECD), China, the Greater European Union, Group 3, India, Japan, the Rest of Asia, the Rest of the World, and the United States (The global regions in the original MERGE model are the USA, other OECD countries (Western Europe, Japan, Canada, Australia, and New Zealand), FSU (the former USSR), China, and the ROW (rest of the world) [41]). Canada–Australia–New Zealand, the Greater European Union, Japan, and the United States are high-income and thus are assigned costs of violence values based on Hoeffler’s estimates for the “High Income” region. The climate damages already represented in the model do not include those from violence, so it does not appear necessary to remove any portion of the damage functions for this paper [41].
The modeling process operates in either the benefit-cost mode, which considers climate damages and GHG mitigation costs, or the cost-effective mode, which finds the least-cost emissions mitigation pathway to satisfy a climate-related constraint, such as a limit on concentrations or temperature rise. This study opts for the benefit-cost mode because it seeks the socially optimal price of carbon, given the assumptions, needed to internalize the externalities associated with climate change and maximize the net benefit to society. It does so by invoking the damage module, where damages are calculated from temperature, which influences current production. The objective function below represents the discounted utility of consumption in a given global region after allowing for the disutility of climate change or damages from climate change:
D i s c o u n t e d   u t i l i t y = t = 1 T U ( c ( t ) ) ( 1 + ρ ) t
where U stands for the single-period level of utility or social well-being; c ( t ) is the flow of consumption at time t ; ρ represents the rate of time preference for utility.
The carbon price is calculated endogenously in the optimization process. An increase in temperature contributes to climate damage, resulting in a higher carbon price. A higher carbon price then exerts pressure on the producers, forcing them to reduce emissions, which leads to a slowed temperature increase. The loop continues until the algorithm finds the optimal carbon price, which is the one that will yield the highest discounted utility.
The market and nonmarket damages are modified separately for the climate module. The abstract representation of damages is introduced and discussed in Manne, Mendelsohn, and Richels (1995), which is a high-level representation designed to focus on the core tradeoffs. Building on Manne, Mendelsohn, and Richels (1995), the function for market damage in global region i at time t , M D ( i ,   t ) , can be expressed as:
M D ( i ,   t ) = α ( i ) × g d p ( i , t ) × a t p ( t ) δ
where α ( i ) is the default market damage factor in given region i , which is represented by the proportion loss in GDP; g d p ( i , t )   is the GDP in a given region i at a given time t ; a t p ( t ) is actual temperature increase from the pre-industrial period at a given time t ; δ is the reference temperature for market damage coefficients, which by default equals 2 °C.
To account for the market damages of climate-induced violence, the new market damage factor γ ( i ) is created in the following way:
γ ( i ) = α ( i ) + β ( i )
where β ( i ) refers to the market damage factor from climate-induced violence, both collective and interpersonal. The new market damage is expressed as:
M D n e w ( i ,   t ) = γ ( i ) × g d p ( i , t ) × a t p ( t ) δ
The nonmarket damages of climate-induced violence are accounted for similarly. The economic loss factor (ELF), which is a component of the nonmarket damage function, hinges on two parameters, c a t t and h s x [42], and is calculated as follows:
E L F ( i , t ) = [ 1 ( r e f t e m p c a t t ) 2 ] h s x ( i , t )
            = [ 1 N M D ( r e f w t p ) × ( a t p ( t ) N M D ( r e f t e m p ) ) 2 ] h s x
where NMD stands for non-market damage; r e f w t p is the reference willingness to pay as a fraction of consumption, with a default value of 0.04 in MERGE; r e f t e m p is the reference temperature rise relative to the pre-industrial level for non-market damages, with a default value of 2 °C; c a t t is a catastrophic temperature parameter chosen in such a way that the entire regional product is wiped out, which is 10 °C by default; h s x is the hockey-stick parameter, representing the quadratic loss due to temperature increase, whose default value is 1. The ELF represents the fraction of consumption that remains available after accounting for nonmarket damages for conventional uses.
The modified ELF function, E L F n e w ( i ) , would subtract from the original ELF, E L F ( i ) , the nonmarket damage factor relating to the nonmarket portion of climate-induced violence damages, ζ ( i ) . Subtraction rather than addition applies here because ELF represents the remaining consumption for society. E L F n e w ( i ) is calculated as follows:
E L F n e w ( i ) = E L F ( i ) ζ ( i )
The β ( i ) and ζ ( i ) are calculated by combining the relationship between climate change and the incidence of violence [12] and the costs of collective and interpersonal violence as fractions of GDP for different regions of the world [6]. For given region i , the β ( i ) and ζ ( i ) can be expressed based on Equations (1) and (2) as:
β ( i ) = β ( g r o u p , i ) × υ ( g r o u p ,   t ) + β ( p e r s o n ,   i ) × υ ( p e r s o n ,   t )
ζ ( i ) = ζ ( g r o u p , i ) × υ ( g r o u p ,   t )   + ζ ( p e r s o n , i ) × υ ( p e r s o n ,   t )
where β ( g r o u p , i ) refers to the part of market damage factor from climate-induced intergroup violence and β ( p e r s o n ,   i ) is the part of market damage factor from climate-induced interpersonal violence. Similar designations apply for ζ ( i ) .

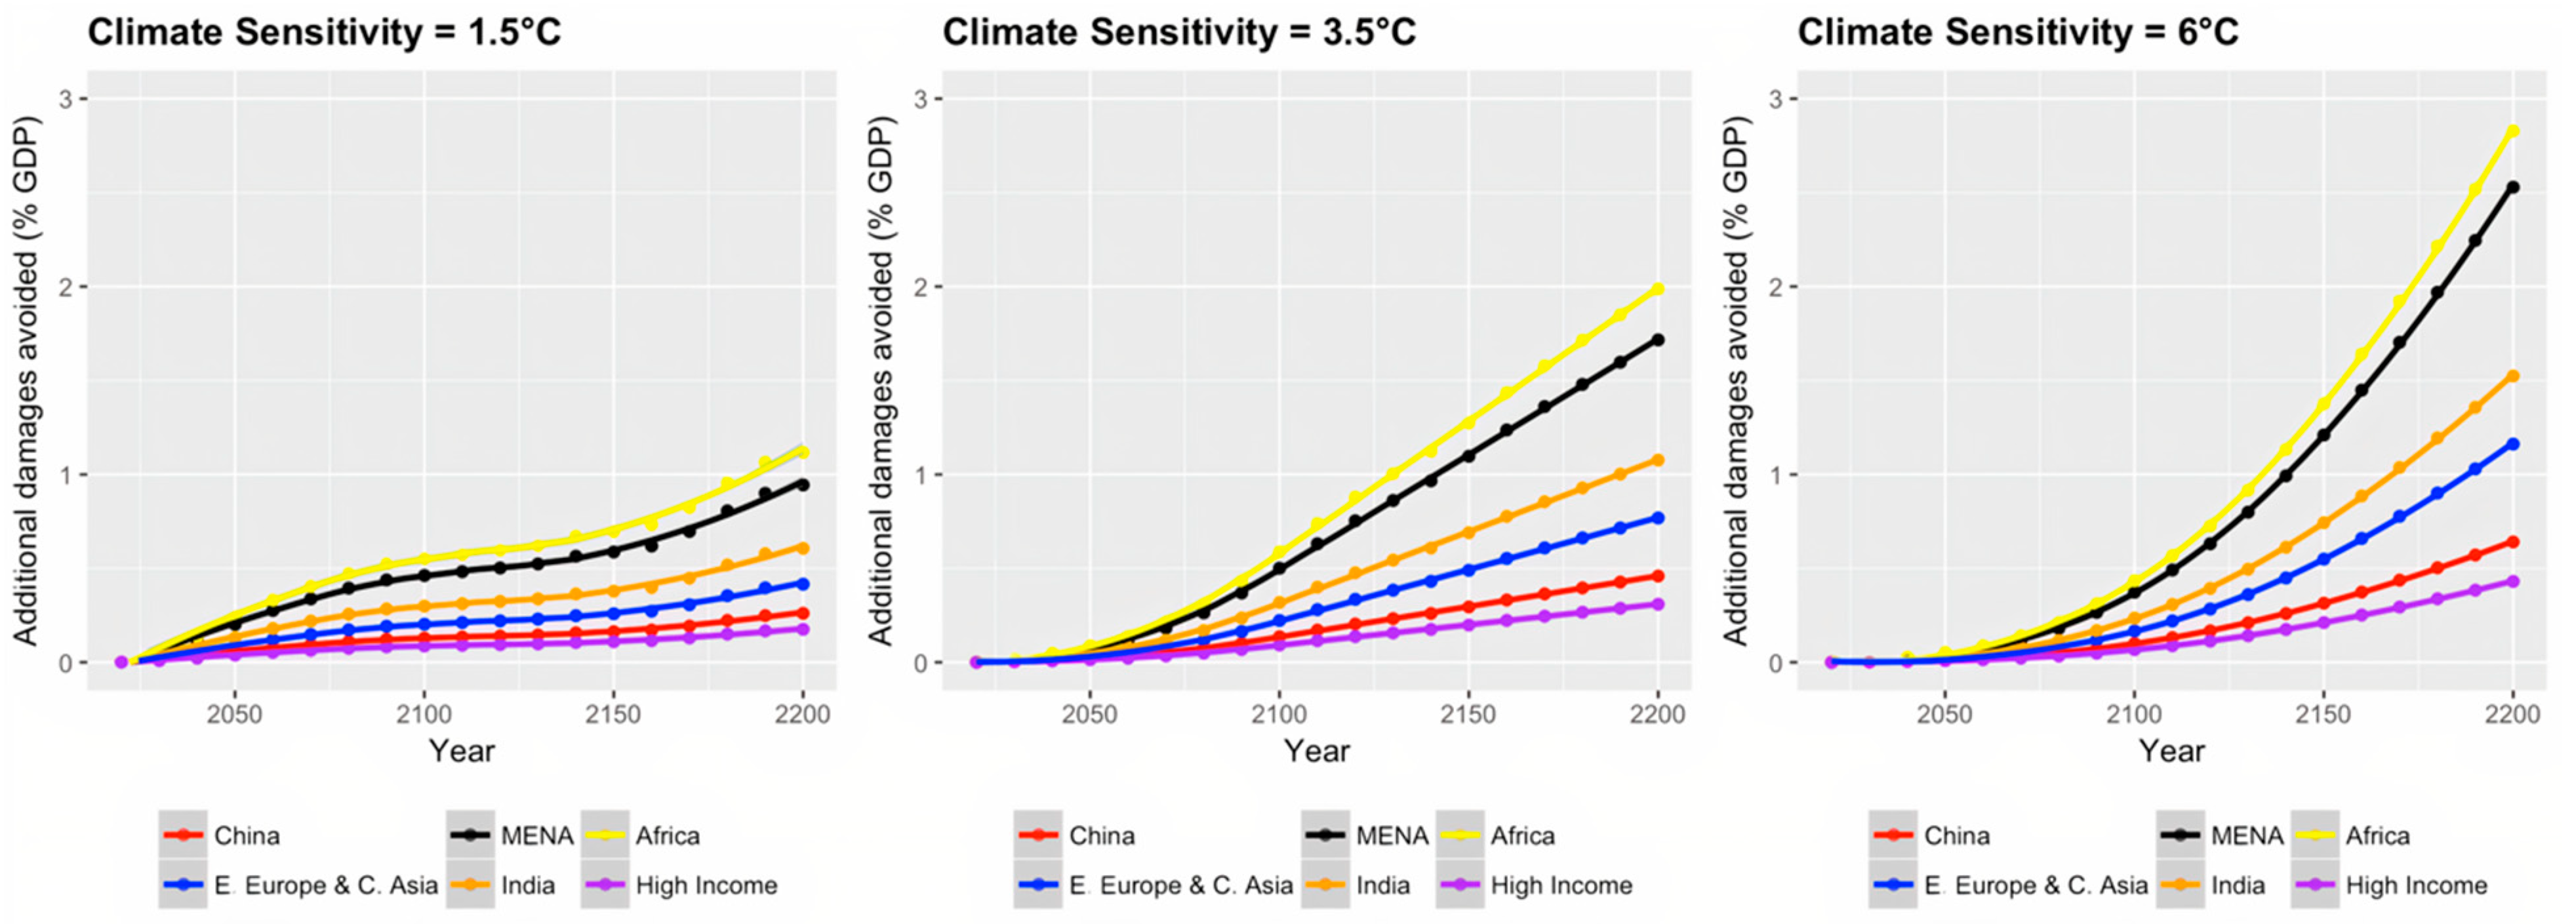
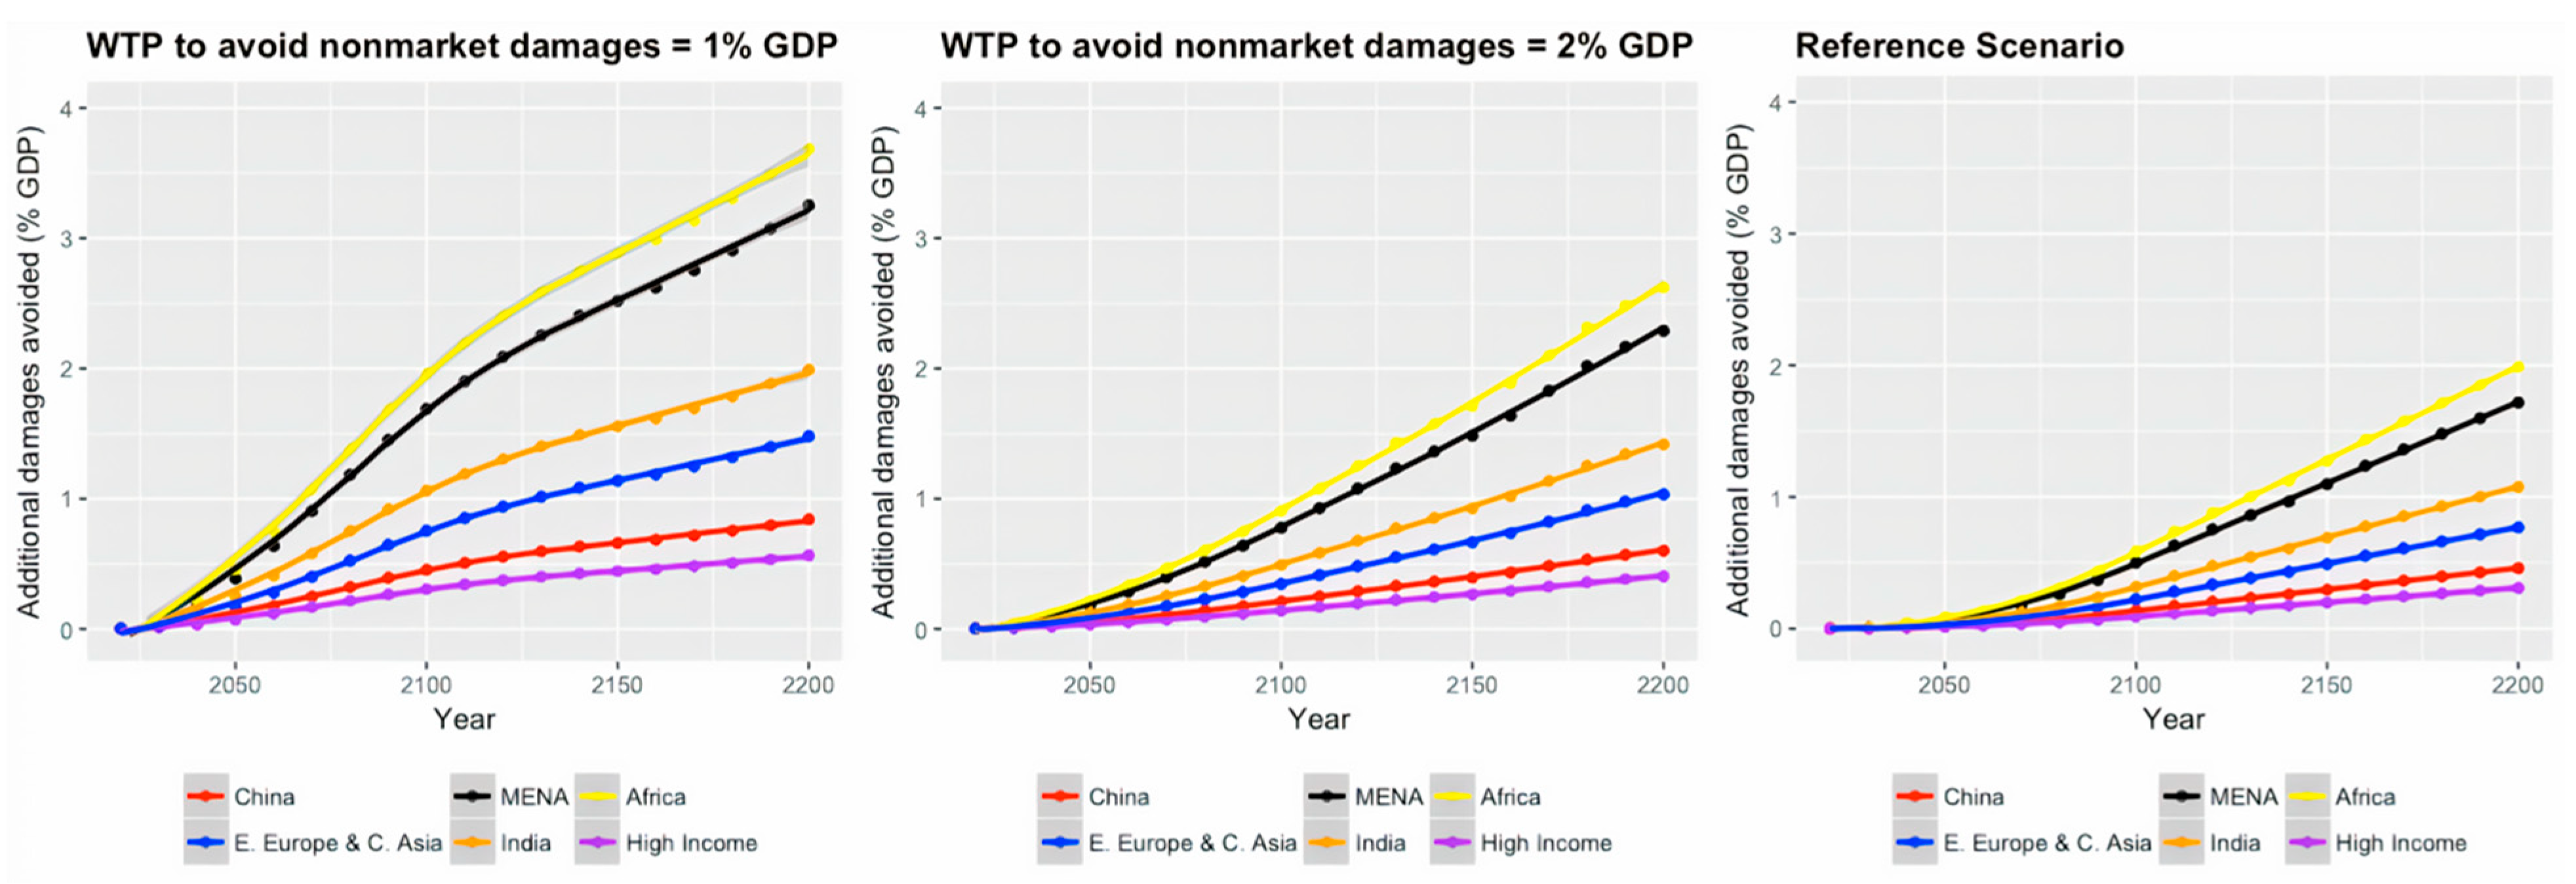
3.4. Avoided Damage from Internalization

To assess the normative significance of a slowed temperature increase, I calculate the avoided damage from climate-induced violence as a percentage of regional GDP for region i at time t , Δ D a m a g e ( i , t ) g d p ( i , t ) . The avoided damage is the difference in climate damages as a percentage of regional GDP between the Violence scenario and the Business as Usual (BAU) scenario, where the former internalizes the costs of climate-induced violence while the latter does not (For each global region, the MERGE model uses an exogenous trajectory for reference economic growth. For more information, please refer to the online appendix of Blanford et al. (2014)). For a given region i at time t , Δ D a m a g e ( i , t ) g d p ( i , t ) can be expressed as:
Δ D a m a g e ( i , t ) g d p ( i , t ) = D a m a g e V i o l e n c e ( i , t ) D a m a g e N o V i o l e n c e ( i , t ) g d p ( i , t )

4. Updating the Carbon Externality and Its Effects under Different Scenarios

This section presents changes in model outcomes when the social costs of climate-induced violence are internalized vis-à-vis when they are not. For each scenario, this paper seeks to compare BAU and Violence scenarios to calculate the avoided damages. This paper presents results under the default assumptions first and then performs five sets of sensitivity analyses: climate sensitivity, GDP growth rate, the WTP to avoid nonmarket climate damages, the inclusion/exclusion of nonmarket damages, and the assumption about the catastrophic temperature at which the WTP at infinite income reaches 100 percent.
While the built-in horizon for MERGE is 2200, most of my reporting of values will be more near-term—until 2050—though projected values are shown up until 2200. Scholars and practitioners may disagree among themselves as to the most appropriate time horizon within which to interpret values. Some believe that near-term values are likely of more interest to policymakers because the further we look into the future, the more pronounced the model uncertainty (i.e., uncertainty regarding the representation of the climate) and the scenario uncertainty (i.e., uncertainty regarding people and their actions). On the other hand, policymakers in the United States, for instance, use a 300-year time span. Uncertainty is not a reason to look at a shorter time horizon, as uncertainty should lead policymakers to take more aggressive climate action via risk premiums and option value. In that light, the 200-year time horizon in MERGE would be short unless the discount rate is relatively high. Either way, it is worth noting that the doubling of the optimal carbon price in the Violence scenario vis-à-vis the BAU scenario holds across time between 2020 and 2200.

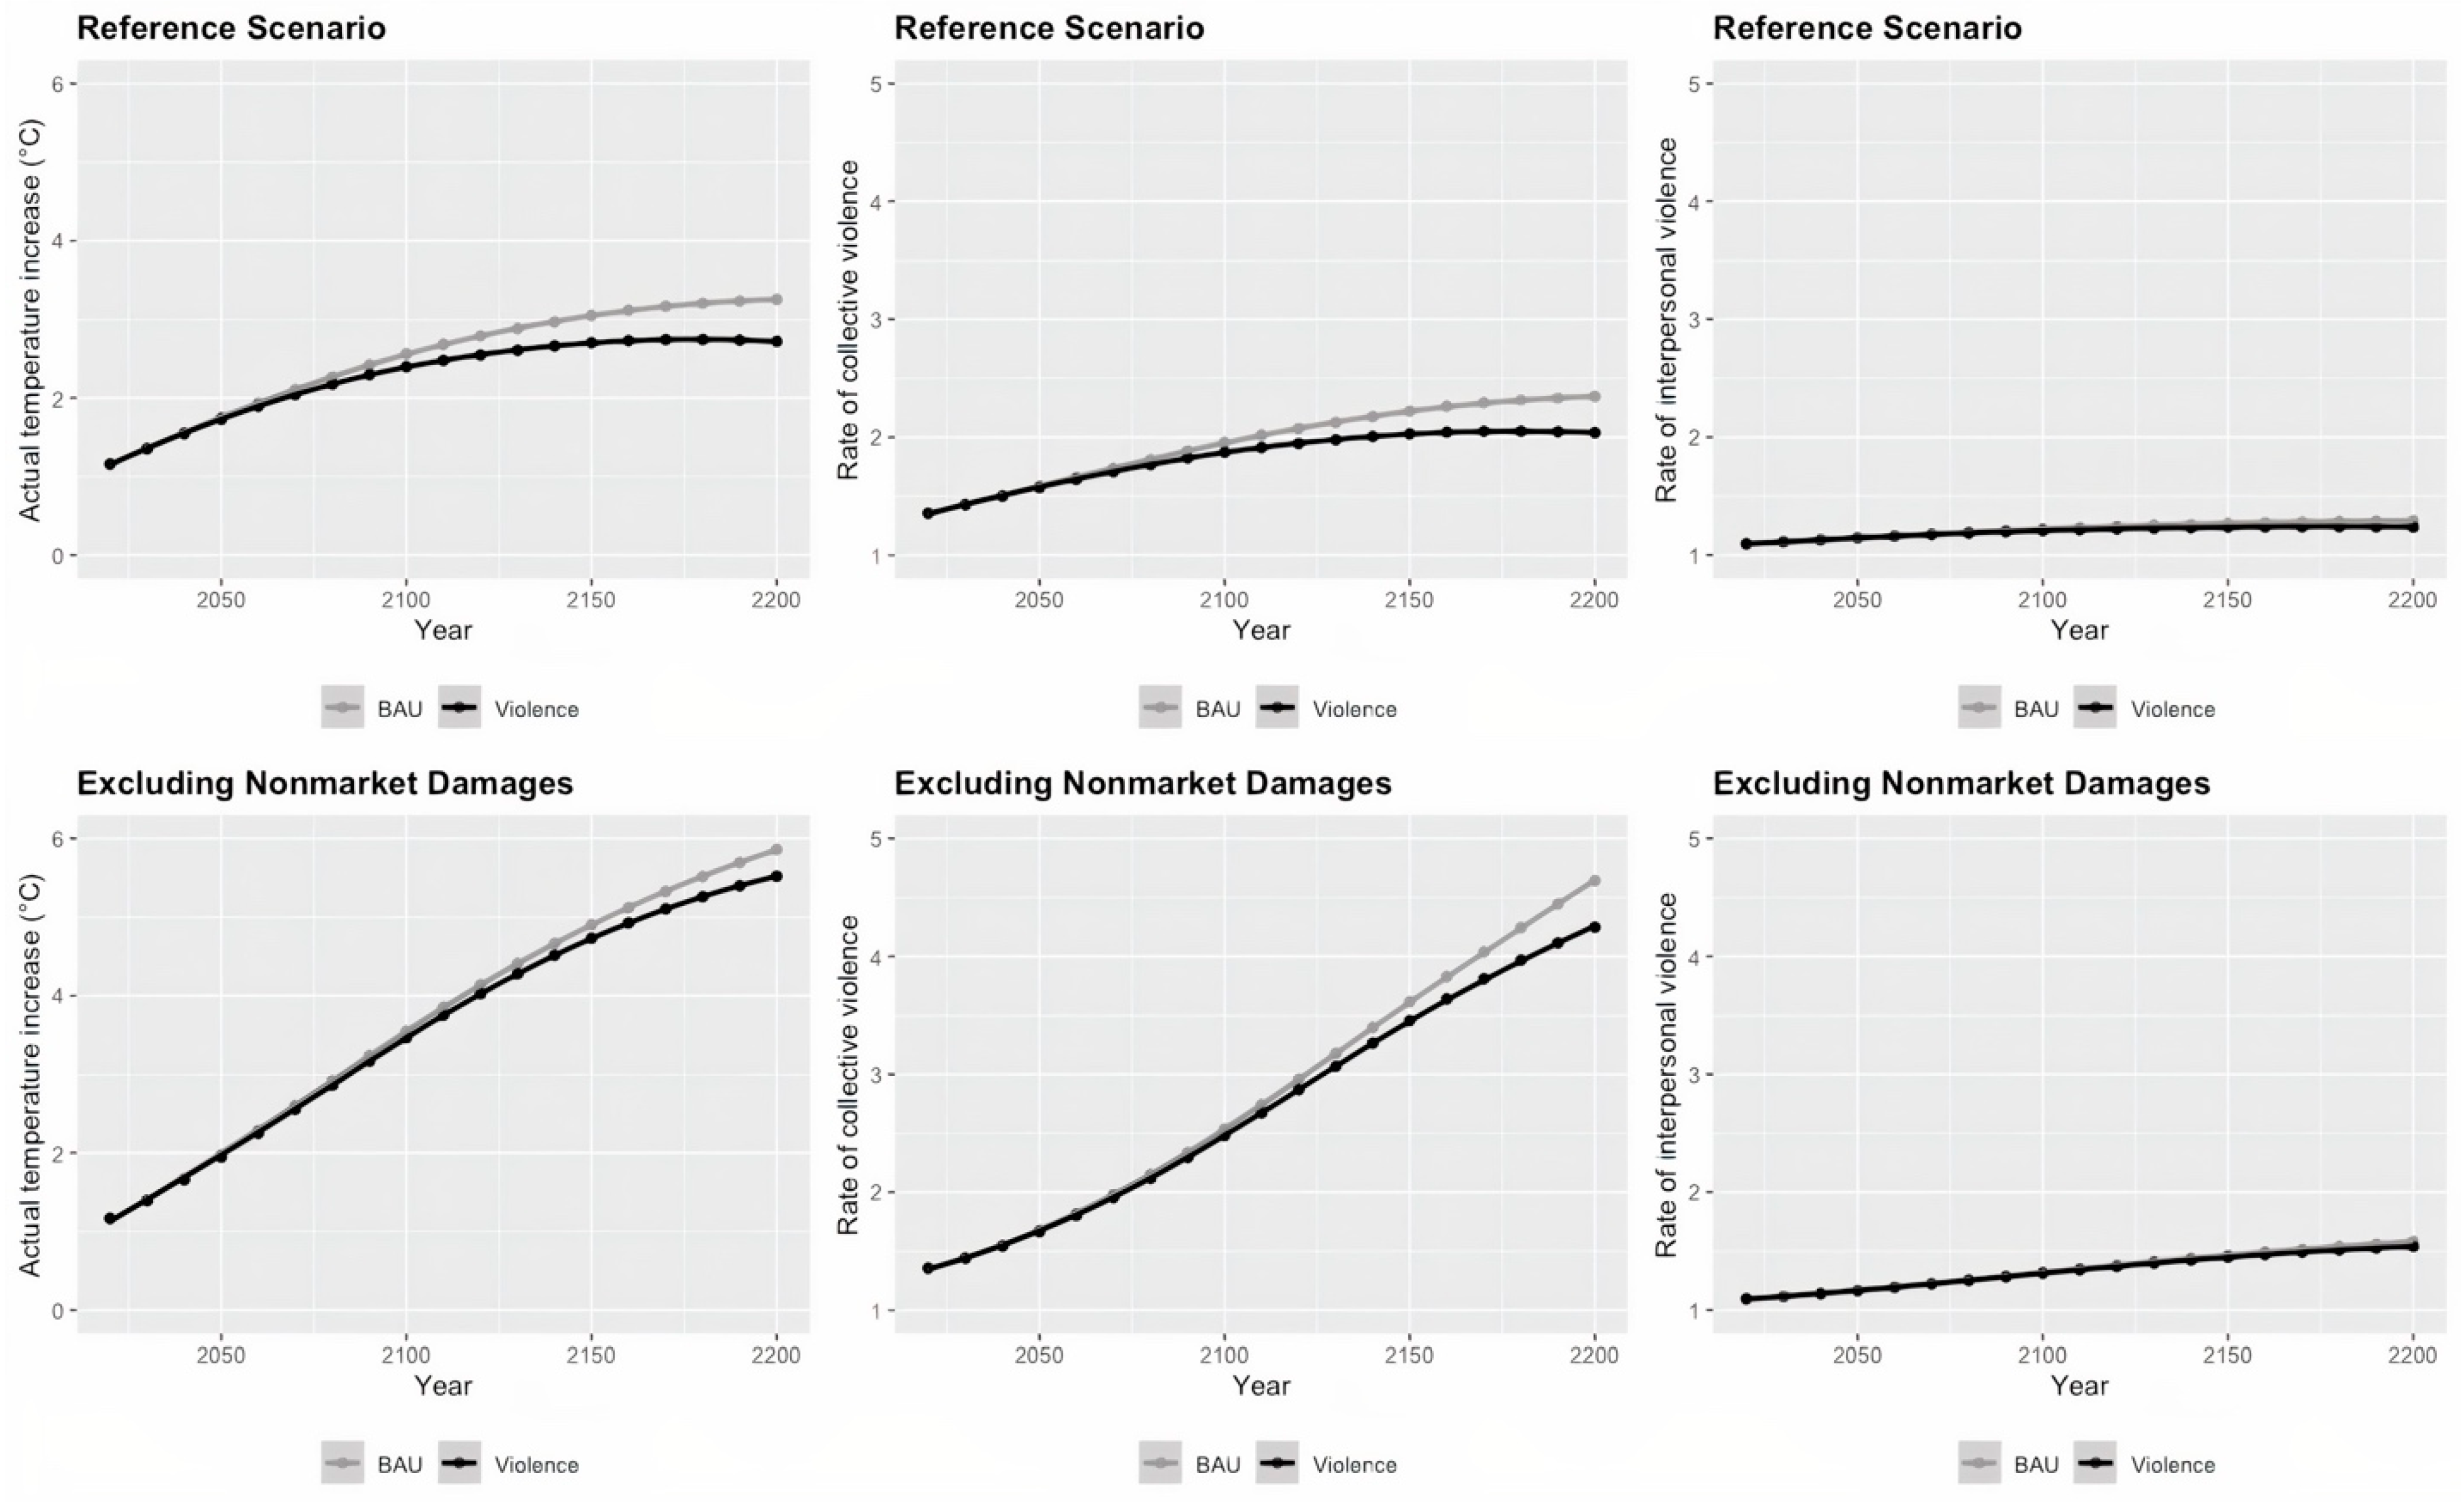
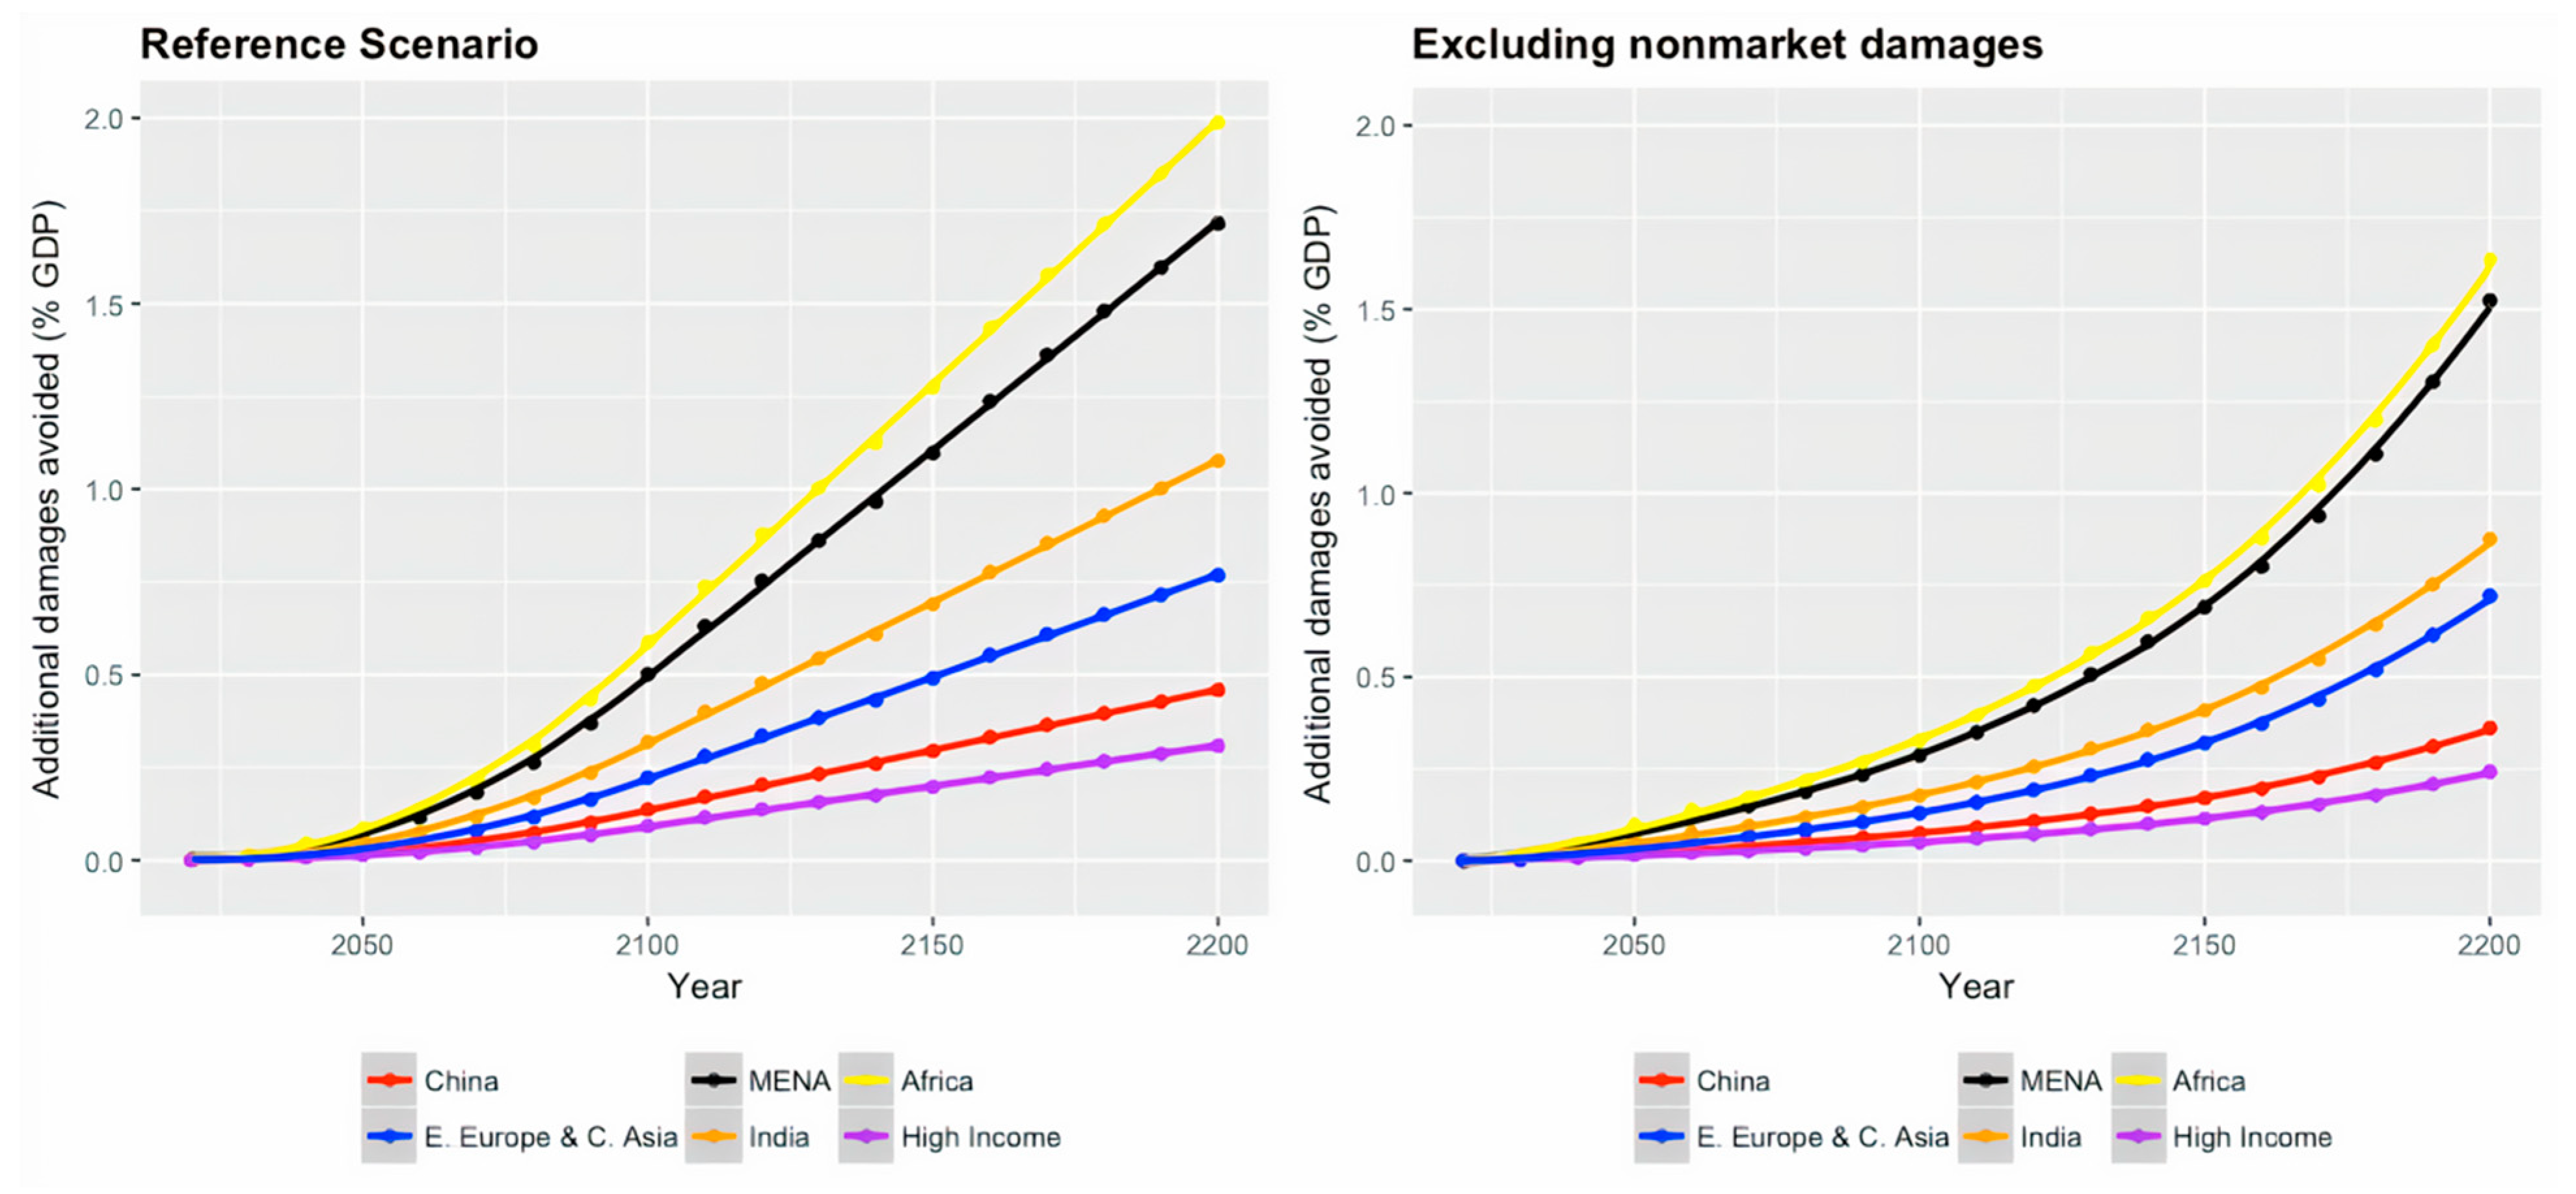
4.1. Reference Scenario

I begin with projections for the reference scenario, where all variables other than the market and nonmarket damage factors are left to their default values. The model prices the externality of carbon for all regions of the world. Since the model output carbon prices are un-normalized and the rise in carbon price over time is largely driven by economic growth, it is important to focus on relatively how much larger endogenizing the costs of climate-induced violence would increase the optimal carbon price. Hence, I calculate the ratio of carbon prices in the Violence scenario and the BAU scenario. Figure 1 suggests that internalization consistently raises the optimal carbon price to 1.8 times (i.e., a near doubling) during the 2020–2200 period.
With the cost of violence internalized, the optimal path of the model shows a lower speed of temperature increase. The projected temperature increases for both the BAU and the Violence scenarios are 1.16 °C in 2020; the values diverge to 1.75 °C and 1.73 °C in 2050, respectively (Figure 2). Based on Equations (1) and (2), the trajectories for temperature give rise to the projected trends for the rates of collective and interpersonal violence, represented as multiples of that in the pre-industrial period (i.e., the pre-industrial rate is “1”).
To assess the normative significance of a slowed temperature increase, I calculate the avoided damages from climate-induced violence as a percentage of regional GDP (Figure 3). The most prominent beneficiary is sub-Saharan Africa, which is projected to avert 0.09 percent of GDP loss from climate-induced violence in 2050 when the model assesses outputs after internalizing the costs of climate-induced violence. This figure of averted loss is about 14 percent of the region’s current incurred costs from collective violence, estimated by Hoeffler, to be at 0.63 percent of the regional GDP [6]. Sub-Saharan Africa is followed by the Middle East and North Africa, India, Eastern Europe and Central Asia, and China. High-income countries, while the lowest on the list, are estimated to be still able to avoid 0.01 percent of GDP worth of loss from climate-induced violence in 2050 with the new carbon pricing in place.

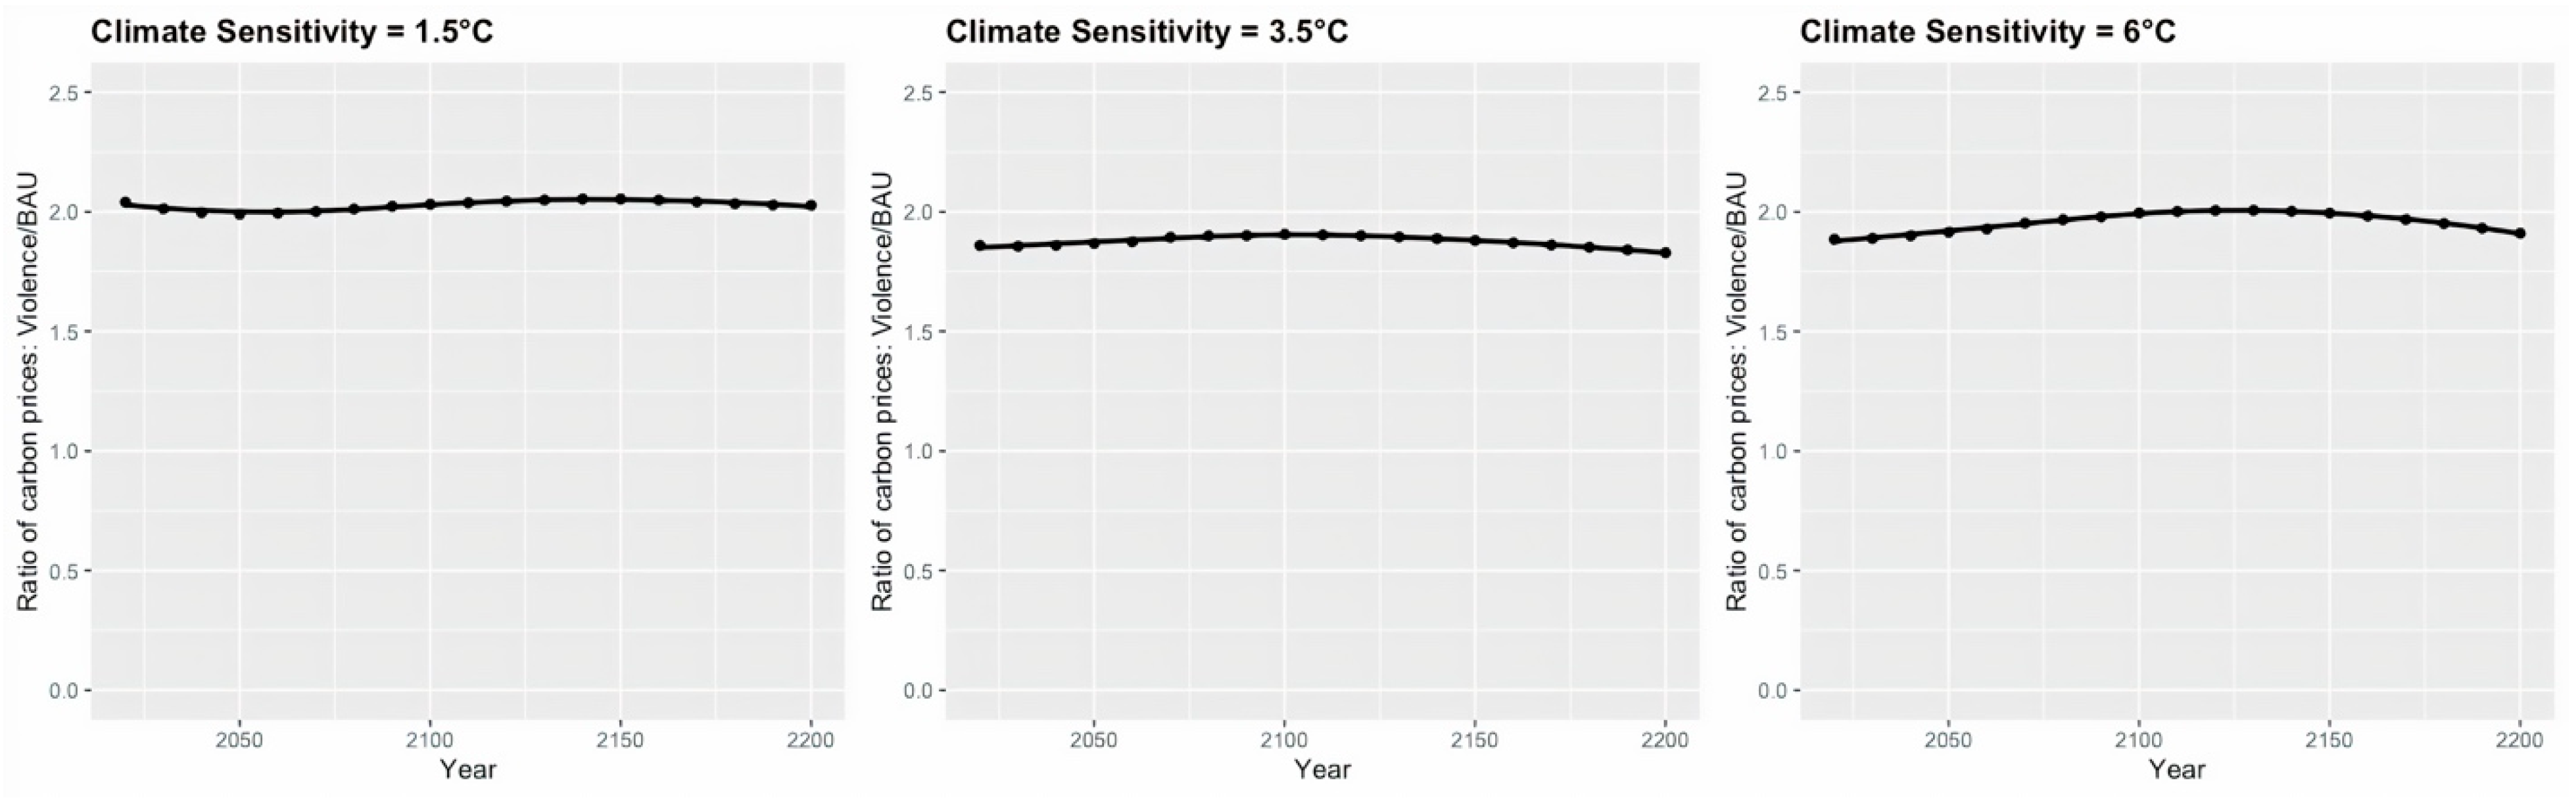
4.2. Sensitivity Analysis: Climate Sensitivity

The climate sensitivity, which is the equilibrium global mean surface temperature change following a doubling of atmospheric CO2 concentration, is 3.5 °C at default in MERGE (The value of climate sensitivity in MERGE is comparable to those in other IAMs, e.g., FUND at 3 °C, PAGE at 2.54 °C, DICE-2010 at 3.2 °C, and DICE-2013 at 2.9 °C, which are all clustered around the IPCC’s Fourth Assessment Report’s modal estimate of 3 °C [43]). The upper- and lower-bound values of climate sensitivity also explored are 1.5 °C and 6 °C. As shown in Figure 4, the relationship of a near doubling of the optimal carbon price due to the internalization of climate-induced violence costs holds across time in all three scenarios.
Under different climate sensitivity specifications, the projection of temperature increases vis-à-vis preindustrial levels in 2050 can reach 1.68 °C and 1.66 °C when the climate sensitivity is high and 1.21 °C and 1.14 °C when the climate sensitivity is low (Figure 5). With higher climate sensitivity, the projected rates of climate-induced violence during each time period are consistently higher. Under which assumption about climate sensitivity does endogenizing the costs of climate-induced violence yield the most reduced rates of violence? It depends on the time horizon. The rates for collective and interpersonal violence are most reduced at 0.03 and 0.01 in 2050 when the climate sensitivity is low, 0.08 and 0.02 in 2100 when the climate sensitivity is at default, and 0.54 and 0.07 in 2200 when the climate sensitivity is high.
Based on the trajectories of temperature and the rates of violence, I calculate the avoided damages from climate-induced violence as percentages of regional GDP under different climate sensitivity scenarios. Figure 6 suggests that in the long run, the higher the climate sensitivity, the higher the avoided damages from climate-induced violence as a percentage of regional GDP. When the climate sensitivity equals 1.5 °C, sub-Saharan Africa is projected to prevent 0.24 percent of GDP loss due to climate-induced violence in 2050. Under the assumption of a highly sensitive climate (6 °C), the percentage for Africa is estimated to reach 0.05 percent in 2050. At the other end of the spectrum, the avoided damages from climate-induced violence will be worth 0.04 percent of GDP when the climate is the least sensitive and 0.01 percent of GDP when the climate is the most sensitive in high-income countries.

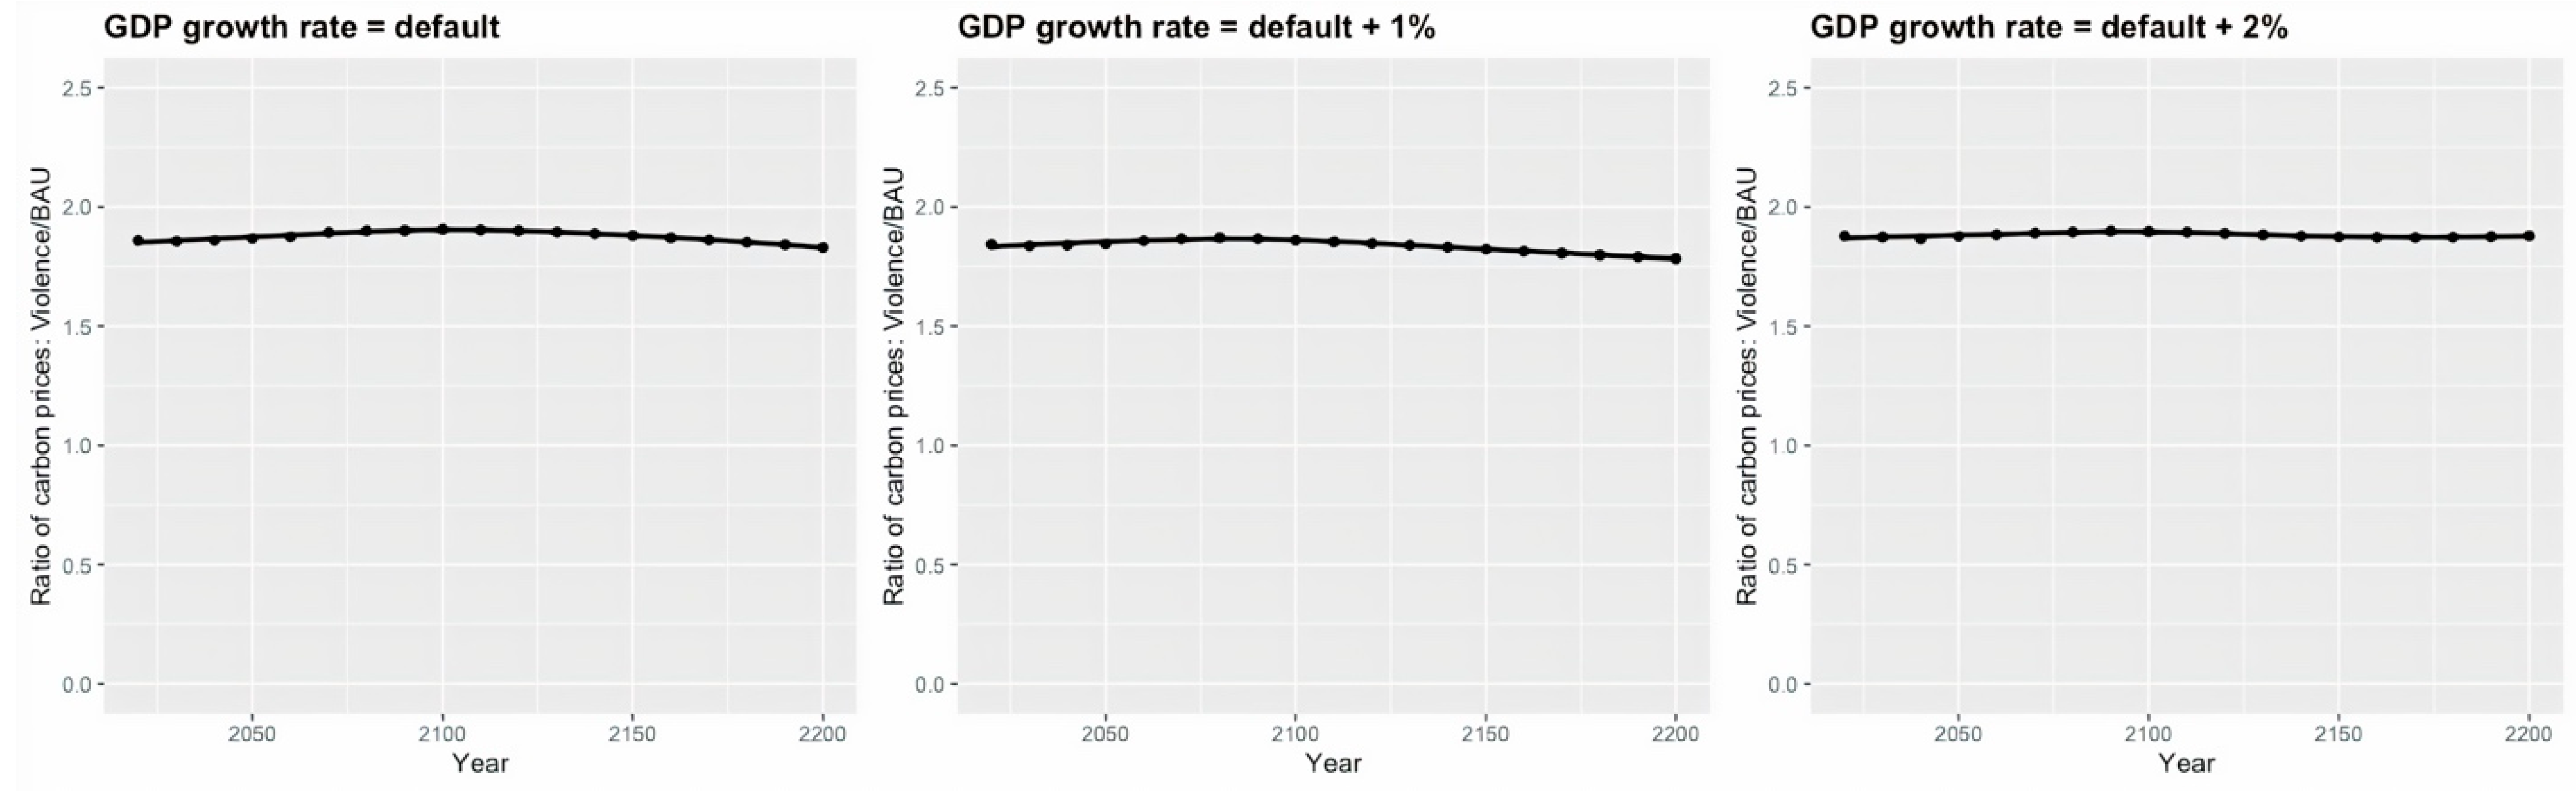
4.3. Sensitivity Analysis: GDP Growth Rate

The second dimension along which I seek to test the sensitivity of the results is the GDP growth rate. The default GDP growth rates in MERGE are increased by 1 percent and 2 percent. Figure 7 shows that accounting for climate-induced violence costs nearly doubles the pricing of carbon externalities, a relationship that remains robust across time and growth rate scenarios.
The higher the GDP growth rate, the higher the optimal carbon prices (even after normalization), which lowers the projected temperature increases. When the default GDP growth rate is incremented by 2 percent, the expected temperature increases are 1.72 °C and 1.71 °C in the BAU and the Violence scenarios in 2050, respectively (Figure 8). When the GDP growth rate is at default or is incremented by 1 percent, the rate of collective violence is reduced by 0.01 in the Violence scenario vis-à-vis the BAU scenario in 2050.
The avoided damages from climate-induced violence as percentages of regional GDP are projected to decrease as the GDP growth rate increases (Figure 9). It is also worth noting that when the GDP growth rate is incremented by 2 percent, the avoided costs are negative in 2020, 2030, and 2040. That means that during those time periods internalizing climate-induced violence in generating the optimal carbon price would cause more damages from climate-induced violence. Nevertheless, the payoffs become evident in the longer run.

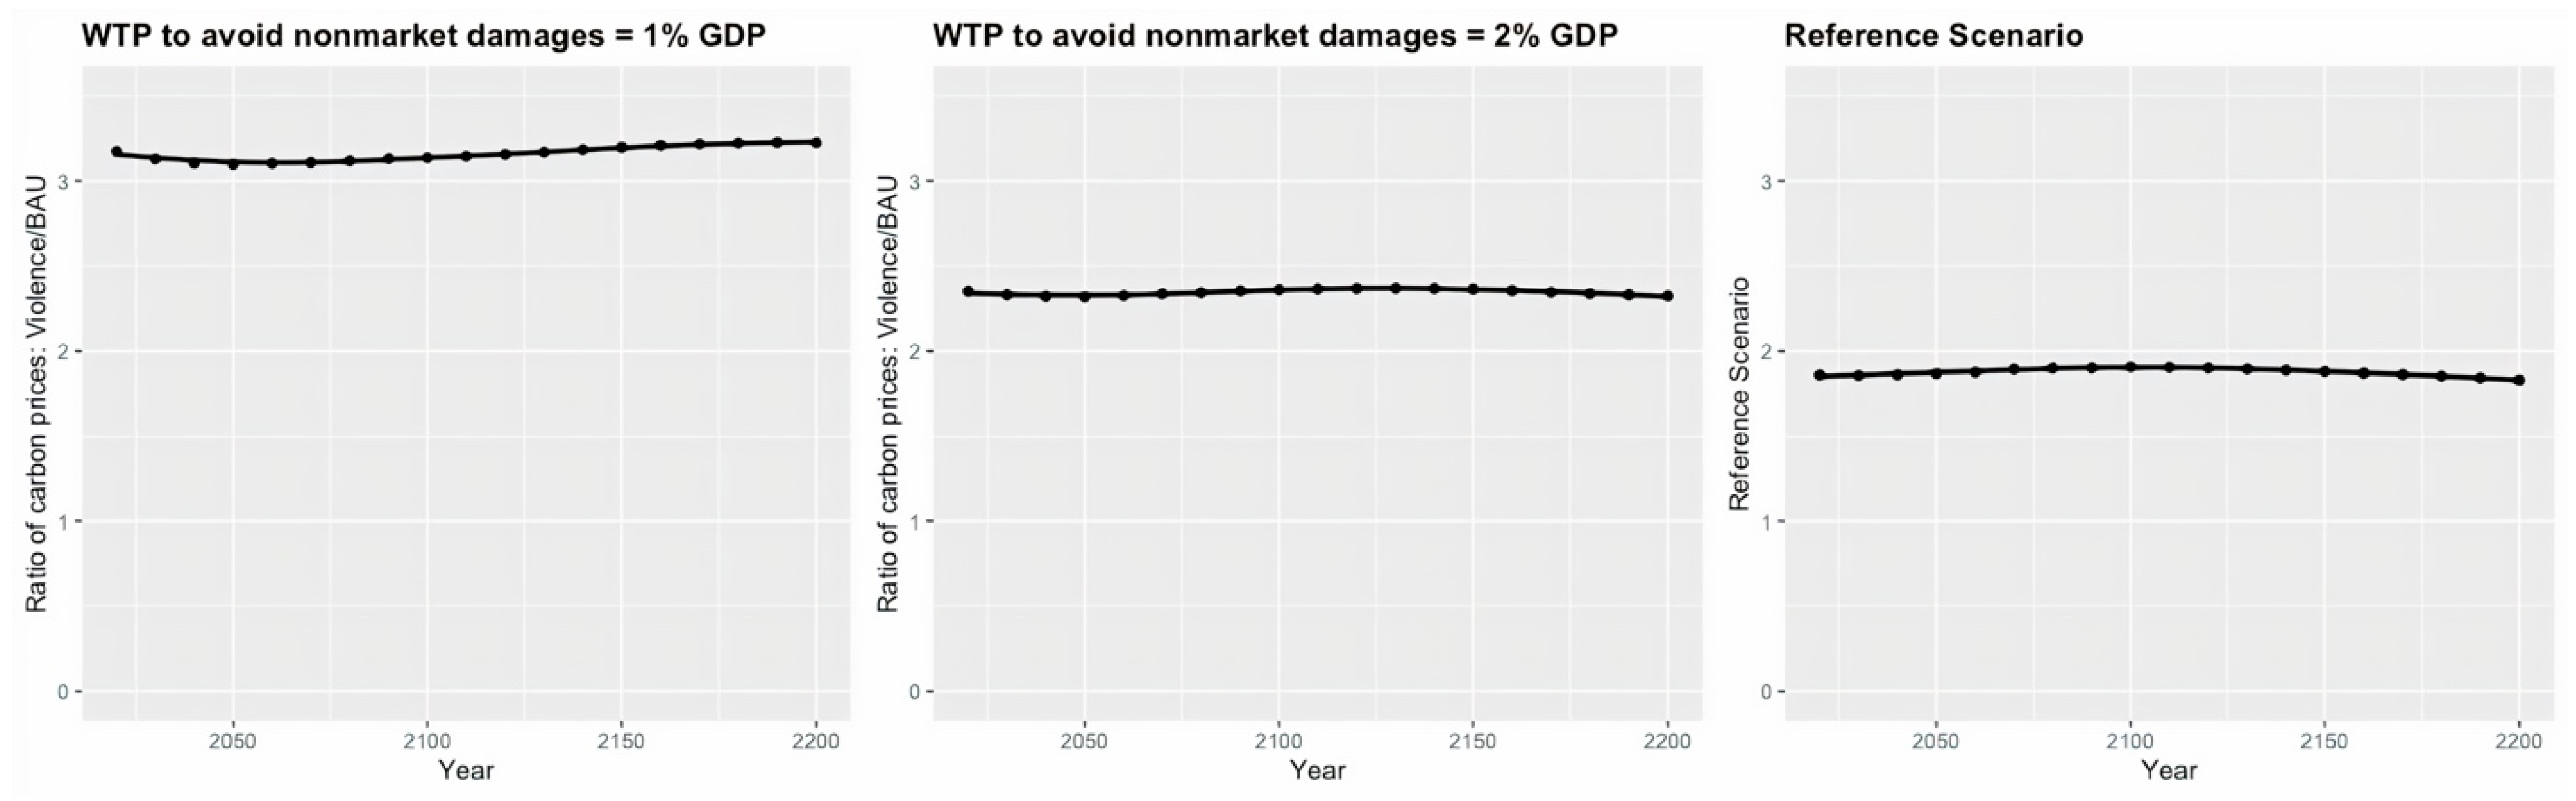
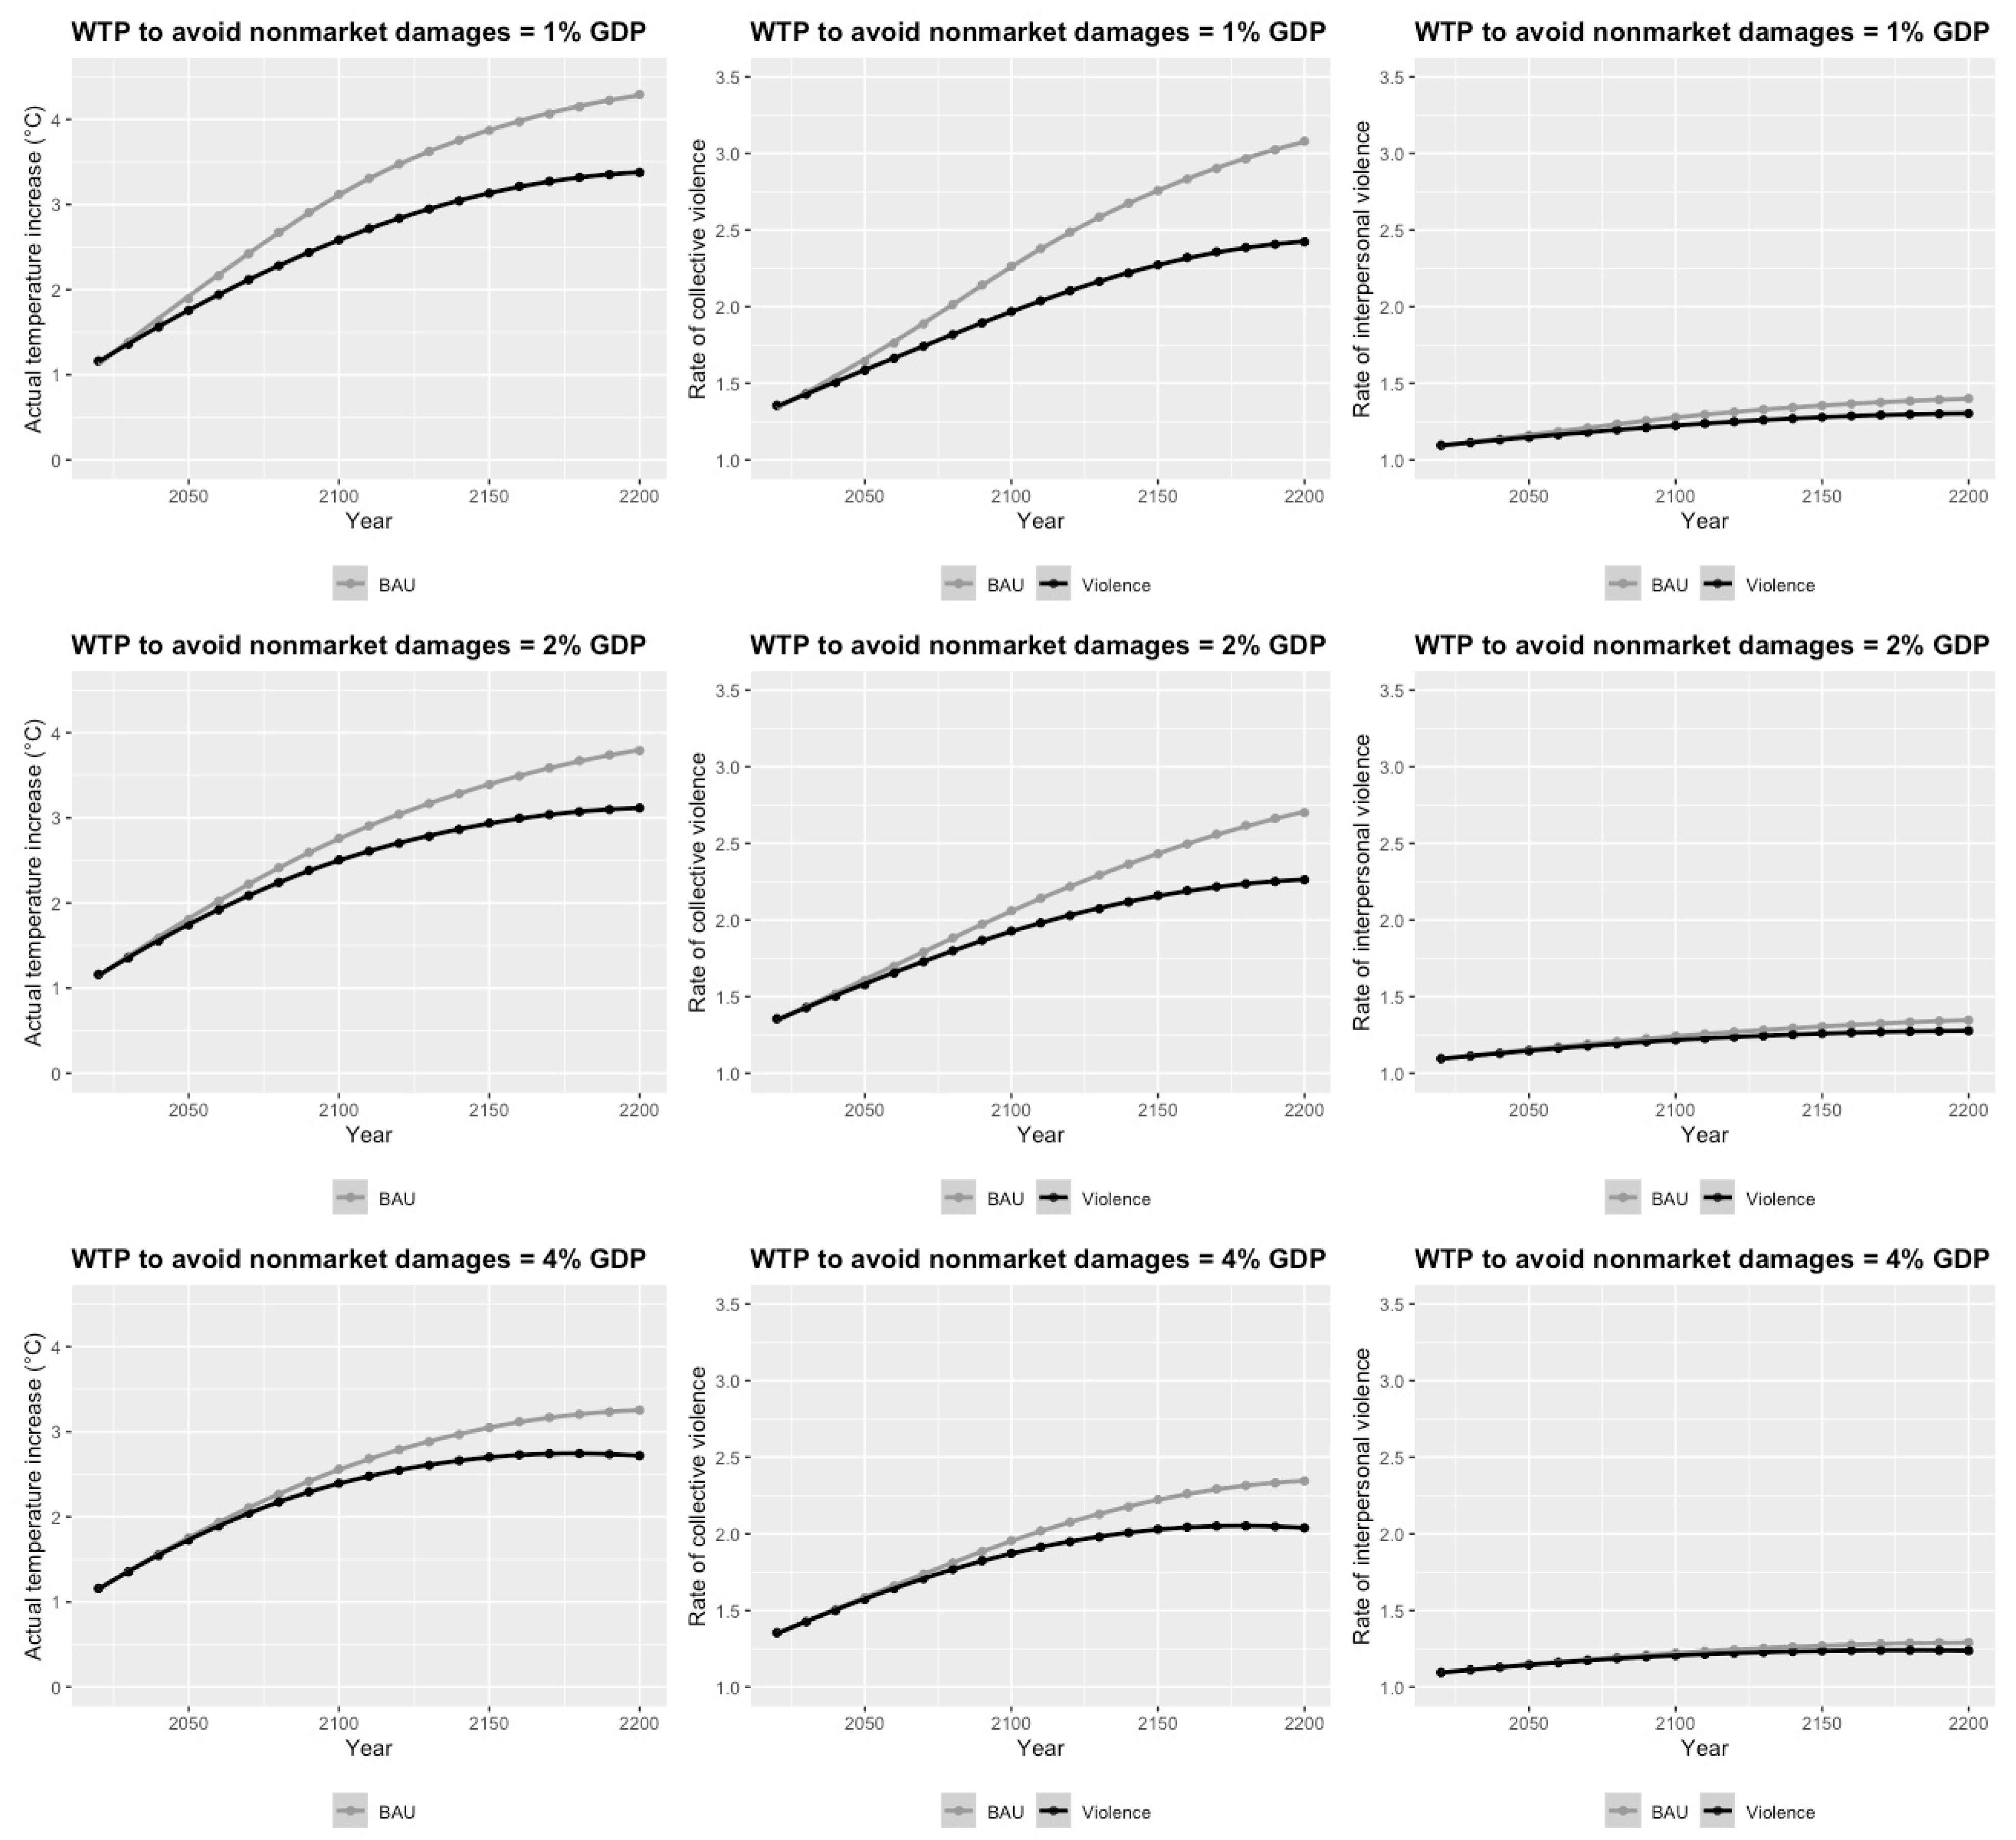
4.4. Sensitivity Analysis: WTP for Nonmarket Damages

The third dimension along which I seek to test the sensitivity of the results is the WTP to avoid nonmarket climate damages. For nonmarket damages, MERGE is built based on the highly speculative assumption that the expected losses would increase quadratically with the rise in temperature [42]. Changing the WTP, which is in itself uncertain, for nonmarket damages can influence how much nonmarket damages are factored into the calculation of optimal carbon prices. Furthermore, the default WTP is 4 percent in MERGE, meaning that residents of all regions are willing to devote 4 percent of their regional income to avoid nonmarket climate damages associated with 2 °C of warming. Since the figure could be lower in less-developed regions of the world, I change the WTP to avoid nonmarket damages to 1 percent and 2 percent for the sensitivity analysis.
As shown in Figure 10, incorporating the costs of climate-induced violence raises the projection of optimal carbon prices to about twice as much as before under the 2 percent of regional GDP assumption and a bit above three times as much under the 1 percent assumption. Hence, changes in pricing the carbon externality in the Violence scenario vis-à-vis BAU could be sensitive to the assumption about WTP to avoid nonmarket damages.
The projected temperature increases correspond with the fact that the higher the WTP, the more people care about avoiding climate change, which lowers the temperature increase (Figure 11). Under a WTP of 1 percent of regional income, the projected temperature increases are estimated to be 1.89 °C and 1.76 °C in 2050, and the rates of collective and interpersonal violence are projected to reduce by 0.06 and 0.01, respectively, in the Violence scenario vis-à-vis the BAU scenario.
The lower the WTP to avoid nonmarket damages, the higher the avoided damages from climate-induced violence (Figure 12). This pattern is intuitive because as people care less about climate damages from sources other than climate-induced violence, climate-induced violence matters relatively more to people. At a WTP of 1 percent of regional income, which is perhaps the closest to reality based on existing empirical works, the avoided damages from climate-induced violence in sub-Saharan Africa are estimated to reach 0.46 percent of the region’s GDP in 2050.

4.5. Sensitivity Analysis: Inclusion/Exclusion of Nonmarket Damages

I examine how the projections of the optimal carbon price change when only the market damages from climate-induced violence are considered. This exercise is worthwhile because MERGE assumes that the expected losses would increase quadratically with the rise in temperature, which is highly speculative and prone to producing very high optimal carbon prices when the temperature is high. In light of this, the reference/default scenarios are rerun to exclude nonmarket damages. Between the Violence and BAU scenarios, the Violence scenario yields optimal carbon prices about twice the magnitude of those in the BAU scenario in the next few decades (2.04 times in 2020 and 2.11 times in 2050); the magnitude is projected to increase gradually to above three times by 2200 (Figure 13).
Intuitively, lower optimal carbon prices give rise to higher projected temperatures and higher rates of climate-induced violence (Figure 14). The avoided damages from climate-induced violence as percentages of regional GDP are consistently lower with lower carbon prices in place (Figure 15).

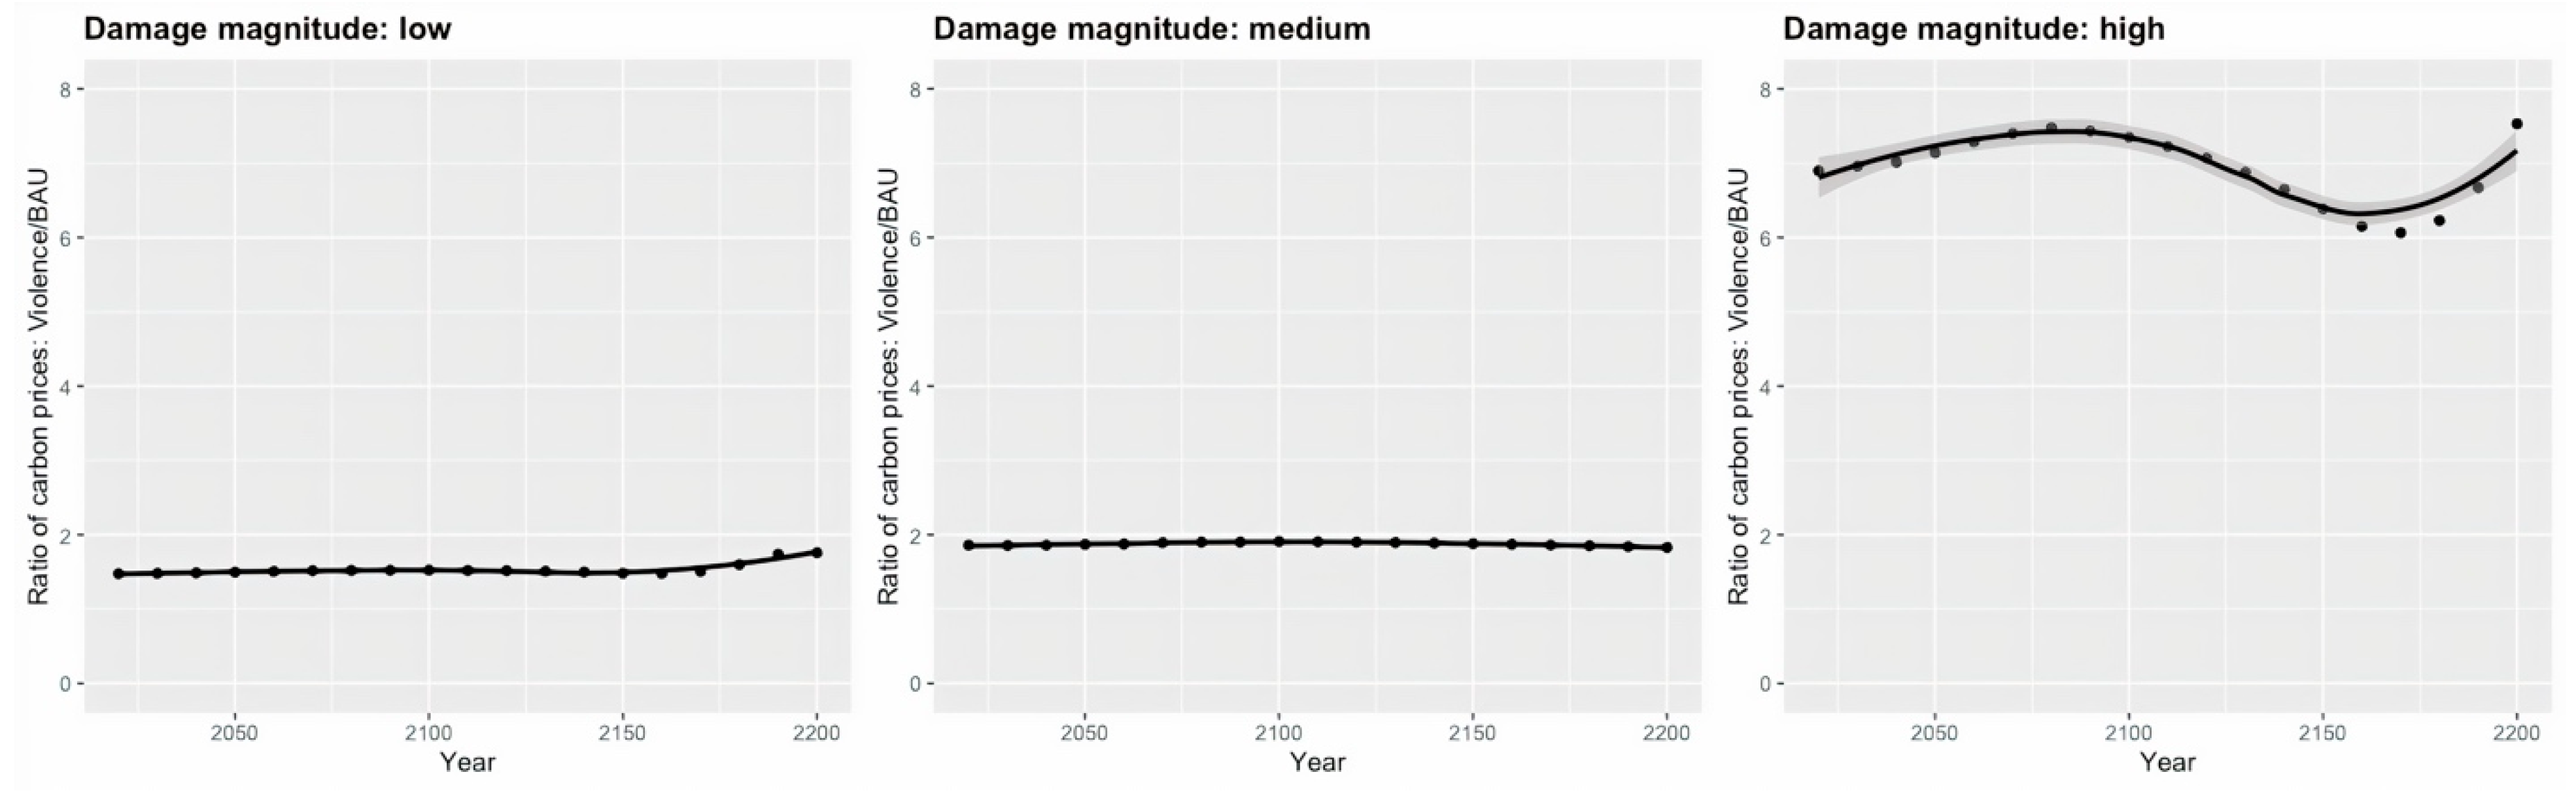
4.6. Accounting for Uncertainty: The Magnitude of the Climate–Violence Response Relationship

As foreshadowed in Section 3.2, this paper seeks to factor in the uncertainty surrounding the estimates in Hsiang et al. (2013). Specifically, this paper reassesses the results by replacing the median estimates of the increase in the incidence of climate-induced violence with high- and low-bound estimates. The calculations refer to the Supplementary Tables S2 and S3 in Hsiang et al. (2013), which provide their original estimated effects from each study on interpersonal violence and intergroup violence, respectively. For estimates on interpersonal violence, calculations take the second-highest (16) and the second-lowest (2), among 11, estimates. For estimates on intergroup conflict, calculations take the fourth-highest (42) and the fourth-lowest (6), among 21, estimates. The original Equations (1) and (2) are updated to (12) and (13), respectively, for high-bound estimates of the incidences of climate-induced violence and expressed as follows:
υ ( g r o u p ,   t ) = 1.42 a t p ( t ) 0.5
υ ( p e r s o n ,   t ) = 1.16 a t p ( t ) 0.5
Similarly, the low-bound estimates of the incidences of climate-induced violence are expressed in Equations (14) and (15) as:
υ ( g r o u p ,   t ) = 1.06 a t p ( t ) 0.5
υ ( p e r s o n ,   t ) = 1.02 a t p ( t ) 0.5
As shown in Figure 16, when the damage magnitude is low-bound, the Violence scenario yields optimal carbon prices nearly twice the size of those in the BAU scenario. Having a high-bound damage magnitude raises the optimal carbon prices to between six and eight times those in the BAU scenario, suggesting that the main finding is sensitive to the value of the high-bound damage magnitude.
With the highest optimal carbon price across three scenarios, the high-damage-magnitude scenario is projected to have the least rise in temperature and, by extension, rates of climate-induced violence (Figure 17). As a result, such a scenario is also projected to have the highest avoided damages from climate-induced violence as percentages of regional GDP (Figure 18). Of particular note, sub-Saharan Africa is estimated to avoid damages related to climate-induced violence that is worth 1 percent of the regional GDP in 2050, 9 percent in 2100, and 27 percent in 2200.

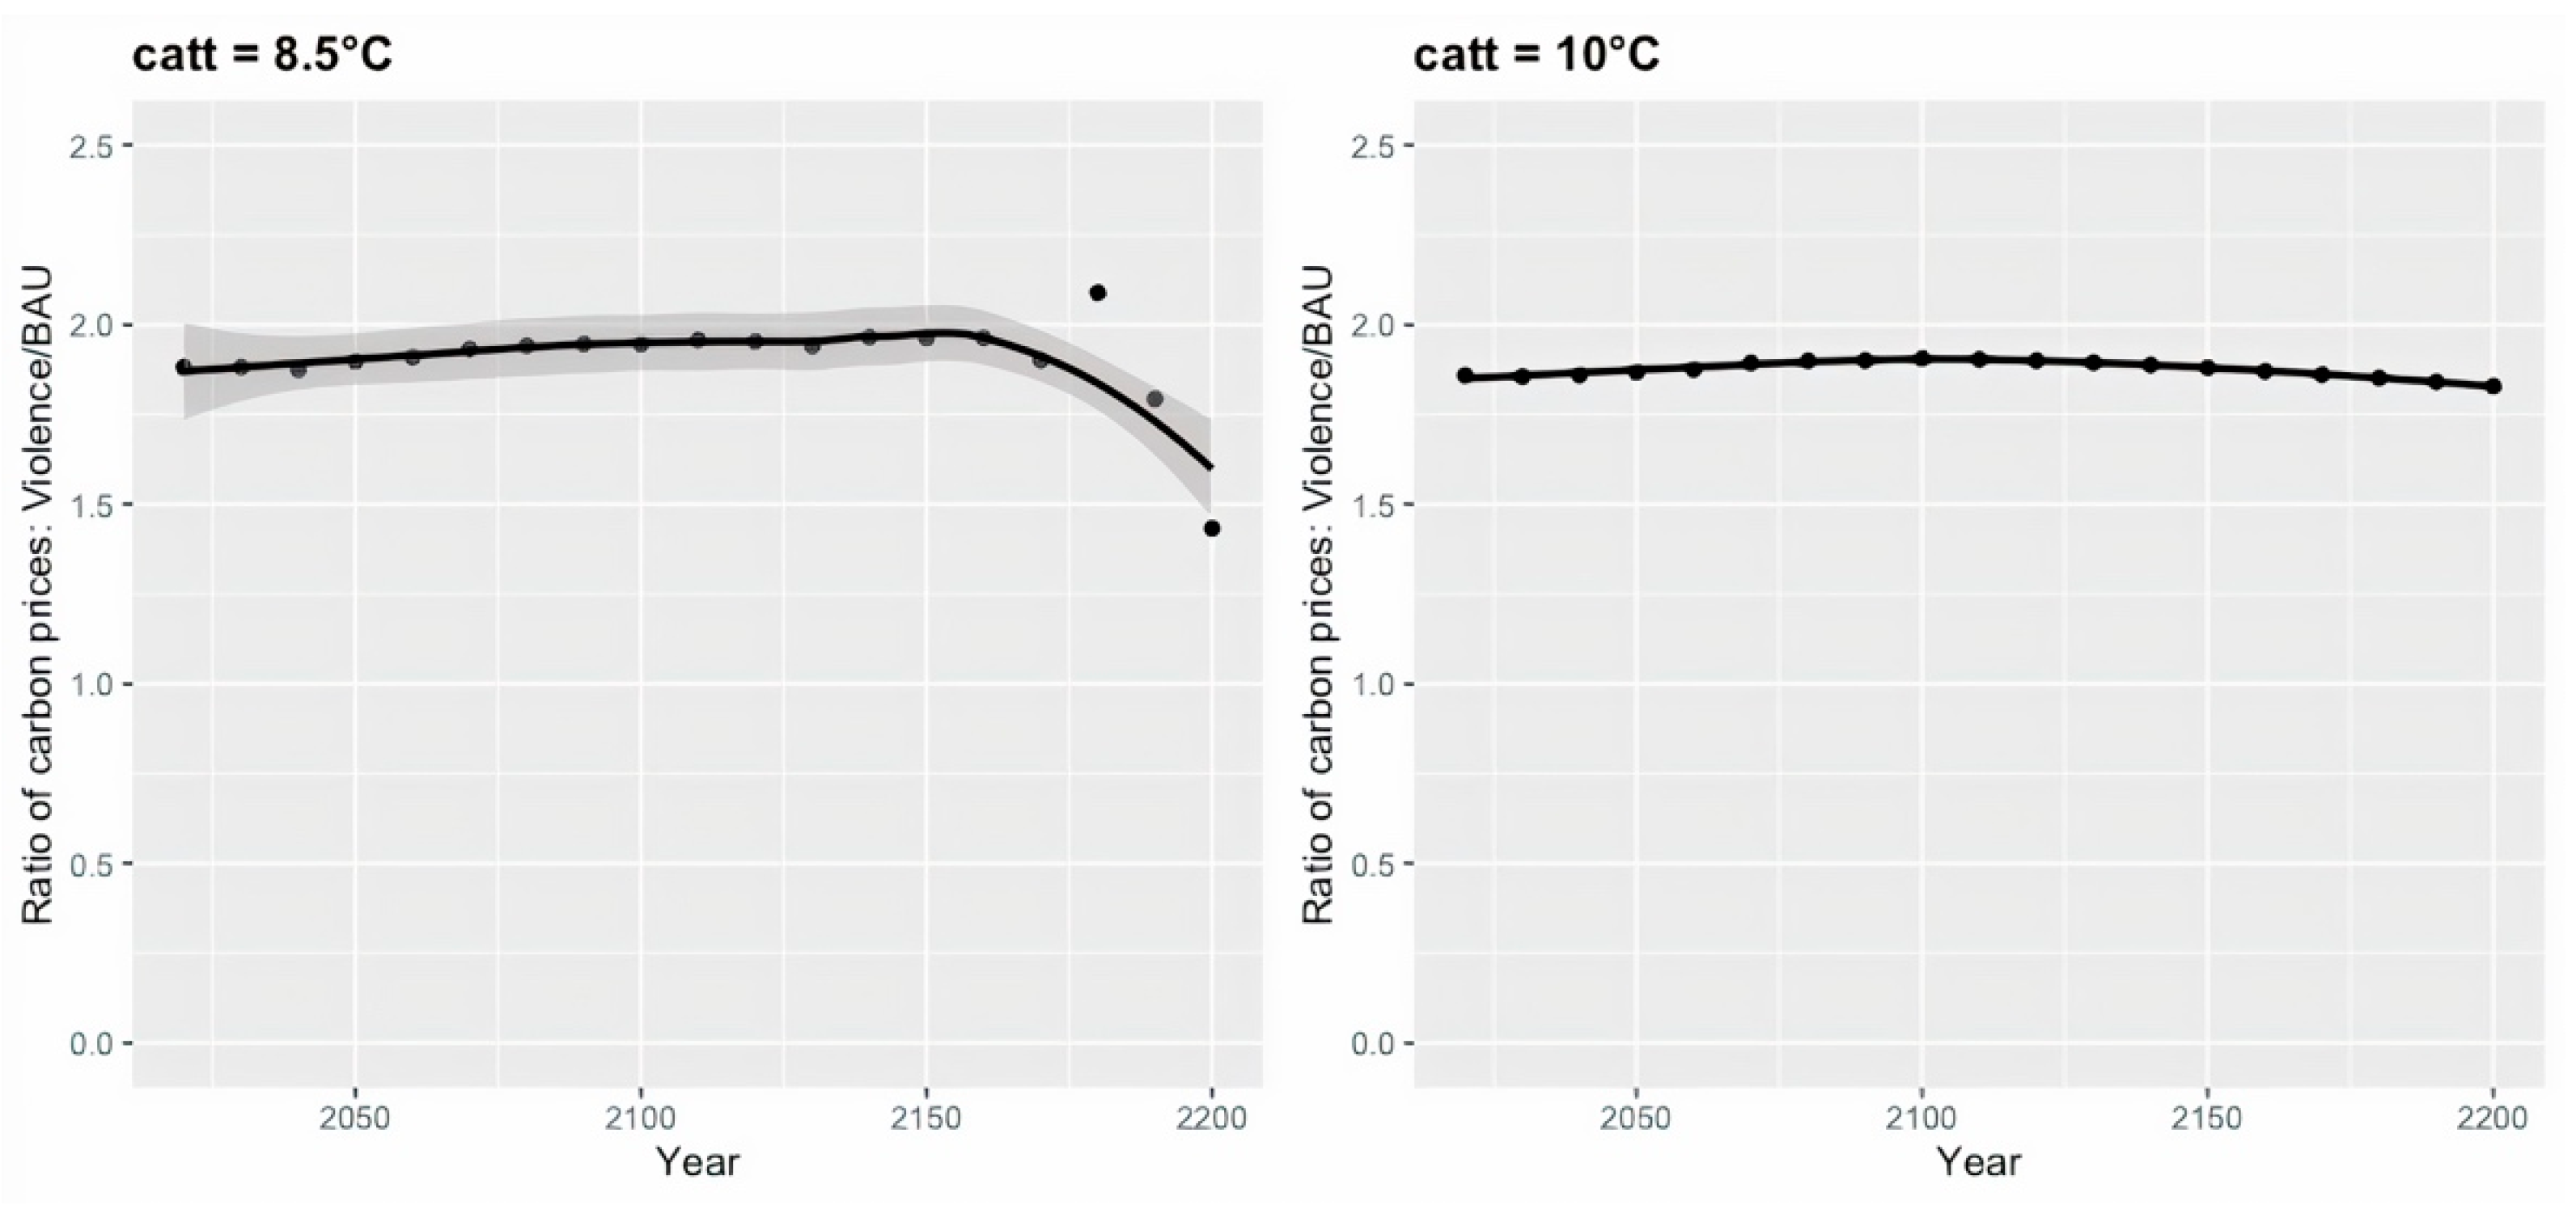
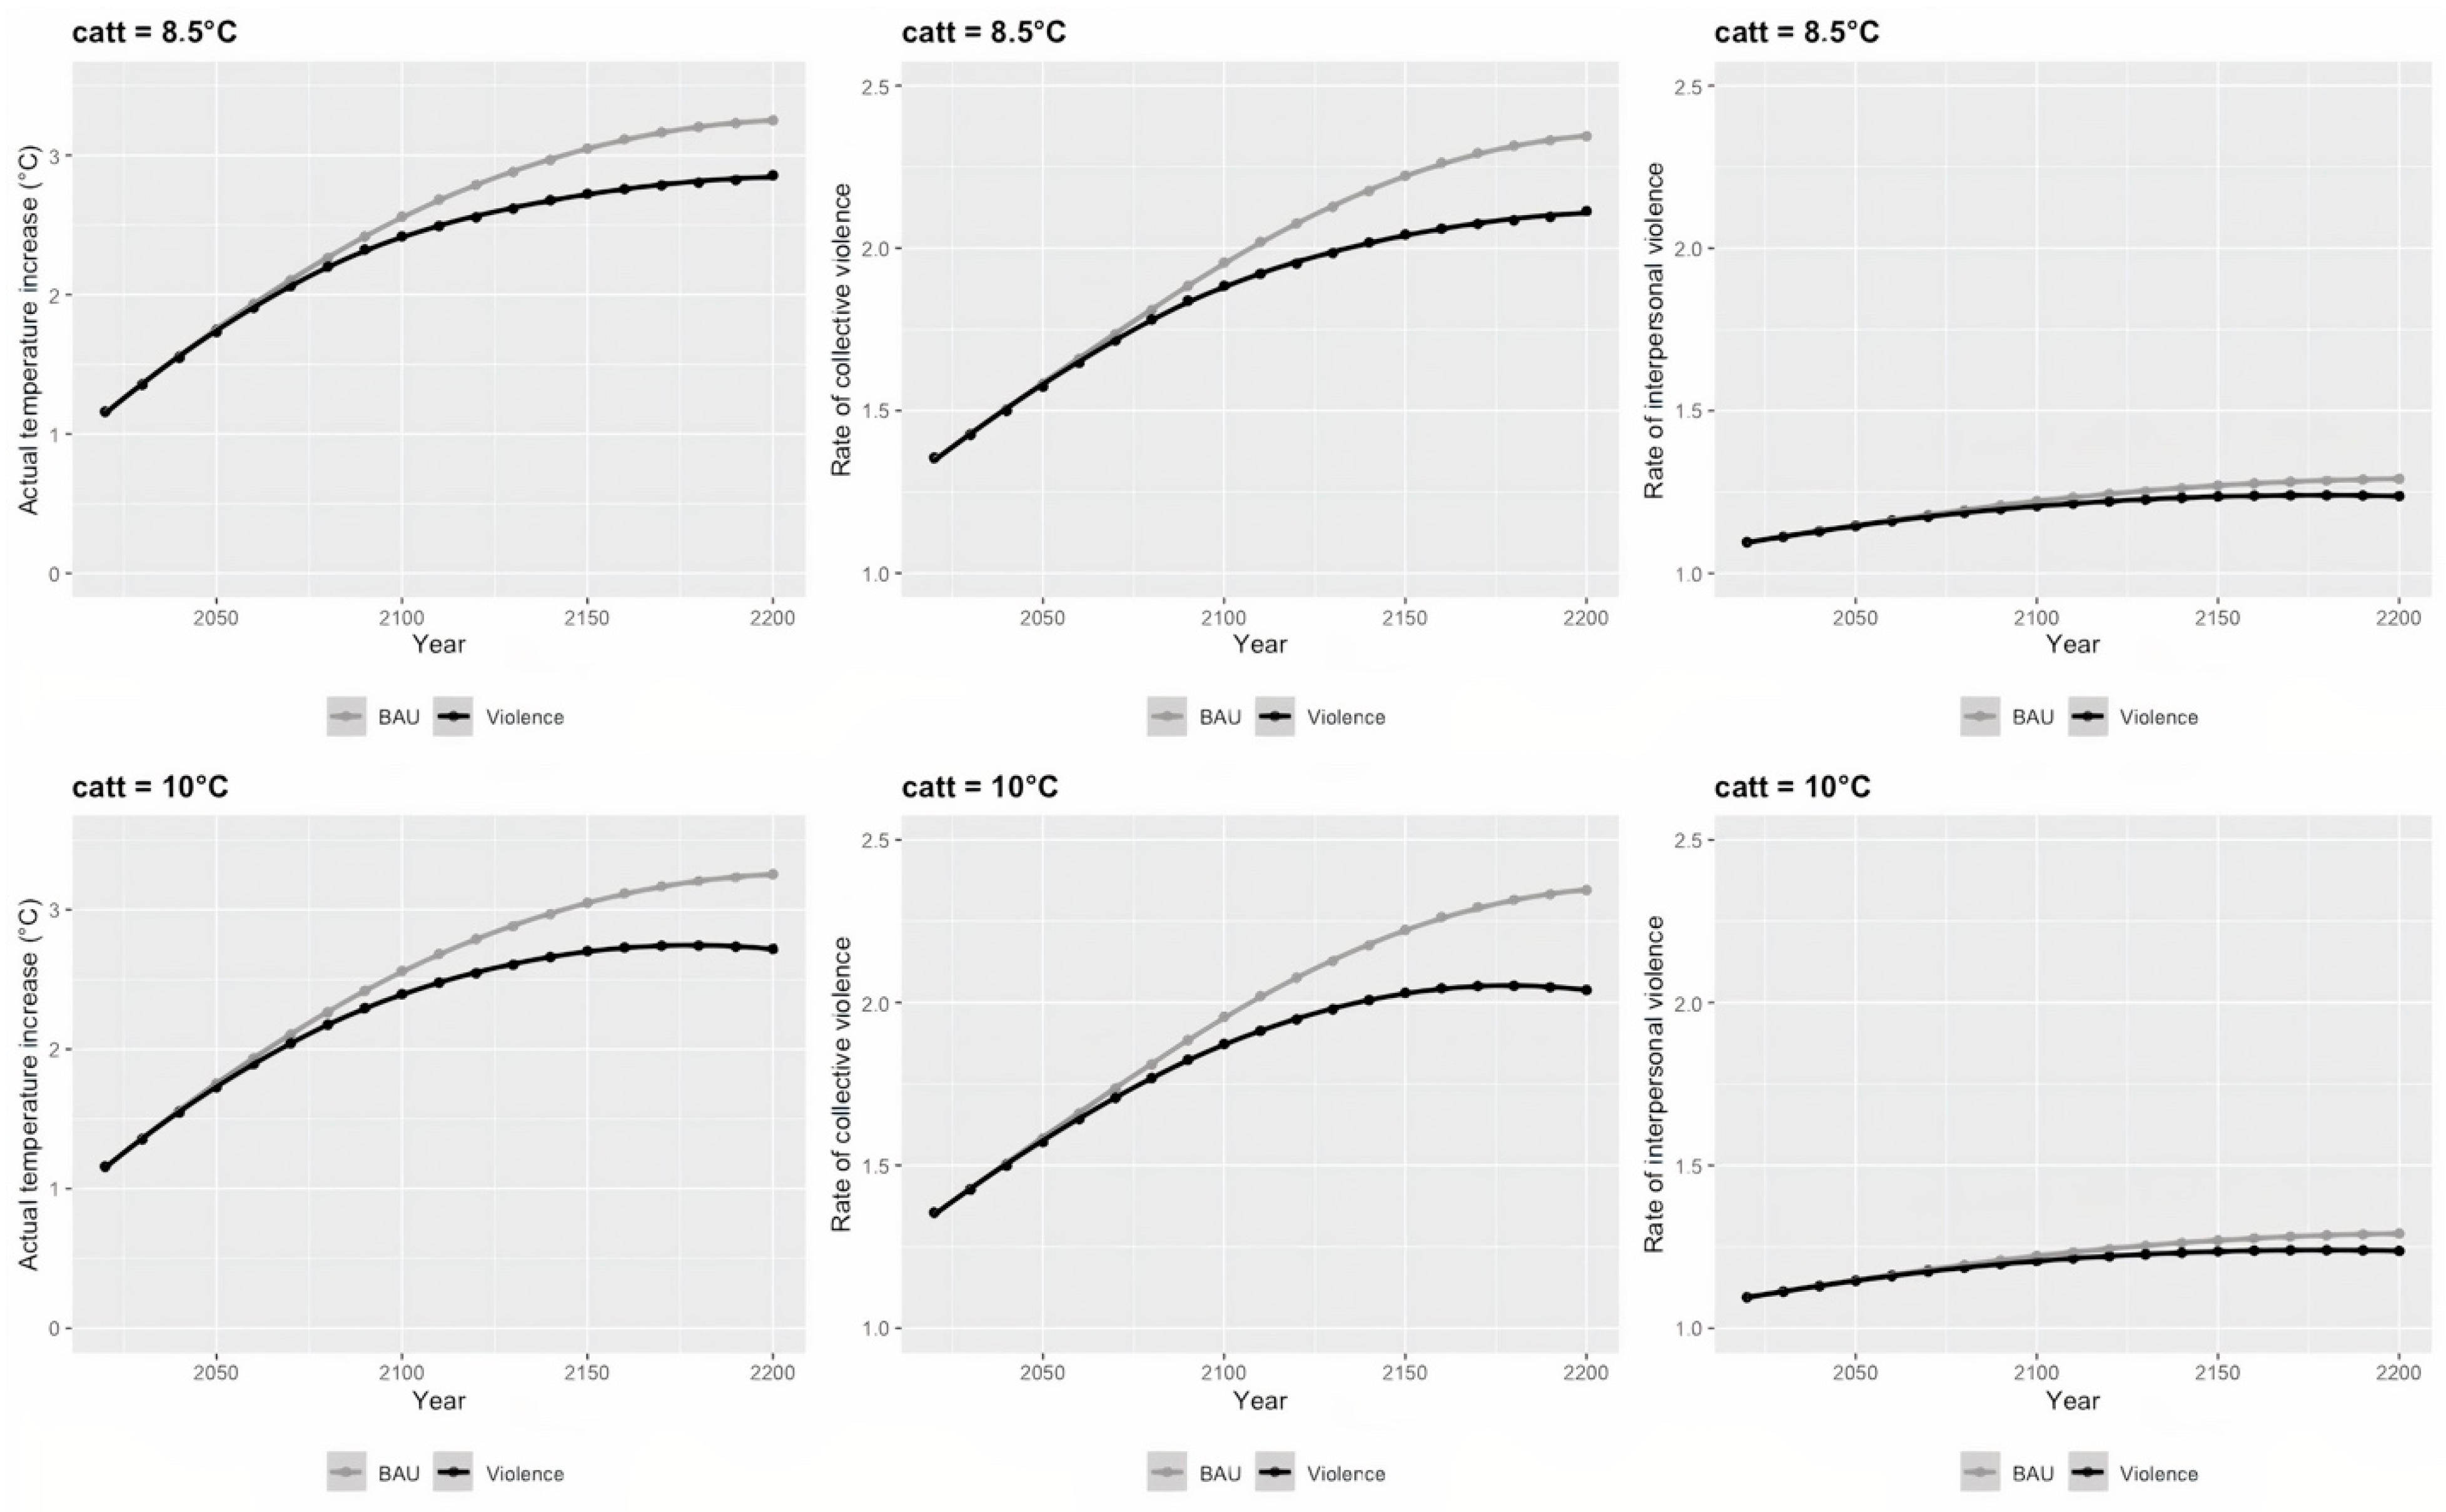
4.7. Sensitivity Analysis: Catastrophic Temperature

Last but not least, a sensitivity analysis is performed on the value of the catastrophic temperature parameter. The economic loss factor ( E L F ), which is part of the nonmarket damage function, represents the fraction of consumption left for conventional use by households and government. In MERGE, the default WTP to avoid nonmarket climate damages associated with 2 °C of warming is 4 percent, meaning that E L F ( r e f t e m p ) has a default value of 0.96. r e f t e m p is the reference temperature rise relative to the pre-industrial level for nonmarket damages with a default value of 2 °C and is calculated as follows:
E L F ( r e f t e m p )   = [ 1 ( r e f t e m p c a t t ) 2 ] h s x
This E L F depends on the values of two parameters: c a t t and h s x [42]. Here, c a t t is a catastrophic temperature parameter chosen in such a way that the entire regional product is wiped out; in other words, it represents the catastrophic temperature at which the WTP at infinite income reaches 100 percent. Its default value in MERGE is 10 °C. In addition, h s x , the hockey-stick parameter that represents the degree of loss due to temperature increase. A default value of 1 assumes that the loss is quadratic in terms of the temperature rise, and this value is assumed for high-income countries and is highly speculative [42]. If the amount of loss as a result of one unit of temperature rise is less than the quadratic, the value of h s x should be less than 1, and the value for c a t t should be lower than the default. After a new value for c a t t is set at 8.5 °C, leaving all other parameters unchanged, the analysis is re-executed.
With a lower assumed catastrophic temperature, the optimal carbon price projections for the c a t t = 8.5   ° C scenario is very similar to those for the default scenario until 2170 (Figure 19). The near doubling of the optimal carbon prices in the Violence scenario vis-à-vis the BAU scenario persists between 2020 and 2180 when c a t t = 8.5   ° C . After 2180, the default scenario, where the catastrophic temperature is assumed to be higher, the ratio of the optimal carbon prices is projected to decline in the c a t t = 8.5   ° C scenario.
A similar trend is observed for the projected temperatures, and by extension, the rates of collective and interpersonal violence and the avoided damages from climate-induced violence (Figure 20 and Figure 21). Changing the assumption about the catastrophic temperature does not seem to affect the projections until 2170, with a horizon towards 2200. After 2170, the default scenario yields lower projected temperate and rates of violence and higher avoided damages as percentages of regional GDP thanks to higher optimal carbon prices.

5. Conclusions and Policy Implications

This study puts forth a new way of modeling carbon externalities by endogenizing a critical yet previously missing aspect of climate impacts—violence. Utilizing recently published estimates of the costs of violence for different global regions [6] and the median estimates of the incidence of violence per one standard deviation change in temperature [12], this study derives the costs of climate-induced violence. By internalizing such costs in MERGE, which is a methodological contribution of the paper, the results indicate that the optimal carbon price roughly doubles across a range of scenarios with different assumptions regarding climate sensitivity, GDP growth rate, and the catastrophic temperature. This relationship can be sensitive when the WTP to avoid nonmarket damages is low, when nonmarket damages are excluded, or when the climate-violence damage magnitude is at a high-bound of the uncertainty range represented in Hsiang et al.’s estimates.
However, there are two known biases. First, the costs of violence are plausibly low-bound estimates, downwardly biasing the estimates of carbon externality. Second, since the climate–violence relationship coefficient in Hsiang, Burke, and Miguel (2013) is mainly based on local temperature deviations, which are likely higher than the global temperature variation, the estimates of carbon externality could be biased upward [12]. To mitigate these biases, future research can utilize improved estimates of the costs of violence, which would be based on the country-level estimate of the value of a statistical life (VSL), projected country-level weather trends, and country- or region-level climate–violence relationships, when such estimates become available. (Furthermore, since Hsiang, Burke, and Miguel (2013) provide one approximation of the “true” functional form of the relationship between climate change and conflict, future research can utilize other functional forms in the modeling exercise (e.g., linear). Moreover, researchers can conduct similar analyses using other IAMs and perform inter-model comparisons of results. Last but not least, future research can try to factor in the effects of projected adaption).
For the modeling community, the take-home message is that climate-induced violence may have a material impact on the results and should be considered in any model trading off the costs and benefits of greenhouse gas emissions. For the policy community, the approach of this paper bears normative significance by incorporating climate-induced violence costs into the broader tradeoff between the costs and benefits of carbon emissions across the global economy. Based on the median estimate of the effect of climate change on violence and under the assumption that the WTP to avoid nonmarket damages equates 1 percent of regional income, the avoided damages from climate-induced violence in sub-Saharan Africa is estimated to reach 0.5 percent of the region’s GDP in 2050, 2 percent in 2100, and almost 4 percent in 2200. When the magnitude of climate damage is near high-bound, the avoided damages from climate-induced violence in sub-Saharan Africa are projected to reach 1 percent of the region’s GDP in 2050, 9 percent in 2100, and 27 percent in 2200. These figures are very significant for a region that has long suffered from underdevelopment and violence and thus deserve policy attention.
More broadly, this exercise shows that socially contingent damages, such as violence, can and must be integrated into policy-relevant climate models. Given the significant role that politics play in shaping climate-related policies and trajectories, political scientists who have not yet been actively involved in the development of IAMs have great potential of making significant contributions. Beyond the climate–violence example presented in this paper, another promising area is the integration of political constraints into IAMs, possibly in the form of a new module.

Funding

This research did not receive nor required funding.

Institutional Review Board Statement

Not applicable.

Informed Consent Statement

Not applicable.

Data Availability Statement

Data sharing not applicable.

Acknowledgments

I thank Raphael Calel, James Merrick, John Weyant, and audiences at Stanford University, the World Bank’s 2019 World’s First International Research Conference on Carbon Pricing, and the 2020 Integrated Assessment Modeling Consortium Annual Meeting for providing feedback on previous drafts of this paper; James Merrick for helping with MERGE; and Angus Binnie and Rand Perry for proofreading the draft. Any remaining errors are my own.

Conflicts of Interest

The author declares no conflict of interest.

References

  1. Matson, P.; Clark, W.; Andersson, K. Pursuing Sustainability: A Guide to the Science and Practice; Princeton University Press: Princeton, NJ, USA, 2016. [Google Scholar]
  2. Weyant, J. Some Contributions of Integrated Assessment Models of Global Climate Change. Rev. Environ. Econ. Policy 2017, 11, 115–137. [Google Scholar] [CrossRef] [Green Version]
  3. North, D.; Wallis, J.; Weingast, B. Violence and Social Orders: A Conceptual Framework for Interpreting Recorded Human History; Cambridge University Press: Cambridge, UK, 2009. [Google Scholar]
  4. IEP. The Economic Cost of Violence Containment: A Comprehensive Assessment of the Global Cost of Violence; Institute for Economics & Peace: Sydney, Australia, 2014. [Google Scholar]
  5. Fearon, J.; Hoeffler, A. Beyond Civil War: The Costs of Interpersonal Violence and the Next Round of MDGs; Cambridge University Press: Cambridge, UK, 2014. [Google Scholar]
  6. Hoeffler, A. What Are the Costs of Violence? Politics Philos. Econ. 2017, 16, 422–445. [Google Scholar] [CrossRef]
  7. Anderson, C.A. Temperature and aggression: Ubiquitous effects of heat on occurrence of human violence. Psychol. Bull. 1989, 106, 74–96. [Google Scholar] [CrossRef]
  8. Anderson, C.A.; Anderson, K.B.; Dorr, N.; DeNeve, K.M.; Flanagan, M. Temperature and aggression. Adv. Exp. Soc. Psychol. 2000, 32, 63–133. [Google Scholar]
  9. Kenrick, D.T.; MacFarlane, S.W. Ambient Temperature and Horn Honking: A Field Study of the Heat/Aggression Relationship. Environ. Behav. 1986, 18, 179–191. [Google Scholar] [CrossRef]
  10. Larrick, R.P.; Timmerman, T.A.; Carton, A.M.; Abrevaya, J. Temper, Temperature, and Temptation: Heat-Related Retaliation in Baseball. Psychol. Sci. 2011, 22, 423–428. [Google Scholar] [CrossRef]
  11. Dell, M.; Jones, B.F.; Olken, B.A. Temperature shocks and economic growth: Evidence from the last half century. Am. Econ. J. Macroecon. 2012, 4, 66–95. [Google Scholar] [CrossRef] [Green Version]
  12. Hsiang, S.; Burke, M.; Miguel, E. Quantifying The Influence of Climate On Human Conflict. Science 2013, 341, 1235367. [Google Scholar] [CrossRef] [Green Version]
  13. Shen, S.V. Pricing Carbon to Contain Violence. In The First International Research Conference on Carbon Pricing; World Bank: Washington, DC, USA, 2019; pp. 331–348. [Google Scholar]
  14. Ranson, M. Crime, weather, and climate change. J. Environ. Econ. Manag. 2014, 67, 274–302. [Google Scholar] [CrossRef]
  15. Jacob, B.; Lefgren, L.; Moretti, E. The Dynamics of Criminal Behavior: Evidence from Weather Shocks. J. Hum. Resour. 2007, 42, 489–527. [Google Scholar] [CrossRef]
  16. Auliciems, A.; DiBartolo, L. Domestic Violence in a subtropical environment: Police calls and weather in Brisbane. Int. J. Biometeorol. 1995, 39, 34–39. [Google Scholar] [CrossRef]
  17. Miguel, E.; Satyanath, S.; Sergenti, E. Economic Shocks and Civil Conflict: An Instrumental Variables Approach. J. Polit. Econ. 2004, 112, 725–753. [Google Scholar] [CrossRef]
  18. Burke, M.; Miguel, E.; Satyanath, S.; Dykema, J.; Lobell, D. Warming increases risk of civil war in Africa. Proc. Natl. Acad. Sci. USA 2009, 106, 20670–20674. [Google Scholar] [CrossRef] [Green Version]
  19. Burke, M.; Miguel, E.; Satyanath, S.; Dykema, J.A.; Lobell, D.B. Climate robustly linked to African civil war. Proc. Natl. Acad. Sci. USA 2010, 107, E185. [Google Scholar] [CrossRef] [Green Version]
  20. Harari, M.; La Ferrara, E. Conflict, Climate and Cells: A disaggregated analysis. Rev. Econ. Stat. 2018, 100, 594–608. [Google Scholar] [CrossRef]
  21. O’Loughlin, J.; Linke, A.M.; Witmer, F.D.W. Effects of temperature and precipitation variability on the risk of violence in sub-Saharan Africa, 1980–2012. Proc. Natl. Acad. Sci. USA 2014, 111, 16712–16717. [Google Scholar] [CrossRef] [Green Version]
  22. Hsiang, S.; Meng, K.C.; Cane, M.A. Civil conflicts are associated with the global climate. Nature 2011, 476, 438–441. [Google Scholar] [CrossRef]
  23. Shilling, A.K. Climate Change and Conflict: Identifying the Mechanisms; Stanford University: Stanford, CA, USA, 2012. [Google Scholar]
  24. Bhavnani, R.R.; Lacina, B. The Effects of Weather-Induced Migration on Sons of the Soil Riots in India. World Politics 2015, 67, 760–794. [Google Scholar] [CrossRef]
  25. Rose, S.; Diaz, D.; Blanford, G. Understanding the Social Cost of Carbon: A Model Diagnostic and Inter-Comparison Study. Clim. Chang. Econ. 2017, 8, 1750009. [Google Scholar] [CrossRef]
  26. Hurd, B.; Jorgenson, D.W.; Goettle, R.J.; Smith, J.U.S. Market Consequences of Global Climate Change; Center for Climate and Energy Solutions: Arlington, VA, USA, 2004. [Google Scholar]
  27. Hsiang, S. Estimating economic damage from climate change in the United States Downloaded from. Science 2017, 356, 1362–1369. [Google Scholar] [CrossRef] [PubMed] [Green Version]
  28. Howard, P.; Livermore, M.A. Sociopolitical Feedbacks and Climate Change. Harvard Environ. Law Rev. 2019, 43, 119–174. [Google Scholar]
  29. Burke, M.; Hsiang, S.; Miguel, E. Climate and Conflict. Annu. Rev. Econ. 2015, 7, 577–617. [Google Scholar] [CrossRef]
  30. Buhaug, H. One effect to rule them all? A comment on climate and conflict. Clim. Chang. 2014, 127, 391–397. [Google Scholar] [CrossRef] [Green Version]
  31. Hsiang, S.; Burke, M.; Miguel, E. Reconciliating climate-conflict meta-analysis: Reply to Buhaug et al. Clim. Chang. 2014, 127, 399–405. [Google Scholar] [CrossRef]
  32. Buhaug, H.; Nordkvelle, J. Climate and Conflict: A Comment on Hsiang et al.’s Reply to Buhaug et al.; University of Maryland: College Park, MD, USA, 2014; Volume 127, pp. 399–405. [Google Scholar]
  33. WHO. World Report on Violence and Health; Peace Research Institute Oslo: Oslo, Norway, 2002. [Google Scholar]
  34. McCollister, K.; French, M.; Fang, H. The Cost of Crime to Society: New Crime-Specific Estimates for Policy and Program Evaluation. Drug Alcohol Depend. 2010, 108, 98–109. [Google Scholar] [CrossRef] [PubMed] [Green Version]
  35. Nordhaus, W.D. Managing the Global Commons: The Economics of Climate Change; The MIT Press: Cambridge, MA, USA, 1994. [Google Scholar]
  36. Nordhaus, W.D.; Yang, Z. A Regional Dynamic General-Equilibrium Model of Alternative Climate-Change Strategies. Am. Econ. Rev. 1996, 86, 741–765. [Google Scholar]
  37. Putnam, R. Making Democracy Work: Civic Traditions in Modern Italy; Princeton University Press: Princeton, NJ, USA, 1993. [Google Scholar]
  38. Putnam, R. Bowling Alone: The Collapse and Revival of American Community; Simon & Schuster Paperbacks: New York City, NY, USA, 2000. [Google Scholar]
  39. Carleton, T.; Hsiang, S.; Burke, M. Conflict in a changing climate. Eur. Phys. J. 2016, 225, 489–511. [Google Scholar] [CrossRef]
  40. Blanford, G.; Merrick, J.; Richels, R.; Rose, S. Trade-offs between mitigation costs and temperature change. Clim. Chang. 2014, 123, 527–541. [Google Scholar] [CrossRef] [Green Version]
  41. Manne, A.S.; Richels, R.G. MERGE: An Integrated Assessment Model for Global Climate Change. In Energy and Environment; Loulou, R., Waaub, J.-P., Zaccour, G., Eds.; Springer: Berlin/Heidelberg, Germany, 2005; pp. 175–189. [Google Scholar]
  42. Manne, A.; Mendelsohn, R.; Richels, R. MERGE: A model for evaluating regional and global effects of GHG reduction policies. Energy Policy 1995, 23, 17–34. [Google Scholar] [CrossRef]
  43. Calel, R.; Stainforth, D. On the Physics of Three Integrated Assessment Models. Bull. Am. Meteorol. Soc. 2017, 98, 1199–1216. [Google Scholar] [CrossRef] [Green Version]
Figure 1. Projections of the ratio of optimal carbon prices in the Violence vs. BAU scenarios.
Sustainability 13 10587 g001
Figure 2. Projections of temperature increase and the rates of collective and interpersonal violence using the pre-industrial levels as the baseline.
Sustainability 13 10587 g002
Figure 3. Avoided damages from climate-induced violence as a percentage of regional GDP.
Sustainability 13 10587 g003
Figure 4. Projections of the ratio of optimal carbon prices in the Violence vs. BAU scenarios, under different assumptions about climate sensitivity.
Sustainability 13 10587 g004
Figure 5. Projections of temperature increase and the rates of collective and interpersonal violence, under different assumptions about climate sensitivity.
Sustainability 13 10587 g005
Figure 6. Projections of avoided damages from climate-induced violence as percentages of regional GDP, under different assumptions about climate sensitivity.
Sustainability 13 10587 g006
Figure 7. Projections of the ratio of optimal carbon prices in the Violence vs. BAU scenarios, under different assumptions about GDP growth rate.
Sustainability 13 10587 g007
Figure 8. Projections of temperature increase and the rates of collective and interpersonal violence, under different assumptions about GDP growth rate.
Sustainability 13 10587 g008
Figure 9. Projections of avoided damages from climate-induced violence as percentages of regional GDP, under different assumptions about GDP growth rate.
Sustainability 13 10587 g009
Figure 10. Projections of the ratio of optimal carbon prices in the Violence vs. BAU scenarios, under different assumptions about the WTP for nonmarket damages.
Sustainability 13 10587 g010
Figure 11. Projections of temperature increase and the rates of collective and interpersonal violence, under different assumptions about the WTP for nonmarket damages.
Sustainability 13 10587 g011
Figure 12. Projections of avoided damages from climate-induced violence as percentages of regional GDP, under different assumptions about the WTP for nonmarket damages.
Sustainability 13 10587 g012
Figure 13. Projections of the ratio of optimal carbon prices in the Violence vs. BAU scenarios, with or without the inclusion of nonmarket damages.
Sustainability 13 10587 g013
Figure 14. Projections of temperature increase and the rates of collective and interpersonal violence, with or without the inclusion of nonmarket damages.
Sustainability 13 10587 g014
Figure 15. Projections of avoided damages from climate-induced violence as percentages of regional GDP, with or without the inclusion of nonmarket damages.
Sustainability 13 10587 g015
Figure 16. Projections of the ratio of optimal carbon prices in the Violence vs. BAU scenarios, under different assumptions about the magnitude of the climate-violence response relationship.
Sustainability 13 10587 g016
Figure 17. Projections of temperature increase and the rates of collective and interpersonal violence, under different assumptions about the magnitude of the climate-violence response relationship.
Sustainability 13 10587 g017
Figure 18. Projections of avoided damages from climate-induced violence as percentages of regional GDP, under different assumptions about the magnitude of the climate-violence response relationship.
Sustainability 13 10587 g018
Figure 19. Projections of the ratio of optimal carbon prices in the Violence vs. BAU scenarios, under different assumptions about the catastrophic temperature.
Sustainability 13 10587 g019
Figure 20. Projections of temperature increase and the rates of collective and interpersonal violence under different assumptions about the catastrophic temperature, under different assumptions about the catastrophic temperature.
Sustainability 13 10587 g020
Figure 21. Projections of avoided damages from climate-induced violence as percentages of regional GDP under different assumptions about the catastrophic temperature, under different assumptions about the catastrophic temperature.
Sustainability 13 10587 g021
Table 1. Costs of collective and interpersonal violence as percentages of GDP for different global regions [6], by market versus nonmarket damages classified by the author (The percentage figures are reported to three decimal places so that those for East Asia and Pacific have significant digits. The non-market cost of violence as a percentage of regional GDP is much higher in the Middle East and North Africa because the region had a much higher figure for deaths from civil war, as shown in Table 1 in Anke Hoeffler’s paper [6]).
RegionCollective ViolenceInterpersonal Violence
MarketNonmarketMarketNonmarket
East Asia and Pacific0.0070.0030.1199.151
Europe and Central Asia0.9630.0170.42610.394
Latin America and Caribbean0.4940.0460.69818.512
The Middle East and North Africa0.8770.6030.20627.424
South Asia0.2490.0110.07820.502
Sub-Saharan Africa0.5950.0350.16637.114
High Income0.0000.0000.8995.371
Publisher’s Note: MDPI stays neutral with regard to jurisdictional claims in published maps and institutional affiliations.

