Article

Riparian Ecological Infrastructures: Potential for Biodiversity-Related Ecosystem Services in Mediterranean Human-Dominated Landscapes

by
André Fonseca
*,
Vera Zina
,
Gonçalo Duarte
,
Francisca C. Aguiar
,
Patricia María Rodríguez-González
,
Maria Teresa Ferreira
and
Maria Rosário Fernandes
Centro de Estudos Florestais (CEF), Instituto Superior de Agronomia, Universidade de Lisboa, Tapada da Ajuda, 1349-017 Lisboa, Portugal
*
Author to whom correspondence should be addressed.
Sustainability 2021, 13(19), 10508; https://doi.org/10.3390/su131910508
Submission received: 8 July 2021 / Revised: 16 September 2021 / Accepted: 18 September 2021 / Published: 22 September 2021

Abstract

:
Riparian Ecological Infrastructures are networks of natural and semi-natural riparian areas located in human-dominated landscapes, crucial in supporting processes that directly or indirectly benefit humans or enhance social welfare. In this study, we developed a novel multimetric index, termed Habitat Ecological Infrastructure’s Diversity Index (HEIDI), to quantify the potential of Riparian Ecological Infrastructures in supporting biodiversity, and related ecosystem services, in three managed landscapes: Intensive Agriculture, Extensive Agriculture, and Forest Production. Metrics describing the structure, composition, and management of riparian vegetation and associated habitats were used to derive the potential of Riparian Ecological Infrastructures in supporting three distinct biological dispersal groups: short-range dispersers (ants), medium-range dispersers (pollinators), and long-range dispersers (birds, bats, and non-flying small mammals). The composition of floristic resources, assessed by identifying trees and shrubs at the species and genus level, and herbaceous plants at the family level, was used as a proxy to evaluate the potential of Riparian Ecological Infrastructures in promoting seed dispersal and pollination ecosystem services provided by the three biological communities. Our research evidenced that Riparian Ecological Infrastructures located in the Forest Production and Intensive Agriculture landscapes exhibited the highest and lowest potential for biodiversity-related ecosystem services, respectively. The Forest Production landscape revealed higher suitability of forage resources for short- and medium-range dispersers and a higher landscape coverage by Riparian Ecological Infrastructures, resulting in more potential to create ecological corridors and to provide ecosystem services. The Riparian Ecological Infrastructures located in the Extensive Agriculture landscape seemed to be particularly relevant for supporting long-ranges dispersers, despite providing less habitat for the biological communities. Land-use systems in the proximity of Riparian Ecological Infrastructures should be sustainably managed to promote riparian vegetation composition and structural quality, as well as the riparian width, safeguarding biodiversity, and the sustainable provision of biodiversity-related ecosystem services.

1. Introduction

Human beings have exploited natural landscapes causing biodiversity losses and depleting crucial Ecosystem Services (ES), essential for current and future generations. Floodplains and their associated riparian habitats are amongst the most biologically diverse on Earth [1,2,3] and have inestimable ecological, economic, and cultural values [4,5]. They are ecotones, located in the interface between aquatic and terrestrial ecosystems, encompassing the stream channel and that portion of the terrestrial landscape where vegetation may be influenced by fluctuations in the water table, flooding, and by the ability of the soils to hold water [6]. For this reason, floodplains and their associated riparian habitats are among the most human-exploited ecosystems in Mediterranean regions, due to the high productivity resulting from the frequent floods and the subsequent highly dynamic geomorphologic processes [7,8]. A growing literature has been highlighting the relevance and challenges of biodiversity conservation in riparian habitats surrounded by human-dominated landscapes [9,10,11]. New research is recently emerging, reflecting concerns about the need to promote integrative and sustainable management of landscapes that reconciles human land-use with the improvement of biodiversity and biodiversity-related ES in riparian habitats [12,13,14,15,16]. Several national and European policies, such as the Green Infrastructure and the Biodiversity Strategy agenda, promote the preservation of natural and semi-natural landscape elements, important for biodiversity conservation and the provision of biodiversity-related ES—the commonly denominated Ecological Infrastructures (EIs) [17,18]. As highly diverse and relevant ES providers in human-dominated landscapes, riparian habitats may adopt the concept of EIs, and therefore be termed as Riparian Ecological Infrastructures (REIs).
REIs located in Mediterranean regions have been described as high-value and resilient ecosystems, although subject to a long history of human pressure [19,20]. Among the multiple impacts affecting these REIs, the conversion of floodplains to intensive agriculture is one of the most severe [21,22,23]. In flat agricultural landscapes of Mediterranean lowland riverine zones, REIs have either been extensively fragmented or highly modified due to competing interests by stakeholders [7,9]. Further, in agrosilvopastoral systems, characterized by large areas with low impact livestock raising, cork oak extraction, and crop production with long rotations and closed nutrient cycles [24], human management has been causing the pervasive reduction of the riparian width [7,25]. Forest production systems, on the other hand, are often allocated to middle and upstream riverine zones, where unproductive areas with steep slopes are located. Such forested ecosystems in Portugal are dominated by monospecific stands, such as blue gum eucalyptus (Eucalyptus globulus Labill.) and maritime pine (Pinus pinaster Aiton) plantations. REIs in such areas usually show alterations in floristic composition, with an increase in the number and abundance of non-native species, and reductions in the riparian width [26,27].
In Mediterranean regions, REIs are composed of complex ecosystems characterized by a high diversity and abundance of plant species [19,28]. They support higher faunistic species richness than adjacent drylands, especially when surrounded by monocultures [29]. Complex floristic-biological interactions in riparian habitats have been related to the high variability and seasonal availability of water, shelter, nesting, and forage resources, such as seeds, pollen, nectar, and fleshy fruits [2,30,31,32]. In addition, several vegetation attributes of riparian habitats, such as the strata complexity [33,34], the connectivity (i.e., the degree to which the landscape facilitates or impedes movement among riparian vegetation patches [1,35,36]), and the presence of microhabitats (e.g., tree hollows, deadwood trunks, leaf litter) [37,38] are also considered critical for distinct biological communities.
The protection of well-preserved REIs and the need for restoration of highly altered ones has become an essential priority to long-term environmental and human well-being sustainability [4,13,14]. The potential of REIs in supporting distinct functional biological groups has been pointed out as a valuable indicator for the evaluation of ES, such as the provision of dispersal pathways [5,17,39]. These should be considered at different spatial scales and considering different biological dispersal capabilities. Short-range dispersers, such as ants, are involved in regulating and supporting services related to soil movement, decomposition, nutrient cycling, animal community regulation, and seed dispersal [40,41,42]. Medium-range dispersers, such as pollinators, are responsible for pollination services, contributing to the yield, quality, and stability of important crops while also safeguarding the conservation of wild plant populations [43,44]. Long-range dispersers, such as birds and other vertebrates, including bats and non-flying small mammals, may contribute to seed dispersal [45,46,47] and pest suppression services [48,49].
Riparian habitats, as ES providers, have been extensively studied under a functional approach [5,15,50,51,52]. Nevertheless, a tool to estimate the potential of REIs as providers of biodiversity-related ES in Mediterranean human-dominated landscapes is still lacking. To the best of our knowledge, no assessment tool directly addresses the potential of REI’s traits in supporting biodiversity and promoting biodiversity-related ES in Mediterranean human-dominated landscapes. Additionally, the adoption of a proxy-based solution supported by bibliographic knowledge, which uses the structure and composition of riparian vegetation as a surrogate for the abundance and diversity of animal species, may provide additional detail, or function as an alternative when field data are unavailable [53]. In this context, our study aims to:
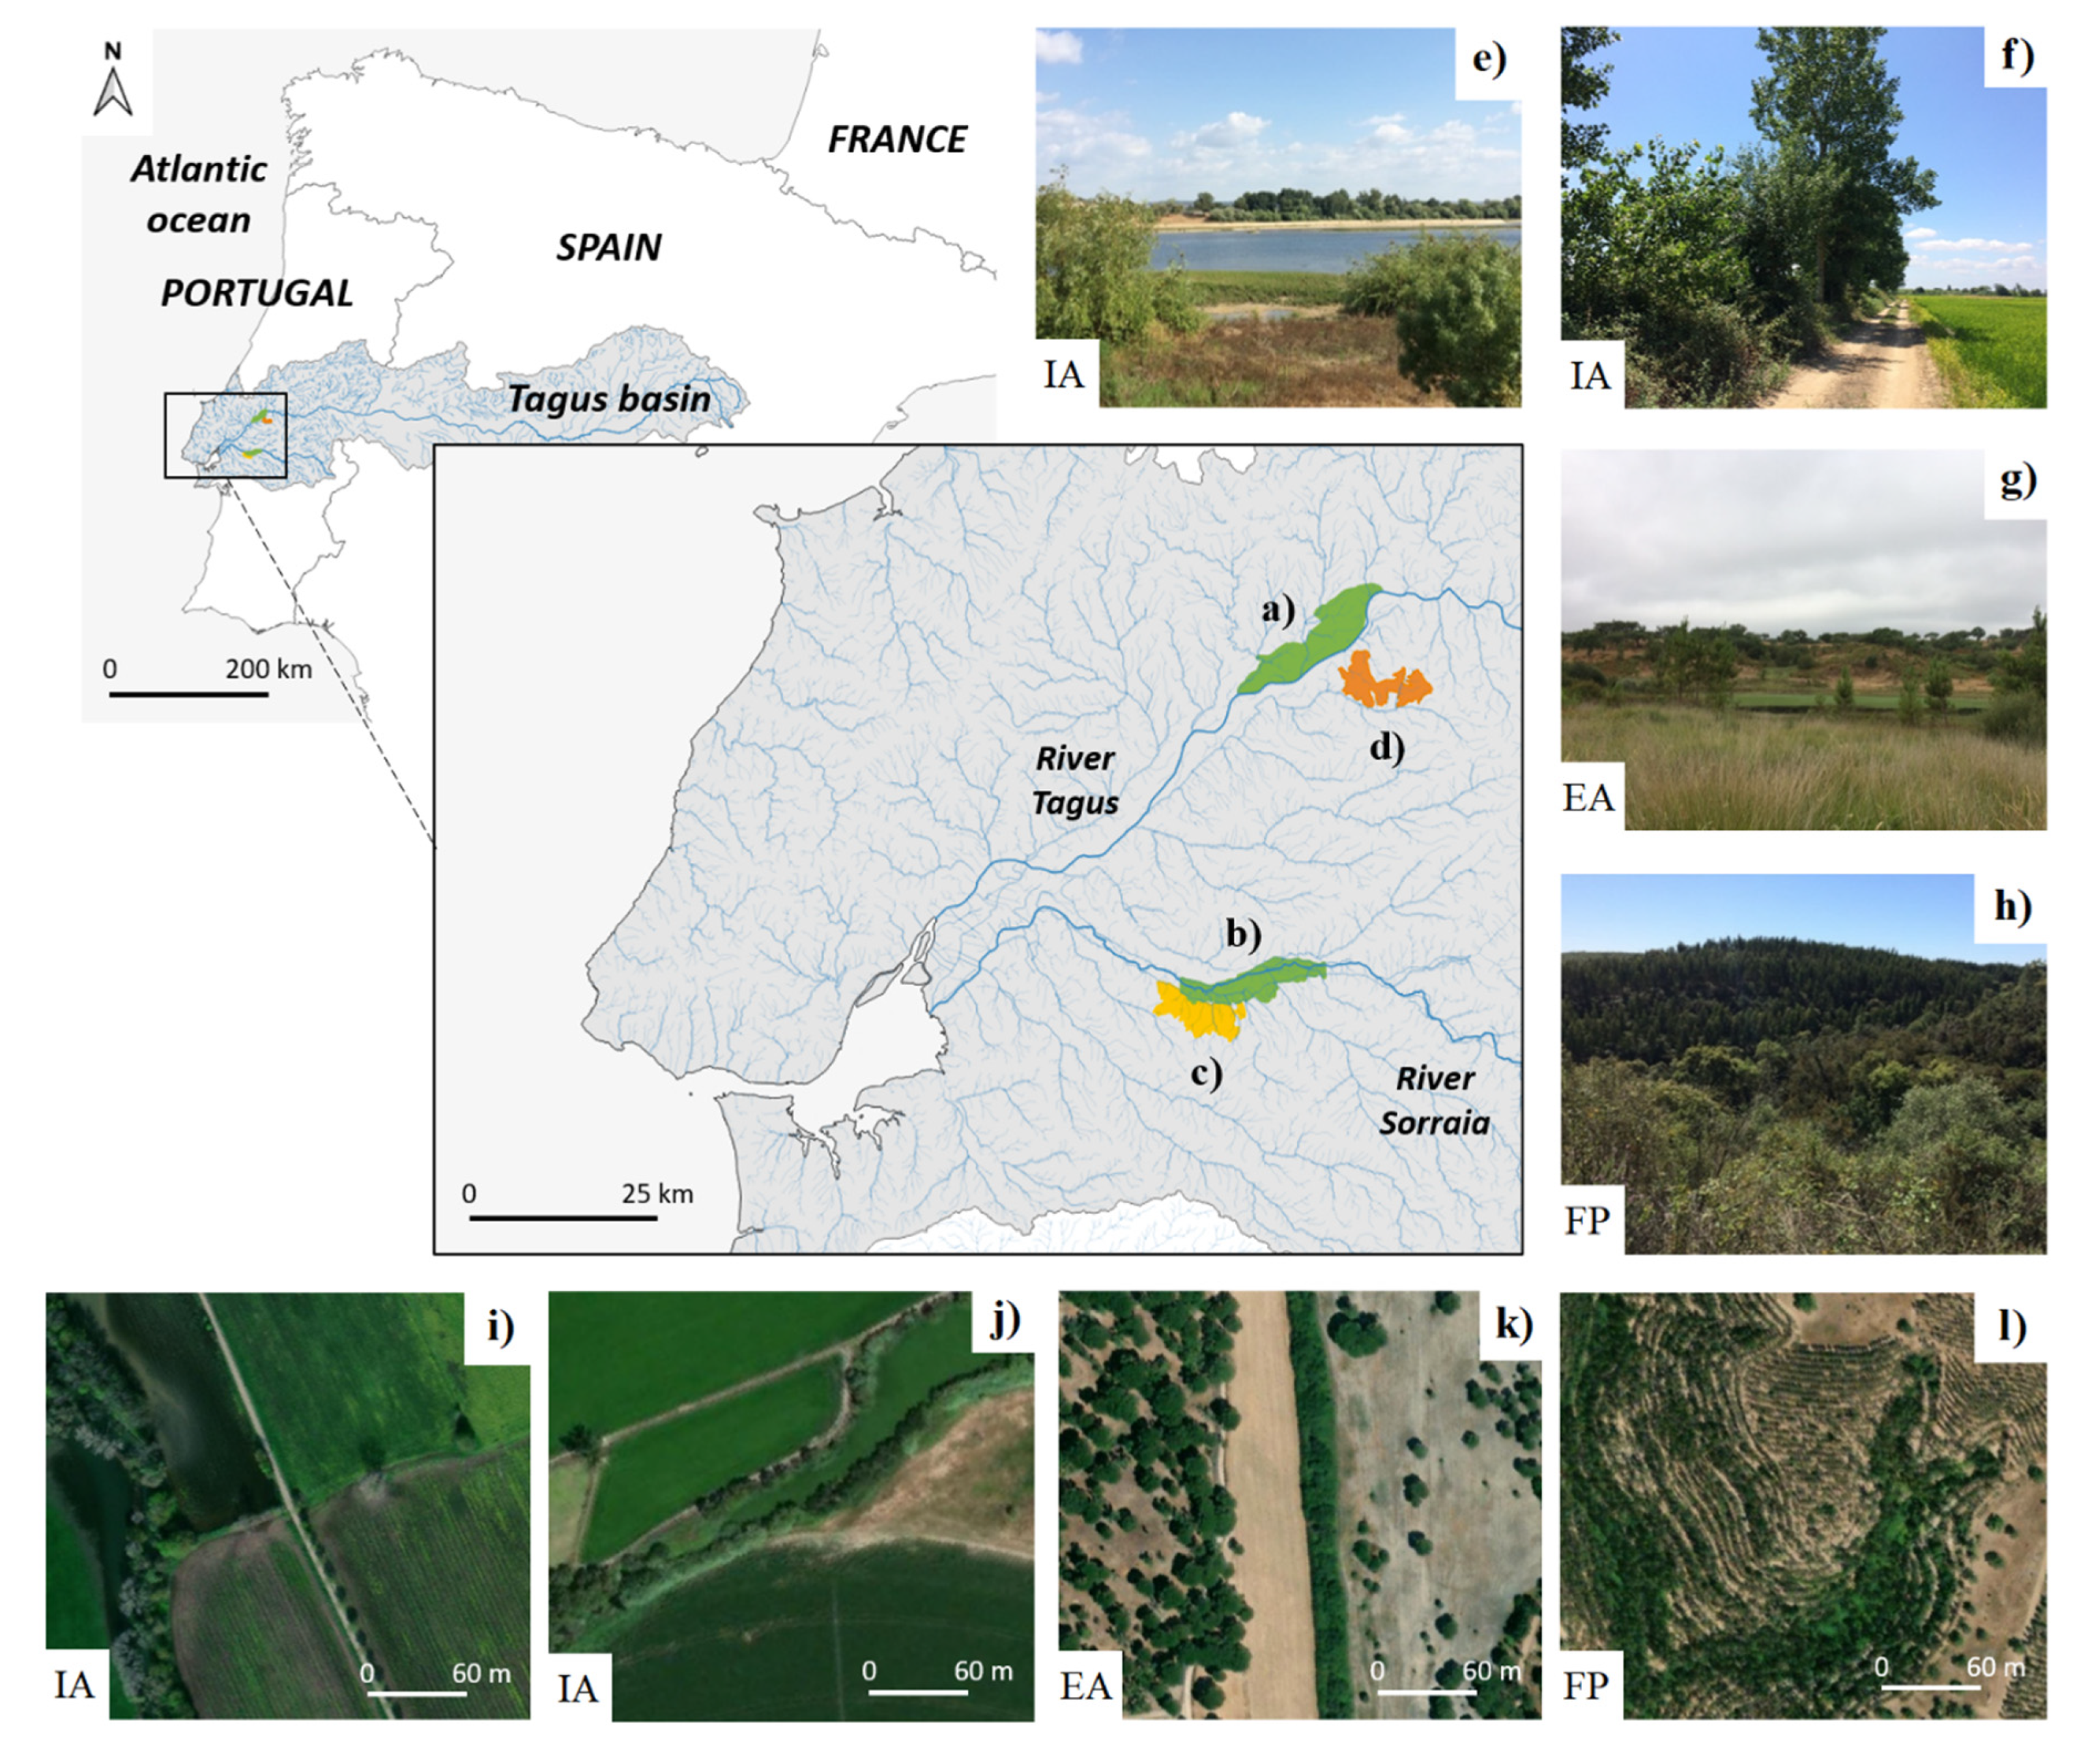
  • Characterize the structural attributes of existing Riparian Ecological Infrastructures (REIs) in three distinct Mediterranean human-dominated landscapes: Intensive Agriculture (IA), Extensive Agriculture (EA), and Forest Production (FP);
  • Develop a new suitability metric, based on the floristic composition of riparian vegetation, and use it as a proxy to evaluate the potential of REIs in supporting seed dispersal and pollination Ecosystem Services (ES) provided by three biological dispersal groups: short-range dispersers (represented by ants), medium-range dispersers (represented by pollinators), and long-range dispersers (represented by birds and non-flying small mammals);
  • Derive a novel multimetric index, termed Habitat Ecological Infrastructure’s Diversity Index (HEIDI), by integrating metrics related to the structure and management of riparian vegetation with the new suitability metric, and use it to estimate the potential of REIs in supporting biodiversity and promoting the ES provided by the three biological dispersal groups in each landscape.
We generally aim to test if the estimated potential of REIs in supporting biodiversity and related ES varies across the three landscapes and between woody and non-woody REI classes. We also aim to identify the main causes that may lead to its variability in each landscape.

2. Materials and Methods

2.1. Study Area

This study was conducted in riparian and floodplain zones of the Sorraia and Tagus rivers (Portugal) (Figure 1). The studied area is embedded in three distinct human-dominated landscapes: (i) Intensive Agriculture (IA), composed of two separated areas occupying 139.29 km2 and placed in alluvial zones dominated by rice paddies and irrigated maize crops (Figure 1a,b); (ii) Extensive Agriculture (EA), covering 44.27 km2 and consisting in a “montado”, i.e., an agrosilvopastoral system composed by sparse cork oak stands (Quercus suber L.), livestock in low densities and long rotation cereal crops (Figure 1c); and (iii) Forest Production (FP), covering 42.04 km2 and composed of blue gum eucalyptus plantations intertwined with occasional maritime pine stands and near-natural cork oak forest remnants (Figure 1d).
The study area is characterized by mild winters and hot dry summers (type Csa—hot-summer Mediterranean), with frequent interannual fluctuations of precipitation [54]. Flood peaks usually occur in early winter, followed by a slow decline of flow and consequent drying during late spring and summer. The mean annual rainfall for the three landscapes is 702.1 mm and the mean annual temperature is 16.5 °C [55].

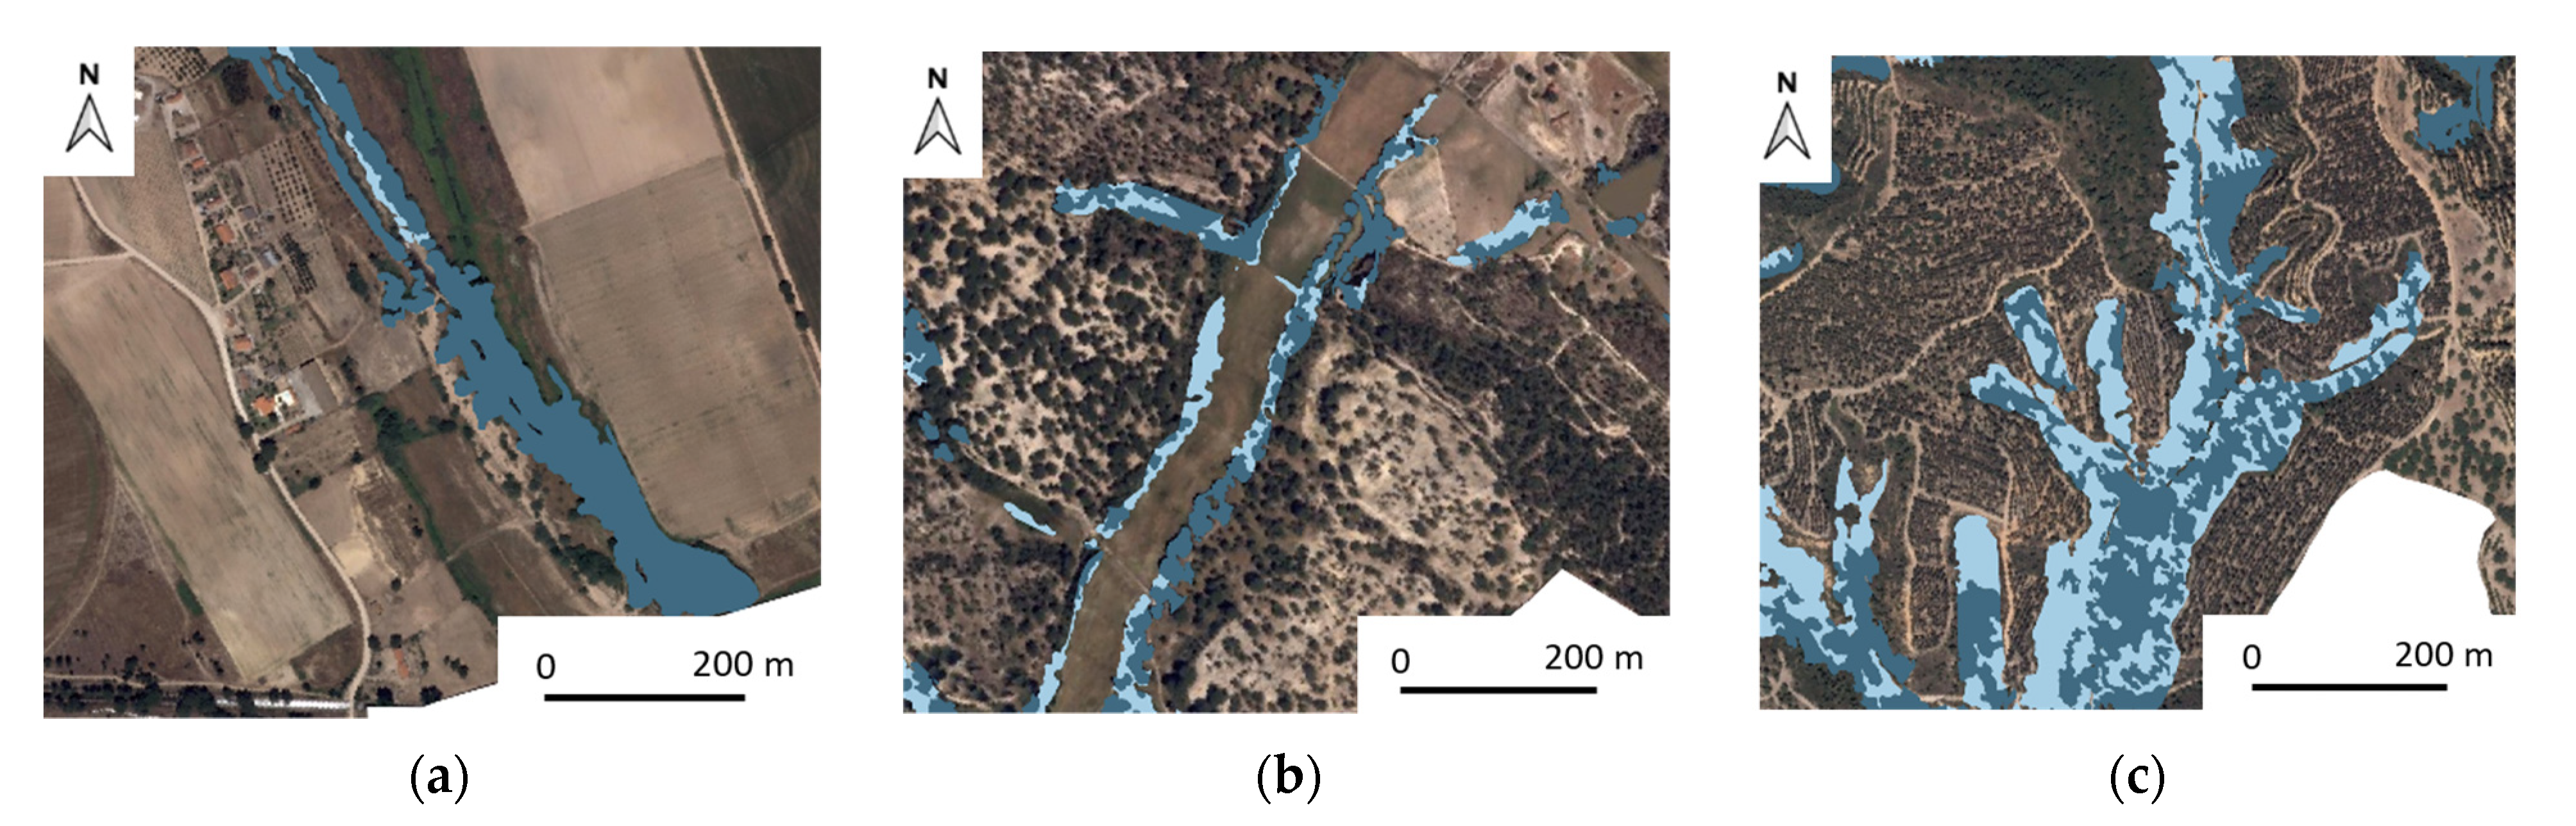
2.2. Riparian Ecological Infrastructures (REIs)

The Riparian Ecological Infrastructures (REIs) are composed of remnant woody and non-woody vegetation patches, located in the surroundings of the river reaches. Woody REI patches are characterized by trees and tall shrubs, from the edge of the stream bank to the external limit of the canopy, where an abrupt change in vegetation type, height, and amount occurs [56]. Trees were considered single-stemmed woody species, with lateral branches, and including mostly micro- (2–8 m), meso- (8–30 m), macro- (30–50 m), and megaphanerophytes (>50 m) according to the Raunkiær classification [57]. Shrubs were considered woody species branched from near the basis, usually up to 8 m, and including mostly nano- (<2 m) and microphanerophytes (2–8 m). Non-woody REI patches include open areas and are mostly dominated by low bushes and herbaceous communities.
The river reaches were initially identified using a layer of Portuguese rivers based on a 25 m resolution Digital Elevation Model. We improved the extent and detail of the river reaches using an image-based approach supported by a Geographic Information System (QGIS Version 3.4, QGIS Association, http://www.qgis.org, accessed on 20 September 2021) and digitized small tributaries and headwater streams over the high-resolution ESRI World Imagery layer (ArcGIS Online data, Copyright © Esri Inc., West Redlands, CA, USA), obtained in 2018, with a spatial resolution of 0.6 m (Supplementary Materials Figures S1–S4).
REI data were gathered by manually digitizing homogeneous riparian vegetation patches, at a 1:1000 scale over the high-resolution Esri World Imagery layer, using the QGIS platform. These patches were then visually classified into woody and non-woody classes, by on-screen photo interpretation based on differences of shape, color, and texture in relation to their surroundings [56]. We selected a Minimum Mapping Unit (MMU) of 200 m2, with a minimum width of 5 m, and a Minimum Gap (MG) distance among REI patches of 10 m [58]. For mapping purposes, the MMU and the MG thresholds were established to represent the minimum patch size and minimum distance between patches that are considered ecologically meaningful for the biological groups under analysis [42]. Afterward, the geographic location and the classification of the digitized REI patches were validated and reclassified, if necessary, with field surveys conducted from late Spring to early Summer of 2019.

2.3. REI’s Structural Attributes

Landscape metrics were calculated to characterize the structure of REI patches [56] using the software FRAGSTATS [59] and ArcGIS Desktop 10.5 (Copyright © 1999–2016 Esri Inc.). Three metrics were selected to represent the area and the density of REI patches: (i) Number of Patches (NP), indicating the number of woody and non-woody REI patches in each landscape; (ii) Class Area (CA) (ha), representing the total area occupied by the woody and non-woody REI classes in each landscape; and (iii) Mean Patch Size (MPS) (ha), referring to the mean woody and non-woody REI patch size in each landscape. The shape of the REI patches was quantified using the Mean Shape Index (MSI), where higher values correspond to more complex shapes. The mean nearest neighbor distance between REI patches (MNN) (m) was calculated by considering the mean distance between each REI to the closest REI of the same class. A sixth metric, termed Class Coverage (CC), was created to determine the percentage of the total area occupied by the woody and non-woody REI classes in each landscape.

2.4. Field Sampling

During the field surveys, conducted from late Spring to early Summer of 2019, we also collected data on the habitat heterogeneity of REIs, using a field sheet comprised of specific metrics extracted and adapted from the Indice de Biodiversité Potentielle, developed by Larrieu and Gonin [60] (Supplementary Materials Table S1). These metrics were specifically selected since they represent key habitat features for the three biological dispersal groups under analysis. They include: (a) the number of native tree species; (b) invasive species cover (%); (c) the number of vertical strata; (d) the number of trees with microhabitats above 3 m, such as tree hollows; (e) the number of trees with microhabitats below 3 m, including cavities in the trunk and crevices in the bark; (f) the number of standing dead trees; (g) the number of deadwood trunks on the ground; (h) the number of large living trees; (i) leaf litter cover (%); (j) the number of distinct rocky habitat types; (k) the number of distinct aquatic habitat types; (l) understory clearing (%); and (m) tree clearing (%).
In addition, we also identified trees and shrubs at the species and genus level, and herbaceous plants at the family level. Their abundances were classified in the field as either “present” (<30% of covered area) or “dominant” (≥30%) for trees, and as either “isolated individuals”, “abundant” (<30%), or “dominant” (≥30%) for shrubs and herbaceous plants. All woody taxa were later classified according to their invasiveness (invasive or non-invasive), size (using the Raunkiær classification [57]), and riparian status (obligate, preferential, facultative, or non-riparian) following the classification system developed by Johnson et al. [61].
For the field sampling, we selected a balanced sub-set of randomly distributed woody and non-woody REI patches—Sampling Units (SUs)—across the three human-dominated landscapes. Field data were collected in an area corresponding to the previously described MMU in each SU (200 m2). A minimum distance of 500 m was selected between SUs to allow for adequate spatial coverage of the study area.

2.5. Habitat Ecological Infrastructure’s Diversity Index (HEIDI)

Using the field data, we developed a novel multimetric index termed Habitat Ecological Infrastructure’s Diversity Index (HEIDI). Five categories of REI features were taken into account: (1) Vegetation structure; (2) Vegetation habitats; (3) Associated habitats; (4) Vegetation management; and (5) Floristic suitability. The first four categories include the adapted metrics extracted from the Indice de Biodiversité Potentielle [60]. The Floristic suitability category was newly developed to evaluate the potential of floristic composition as a proxy of habitat quality and diversity for the three biological dispersal groups. Specific metrics of floristic suitability were developed for each of the biological dispersal groups, namely: (i) Seed production suitability, for short-range dispersers (represented by ants); (ii) Pollen production suitability, for medium-range dispersers (represented by pollinators); and (iii) Fruit production suitability, for long-range dispersers (represented by birds and non-flying small mammals). The development of these novel floristic composition-derived metrics was supported by extensive bibliographic research and represents a functional evaluation of habitat diversity by assessing the capacity of plant taxa to provide food resources for the three biological dispersal groups (Supplementary S1).
Seed production suitability was developed by identifying the occurrence of plant species with elaiosome-bearing seeds, i.e., lipid-rich seed appendages that attract ants and serve as rewards for dispersal [62], and by assessing the potential for myrmecochory, i.e., the dispersal of seeds by short-range dispersers. Pollen production suitability was developed by identifying plants adapted to entomophily, i.e., pollination by insects. Plants with both the production of pollen and nectar are likely to attract medium-range dispersers, represented by a wide range of pollinator groups such as bees, wasps, and syrphid flies [32]. Fruit production suitability was developed by considering plants adapted to endozoochory, i.e., dispersed by vertebrates internally [47]. These plants usually produce fleshy fruits likely to attract long-range dispersers, namely vertebrate species such as birds and non-flying small mammals [63].

2.6. HEIDI Calculation

2.6.1. HEIDI Scoring System

The HEIDI is a multimetric index and consists of a combination of several metrics with scores of “low”, “fair”, or “high”, representing an increasing contribution of REIs to habitat diversity and quality for short-, medium-, and long-range dispersers. The collected data for the Vegetation structure, Vegetation habitats, Associated habitats, and Vegetation management categories were scored according to their relevance for each biological dispersal group. For this, we used several criteria extracted from bibliographic research and expert judgment and followed the scoring method of Karr [64] (Table 1). It should be noted that, according to the consulted references, some metrics of the HEIDI have been considered as common for all biological dispersal groups, while others are exclusive of one or two groups. Further, since different faunistic groups may respond differently to the same habitat features, specific HEIDI metrics may assume different scores depending on the biological group under analysis. For example, on one hand, the amount of leaf litter may positively affect the distribution of short-range dispersers, as many ant species depend on this layer of organic matter for nesting and foraging [65,66]. On the other hand, the amount of leaf litter may have a negative effect on the distribution of medium-range dispersers, as it may prevent herbaceous species from sprouting, which can lead to a shortage of food resources [32].
For the new Floristic suitability category, we developed an initial scoring system (values ranging from 1 to 10) to represent the increasing potential of plant taxa as forage resource providers for each biological dispersal group. This initial scoring system allowed us to classify each plant taxa as having “very low” (0 or 1), “low” (2 or 3), “moderate” (4, 5 or 6), “high” (7 or 8), or “very high value” (9 or 10) for the biological communities under analysis (Supplementary S1 and Tables S2–S10). Then, we calculated the sum of the initial scores of all plant taxa identified within each SU, for each dispersal group, and considered that all summed scores below the first quartile, in between the first and third quartile, and higher than the third quartile would get the final HEIDI score of “low”, “fair” and “high”, respectively (Table 1).

2.6.2. HEIDI Estimation

The HEIDI value concerning the potential of each SU to support biodiversity and promote related ES was estimated by adapting an index for ordinal data with unequally weighted classes, developed by Perakis et al. [79]. This index uses the proportion of SUs with scores of “low”, “fair”, and “high” in each of the five HEIDI categories. It takes values from zero to infinity, and measures, for each SU, the degree of concentration on the scores of “high”. Since no SUs were scored with “high” on all five HEIDI categories, and since such a score would only be feasible for riparian habitats under undisturbed circumstances [80], the estimated HEIDI value of infinite should not apply to REIs.
Given the above assumptions, the HEIDI value of each SU, and for each biological dispersal group, can be estimated using the following equation, adapted from Perakis et al. [79]:
HEIDI = i = 1 [ k / 2 ] + 1 w i p ¯ i i = [ k / 2 ] + 1 k w k i + 1 p ¯ i
where k is the total number of HEIDI scoring classes (k = 3; “low”, “fair”, and “high”), p ¯ is the arithmetic average of the observed proportion of HEIDI categories assuming each of the k classes (with p ¯ 3 referring to the average proportion of HEIDI categories assuming the score “low”, p ¯ 2 the score “fair”, and p ¯ 1 the score “high”), and w is the weight attributed to the corresponding k class. For HEIDI categories with more than one metric, such as the Vegetation structure and Vegetation habitats, p is represented by the arithmetic average of the observed proportion of metrics assuming each of the k classes.
The weight w was calculated for each k class using the following equation, also adapted from Perakis et al. [79]:
w j = 2 ( [ k / 2 ] j + 2 [ k / 2 ] + 2 ) ,   j = 1 , ,   [ k / 2 ] + 1
Since k = 3, w1 = 4/3 for the HEIDI scores of “low” and “high”, and w2 = 2/3 for the HEIDI score of “fair”.
A global HEIDI value, to evaluate the potential of each SU for the overall biodiversity and related ecosystem services, hereafter termed global HEIDI, was calculated for each landscape using the arithmetic average of the estimated HEIDI values of each biological dispersal group.

2.7. Statistical Analysis

To understand how REIs vary across the three human-dominated landscapes, both structurally (using the landscape metrics) and qualitatively (using the estimated HEIDI values), a non-parametric Kruskal–Wallis test, with 2 degrees of freedom, was applied. Dunn’s post hoc comparisons were run whenever a significant statistical difference between landscapes was found (p < 0.05). To understand how estimated HEIDI values vary between woody and non-woody REIs, we applied a Mann–Whitney U test. All statistical analyses were performed using the JASP software Version 0.14.1 [81].

3. Results

3.1. REI’s Structural Attributes

A total of 538, 592, and 820 REI patches were identified in the Intensive Agriculture (IA), Extensive Agriculture (EA), and Forest Production (FP) landscapes, covering a total of 441.55, 142.80, and 462.45 ha, respectively (Supplementary Materials Figures S5–S8). Nevertheless, those REI areas only represent 5.2% of the three landscapes. While the FP was the smallest study area, REI patches were more numerous and covered a larger portion of the landscape when compared to the IA and EA landscapes. Furthermore, REI woody patches were generally larger and more numerous than non-woody patches in all three landscapes (Table 2).
Irrespective of the landscape metrics, REI patches displayed a wide variety of spatial configurations, with overall significant statistical differences between the three landscapes regarding patch size, nearest neighbor and shape index (Supplementary Materials Table S11). Although REI patches form natural elongated shapes, following the trajectory of the riparian corridors, some differences are apparent in their size and spatial distribution. On one hand, woody REI patches in the IA landscape had a higher mean patch size, with a higher number of REIs with more than 10 ha (higher MPS standard deviation). On the other hand, non-woody REI patches in the IA landscape were significantly smaller and more fragmented (lower MPS and MNN) (Figure 2a). In the EA landscape, woody REI patches featured simpler spatial configurations (lower MSI) and were significantly smaller and more fragmented (lower MPS and higher MNN) (Figure 2b), whereas in the FP landscape they were more numerous and covered more of the total landscape (higher NP and CC). As for non-woody REI patches located in the FP landscape, they were larger and in higher numbers, with overall lower fragmentation levels (higher MPS and lower MNN) and higher landscape coverage (higher CC) (Figure 2c).

3.2. Global HEIDI Results

A total of 39, 28, and 24 SUs were surveyed in woody REIs, and 22, 18, and 20 SUs in non-woody REIs located in the IA, EA, and FP landscapes, respectively (Supplementary Materials Figures S9–S12). The highest global HEIDI value, i.e., considering all biological dispersal groups, was achieved in the FP landscape, followed by the EA and IA landscapes (Table 3). Differences between the IA and EA, and between the IA and FP landscapes were statistically significant (p = 0.022, p = 0.002, respectively). Nevertheless, when considering the biological dispersal groups separately, only short- and medium-range dispersers had significantly different HEIDI values between landscapes. Dunn’s post hoc tests revealed that the habitat diversity within REI patches, for short- and medium-range dispersers, was significantly different between the IA and FP landscapes, and also between the IA and EA landscapes for short-range dispersers (Supplementary Materials Table S12).
Regarding the structural classification of REI patches, for all biological dispersal groups, higher estimated HEIDI values were associated with woody REIs. Differences between woody and non-woody REIs were statistically significant for global HEIDI values (p < 0.001), except for medium-range dispersers (p = 0.167) (Table 4).

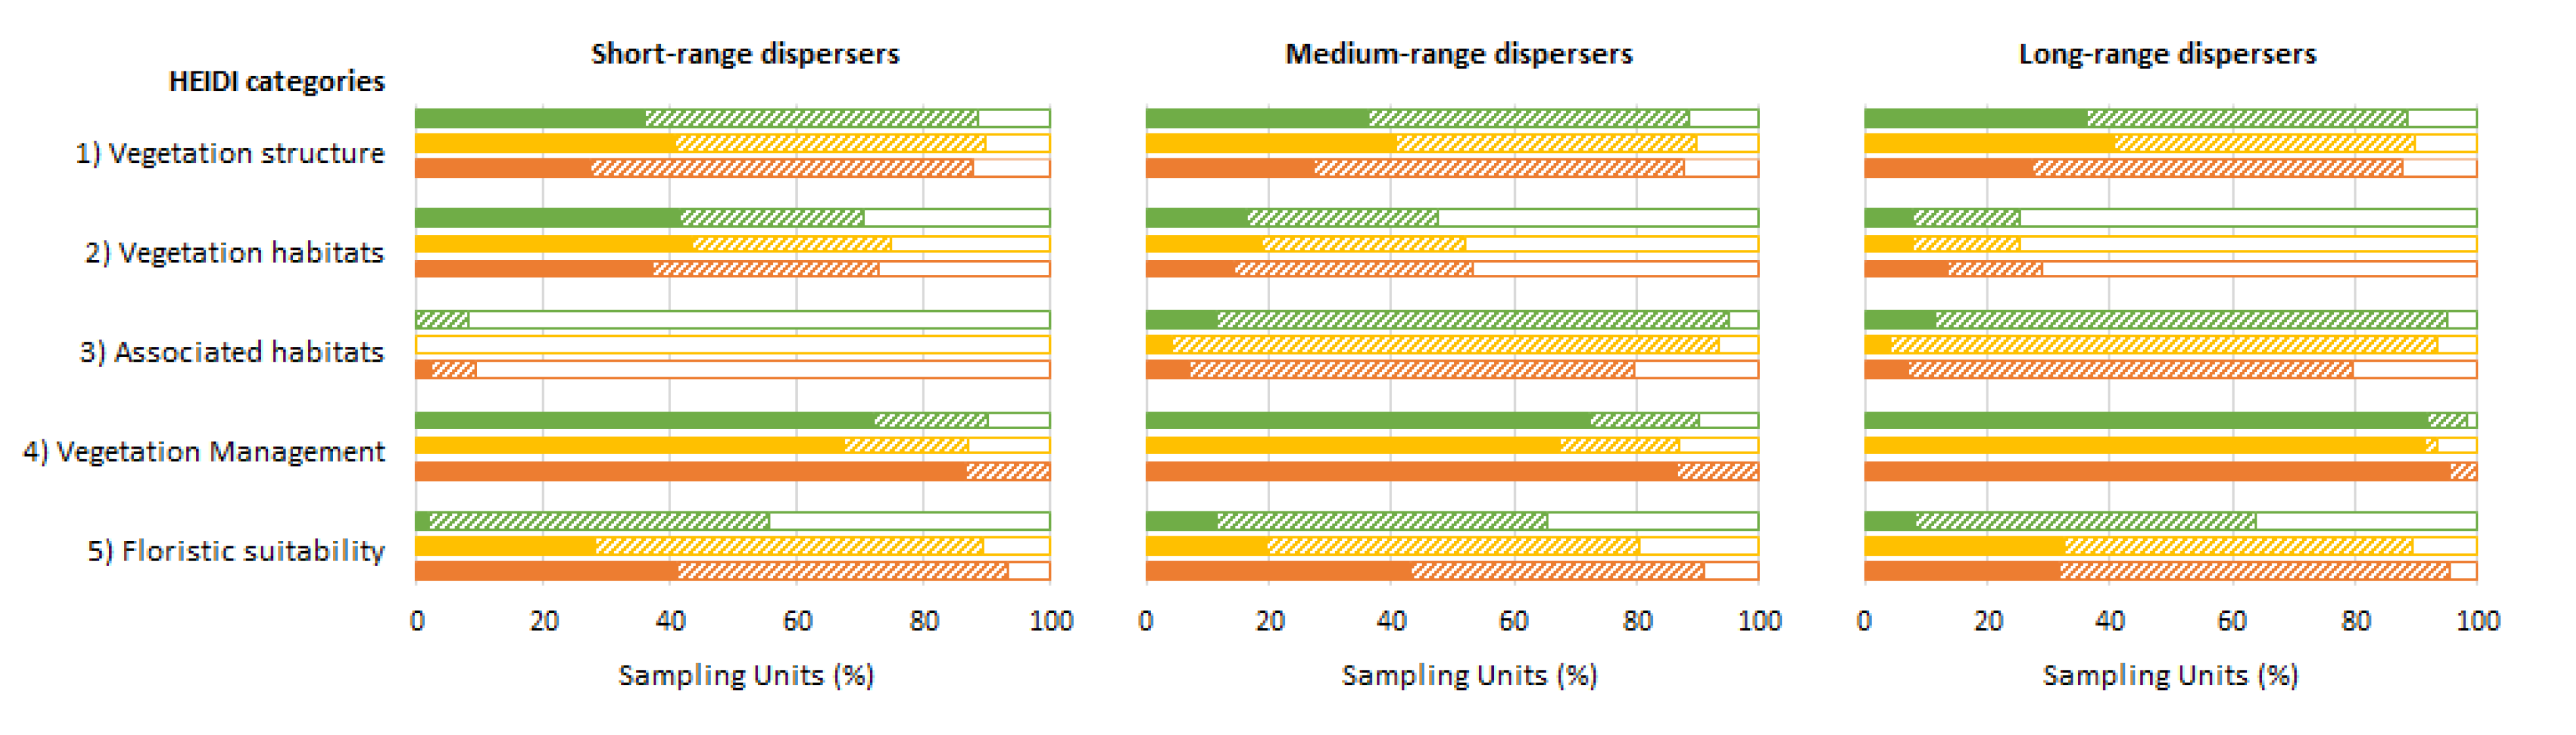
3.3. HEIDI Results by Category

3.3.1. Vegetation Structure, Vegetation Habitats, Associated Habitats, and Vegetation Management

The proportion of SUs with HEIDI scores of “low”, “fair”, and “high” was distinct for all HEIDI categories, across all biological dispersal groups, and all landscapes (Figure 3). In the Vegetation structure category, SUs in the EA landscape showed a higher proportion of “high” scores. These SUs showed a reduced cover of invasive species and a higher number of native tree species when compared to the IA and FP landscapes (Table 5). Ash (Fraxinus angustifolia Vahl), grey-willow (Salix atrocinerea Brot.), and cork oak were the most frequent native tree species found in SUs located in the IA, EA, and FP landscapes, respectively (Supplementary Materials Table S13). Invasive species were mostly represented by giant reed (Arundo donax L.) in the IA and EA landscapes and bushy needlewood (Hakea sericea Schrad. and J.C. Wendl.) in the FP landscape. The proportion of SUs with a higher number of vertical strata was greater in the IA, followed by the FP and EA landscapes (Table 5).
Regarding the Vegetation habitats category, Sus in the EA landscape displayed an overall higher proportion of Sus with HEIDI scores of “high”, except for long-range dispersers, where the FP landscape was favored (Figure 3). On one hand, the number of trees with microhabitats above 3 m was higher in Sus located in the EA and FP landscapes. On the other hand, the IA landscape showed a higher number of trees with microhabitats below 3 m. As for the number of deadwood trunks on the ground and standing dead trees, Sus located in the EA landscape showed a higher proportion of “high” scores. Concerning the number of large living trees, a higher proportion of Sus with five or more trees was observed in the IA landscape (Table 5).
For the Associated habitats category, the diversity of habitat types was higher in Sus located in the IA landscape for medium- and long-range dispersers, and in the FP landscape for short-range dispersers (Figure 3). Nonetheless, rocky habitats were rare in all landscapes (Table 5). For the Vegetation management category, we observed that Sus located in the EA landscape showed a slightly higher management activity regarding tree and understory clearing for all biological dispersal groups (Figure 3).

3.3.2. Floristic Suitability

Overall, we have identified a total of 28 tree and 27 shrub taxa from 23 families, and 44 herbaceous families (Supplementary Materials Tables S13–S15). The highest potential of floristic composition to support the biological communities was achieved in the FP landscape (Figure 3). However, Sus in the IA landscape presented higher overall plant richness (n = 66), especially in tree taxa (n = 21, of which 12 are native) and herbaceous taxa (n = 31); while Sus in the FP landscape had a higher richness in shrubs (n = 16, with 15 natives).
For the “Seed production suitability” metric, the SU with the highest potential, given by the sum of the initial scores of the Floristic suitability category, was found in the FP landscape. This SU was located in a woody REI and was composed of blue gum eucalyptus and maritime pine in the higher strata, with dominant Cistus sp. And Ulex sp. In the lower strata, and narrow-leaved mock privet (Phillyrea angustifolia L.) together with mastic tree (Pistacia lentiscus L.) in abundance. The lowest potential for seed dispersal by short-range dispersers was achieved in Sus of the IA landscape, where the sum of the initial scores for the Floristic suitability category was equal to 0. These Sus were mostly composed of ashes and willows (Salix sp.) and dominated in the understory by Asteraceae, Poaceae and Typhaceae.
As for the “Pollen production suitability” metric, the SU with the highest potential for pollination was equally found in the FP landscape. This SU was located in a non-woody REI dominated by Ulex sp., with Cistus sp., Erica sp., Mediterranean buckthorn (Rhamnus alaternus L.), myrtle (Myrtus communis L.), Rubus sp., and Erica sp. In abundance, together with Poaceae and Xanthorrhoeaceae herbaceous families. The lowest potential for pollination was found in the IA landscape, in an atypically woody REI dominated by ash and by planted Mediterranean hackberry (Celtis australis L.) and river oak (Casuarina cunninghamiana Miq.), with several herbaceous Poaceae in the understory.
For the “Fruit production suitability” metric, although the EA landscape showed an overall higher proportion of Sus with scores of “high”, the SU with the highest potential to attract birds and non-flying small mammals was found in the IA landscape. This SU was located in a non-woody REI, featuring a total of 12 plant taxa, dominated by blackthorn (Prunus spinosa L.) and Rubus sp., with a large area occupied by elderberry (Sambucus nigra L.) and hawthorn (Crataegus monogyna Jacq.) alongside several Apiaceae and Poaceae herbaceous taxa. The lowest potential for seed dispersal by birds and non-flying small mammals was mostly found in Sus of the IA landscape.

4. Discussion

4.1. Relevance of REI’s Structural Attributes for Biodiversity

The heterogeneity of habitats found within REIs and the spatial configuration of REI patches are essential features in supporting the dispersal of the considered biological groups. Several studies suggest that animal species richness and diversity are positively correlated with the structure and composition of riparian vegetation patches [2,29,82,83].
Woody REIs are generally more numerous and larger than non-woody REIs, covering a higher proportion of the study area in all landscapes while being less fragmented. Additionally, global HEIDI values tend to be significantly higher in woody REIs. This is especially evident in the Intensive Agriculture landscape. The larger mean patch size of woody REIs in the IA landscape may represent more available habitats for the biological communities [84], but the combination of elongated shapes with a higher fragmentation increases the likelihood of contact with the surrounding landscape [58]. In highly modified landscapes, such as irrigated croplands, REI patches are few and elongated, only exceptionally occupying large areas, meaning edge effects will be elevated, which is known to have a detrimental effect on biodiversity [7]. Thus, the lower estimated HEIDI values for Sus located in the IA landscape may suggest a higher influence of the croplands and their management practices on the overall quality of REIs, corroborating similar findings [85].
In the Extensive Agriculture landscape, even though woody REIs are more numerous than in the IA landscape, they are also significantly smaller and cover less of the total landscape. Despite this, the EA landscape had Sus with higher HEIDI values. This may be due to the less impactful nature of the surrounding “montado”, as agroforestry systems tend to be less detrimental for biodiversity when compared to agricultural areas [85,86].
Regarding the REIs located in the Forest Production landscape, even though they appear to have similar structural attributes to those of the IA landscape, they are less fragmented and occupy a much larger portion of the study area. This is a consequence of a higher number of patches, especially non-woody REI patches, which also tend to be larger than those of the IA landscape. Considering the higher coverage and the common contiguous character of REIs associated with riparian corridors, this may translate into wider REIs, where the detrimental edge effects on biodiversity are not as prevailing [69,87]. As a consequence, Sus located in the FP landscape may tend to have higher estimated HEIDI values. Nonetheless, woody and non-woody REIs in all three landscapes are important sources of biodiversity, as riparian areas tend to show higher species richness and diversity when compared to their human-dominated surroundings [3,19].

4.2. Floristic Suitability to Support Biodiversity-Related ES

4.2.1. Seed Dispersal by Short-Range Dispersers

Seed-harvester ants can play an important role as seed dispersers in Mediterranean grassland and scrublands [88]. These species are largely influenced by plant propagules, namely elaiosome-bearing seeds, which some plant species adapted to myrmecochory possess [62]. In this work, a wider diversity of myrmecochoric plant seeds was found in Sus located in the FP landscape. The low impactful management of REIs in the FP landscape allowed for the establishment of important native understory species for myrmecochory, such as myrtle and mastic tree. The preservation of a shrubby cover in riparian ecosystems is known to hold many species, thus contributes significantly to key ecosystems functions [66]. Nevertheless, Cistus sp., another important shrub taxa for myrmecochory, achieved the highest coverage in Sus of the EA landscape, which is consistent with the typical “montado” ecosystem. This type of understory cover is highly appreciated by seed-harvester ants, especially for ant species specialized in Cistaceae seeds [89]. These results are in agreement with the estimated HEIDI values, which proved to be significantly higher in the FP and EA landscapes when compared to the IA landscape.

4.2.2. Pollination by Medium-Range Dispersers

Mediterranean landscapes comprise a complex mosaic of different habitats that vary in the diversity of their floristic communities, pollinator communities, and pollination services [32,43]. Sus located in the FP landscape exhibited a higher proportion of Sus with a HEIDI score of “high” for the Floristic suitability category, reflecting a higher potential to attract pollinators, especially when comparing to the IA landscape. This is mainly due to a higher abundance of tree and shrub taxa with a higher value as forage resources for pollinators. Herbaceous taxa, by turn, were more relevant in Sus located in the IA and EA landscapes, where the structure of riparian vegetation was less dense. Other studies suggest high values for plant-pollinator communities in Mediterranean mixed oak woodlands [43]. Near-natural land-uses, such as riparian scrublands, riparian forests, and broadleaved forests also showed a higher capacity to support pollination services when compared to agricultural areas or forest production systems [32].

4.2.3. Seed Dispersal by Long-Range Dispersers

The vast majority of Mediterranean fleshy-fruited plants are dispersed either by birds alone or by some combination of birds and mammals [63]. Overall, the EA landscape showed more potential to support endozoochoric seed dispersal, given the higher proportion of Sus with “high” scores. Sus located in the EA landscape were commonly dominated by maritime pine and especially by a well-established Cistus sp. And Rubus sp. Shrub layers. Costa et al. [47] recognized the importance of birds as seed dispersers and refer Rubus sp., a widely distributed shrub in Sus of the EA landscape, as the most dispersed plant in a study across Portugal. Caprifoliaceae herbaceous taxa were also more commonly found in the EA landscape, most likely as a consequence of the frequent occurrence of open areas and less densely vegetated REIs. In undisturbed conditions, breeding bird species richness describes a linear increase from the pioneer herbaceous communities of headwaters to the canopy forest of lowland large streams [7], but this was not reflected in the proportion of Sus with HEIDI scores of “high” for the Seed production suitability metric. Some studies suggest that this phenomenon may be a consequence of an upstream-downstream anthropogenic gradient, where Mediterranean headwaters contain forested areas with less anthropogenic impact and flat lowlands are highly impacted by agricultural activities [90,91,92]. Additionally, increasing levels of birds and non-flying mammals’ biodiversity have been previously reported for riparian habitats embedded in agroforestry landscapes when compared to agricultural areas and forest production systems [73,93].

4.3. REI’s Potential for Biological Dispersal in the Three Human-Dominated Mediterranean Landscapes

In this study, REIs located in the FP landscape showed the highest global potential for biodiversity-related ES, followed by the EA and the IA landscapes (although no significant differences were observed between HEIDI global values of the FP and the EA landscape).
The estimated global HEIDI values observed in the Sus of the FP landscape seem to be the result of a combination of factors. The reduced accessibility of riparian areas located in the FP landscape, with steep slopes and rocky formations, discourages human intervention in REIs and allows their expansions outwards from the active channel. Other studies suggest that habitat quality in Mediterranean riparian areas tends to increase with decreasing human pressure and increasing forest cover in the river surroundings [90,91]. The majority of dominant native trees found within SUs were either obligate or preferential riparian species, except for the FP landscape where riparian areas were dominated by cork oak trees. In the FP landscape, blue gum eucalyptus and maritime pine plantations are replacing old “montados”, forming a landscape mosaic composed of mixed stands for timber harvesting and cork extraction. The presence of a contiguous natural forest within the river watershed would increase the resilience of REIs to biodiversity degradation [94]. Nonetheless, these non-riparian woody plant communities currently play a role in providing physical habitat and food resources for many animal species that rely on riparian areas [24,45].
Concerning the REIs located in the EA landscape, we were expecting to find a higher potential for biodiversity support, given that agrosilvopastoral systems tend to increase ES provision and biodiversity, especially when compared to forest production and agricultural systems [73,86]. The current land management practices observed in the studied EA landscape, with the elimination of understory vegetation and grazing both within and surrounding REIs, are probably responsible for the decline of biodiversity in the studied riparian areas [73,93,95] and the decrease of riparian vegetation cover [94]. One reason for higher vegetation management in REIs of the EA landscape can be attributed to wildfire prevention. Riparian vegetation under a seasonally water-stressed “montado” system can function as dangerous corridors for wildfire propagation, especially when Cistus sp. are present in abundance [96], which was the case in our study area. Thus, understory clearing in such REIs should be kept at the minimum required to prevent wildfire propagation, while simultaneously complying with the essential requirements for biodiversity preservation. The conservation of shrub patches around tree trunks in the surrounding landscape, for instance, protects the superficial root system of cork oaks and may contribute greatly to improve the ecological quality of REIs [73].
As for the IA landscape, HEIDI results and REI landscape metrics showed that the structure and composition of riparian vegetation can be dramatically altered in riparian areas dominated by agriculture. This can be explained by water and space overdemand, crop production, and regulation of the water supply in agricultural areas [28]. For this reason, we were expecting to find a much higher pressure in the management of REIs located in the IA landscape. However, irrigation or drainage activities also create canals resembling riparian habitats. According to Carlson et al. [97], irrigation canals can be important landscape elements for biodiversity conservation in human-dominated landscapes, albeit functioning at a much lower level than natural aquatic and riparian ecosystems. These channels are usually low-grade mimics of the river, unstructured, narrow, and with low-quality vegetation structure, but still, they are potentially useful as hosts for REIs. Such canals in the IA landscape would greatly benefit from REIs with an increased width, as they often form protection buffer strips [5,11,97], essential to prevent sand extraction from riverbanks and sidebars, provide nutrient and sediment retention services, and discourage clear-cuts of riparian vegetation [5,32].

4.4. HEIDI Synthesis and Applications

Riparian Ecological Infrastructures can be managed to promote the sustainable development of agricultural land and forest production systems. The assessment of the main factors that drive animal species abundance and richness, such as the heterogeneity and quality of available habitats, is an important first step in developing sustainable management guidelines and policies for biodiversity conservation in human-dominated landscapes [10,11,98,99]. Riparian Ecological Infrastructures are located in heavily degraded riparian areas, due to the human-dominated nature of the landscape in which they are embedded. Zaimes and Iakovoglou [91] identified that for Mediterranean regions, the ecological status of riparian areas should be monitored using small-scale tools (e.g., protocols and bioindicators). The HEIDI may contribute to such assessment, by incorporating habitat quality features that have a direct known relationship with the diversity of distinct faunistic groups. Nonetheless, higher estimated HEIDI values may not be synonymous with a positive contribution to an overall good ecological status of REIs. As an example, although the exotic cultivated blue gum eucalyptus may be considered highly suitable for myrmecochory and pollination services, it is not beneficial to riparian ecosystems [27,88]. Concomitantly, Rubus sp. has been classified with a very high value for medium- and long-range dispersers. For this reason, REIs composed of dense strips of Rubus sp. provide valuable resources, rarely found in the surrounding landscape, and may constitute important ecological corridors for these faunistic groups. Nonetheless, the overdominance of this native shrub may be an indicator of some level of habitat degradation [73].
According to Daily et al. [100], decision-making regarding landscape management should be formed in collaboration with stakeholders, since they are key players in defining adequate alternative scenarios of future land use. The HEIDI could be a valuable tool for such collaboration, especially when a rapid assessment of biodiversity-related ES is desired. The higher the estimated HEIDI value for a specific biological dispersal group, the more likely the REI will feature better habitat conditions to provide the ES promoted by that group. Additionally, and since the HEIDI is composed of five distinct but complementary categories (Vegetation structure, Vegetation habitats, Associated habitats, Vegetation management, and Floristic suitability), riparian management action plans can be implemented by prioritizing interventions based on the scores of each category. The individual categorical HEIDI scores may identify the aspects of the vegetation that need to be restored or improved (those that show a low proportion of “high” scores), or that need to be conserved (with a higher proportion of “high” scores).
The HEIDI scoring system was applied to each biological dispersal group by evaluating the attractiveness of local flora and the suitability of REI habitats, based on extensive bibliographic research and expert knowledge. Other studies have successfully developed metric-based vegetation indicators as surrogates for the richness and abundance of animal species [53,60]. Nevertheless, the HEIDI scoring system was developed based on a theoretical and bibliographic-supported approach using a broad range of animal species from different regions and under distinct land-use systems. Although most species belonging to the same group may share similar biological dispersal abilities, intraspecific and interspecific differences are expected to be found. Certain ant, pollinator, bird, bat, and non-flying small mammal species may possess unique characteristics not contemplated by the current methodology. Additionally, the individual capacity for biological dispersal may vary depending on local conditions [101]. In this context, if the HEIDI is to be used as a predictor of biodiversity in human-dominated Mediterranean landscapes, a robust validation process must take place [102]. By making use of independent data on the local biodiversity of the considered biological dispersal groups, this validation procedure would ensure the avoidance of circular reasoning when using the HEIDI to predict the provision of ES. Without it, the HEIDI should be used with caution, and restricted to assess the heterogeneity of riparian habitats, notwithstanding its capacity to provide mindful insight about their potential to host the biological communities under analysis. For its application in other climatic areas, land-use systems, and non-riparian Ecological Infrastructures, the Floristic suitability category must be revised to include the plant species that are associated with such environments. Furthermore, families of herbaceous species are very diverse, and although some species from the same family may share similar characteristics (height, stem, palatable characteristics), others contribute differently to the Floristic suitability category and are expressed by a single initial score. A lower taxonomic level for herbaceous species would increase the HEIDI’s precision, but we intended to obtain a simplified field data collection to enable landscape management in collaboration with stakeholders [16,52].

5. Conclusions

Vegetation aspects, such as floristic composition, structural attributes, spatial arrangement, type and number of associated habitats, and level of management may provide relevant and complementary information about the capacity of Riparian Ecological Infrastructures (REIs) to support biodiversity-related Ecosystems Services (ES). Our results showed that REIs located in the Forest Production landscape displayed more potential to support short-range and medium-range dispersers, especially when compared to those located in the Intensive Agriculture landscape. The potential of REIs in supporting long-range dispersers appeared to be slightly higher in the Extensive Agriculture landscape, although those differences were not statistically significant. This can be explained by the longer travel distances associated with this group, overcoming barriers that appear as insurmountable to the other communities. The HEIDI is an index that favors the simplicity of use, allowing for better collaboration with stakeholders. Given its theoretical proxy-based nature, a robust validation process must take place if the index is to be used as a biodiversity and ES predictor in the Mediterranean region. Future work on ants, pollinators, birds, bats, and non-flying small mammal species richness, diversity, and activity rates could provide empirical evidence of the HEIDI strength. Additionally, a landscape connectivity analysis could complement the capacity of REIs to function as high-quality ecological corridors for the considered biological groups. Nonetheless, the results obtained by the currently proposed method can offer valuable insight when identifying potential riparian areas in need of conservation or restoration. The HEIDI, when used with caution, could be an important complementary tool in prioritizing actions for the sustainable management of Mediterranean human-dominated landscapes.

Supplementary Materials

The following are available online at https://www.mdpi.com/article/10.3390/su131910508/s1, Supplementary S1: Habitat Ecological Infrastructure’s Diversity Index (HEIDI) Floristic suitability initial scoring criteria and references, Figure S1: River reaches of the IA landscape (Tagus), Figure S2: River reaches of the IA landscape (Sorraia), Figure S3: River reaches of the EA landscape, Figure S4: River reaches of the FP landscape, Figure S5: Woody (dark blue polygons) and non-woody (light blue polygons) REIs in the IA landscape (Tagus), Figure S6: Woody (dark blue polygons) and non-woody (light blue polygons) REIs in the IA landscape (Sorraia), Figure S7: Woody (dark blue polygons) and non-woody (light blue polygons) REIs in the EA landscape, Figure S8: Woody (dark blue polygons) and non-woody (light blue polygons) REIs in the FP landscape, Figure S9: SUs in the IA landscape (Tagus), within woody (dark blue polygons) and non-woody (light blue polygons) REIs, Figure S10: SUs in the IA landscape (Sorraia), within woody (dark blue polygons) and non-woody (light blue polygons) REIs, Figure S11: SUs in the EA landscape, within woody (dark blue polygons) and non-woody (light blue polygons) REIs, Figure S12: SUs in the FP landscape, within woody (dark blue polygons) and non-woody (light blue polygons) REIs, Table S1: Field protocol for the assessment of riparian habitat heterogeneity, Table S2: Scoring assigned to tree taxa for their suitability to seed dispersal by short-range dispersers (ants) based on dispersion mode and plant physiognomy, with references, Table S3: Scoring assigned to shrub taxa for their suitability to seed dispersal by short-range dispersers (ants) based on dispersion mode, with references, Table S4: Scoring assigned to herbaceous taxa for their suitability to seed dispersal by short-range dispersers (ants) based on dispersion mode and plant physiognomy, with references, Table S5: Scoring assigned to tree taxa for their suitability to pollination by medium-range dispersers (pollinators) based on pollination mode, with references, Table S6: Scoring assigned to shrub taxa for their suitability to pollination by medium-range dispersers (pollinators) based on pollination mode, with references, Table S7: Scoring assigned to herbaceous families for their suitability to pollination by medium-range dispersers (pollinators) based on pollination mode, with references, Table S8: Scoring assigned to tree taxa for their suitability to seed dispersal by long-range dispersers (birds and non-flying small mammals) based on dispersion mode and plant physiognomy, with references, Table S9: Scoring assigned to tree taxa for their suitability to seed dispersal by long-range dispersers (birds and non-flying small mammals) based on dispersion mode, with references, Table S10: Scoring assigned to herbaceous taxa for their suitability to seed dispersal by long-range dispersers (birds and non-flying small mammals) based on dispersion mode, with references, Table S11: Dunn’s post hoc comparisons between landscapes for the patch size, nearest neighbor, and shape index of woody and non-woody REIs, Table S12: Dunn’s post hoc comparisons between landscapes for estimated global HEIDI values and of short-range and medium-range dispersers, Table S13: Plant-growth form classification, riparian classification, nativeness, and relative occurrence of tree taxa in SUs located in the IA, EA, and FP landscapes, Table S14: Plant-growth form classification, riparian classification, nativeness, and relative occurrence of shrubby taxa (%) in SUs located in the IA, EA, and FP landscapes, Table S15: Relative occurrence of herbaceous families (%) in SUs located in the IA, EA, and FP landscapes.

Author Contributions

All authors conceptualized the project. A.F., V.Z., G.D. and M.R.F. led the writing. A.F., V.Z. and G.D. collected the data. A.F., V.Z., G.D., F.C.A., P.M.R.-G., M.T.F. and M.R.F. analyzed the data, developed the methodology, discussed, and interpreted results. All authors contributed critically to the manuscript’s drafts, revised them for important intellectual content, and gave final approval for publication. All authors have read and agreed to the published version of the manuscript.

Funding

This study received backing from Project OPTIMUS PRIME FCT-PTDC/ASP-AGR/29771/2017, Project CERES Interreg IV-B SUDOE-SOE2/P5/F0551, Forest Research Centre (CEF) and Associate Laboratory TERRA. CEF is a research unit funded by the Fundação para a Ciência e a Tecnologia, I.P. (FCT), Portugal (UIDB/00239/2020).

Institutional Review Board Statement

Not applicable.

Informed Consent Statement

Not applicable.

Data Availability Statement

The GIS data presented in this study are openly available in https://doi.org/10.6084/m9.figshare.14402594 (accessed on 20 September 2021).

Acknowledgments

FCT supported A.F. under PD/BD/142884/2018, V.Z. under PD/BD/142882/2018, and G.D. via the project PTDC/ASP-AGR/29771/2017. F.C.A. was supported by national funds via FCT, under “Norma Transitória DL57/2016/CP1382/CT0028 and P.M.R-G. was supported by FCT through the CEEC Individual programme grant number 2020.03356.CEECIND.

Conflicts of Interest

The authors declare no conflict of interest.

References

  1. Ward, J.V.; Tockner, K.; Schiemer, F. Biodiversity of floodplain river ecosystems: Ecotones and connectivity. Regul. Rivers Res. Manag. 1999, 15, 125–139. [Google Scholar] [CrossRef]
  2. Naiman, R.J.; Decamps, H.; Pollock, M. The role of riparian corridors in maintaining regional biodiversity. Ecol. Appl. 1993, 3, 209–212. [Google Scholar] [CrossRef] [PubMed]
  3. Sabo, J.L.; Sponseller, R.; Dixon, M.; Gade, K.; Harms, T.; Heffernan, J.; Jani, A.; Katz, G.; Soykan, C.; Watts, J.; et al. Riparian zones increase regional species richness by harboring different, not more, species. Ecology 2005, 86, 56–62. [Google Scholar] [CrossRef]
  4. Capon, S.J.; Chambers, L.E.; Mac Nally, R.; Naiman, R.J.; Davies, P.; Marshall, N.; Pittock, J.; Reid, M.; Capon, T.; Douglas, M.; et al. Riparian ecosystems in the 21st century: Hotspots for climate change adaptation? Ecosystems 2013, 16, 359–381. [Google Scholar] [CrossRef]
  5. Riis, T.; Kelly-Quinn, M.; Aguiar, F.C.; Manolaki, P.; Bruno, D.; Bejarano, M.D.; Clerici, N.; Fernandes, M.R.; Franco, J.C.; Pettit, N.; et al. Global overview of ecosystem services provided by riparian vegetation. BioScience 2020, 70, 501–514. [Google Scholar] [CrossRef]
  6. Naiman, R.J.; Décamps, H. The ecology of interfaces: Riparian zones. Annu. Rev. Ecol. Syst. 1997, 28, 621–658. [Google Scholar] [CrossRef] [Green Version]
  7. Corbacho, C.; Sánchez, J.M.; Costillo, E. Patterns of structural complexity and human disturbance of riparian vegetation in agricultural landscapes of a Mediterranean area. Agric. Ecosyst. Environ. 2003, 95, 495–507. [Google Scholar] [CrossRef]
  8. Tockner, K.; Bunn, S.; Gordon, C.; Naiman, J.; Robert, P.Q.; Gerry, A.; Stanford, J. Flood plains: Critically threatened ecosystems. In Aquatic Ecosystems. Trends and Global Prospects; Cambridge University Press: Cambridge, UK, 2008; pp. 45–61. [Google Scholar]
  9. Fielding, K.S.; Terry, D.J.; Masser, B.M.; Bordia, P.; Hogg, M.A. Explaining landholders’ decisions about riparian zone management: The role of behavioural, normative, and control beliefs. J. Environ. Manag. 2005, 77, 12–21. [Google Scholar] [CrossRef]
  10. Pereira, M.; Rodríguez, A. Conservation value of linear woody remnants for two forest carnivores in a Mediterranean agricultural landscape. J. Appl. Ecol. 2010, 47, 611–620. [Google Scholar] [CrossRef]
  11. Fremier, A.K.; Kiparsky, M.; Gmur, S.; Aycrigg, J.; Craig, R.K.; Svancara, L.K.; Goble, D.D.; Cosens, B.; Davis, F.W.; Scott, J.M. A riparian conservation network for ecological resilience. Biol. Conserv. 2015, 191, 29–37. [Google Scholar] [CrossRef] [Green Version]
  12. Van Looy, K.; Tormos, T.; Souchon, Y.; Gilvear, D. Analyzing riparian zone ecosystem services bundles to instruct river management. Int. J. Biodivers. Sci. Ecosyst. Serv. Manag. 2017, 13, 330–341. [Google Scholar] [CrossRef]
  13. Capon, S.J.; Pettit, N.E. Turquoise is the new green: Restoring and enhancing riparian function in the Anthropocene. Ecol. Manag. Restor. 2018, 19, 44–53. [Google Scholar] [CrossRef]
  14. Feld, C.K.; Fernandes, M.R.; Ferreira, M.T.; Hering, D.; Ormerod, S.J.; Venohr, M.; Gutiérrez-Cánovas, C. Evaluating riparian solutions to multiple stressor problems in river ecosystems—A conceptual study. Water Res. 2018, 139, 381–394. [Google Scholar] [CrossRef]
  15. Cole, L.J.; Stockan, J.; Helliwell, R. Managing riparian buffer strips to optimise ecosystem services: A. review. Agric. Ecosyst. Environ. 2020, 296, 106891. [Google Scholar] [CrossRef]
  16. Jennings, M.K.; Haeuser, E.; Foote, D.; Lewison, R.L.; Conlisk, E. Planning for dynamic connectivity: Operationalizing robust decision-making and prioritization across landscapes experiencing climate and land-use change. Land 2020, 9, 341. [Google Scholar] [CrossRef]
  17. Lee, J.A.; Chon, J.; Ahn, C. Planning landscape corridors in ecological infrastructure using least-cost path methods based on the value of ecosystem services. Sustainability 2014, 6, 7564–7585. [Google Scholar] [CrossRef] [Green Version]
  18. Sun, S.; Jiang, Y.; Zheng, S. Research on ecological infrastructure from 1990 to 2018: A bibliometric analysis. Sustainability 2020, 12, 2304. [Google Scholar] [CrossRef] [Green Version]
  19. Stella, J.C.; Rodríguez-González, P.M.; Dufour, S.; Bendix, J. Riparian vegetation research in Mediterranean-climate regions: Common patterns, ecological processes, and considerations for management. Hydrobiologia 2013, 719, 291–315. [Google Scholar] [CrossRef]
  20. Aguiar, F.C.; Martins, M.J.; Silva, P.C.; Fernandes, M.R. Riverscapes downstream of hydropower dams: Effects of altered flows and historical land-use change. Landsc. Urban Plan. 2016, 153, 83–98. [Google Scholar] [CrossRef]
  21. Aguiar, F.C.; Ferreira, M.T. Human-disturbed landscapes: Effects on composition and integrity of riparian woody vegetation in the Tagus River basin, Portugal. Environ. Conserv. 2005, 32, 30–41. [Google Scholar] [CrossRef]
  22. Cooper, S.D.; Lake, P.S.; Sabater, S.; Melack, J.M.; Sabo, J.L. The effects of land use changes on streams and rivers in Mediterranean climates. Hydrobiologia 2013, 719, 383–425. [Google Scholar] [CrossRef]
  23. Fernandes, M.R.; Aguiar, F.C.; Martins, M.J.; Rivaes, R.; Ferreira, M.T. Long-term human-generated alterations of Tagus River: Effects of hydrological regulation and land-use changes in distinct river zones. Catena 2020, 188, 104466. [Google Scholar] [CrossRef]
  24. Plieninger, T.; Wilbrand, C. Land use, biodiversity conservation, and rural development in the dehesas of Cuatro Lugares, Spain. Agrofor. Syst. 2001, 51, 23–34. [Google Scholar] [CrossRef]
  25. Fonseca, A.; Ugille, J.-P.; Michez, A.; Rodríguez-González, P.M.; Duarte, G.; Ferreira, M.T.; Fernandes, M.R. Assessing the connectivity of Riparian Forests across a gradient of human disturbance: The potential of Copernicus “Riparian Zones” in two hydroregions. Forests 2021, 12, 674. [Google Scholar] [CrossRef]
  26. Langer, L.E.R.; Steward, G.A.; Kimberley, M.O. Vegetation structure, composition and effect of pine plantation harvesting on riparian buffers in New Zealand. For. Ecol. Manag. 2008, 256, 949–957. [Google Scholar] [CrossRef]
  27. Tererai, F.; Gaertner, M.; Jacobs, S.M.; Richardson, D.M. Eucalyptus invasions in riparian forests: Effects on native vegetation community diversity, stand structure and composition. For. Ecol. Manag. 2013, 297, 84–93. [Google Scholar] [CrossRef]
  28. Dufour, S.; Rodríguez-González, P.M.; Laslier, M. Tracing the scientific trajectory of riparian vegetation studies: Main topics, approaches and needs in a globally changing world. Sci. Total Environ. 2019, 653, 1168–1185. [Google Scholar] [CrossRef]
  29. Santos, M.J.; Rosalino, L.M.; Matos, H.M.; Santos-Reis, M. Riparian ecosystem configuration influences mesocarnivores presence in Mediterranean landscapes. Eur. J. Wildl. Res. 2016, 62, 251–261. [Google Scholar] [CrossRef]
  30. Gasith, A.; Resh, V.H. Streams in Mediterranean climate regions: Abiotic influences and biotic responses to predictable seasonal events. Annu. Rev. Ecol. Syst. 1999, 30, 51–81. [Google Scholar] [CrossRef] [Green Version]
  31. Cole, L.J.; Brocklehurst, S.; Robertson, D.; Harrison, W.; McCracken, D.I. Exploring the interactions between resource availability and the utilisation of semi-natural habitats by insect pollinators in an intensive agricultural landscape. Agric. Ecosyst. Environ. 2017, 246, 157–167. [Google Scholar] [CrossRef]
  32. Santos, A.; Fernandes, M.R.; Aguiar, F.C.; Branco, M.R.; Ferreira, M.T. Effects of riverine landscape changes on pollination services: A case study on the River Minho, Portugal. Ecol. Indic. 2018, 89, 656–666. [Google Scholar] [CrossRef]
  33. Kalcounis, M.C.; Hobson, K.A.; Brigham, R.M.; Hecker, K.R. Bat activity in the boreal forest: Importance of stand type and vertical strata. J. Mammal. 1999, 80, 673–682. [Google Scholar] [CrossRef] [Green Version]
  34. Gil-Tena, A.; Saura, S.; Brotons, L. Effects of forest composition and structure on bird species richness in a Mediterranean context: Implications for forest ecosystem management. For. Ecol. Manag. 2007, 242, 470–476. [Google Scholar] [CrossRef]
  35. Saura, S.; Rubio, L. A common currency for the different ways in which patches and links can contribute to habitat availability and connectivity in the landscape. Ecography 2010, 33, 523–537. [Google Scholar] [CrossRef]
  36. Taylor, P.D.; Fahrig, L.; Henein, K.; Merriam, G. Connectivity is a vital element of landscape structure. Oikos 1993, 68, 571–573. [Google Scholar] [CrossRef] [Green Version]
  37. Regnery, B.; Couvet, D.; Kubarek, L.; Julien, J.F.; Kerbiriou, C. Tree microhabitats as indicators of bird and bat communities in Mediterranean forests. Ecol. Indic. 2013, 34, 221–230. [Google Scholar] [CrossRef]
  38. Paillet, Y.; Archaux, F.; du Puy, S.; Bouget, C.; Boulanger, V.; Debaive, N.; Glig, O.; Gosselin, F.; Guilbert, E. The indicator side of tree microhabitats: A multi-taxon approach based on bats, birds and saproxylic beetles. J. Appl. Ecol. 2018, 55, 2147–2159. [Google Scholar] [CrossRef]
  39. Harrison, P.A.; Berry, P.M.; Simpson, G.; Haslett, J.R.; Blicharska, M.; Bucur, M.; Dunford, R.; Egoh, B.; Garcia-LIorente, M.; Geamana, N.; et al. Linkages between biodiversity attributes and ecosystem services: A systematic review. Ecosyst. Serv. 2014, 9, 191–203. [Google Scholar] [CrossRef] [Green Version]
  40. Folgarait, P.J. Ant biodiversity and its relationship to ecosystem functioning: A review. Biodivers. Conserv. 1998, 7, 1221–1244. [Google Scholar] [CrossRef]
  41. Del Toro, I.; Ribbons, R.R.; Pelini, S.L. The little things that run the world revisited. Myrmecol. News 2012, 14, 133–146. [Google Scholar]
  42. Gómez, C.; Espadaler, X. An update of the world survey of myrmecochorous dispersal distances. Ecography 2013, 36, 1193–1201. [Google Scholar] [CrossRef]
  43. Potts, S.G.; Petanidou, T.; Roberts, S.; O’Toole, C.; Hulbert, A.; Willmer, P. Plant-pollinator biodiversity and pollination services in a complex Mediterranean landscape. Biol. Conserv. 2006, 129, 519–529. [Google Scholar] [CrossRef]
  44. Klein, A.M.; Vaissière, B.E.; Cane, J.H.; Steffan-Dewenter, I.; Cunningham, S.A.; Kremen, C.; Tscharntke, T. Importance of pollinators in changing landscapes for world crops. Proc. R. Soc. B Biol. Sci. 2007, 274, 303–313. [Google Scholar] [CrossRef] [PubMed] [Green Version]
  45. Howe, F.; Smallwood, J. Ecology of seed dispersal. Annu. Rev. Ecol. Syst. 1982, 13, 201–228. [Google Scholar] [CrossRef]
  46. Rosalino, L.M.; Rosa, S.; Santos-Reis, M. The role of carnivores as Mediterranean seed dispersers. Ann. Zool. Fenn. 2010, 47, 195–205. [Google Scholar] [CrossRef]
  47. Costa, J.M.; Ramos, J.A.; da Silva, L.P.; Timoteo, S.; Araújo, P.M.; Felgueiras, M.S.; Rosa, A.; Matos, C.; Encarnação, P.; Tenreiro, P.Q.; et al. Endozoochory largely outweighs epizoochory in migrating passerines. J. Avian Biol. 2014, 45, 59–64. [Google Scholar] [CrossRef]
  48. Boyles, J.G.; Cryan, P.M.; McCracken, G.F.; Kunz, T.H. Economic importance of bats in agriculture. Science 2011, 332, 41–42. [Google Scholar] [CrossRef]
  49. Kunz, T.H.; de Torrez, E.B.; Bauer, D.; Lobova, T.; Fleming, T.H. Ecosystem services provided by bats. Ann. N. Y. Acad. Sci. 2011, 1223, 1–38. [Google Scholar] [CrossRef]
  50. Santolini, R.; Morri, E.; Pasini, G.; Giovagnoli, G.; Morolli, C.; Salmoiraghi, G. Assessing the quality of riparian areas: The case of river ecosystem quality index applied to the Marecchia river (Italy). Int. J. River Basin Manag. 2015, 13, 1–16. [Google Scholar] [CrossRef]
  51. de Sosa, L.L.; Glanville, H.C.; Marshall, M.R.; Prysor Williams, A.; Jones, D.L. Quantifying the contribution of riparian soils to the provision of ecosystem services. Sci. Total Environ. 2018, 624, 807–819. [Google Scholar] [CrossRef] [Green Version]
  52. Hanna, D.E.L.; Tomscha, S.A.; Ouellet Dallaire, C.; Bennett, E.M. A review of riverine ecosystem service quantification: Research gaps and recommendations. J. Appl. Ecol. 2018, 55, 1299–1311. [Google Scholar] [CrossRef]
  53. Oliver, I.; Dorrough, J.; Seidel, J. A new vegetation integrity metric for trading losses and gains in terrestrial biodiversity value. Ecol. Indic. 2021, 124, 107341. [Google Scholar] [CrossRef]
  54. Peel, M.C.; Finlayson, B.L.; McMahon, T.A. Updated world map of the Köppen-Geiger climate classification. Hydrol. Earth Syst. Sci. 2007, 11, 1633–1644. [Google Scholar] [CrossRef] [Green Version]
  55. Vogt, J.; Soille, P.; De Jager, A.; Rimavičiūtė, E.; Mehl, W.; Foisneau, S.; Bodis, K.; Dusart, J.; Paracchini, M.L.; Haastrup, P.; et al. A Pan-European River and Catchment Database; OPOCE: Luxembourg, Luxemburg, 2007. [Google Scholar] [CrossRef]
  56. Fernandes, M.R.; Aguiar, F.C.; Ferreira, M.T. Assessing riparian vegetation structure and the influence of land use using landscape metrics and geostatistical tools. Landsc. Urban Plan. 2011, 99, 166–177. [Google Scholar] [CrossRef] [Green Version]
  57. Raunkiær, C. The Life Forms of Plants and Statistical Plant Geography, Being the Collected Papers of C. Raunkiær. History of Ecology Series; Frank, N.E., Ed.; Oxford University Press: Oxford, UK, 1934; ISBN 0-405-10418-9. [Google Scholar]
  58. Wasser, L.; Chasmer, L.; Day, R.; Taylor, A. Quantifying land use effects on forested riparian buffer vegetation structure using LiDAR data. Ecosphere 2015, 6, 1–17. [Google Scholar] [CrossRef]
  59. McGarigal, K.; Cushman, S.A.; Ene, E. FRAGSTATS v4: Spatial Pattern Analysis Program for Categorical and Continuous Maps. 2012. Available online: http://www.umass.edu/landeco/research/fragstats/fragstats.html (accessed on 21 September 2021).
  60. Larrieu, L.; Gonin, P. L’lndice de biodiversité potentielle (IBP): Une méthode simple et rapide pour évaluer la biodiversité potentielle des peuplements forestiers. Rev. For. Fr. 2008, 60, 727–748. [Google Scholar] [CrossRef] [Green Version]
  61. Johnson, R.R.; Steven, W.C.; Simpson, J.M. A riparian classification system. In California Riparian Systems: Ecology, Conservation, and Productive Management; Warner, R.E., Hendrix, K.M., Eds.; University of California Press: Berkeley, CA, USA, 1984. [Google Scholar]
  62. Lengyel, S.; Gove, A.D.; Latimer, A.M.; Majer, J.D.; Dunn, R.R. Convergent evolution of seed dispersal by ants, and phylogeny and biogeography in flowering plants: A global survey. Perspect. Plant. Ecol. Evol. Syst. 2010, 12, 43–55. [Google Scholar] [CrossRef]
  63. Herrera, C.M. Plant-vertebrate seed dispersal systems in the Mediterranean: Ecological, evolutionary, and historical determinants. Annu. Rev. Ecol. Syst. 1995, 26, 705–727. [Google Scholar] [CrossRef]
  64. Karr, J.R. Assessment of biotic integrity using fish communities. Fisheries 1981, 6, 21–27. [Google Scholar] [CrossRef]
  65. Silva, P.S.D.; Bieber, A.G.D.; Corrêa, M.M.; Leal, I.R. Do leaf-litter attributes affect the richness of leaf-litter ants? Neotrop. Entomol. 2011, 40, 542–547. [Google Scholar] [CrossRef]
  66. Lopes, J.F.S.; Hallack, N.M.D.R.; Sales, T.A.; De Brugger, M.S.; Ribeiro, L.F.; Hastenreiter, I.N.; Camargo, R.D.S. Comparison of the ant assemblages in three phytophysionomies: Rocky field, secondary forest, and riparian forest—A case study in the state park of Ibitipoca, Brazil. Psyche 2012. [Google Scholar] [CrossRef]
  67. Ives, C.D.; Taylor, M.P.; Nipperess, D.A.; Hose, G.C. Effect of catchment urbanization on ant diversity in remnant riparian corridors. Landsc. Urba. Plan. 2013, 110, 155–163. [Google Scholar] [CrossRef]
  68. Welch, J.N.; Leppanen, C. The threat of invasive species to bats: A review. Mammal. Rev. 2017, 47, 277–290. [Google Scholar] [CrossRef]
  69. Badalamenti, E.; Cusimano, D.; La Mantia, T.; Pasta, S.; Romano, S.; Troia, A.; Ilardi, V. The ongoing naturalisation of Eucalyptus spp. in the Mediterranean Basin: New threats to native species and habitats. Aust. For. 2018, 81, 239–249. [Google Scholar] [CrossRef]
  70. Quinn, L.D.; Holt, J.S. Ecological correlates of invasion by Arundo donax in three southern California riparian habitats. Biol. Invasions 2008, 10, 591–601. [Google Scholar] [CrossRef]
  71. Andersen, A.N. Responses of ant communities to disturbance: Five principles for understanding the disturbance dynamics of a globally dominant faunal group. J. Anim. Ecol. 2019, 88, 350–362. [Google Scholar] [CrossRef]
  72. Nooten, S.S.; Schultheiss, P.; Rowe, R.C.; Facey, S.L.; Cook, J.M. Habitat complexity affects functional traits and diversity of ant assemblages in urban green spaces (Hymenoptera: Formicidae). Myrmecol. News 2019, 29, 67–77. [Google Scholar] [CrossRef]
  73. Gonçalves, P.; Alcobia, S.; Simões, L.; Santos-Reis, M. Effects of management options on mammal richness in a Mediterranean agro-silvo-pastoral system. Agrofor. Syst. 2012, 85, 383–395. [Google Scholar] [CrossRef]
  74. Galkowski, C.L.C.; Wegnez, R.B.P. Guía de Campo de las Hormigas de Europa Occidental, Edición Española; Omega: Barcelona, Spain, 2017. [Google Scholar]
  75. da Rocha-Filho, L.C.; Montagnana, P.C.; Boscolo, D.; Garófalo, C.A. Green patches among a grey patchwork: The importance of preserving natural habitats to harbour cavity-nesting bees and wasps (Hymenoptera) and their natural enemies in urban areas. Biodivers. Conserv. 2020, 29, 2487–2514. [Google Scholar] [CrossRef]
  76. Glaser, F. Ants (Hymenoptera, Formicidae) in alpine floodplains—Ecological notes and conservation aspects. In Riverine Landscapes—Restoration—Flood Protection–Conservation, Proceedings of the Internationales LIFE-Symposium, Reutte-Breitenwang, Austria, 26–29 September 2005; Füreder, L., Sint, D., Vorauer, A., Eds.; Springer: Berlin, Germany, 2005; pp. 147–163. [Google Scholar]
  77. Rebelo, H.; Rainho, A. Bat conservation and large dams: Spatial changes in habitat use caused by Europe’s largest reservoir. Endanger. Species Res. 2008, 8, 61–68. [Google Scholar] [CrossRef]
  78. Amorim, F.; Jorge, I.; Beja, P.; Rebelo, H. Following the water? Landscape-scale temporal changes in bat spatial distribution in relation to Mediterranean summer drought. Ecol. Evol. 2018, 8, 5801–5814. [Google Scholar] [CrossRef] [Green Version]
  79. Perakis, M.; Maravelakis, P.E.; Psarakis, S.; Xekalaki, E.; Panaretos, J. On certain indices for ordinal data with unequally weighted classes. Qual. Quant. 2005, 39, 515–536. [Google Scholar] [CrossRef] [Green Version]
  80. Feio, M.J.; Aguiar, F.C.; Almeida, S.F.P.; Ferreira, J.; Ferreira, M.T.; Elias, C.; Serra, S.R.Q.; Buffagni, A.; Cambra, J.; Chauvin, C.; et al. Least disturbed condition for European Mediterranean rivers. Sci. Total Environ. 2014, 476, 745–756. [Google Scholar] [CrossRef] [PubMed]
  81. JASP Team. JASP (Version 0.14.1) [Computer software]. Amsterdam, The Netherlands. 2020. Available online: https://jasp-stats.org (accessed on 21 September 2021).
  82. Kontsiotis, V.; Zaimes, G.N.; Tsiftsis, S.; Kiourtziadis, P.; Bakaloudis, D. Assessing the influence of riparian vegetation structure on bird communities in agricultural Mediterranean landscapes. Agrofor. Syst. 2019, 93, 675–687. [Google Scholar] [CrossRef]
  83. Forio, M.A.E.; De Troyer, N.; Lock, K.; Witing, F.; Baert, L.; De Saeyer, N.; Rîșnoveanu, G.; Popescu, C.; Burdon, F.J.; Kupilas, B.; et al. Small patches of riparian woody vegetation enhance biodiversity of invertebrates. Water 2020, 12, 3070. [Google Scholar] [CrossRef]
  84. Fahrig, L. Effects of habitat fragmentation on biodiversity. Annu. Rev. Ecol. Evol. Syst. 2003, 34, 487–515. [Google Scholar] [CrossRef] [Green Version]
  85. Clerici, N.; Paracchini, M.L.; Maes, J. Land-cover change dynamics and insights into ecosystem services in European stream riparian zones. Ecohydrol. Hydrobiol. 2014, 14, 107–120. [Google Scholar] [CrossRef]
  86. Torralba, M.; Fagerholm, N.; Burgess, P.J.; Moreno, G.; Plieninger, T. Do European agroforestry systems enhance biodiversity and ecosystem services? A meta-analysis. Agric. Ecosyst. Environ. 2016, 230, 150–161. [Google Scholar] [CrossRef] [Green Version]
  87. Ferreira, V.; Boyero, L.; Calvo, C.; Correa, F.; Figueroa, R.; Gonçalves, J.F., Jr.; Graça, M.A.S.; Hepp, L.U.; Goyenola, G.; Kariuki, S.; et al. A global assessment of the effects of eucalyptus plantations on stream ecosystem functioning. Ecosystems 2019, 22, 629–642. [Google Scholar] [CrossRef]
  88. Azcárate, F.M.; Arqueros, L.; Sánchez, A.M.; Peco, B. Seed and fruit selection by harvester ants, Messor barbarus, in Mediterranean grassland and scrubland. Funct. Ecol. 2005, 19, 273–283. [Google Scholar] [CrossRef]
  89. Bastida, F.; Talavera, S.; Ortiz, P.L.; Arista, M. The interaction between Cistaceae and a highly specific seed-harvester ant in a Mediterranean scrubland. Plant Biol. 2009, 11, 46–56. [Google Scholar] [CrossRef] [PubMed]
  90. Valero, E.; Álvarez, X.; Picos, J. An assessment of river habitat quality as an indicator of conservation status. A case study in the northwest of Spain. Ecol. Indic. 2015, 57, 131–138. [Google Scholar] [CrossRef]
  91. Zaimes, G.N.; Iakovoglou, V. Assessing riparian areas of Greece—An overview. Sustainability 2021, 13, 309. [Google Scholar] [CrossRef]
  92. Latsiou, A.; Kouvarda, T.; Stefanidis, K.; Papaioannou, G.; Gritzalis, K.; Dimitriou, E. Pressures and status of the riparian vegetation in Greek rivers: Overview and preliminary assessment. Hydrology 2021, 8, 55. [Google Scholar] [CrossRef]
  93. Pereira, P.; Godinho, C.; Gomes, M.; Rabaça, J.E. The importance of the surroundings: Are bird communities of riparian galleries influenced by agroforestry landscapes in SW Iberian Peninsula? Ann. For. Sci. 2014, 71, 33–41. [Google Scholar] [CrossRef] [Green Version]
  94. Stephan, J.; Issa, D. Anthropogenic impacts on riparian trees and shrubs in an eastern Mediterranean stream. Plant. Sociol. 2017, 54, 43–50. [Google Scholar] [CrossRef]
  95. Carrilho, M.; Teixeira, D.; Santos-Reis, M.; Rosalino, L.M. Small mammal abundance in Mediterranean Eucalyptus plantations: How shrub cover can really make a difference. For. Ecol. Manag. 2017, 391, 256–263. [Google Scholar] [CrossRef]
  96. Guiomar, N.; Godinho, S.; Fernandes, P.M.; Machado, R.; Neves, N.; Fernandes, J.P. Wildfire patterns and landscape changes in Mediterranean oak woodlands. Sci. Total Environ. 2015, 536, 338–352. [Google Scholar] [CrossRef] [PubMed] [Green Version]
  97. Carlson, E.A.; Cooper, D.J.; Merritt, D.M.; Kondratieff, B.C.; Waskom, R.M. Irrigation canals are newly created streams of semi-arid agricultural regions. Sci. Total Environ. 2019, 646, 770–781. [Google Scholar] [CrossRef]
  98. Cunha, N.S.; Magalhães, M.R. Methodology for mapping the national ecological network to mainland Portugal: A planning tool towards a green infrastructure. Ecol. Indic. 2019, 104, 802–818. [Google Scholar] [CrossRef]
  99. Arroyo-Rodríguez, V.; Fahrig, L.; Tabarelli, M.; Watling, J.I.; Tischendorf, L.; Benchimol, M.; Cazetta, E.; Faria, D.; Leal, I.R.; Melo, F.P.L.; et al. Designing optimal human-modified landscapes for forest biodiversity conservation. Ecol. Lett. 2020, 23, 1404–1420. [Google Scholar] [CrossRef] [PubMed]
  100. Daily, G.C.; Polasky, S.; Goldstein, J.; Kareiva, P.M.; Mooney, H.A.; Pejchar, L.; Ricketts, T.H.; Salzman, J.; Shallenberger, R. Ecosystem services in decision making: Time to deliver. Front. Ecol. Environ. 2009, 7, 21–28. [Google Scholar] [CrossRef] [Green Version]
  101. Liedtke, J.; Fromhage, L. The joint evolution of learning and dispersal maintains intraspecific diversity in metapopulations. Oikos 2021, 130, 808–818. [Google Scholar] [CrossRef]
  102. Stephens, P.A.; Pettorelli, N.; Barlow, J.; Whittingham, M.J.; Cadotte, M.W. Management by proxy? The use of indices in applied ecology. J. Appl. Ecol. 2015, 52, 1–6. [Google Scholar] [CrossRef]
Figure 1. Geographic location of the study area (upper left panel) and the three human-dominated landscapes (central panel and photographs): (a,e,i) Intensive Agriculture (IA)—River Tagus; (b,f,j) Intensive Agriculture (IA)—River Sorraia; (c,g,k) Extensive Agriculture (EA); and (d,h,l) Forest production (FP).
Sustainability 13 10508 g001
Figure 2. Illustration of the mapping of Riparian Ecological Infrastructures (REIs), with woody (dark blue polygons) and non-woody patches (light blue polygons) in (a) Intensive Agriculture, (b) Extensive Agriculture, and (c) Forest Production landscapes.
Sustainability 13 10508 g002
Figure 3. Average proportion of Sampling Units (%), by HEIDI category, with scores of “high” (fill), “fair” (line fill), and “low” (no fill) for each biological dispersal group (Short-, Medium-, and Long-range dispersers) in the Intensive Agriculture (green), Extensive Agriculture (golden) and Forest Production (orange) landscapes.
Sustainability 13 10508 g003
Table 1. Habitat Ecological Infrastructure’s Diversity Index (HEIDI) categories, metrics, and scoring criteria associated with short-range dispersers (ants), medium-range dispersers (pollinators), and long-range dispersers (birds, bats, and non-flying small mammals).
HEIDI Categories and MetricsShort-Range Dispersers’ ScoresMedium-Range Dispersers’ ScoresLong-Range Dispersers’ Scores
LowFairHighReferencesLowFairHighReferencesLowFairHighReferences
1. Vegetation structure
Native tree species (N°)01 to 3≥4[67]01 to 3≥4[32]01 to 3≥4[10,68]
Invasive species cover (%)≥30]0, 30[0[67,69,70]≥30]0, 30[0[32,69,70]≥30]0, 30[0[68,69,70]
Vertical strata (N°)12 or 34[66,71,72]12 or 34[32]12 or 34[33,66,73]
2. Vegetation habitats
Trees with microhabitats above 3 m (N°) 01 or 2≥3[34,37]
Trees with microhabitats below 3 m (N°)01 or 2≥3[74]
Standing dead trees (N°) 01 or 2≥3[75]01 or 2≥3[34,38]
Dead wood trunks on the ground (N°)01 or 2≥3[74,76]01 or 2≥3[68]
Large living trees (N°) 01 to 4≥5[33,34,38]
Leaf litter cover (%)0]0, 50[≥50[65,66]≥50]0, 50[0[32]
3. Associated habitats
Rocky habitat types (N°)01≥2[66,74]
Aquatic habitat types (N°) 01≥2[32]01≥2[77,78]
4. Vegetation management
Understory clearing (%)≥60[20, 60[<20[66]≥60[20, 60[<20[32]
Tree clearing (%) ≥60[20, 60[<20[33,34,38]
5. Floristic suitability
Seed production suitability (initial scores)<3[3, 16]>16*
Pollen production suitability (initial scores) <20[20, 38]>38**
Fruit production suitability (initial scores) <10[10, 23]>23***
Table 2. Structural attributes of woody and non-woody Riparian Ecological Infrastructures (REIs) located in the Intensive Agriculture (IA), Extensive Agriculture (EA), and Forest Production (FP) landscapes, including the Number of Patches (NP), Mean Patch Size (MPS) (±standard deviation), Class Area (CA), Class Coverage (CC), Mean Nearest Neighbor (MNN) (±standard deviation), and Mean Shape Index (MSI) (±standard deviation).
Landscape RiverLandscape Area (ha)REI ClassNPCA (ha)MPS (ha)CC (%)MNN (m)MSI
IASorraia5455.10Woody173162.850.94 (±3.45)2.9834.15 (±58.40)3.07 (±2.38)
Non-woody16530.700.19 (±0.33)0.5693.54 (±194.27)2.79 (±1.20)
Tagus8473.59Woody109237.742.18 (±8.27)2.8149.53 (±73.03)3.42 (±2.63)
Non-woody9110.260.11 (±0.18)0.12243.40 (±405.34)2.30 (±0.76)
EASorraia4427.40Woody29678.980.27 (±0.60)1.7847.37 (±62.85)2.49 (±1.28)
Non-woody29563.570.22 (±0.43)1.4452.14 (±115.69)3.02 (±1.32)
FPTagus4204.00Woody379283.830.75 (±4.12)6.7539.57 (±52.54)3.32 (±2.51)
Non-woody441178.620.41 (±0.80)4.2540.17 (±47.60)3.78 (±2.37)
Table 3. Habitat Ecological Infrastructure’s Diversity Index (HEIDI) estimated values (mean (±standard deviation)) for short-, medium-, and long-range dispersers, and global HEIDI values in Sampling Units located in the Intensive Agriculture (IA), Extensive Agriculture (EA), and Forest Production (FP) landscapes, including Kruskal–Wallis test for differentiation, with 2 degrees of freedom (H(2)).
HEIDI Estimated ValuesIAEAFPH(2)p
Short-range dispersers0.95 (±0.43)1.26 (±0.66)1.43 (±0.71)13.89<0.001
Medium-range dispersers1.28 (±0.60)1.44 (±0.78)1.63 (±0.75)6.980.031
Long-range dispersers1.25 (±0.81)1.61 (±1.33)1.54 (±1.02)5.510.064
Global1.16 (±0.45)1.43 (±0.79)1.53 (±0.69)9.410.009
Table 4. Habitat Ecological Infrastructure’s Diversity Index (HEIDI) estimated values (average (±standard deviation)) for short-, medium-, and long-range dispersers, and global HEIDI values in Sampling Units located in woody Riparian Ecological Infrastructures (REIs) and non-woody REIs, including results for the Mann–Whitney U test (W).
HEIDI Estimated ValuesWoody REIsNon-Woody REIsWp
Short-range dispersers 1.40 (±0.60)0.86 (±0.52)1097.50<0.001
Medium-range dispersers1.46 (±0.67)1.37 (±0.77)2368.000.167
Long-range dispersers1.72 (±1.25)1.03 (±0.40)1266.00<0.001
Global1.53 (±0.68)1.09 (±0.51)1372.00<0.001
Table 5. Proportion of Sampling Units (%) with scores of “low”, “fair”, and “high”, per HEIDI metric, in the Intensive Agriculture (IA), Extensive Agriculture (EA), and Forest Production (FP) landscapes.
HEIDI Categories and MetricsIAEAFP
LowFairHighLowFairHighLowFairHigh
1. Vegetation structure
Native tree species16.3977.056.5617.3969.5713.0413.6486.360.00
Invasive species cover9.8422.9567.212.178.7089.1313.6427.2759.09
Vertical strata8.2057.3834.4310.8769.5719.579.0968.1822.73
2. Vegetation habitats
Trees with microhabitats above 3 m77.0513.119.8467.3913.0419.5756.8218.1825.00
Trees with microhabitats below 3 m34.434.9260.6632.6110.8756.5240.9111.3647.73
Standing dead trees86.8911.481.6478.2617.394.3577.2720.452.27
Dead wood trunks on the ground44.2618.0337.7034.7821.7443.4834.0931.8234.09
Large living trees60.6627.8711.4878.2621.740.0079.556.8213.64
Leaf litter cover (short-range)9.8463.9326.238.7060.8730.436.8263.6429.55
Leaf litter cover (medium-range)26.2363.939.8430.4360.878.7029.5563.646.82
3. Associated habitats
Rocky habitat types91.808.200.00100.000.000.0090.916.822.27
Aquatic habitat types4.9283.6111.486.5289.134.3520.4572.736.82
4. Vegetation management
Understory clearing9.8418.0372.1313.0419.5767.390.0013.6486.36
Tree clearing1.646.5691.806.522.1791.300.004.5595.45
5. Floristic suitability
Seed production suitability44.2654.101.6410.8760.8728.266.8252.2740.91
Pollen production suitability34.4354.1011.4819.5760.8719.579.0947.7343.18
Fruit production suitability36.0755.748.2010.8756.5232.614.5563.6431.82
Publisher’s Note: MDPI stays neutral with regard to jurisdictional claims in published maps and institutional affiliations.

