
Does Entrepreneurship Make You Happier? A Comparative Analysis between Entrepreneurs and Wage Earners

 ,
,  ,
,  and
and 
Abstract
:1. Introduction and Conceptual Background
2. Materials and Methods
3. Results
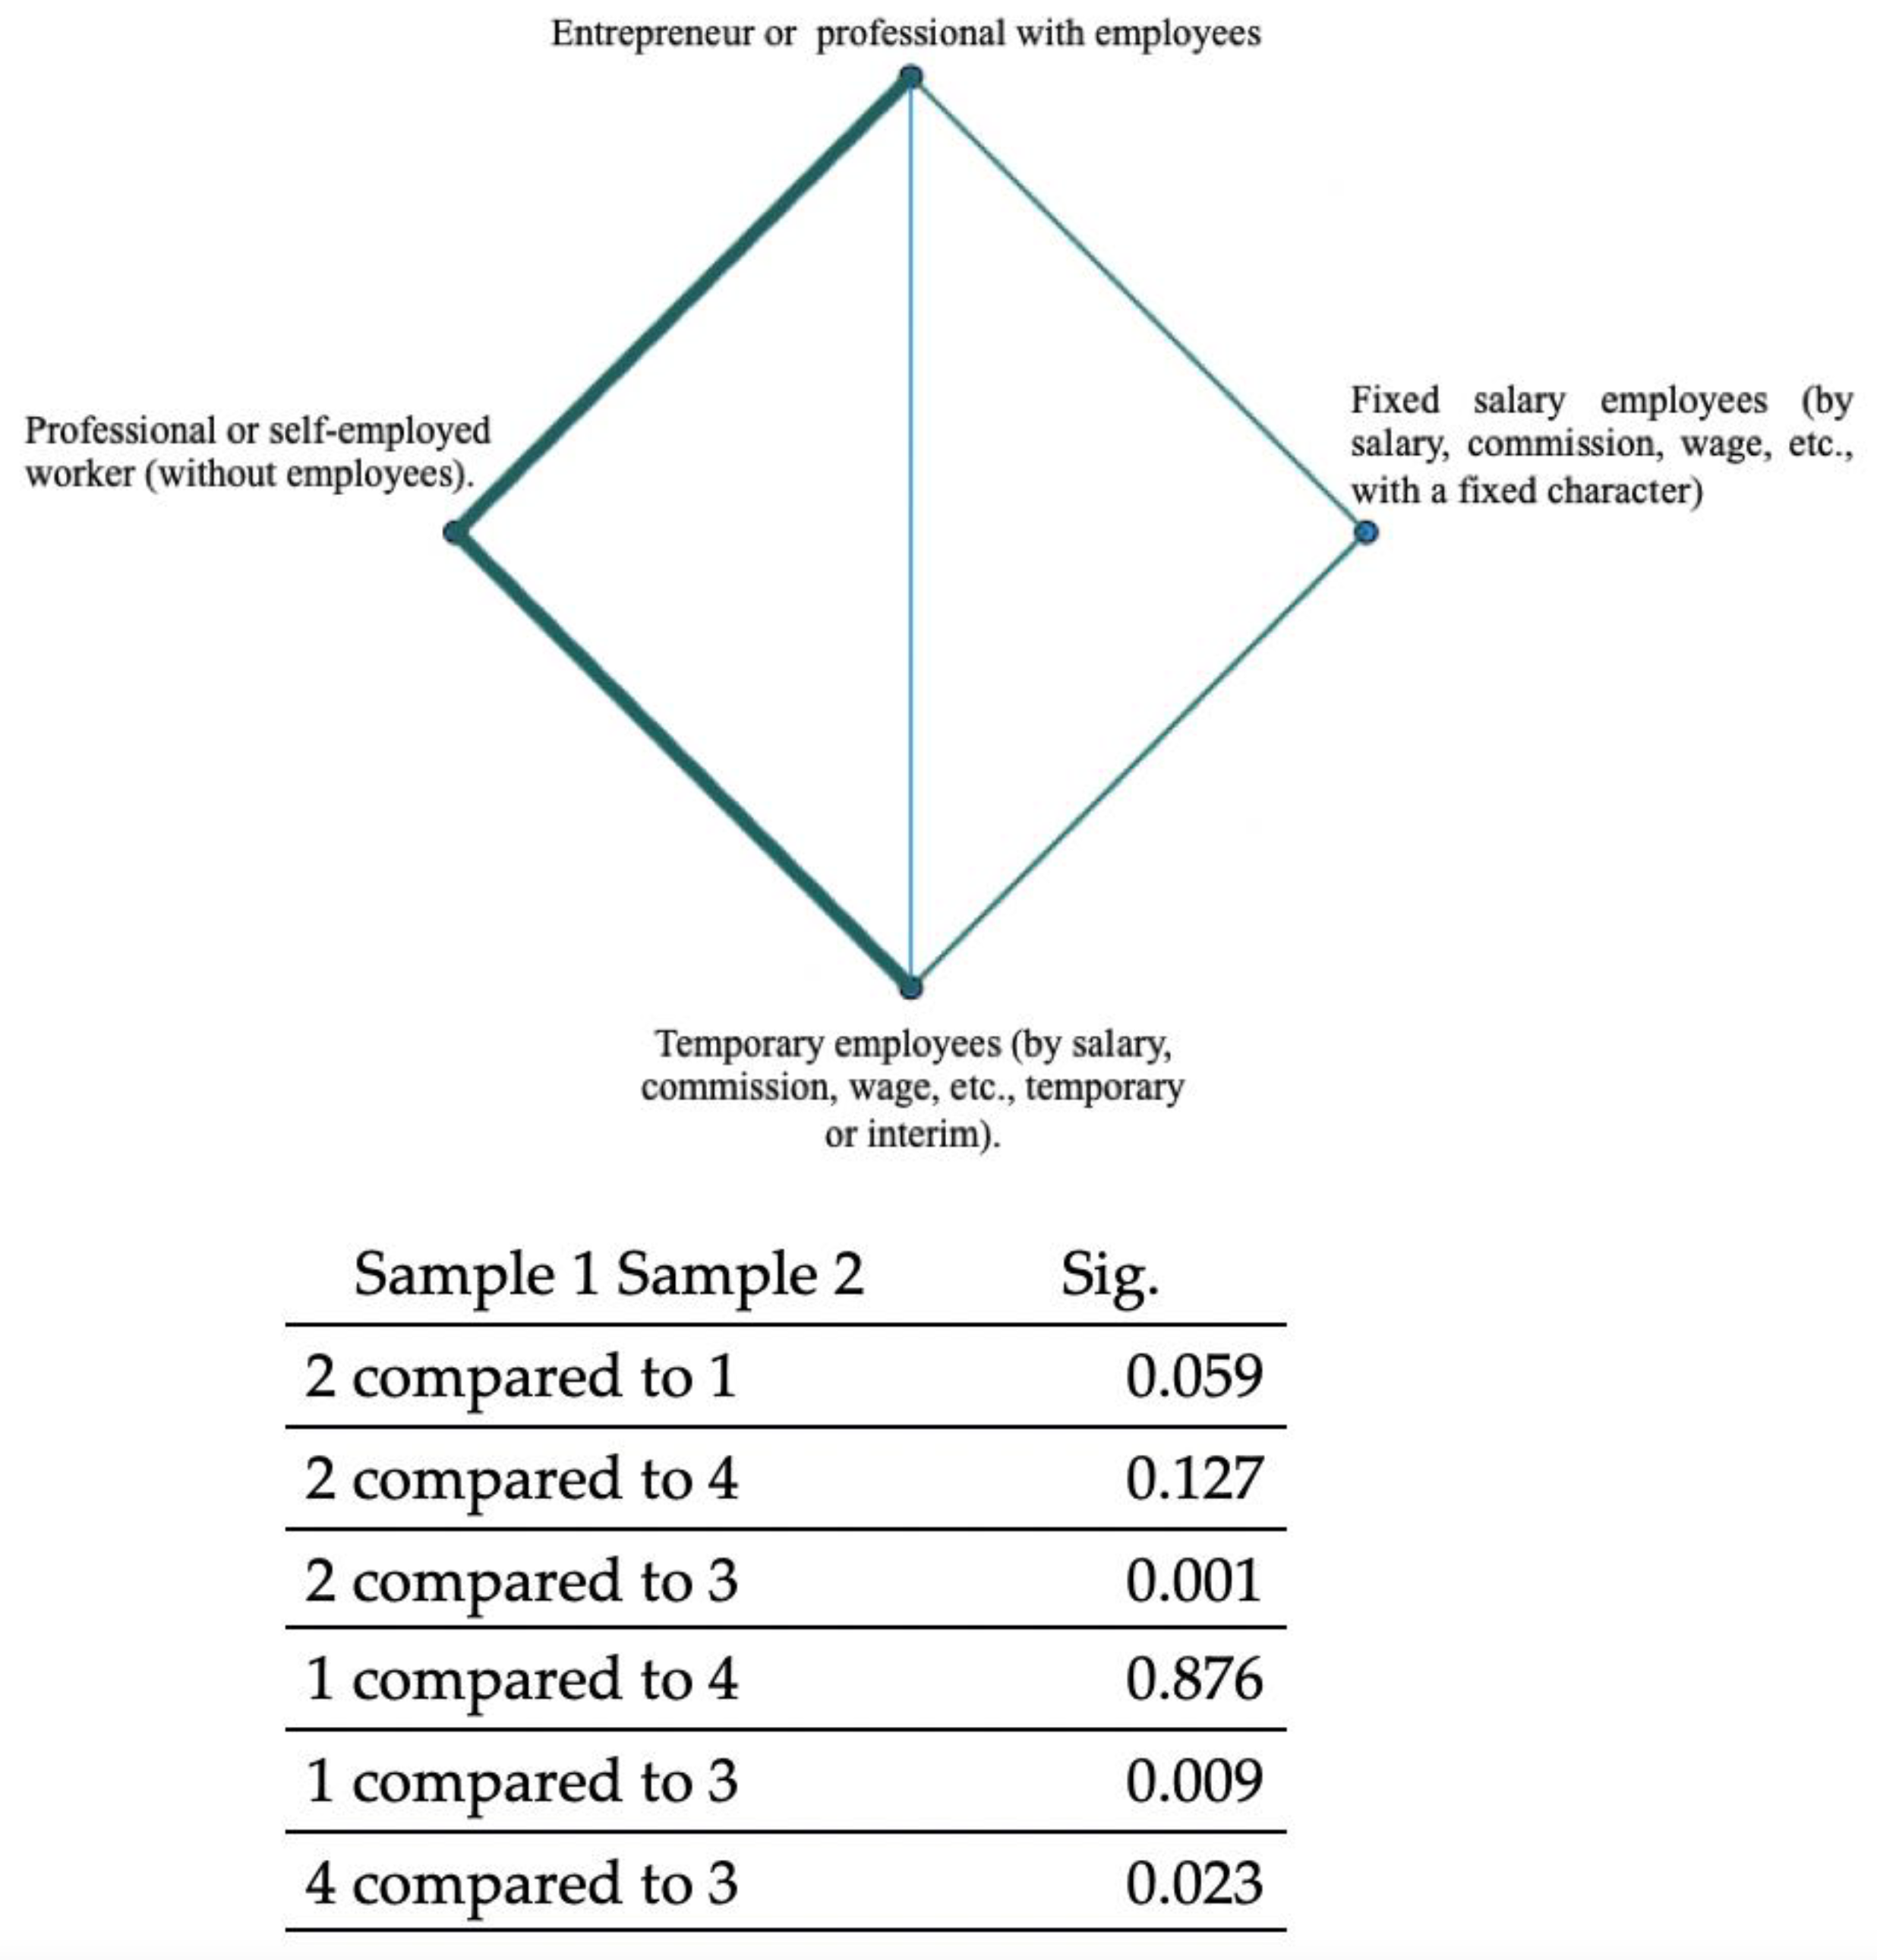
3.1. Overall Sample
- ▪ The averages are between category 3 (entrepreneurs or professionals with employees) and category 2 (casual employees), de 0.572 points in the averages. Sig = 0.1% error;
- ▪ Between category 3 and category 1 (fixed employees), of 0.385 points, next to 1% error;
- ▪ And between category 3 and category 4 (Professional or self-employed, without workers), de 0.363. Sig. al 5% de error.
3.2. Category Samples
- ▪ For P38 = 3, it is negative, very weak, and not significant (p > 0.05).
- ▪ For P38 = 4, it is positive, weak, and significant, but only at the 5% error level. It can give guarantees that as the sample increases, this correlation does not vary significantly.
- ▪ For P38 = 1, it is positive, fragile, but significant at the 1% error level. In this case, the sample is the largest of all the categories, which would help to ensure that a similar correlation is maintained as it increases.
- ▪ For 38 = 2, it is positive, the highest of all correlations. However, it does not even reach 20%, and it has an error level significance of 1%. The sample size is also considerable, so a similar level of correlation could be guaranteed in other samples higher in number [86].
- ▪ For the group of entrepreneurs with employees, there is no statistically significant difference between the categories of educational levels.
- ▪ In the group of professionals and self-employed without employees, there are no statistically significant differences between the means of the different levels of education neither.
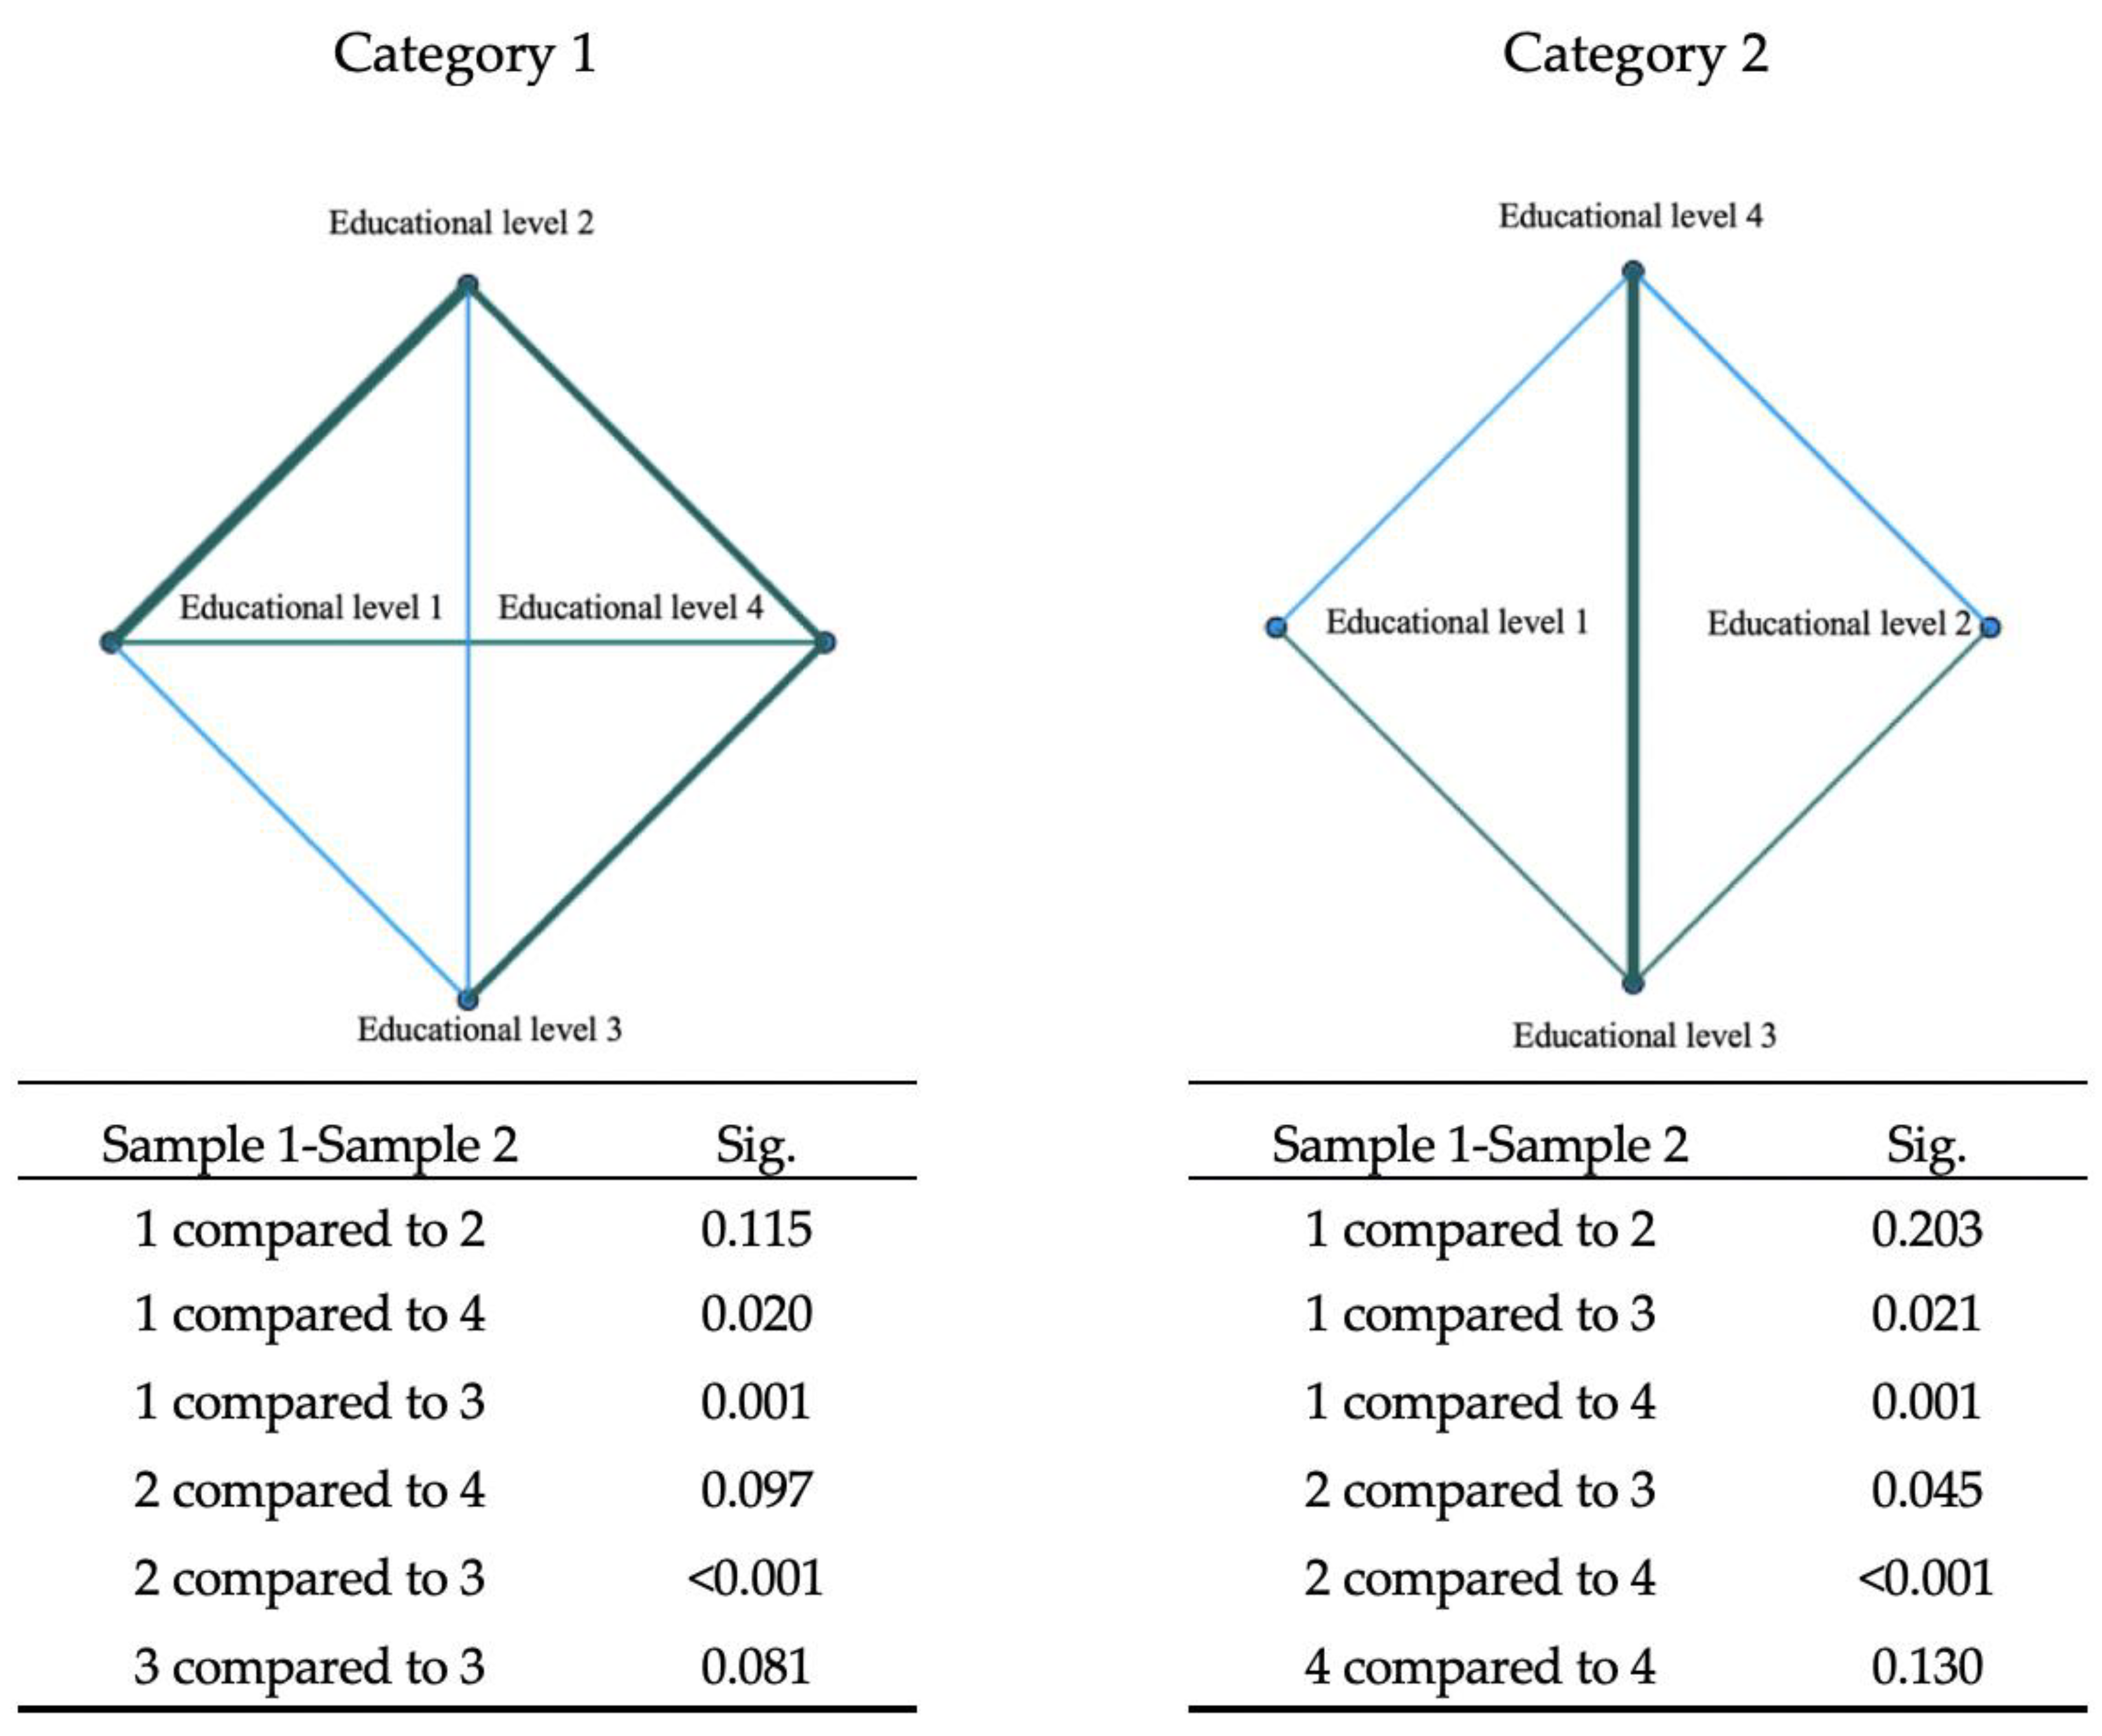
- ▪ For permanent employee’s, significance appears (p < 0.1%). According to the Levene test, the variances are not equal, so the Games–Howell multiple comparison tests are used. The results indicate that differences with significance at the 0.1% level occur between levels 3, the first level of university degree (7.68 on average), and level 1, up to primary studies (average 6.87), and between level 3 and level 2 (secondary studies, average 7.28). The difference with significance at the 5% level occurs between educational level 1 and level 4, the second level of university degree (average 7.51) (Figure 2).
- ▪ It is also true for the group of temporary employees. In this case, there is no equality of variances either. The Games–Howell test shows that significant intergroup differences lower than 0.1% error exists between group 4 (mean 7.90) and group 1 (6.67 average) and group 4 and group 2, secondary studies (average 7.04). For an error lower than 5%, differences exist between category 3 (average 7.46) and category 1; and category 3 and category 2 (Figure 2) [87].
- ▪ For P38 = 3, it is positive, fragile, and not significant (p > 0.05).
- ▪ For P38 = 4, it is positive, weak, but significant at the 5% error level in the Spearman test.
- ▪ For P38 = 1, it is positive, fragile, and not significant.
- ▪ For 38 = 2, it is positive, the highest of all. However, it does not even reach 20%, and it has an error level significance lower than 0.1%.
- ▪ In the group of entrepreneurs without employees, differences occur among group 4—more than 1800 euros—on average of 8.06, with group 2—from 1 to 900 euros—on average 7.00, with group 3 —from 901 to 1800-—on average 7.37, and with group 1—without income—on average 7.38. Employers without employees who are more affluent turn out to be the happiest.
- ▪ For the category of permanent employees, the differences are between group 2, on average 6.96, and groups 1 (average: 7.65), 3 (average: 7.49), and 4 (average: 7.48). Fixed earners with incomes from 1 to 900 euros seem to be the least happy.
- ▪ For the eventual employees, the differences are between group 4 (average 7.93) and group 1 (average: 6.85), and for group 3 (average: 7.64) with groups 1 and 2 (average: 7.03). Eventual earners who are richer seem to be the happiest.
- ▪ Comparison of income levels 4 and 2: Entrepreneurs without employees who earn more than 1800 euros per month are 6.452 times more likely to report that they feel pretty happy (P6 = 7) to completely happy (P6 = 10) than an incoming colleague with 1 to 900 euros would, and 4.310 times more likely to report feeling happy (P6 = 8) to completely happy. In the second case, the specificity and sensitivity of the theoretical model balance are slightly more than in the other one, with a prediction level of 63.20%.
- ▪ Comparison of income levels 4 and 3: People who earn more than 1800 euros are 2.421 times more likely to report being happy to completely happy than those earning from 900 to 1800 euros. Specificity and sensitivity are highly unbalanced, however.
- ▪ Comparison of income levels 4 and 1: People who earn more than 1800 euros are 3.425 times more likely to report being completely happy than those with no income. Specificity and sensitivity are pretty balanced, with a prediction level of 58.8%.
4. Discussion and Conclusions
Author Contributions
Funding
Institutional Review Board Statement
Informed Consent Statement
Acknowledgments
Conflicts of Interest
References
- Abreu, M.; Oner, O.; Brouwer, A.; Van Leeuwen, E. Well-being effects of self-employment: A spatial inquiry. J. Bus. Ventur. 2019, 34, 589–607. [Google Scholar] [CrossRef]
- Sorgner, M.; Sorgner, A.; Wyrwich, M. Self-employment and well-being across institutional contexts. J. Bus. Ventur. 2019, 34, 105946. [Google Scholar] [CrossRef] [Green Version]
- Gopinath, N.; Mitra, J. Entrepreneurship and well-being: Towards developing a novel conceptual framework for entrepreneurial sustainability in organisations. J. Entrep. Innov. Emerg. Econ. 2017, 3, 62–70. [Google Scholar] [CrossRef]
- Sevä, I.J.; Vinberg, S.; Nordenmark, M.; Strandh, M. Subjective well-being among the self-employed in Europe: Macroeconomy, gender and immigrant status. Small Bus. 2016, 46, 239–253. [Google Scholar] [CrossRef]
- Salas-Vallina, A.; Alegre, J.; Guerrero, R.F. Happiness at work in knowledge-intensive contexts: Opening the research agenda. Eur. Res. Manag. Bus. Econ. 2018, 24, 149–159. [Google Scholar] [CrossRef]
- Florida, R.; Mellander, C.; Rentfrow, P.J. The happiness of cities. Reg. Stud. 2013, 47, 613–627. [Google Scholar] [CrossRef]
- Ball, R.; Chernova, K. Absolute income, relative income, and happiness. Soc. Indic. Res. 2008, 88, 497–529. [Google Scholar] [CrossRef]
- Tsou, M.W.; Liu, J.T. Happiness and domain satisfaction in Taiwan. J. Happiness Stud. 2001, 2, 269–288. [Google Scholar] [CrossRef]
- Ravina-Ripoll, R.; Núñez-Barriopedro, E.; Evans, R.D.; Ahumada-Tello, E. Employee Happiness in the Industry 4.0 Era: Insights from the Spanish Industrial Sector. In Proceedings of the Technology & Engineering Management Conference (TEMSCON), 2019 International Conference (IEEE), Atlanta, GA, USA, 12–14 June 2019; IEEE: New York, NY, USA, 2019. [Google Scholar] [CrossRef]
- Hmieleski, K.M.; Sheppard, L.D. The Yin and Yang of entrepreneurship: Gender differences in the importance of communal and agentic characteristics for entrepreneurs’ subjective well-being and performance. J. Bus. Ventur. 2019, 34, 709–730. [Google Scholar] [CrossRef]
- Kibler, E.; Wincent, J.; Kautonen, T.; Cacciotti, G.; Obschonka, M. Can prosocial motivation harm entrepreneurs’ subjective well-being? J. Bus. Ventur. 2019, 34, 608–624. [Google Scholar] [CrossRef]
- Stephan, U. Entrepreneurs’ mental health and well-being: A review and research agenda. Acad. Manag. Perspect. 2018, 32, 290–322. [Google Scholar] [CrossRef] [Green Version]
- Neto, R.D.C.A.; Rodrigues, V.P.; Panzer, S. Exploring the relationship between entrepreneurial behavior and teachers’ job satisfaction. Teach. Teach. Educ. 2017, 63, 254–262. [Google Scholar] [CrossRef] [Green Version]
- Andersson, P. Happiness and health: Well-being among the self-employed. J. Socio-Econ. 2008, 37, 213–236. [Google Scholar] [CrossRef]
- Audretsch, D.B.; Belitski, M. Entrepreneurial ecosystems in cities: Establishing the framework conditions. J. Technol. Transf. 2017, 42, 1030–1051. [Google Scholar] [CrossRef]
- Arniati, T.; Puspita, D.A.; Amin, A.; Pirzada, K. The implementation of good corporate governance model and auditor independence in earnings’ quality improvement. Entrep. Sustain. Issues 2019, 7, 188–200. [Google Scholar] [CrossRef]
- Eridani, R.; Pirzada, K.; Kurniawan, M.K. The role of auditor characteristics: Earnings management and audit committee effectiveness. Entrep. Sustain. Issues 2020, 7, 3242–3252. [Google Scholar] [CrossRef]
- Nosara, F.; Pirzada, K.; Lestari, T.; Cahyono, R. Impact of demographic factors on risk tolerance. J. Secure. Sustain. Issues 2020, 9, 1265–1273. [Google Scholar] [CrossRef]
- Rudyanto, A.; Pirzada, K. The role of sustainability reporting in shareholder perception of tax avoidance. Soc. Responsib. J. 2020. [Google Scholar] [CrossRef]
- Observatorio del Emprendimiento de España. Global Entrepreneurship Monitor. Informe GEM España 2020–2021; Ed. Universidad de Cantabria: Santander, Spain, 2021. [Google Scholar]
- Ravina-Ripoll, R.; Marchena-Domínguez, J.; Tobar-Pesantez, L. (Eds.) Happiness Management: A Lighthouse for Social Wellbeing, Creativity and Sustainability; Editorial Peter Lang: Bern, Switzerland, 2021. [Google Scholar]
- Markussen, T.; Fibæk, M.; Tarp, F.; Tuan, N.D.A. The happy farmer: Self-employment and subjective well-being in rural Vietnam. J. Happiness Stud. 2018, 19, 1613–1636. [Google Scholar] [CrossRef]
- Gallardo-Vázquez, D.; Pajuelo-Moreno, M.L. Entrepreneurship: Concepts, Methodologies, Tools, and Applications; I.G.I. Global: Hershey, PA, USA, 2017. [Google Scholar]
- Zampetakis, L.A.; Kafetsios, K.; Lerakis, M.; Moustakis, V.S. An emotional experience of entrepreneurship: Self-construal, emotion regulation, and expressions to anticipatory emotions. J. Career Dev. 2017, 44, 144–158. [Google Scholar] [CrossRef]
- Swan, C.D.; Morgan, D. Who wants to be an eco-entrepreneur? Identifying entrepreneurial types and practices in ecotourism businesses. Int. J. Entrep. Innov. 2016, 17, 120–132. [Google Scholar] [CrossRef]
- Peredo, A.M.; McLean, M. Social entrepreneurship: A critical review of the concept. J. World Bus. 2006, 41, 56–65. [Google Scholar] [CrossRef]
- Ryff, C.D. Entrepreneurship and eudaimonic well-being: Five venues for new science. J. Bus. Ventur. 2019, 34, 646–663. [Google Scholar] [CrossRef] [PubMed]
- Wiklund, J.; Nikolaev, B.; Shir, N.; Foo, M.D.; Bradley, S. Entrepreneurship and well-being: Past, present, and future. J. Bus. Ventur. 2019, 34, 579–588. [Google Scholar] [CrossRef]
- Naudé, W.; Amorós, J.E.; Cristi, O. ‘Surfeiting, the appetite may sicken’: Entrepreneurship and happiness. Small Bus. Econ. 2014, 42, 523–540. [Google Scholar] [CrossRef]
- Gries, T.; Naudé, W.A. Entrepreneurship and Structural Economic Transformation. Small Bus Econ. 2010, 34, 1. [Google Scholar] [CrossRef] [Green Version]
- Van der Loos, M.J.H.; Koellinger, P.D.; Groenen, P.J.F.; Thurik, A.R. Genome-wide association studies and the genetic of entrepreneurship. Eur. J. Epidemiol. 2010, 25, 1–3. [Google Scholar] [CrossRef] [Green Version]
- Pham, T.; Talavera, O.; Zhang, M. Self-employment, financial development, and well-being: Evidence from China, Russia, and Ukraine. J. Comp. Econ. 2018, 46, 754–769. [Google Scholar] [CrossRef]
- Bradley, D.E.; Roberts, J.A. Self-employment and job satisfaction: Investigating the role of self-efficacy, depression, and seniority. J. Small Bus. Manag. 2004, 42, 37–58. [Google Scholar] [CrossRef]
- Cooper, A.C.; Artz, K.W. Determinants of satisfaction for entrepreneurs. J. Bus. Ventur. 1995, 10, 439–457. [Google Scholar] [CrossRef]
- Susanto, Y.K.; Pirzada, K.; Adrianne, S. Is tax aggressiveness an indicator of earnings management? Polish J. Manag. Stud. 2019, 20, 516–527. [Google Scholar] [CrossRef]
- Bencsik, P.; Chuluun, T. Comparative well-being of the self-employed and paid employees in the USA. Small Bus. Econ. 2021, 56, 355–384. [Google Scholar] [CrossRef]
- Binder, M.; Coad, A. How satisfied are the self-employed? A life domain view. J. Happiness Stud. 2016, 17, 1409–1433. [Google Scholar] [CrossRef] [Green Version]
- Dijkhuizen, J.; Veldhoven, M.V.; Schalk, R. Four types of well-being among entrepreneurs and their relationships with business performance. J. Bus. Entrep. 2016, 25, 184–210. [Google Scholar] [CrossRef]
- Pirzada, K. Risk management, sustainable governance impact on corporate performance. J. Secur. Sustain. Issues 2020, 9, 993–1004. [Google Scholar] [CrossRef]
- Wait, L.N.; Primiana, H.I.; Pirzada, K.; Sudarsono, R. Political connection, blockholder ownership and performance. Entrep. Sustain. Issues 2019, 7, 52–68. [Google Scholar] [CrossRef]
- Yacoub, Y.; Lestari, N. Flypaper effect in Indonesia: The case of Kalimantan. J. Fin. Bank. Rev. 2019, 4, 116–121. [Google Scholar] [CrossRef]
- Núñez-Barriopedro, E.; Cuesta-Valiño, P.; Gutiérrez-Rodríguez, P.; Ravina-Ripoll, R. How does happiness influence the loyalty of karate athletes? A model of structural equations from the constructs: Consumer satisfaction, engagement, and meaningful. Front. Psychol. 2021, 12, 794. [Google Scholar] [CrossRef]
- Huang, J. Income inequality, distributive justice beliefs, and happiness in China: Evidence from a nationwide survey. Soc. Indic. Res. 2019, 142, 83–105. [Google Scholar] [CrossRef]
- Lawrence, E.M.; Rogers, R.G.; Zajacova, A.; Wadsworth, T. Marital happiness, marital status, health, and longevity. J. Happiness Stud. 2019, 20, 1539–1561. [Google Scholar] [CrossRef]
- Botha, F.; Wouters, E.; Booysen, F. Happiness, socioeconomic status, and family functioning in South African households: A structural equation modelling approach. Appl. Res. Qual. Life 2018, 13, 947–989. [Google Scholar] [CrossRef]
- Frey, B.S.; Stutzer, A. Economics of Happiness; Springer International Publishing: Cham, Switzerland, 2018. [Google Scholar]
- Lelo, K.; Monni, S.; Tomassi, F. Urban inequalities in Italy: A comparison between Rome, Milan and Naples. Entrep. Sustain. Issues 2018, 6, 939–957. [Google Scholar] [CrossRef]
- Pritvorova, T.; Temirbyeva, D.; Petrenko, Y.; Benčič, S. Income distribution peculiarities of households with children: A case study. Entrep. Sustain. Issues 2020, 7, 2924–2939. [Google Scholar] [CrossRef]
- Vasconcelos, V.V. Social justice and sustainable regional development: Reflections on discourse and practice in public policies and public budget. Insights Into Reg. Dev. 2021, 3, 10–28. [Google Scholar] [CrossRef]
- Suryani, A.; Pirzada, K. Analysis of opportunistic behavior of management to company performance. Polish J. Manag. Stud. 2018, 18, 379–388. [Google Scholar] [CrossRef]
- Iceland, J.; Ludwig-Dehm, S. Black-white differences in happiness, 1972–2014. Soc. Sci. Res. 2019, 77, 16–29. [Google Scholar] [CrossRef]
- Hori, M.; Kamo, Y. Gender differences in happiness: The effects of marriage, social roles, and social support in East Asia. Appl. Res. Qual. Life 2018, 13, 839–857. [Google Scholar] [CrossRef]
- Gudmundsdottir, D.G. The impact of economic crisis on happiness. Soc. Indic. Res. 2013, 110, 1083–1101. [Google Scholar] [CrossRef]
- Thandabhani, M. Strategic communication for women entrepreneurs: A case study of India. Insights Into Reg. Dev. 2020, 2, 480–497. [Google Scholar] [CrossRef]
- Nikolaev, B. Does higher education increase hedonic and eudaimonic happiness? J. Happiness Stud. 2018, 19, 483–504. [Google Scholar] [CrossRef] [Green Version]
- Cuñado, J.; De Gracia, F.P. Environment and happiness: New evidence for Spain. Soc. Indic. Res. 2013, 112, 549–567. [Google Scholar] [CrossRef]
- Argyle, M. Causes and correlates of happiness. In Well-Being: The Foundations of Hedonic Psychology; Kahneman, D., Diener, E., Schwarz, N., Eds.; Russell Sage Foundation: New York, NY, USA, 2013; pp. 353–373. [Google Scholar]
- Ferranti, F.; Karmudiandri, A. Corporate governance and financial ratios effect on audit report Lag. Acc. Fin. Rev. 2020, 5, 15–21. [Google Scholar] [CrossRef]
- Ravina-Ripoll, R.; Tobar-Pesantez, L.B.; Galiano-Coronil, A.; Marchena-Domínguez, J. (Eds.) Happiness Management and Social Marketing: A Wave of Sustainability and Creativity; Editorial Peter Lang: Bern, Switzerland, 2021. [Google Scholar] [CrossRef]
- Sasongko, G.; Huruta, A.D.; Pirzada, K. Why labor force participation rate rises? New empirical evidence from Indonesia. Entrep. Sustain. Issues 2019, 7, 166–176. [Google Scholar] [CrossRef]
- Albert, J.F.; Casado-Díaz, J.M.; Simón, H. The commuting behaviour of self-employed workers: Evidence for Spain. Pap. Reg. Sci. 2019, 98, 2455–2477. [Google Scholar] [CrossRef]
- Orrego, C. La dimensión humana del emprendimiento. Rev. Cienc. Estratégicas 2008, 16, 225–236. [Google Scholar]
- Anger-Egg, E. Técnicas de Investigación Social; Editorial Lumen: Buenos Aires, Argentina, 1995. [Google Scholar]
- Princes, E.; Manurung, A.H. Taking advantage of social conformity in entrepreneurship. J. Manag. Mark. Rev. 2020, 5, 64–73. [Google Scholar] [CrossRef]
- Barón, R.M.; Kenny, D.A. The moderator-mediator variable distinction in social psychological research: Conceptual, strategic, and statistical considerations. J. Personal. Soc. Psychol. 1986, 51, 1173–1182. [Google Scholar] [CrossRef] [PubMed]
- Hendrawan, R.; Nugroho, K.W.A.; Permana, G.T. Efficiency perspective on telecom mobile data traffic. J. Bus. Econ. Rev. 2020, 5, 38–44. [Google Scholar] [CrossRef] [Green Version]
- Setiawan, A.; Dalimunthe, Z.; Rizkianto, E. Bankruptcy risk among indonesian stock exchange listed companies. J. Fin. Bank. Rev. 2019, 4, 122–127. [Google Scholar] [CrossRef]
- Pirzada, K.; Mustapha, M.Z.; Alfan, E. The role of nomination committee in selecting female directors: A Case of Malaysia. Pertanika J. Soc. Sci. Humanit. 2016, 24, 105–118. [Google Scholar]
- Yanos, M.H.A.; Leal, R.C. Mungbean (Vignaradiata) as a source of income among farmers. J. Bus. Econ. Rev. 2020, 5, 10–17. [Google Scholar] [CrossRef]
- Ferdian, A.; Luturlean, B.S.; Zhafira, K.D.; Izumi, N.K. The impact of work stress on turnover intention in Indonesia: Is there a mediation from employee’ job satisfaction? Ferdian 2020, 5, 31–40. [Google Scholar] [CrossRef]
- Alexander, N. The effect of ownership structure, cash holding and tax avoidance on income smoothing. J. Fin. Bank. Rev. 2019, 4, 128–134. [Google Scholar] [CrossRef]
- Mokhtar, K.S.; Rahman, N.A.; Haron, M.S. Complying with the United Nations’ Sustainable Development Goals: A case of the Malaysian ageing population. Glob. J. Bus. Soc. Sci. Rev. 2020, 8, 1–11. [Google Scholar] [CrossRef]
- Garnasih, R.L.; Kurniawaty, K.; Suryatiningsih, D. Determinants of culinary business performance. J. Bus. Econ. Rev. 2020, 5, 1–9. [Google Scholar] [CrossRef]
- Pirzada, K.; Mustapha, M.Z.; Alfan, E.B. Antecedents of ethnic diversity: The role of nomination committees. Int. J. Econ. Manag. 2017, 11, 103–119. [Google Scholar] [CrossRef] [Green Version]
- Mora, R.P. Assessing the attitudes, aspirations, and gender differences of pre-service mathematics teachers. J. Bus. Econ. Rev. 2020, 5, 18–27. [Google Scholar] [CrossRef]
- Solikhah, B.; Della Firmansyah, N.; Pirzada, K. The influence of effective B.O.C. on choice of auditor. Pertanika J. Soc. Sci. Humanit. 2017, 25, 271–280. [Google Scholar]
- Pirzada, K. Providers and users’ perception of voluntary need of human resource disclosure: A content analysis. Polish J. Manag. Stud. 2016, 14, 232–242. [Google Scholar] [CrossRef]
- Sulistiowati; Komari, N. Achieve Model on Research and Publication Performance. Glob. J. Bus. Soc. Sci. Rev. 2020, 8, 22–29. [Google Scholar] [CrossRef] [Green Version]
- Francisco, I.F.S.; Castano, M.C.N. The impact of career adaptability to the job search strategies of graduate students in N.C.R. Fr. IFS 2020, 5, 41–50. [Google Scholar] [CrossRef]
- Pradipta, A.; Zalukhu, A.G. Audit report lag: Specialized auditor and corporate governance. Glob. J. Bus. Soc. Sci. Rev. 2020, 8, 41–48. [Google Scholar] [CrossRef]
- Ward, J.G.; Ward, Y.D.; Jones, S. Journaling to develop a study abroad course for business majors. Glob. J. Bus. Soc. Sci. Rev. 2020, 8, 30–40. [Google Scholar] [CrossRef]
- Djashan, I.A.; Agustinus, Y. The effect of firm size, profitability, audit committee, and other factors to firm value. Acc. Fin. Rev. 2020, 5, 22–27. [Google Scholar] [CrossRef]
- Saragih, R.; Prasetio, A.P. Effective human resources practice and employee engagement: The Mediating roles of organizational support. J. Manag. Mark. Rev. 2020, 5, 74–83. [Google Scholar] [CrossRef]
- Hanif, H.; Rakhman, A.; Nurkholis, M.; Pirzada, K. Intellectual capital: Extended VAIC model and building of a new HCE concept: The case of Padang Restaurant Indonesia. Afr. J. Hosp. Tour. Leis. 2019, 8, 1–15. [Google Scholar]
- Wahyuni, N.M.; Astawa, I.P. An integrative model of market orientation on innovation performance. J. Manag. Mark. Rev. 2020, 5, 51–63. [Google Scholar] [CrossRef]
- Hendrayati, H.; Askolani, A.; Sudrajat, C.T.; Syahidah, R.K. E-service quality and price to build online transportation loyalty in Indonesia. J. Manag. Mark. Rev. 2020, 5, 16–30. [Google Scholar] [CrossRef]
- Ristyawan, M.R. An integrated artificial intelligence and resource base view model for creating competitive advantage. J. Bus. Econ. Rev. 2020, 5, 28–37. [Google Scholar] [CrossRef]
- Sweida, G.; Sherman, C.L. Does happiness launch more businesses? Affect, gender, and entrepreneurial intention. Int. J. Environ. Res. Public Health 2020, 7, 6908. [Google Scholar] [CrossRef]
- Lubis, A.; Dalimunthe, R.; Absah, Y.; Fawzeea, B.K. The influence of customer relationship management (CRM) indicators on customer loyalty of sharia based banking system. J. Manag. Mark. Rev. 2020, 5, 84–92. [Google Scholar] [CrossRef]
- Asmara, A.Y.; Rahayu, A.Y.S. Innovation in delivering public health service: Practice in banyuwangi regency—Indonesia. Glob. J. Bus. Soc. Sci. Rev. 2020, 8, 12–21. [Google Scholar] [CrossRef]
- Ravina-Ripoll, R.; Foncubierta-Rodríguez, M.J.; Ahumada-Tello, E.; Evans, R.D. Does Money Makes Entrepreneurs Happy in the Age of Industries 4.0? In Proceedings of the Technology & Engineering Management Conference (TEMSCON), 2020 International Conference (IEEE), Novi, MI, USA, 3–6 June 2020. [Google Scholar] [CrossRef]
- Kollamparambil, U. Happiness, happiness inequality and income dynamics in South Africa. J. Happiness Stud. 2019, 21, 201–222. [Google Scholar] [CrossRef]
- Ng, W.; Diener, E. Affluence and subjective well-being: Does income inequality moderate their associations? Appl. Res. Qual. Life 2019, 14, 155–170. [Google Scholar] [CrossRef]
- Deaton, A.; Stone, A.A. Two happiness puzzles. Am. Econ. Rev. 2013, 103, 591–597. [Google Scholar] [CrossRef] [Green Version]
- Sappleton, N.; Lourenço, F. Work satisfaction of the self-employed: The roles of work autonomy, working hours, gender and sector of self-employment. Int. J. Entrep. Innov. 2016, 17, 89–99. [Google Scholar] [CrossRef]
- Brieger, S.A.; Gielnik, M.M. Understanding the gender gap in immigrant entrepreneurship: A multi-country study of immigrants’ embeddedness in economic, social, and institutional contexts. Small Bus. Econ. 2021, 56, 1007–1031. [Google Scholar] [CrossRef] [Green Version]
- Berglund, V.; Johansson Sevä, I.; Strandh, M. Subjective well-being and job satisfaction among self-employed and regular em-ployees: Does personality matter differently? J. Small Bus. 2016, 28, 55–73. [Google Scholar] [CrossRef]
- Carree, M.A.; Verheul, I. What makes entrepreneurs happy? Determinants of satisfaction among founders. J. Happiness Stud. 2012, 13, 371–387. [Google Scholar] [CrossRef] [Green Version]
- Scarpello, V.; Carraher, S.M. Are pay satisfaction and pay fairness the same construct? A cross-country examination among the self-employed in Latvia, Germany, the UK, and the USA. Balt. J. Manag. 2008, 3, 23–39. [Google Scholar] [CrossRef]
- Ravina-Ripoll, R.; Tobar-Pesantez, L.; López-Sanchez, J.A. Entrepreneur happiness as a portfolio of competitiveness and sustainability in the Covid-19 era. Int. J. Entrep. 2021, 25, 1–3. [Google Scholar]
- Foncubierta-Rodríguez, M.J.; Ravina-Ripoll, R.; Ahumada-Tello, E.; Tobar-Pesantez, L.B. Are Spanish public employees happier in their work performance in the Industry 4.0 era? Polish J. Manag. Stud. 2020, 22, 103–116. [Google Scholar] [CrossRef]
- Freeman, D.H. Applied Categorical Data Analysis; Marcel Dekker Inc.: New York, NY, USA, 1987. [Google Scholar] [CrossRef]
- Peruzzi, P.; Concato, J.; Kemper, E.; Holford, T.R.; Feinstein, A.R. A simulation study of the number of events per variable in logistic regression analysis. J. Clin. Epidemiol. 1996, 49, 1373–1379. [Google Scholar] [CrossRef]
- Mehjabeen, M.; Bukth, T. Comparative analysis of the dominant themes in C.S.R. reporting discourse in Bangladesh: A structured literature review. Acc. Fin. Rev. 2020, 5, 1–14. [Google Scholar] [CrossRef]
- Baron, I.S.M.; Agustina, H. The role of psychological testing as an effort to improve employee competency. J. Manag. Mark. Rev. 2020, 5, 1–15. [Google Scholar] [CrossRef]
- Ravina-Ripoll, R.; Foncubierta-Rodríguez, M.J.; Ahumada-Tello, E.; Evans, R.D. The role of religion and marital status in happiness perception of Spanish Entrepreneurs. A concept to be explore in the Post COVID-19 era. In Proceedings of the Technology & Engineering Management Conference-Europe (TEMSCON-EUR), Dubrovnik, Croatia, 17–20 May 2021. [Google Scholar] [CrossRef]
- Ravina-Ripoll, R.; Foncubierta-Rodríguez, M.J.; López-Sánchez, J.A. Certification happiness management: An integral instrument for human resources management in post-COVID-19 era. Int. J. Bus. Environ. 2021, 12, 287–299. [Google Scholar] [CrossRef]


| Variables Used | Question N°. C.I.S. Barometer, Sept 2018 | Questionnaire Item | Rank |
|---|---|---|---|
| Professional situation: entrepreneurs | P38 | Professional situation of the participant | 1: Fixed-salary employees (by salary, commission, wage, etc., with a fixed character). 2: Temporary employees (by salary, commission, wage, etc., temporary or interim). 3: Entrepreneur or professional with employees. 4. Professional or self-employed worker (without employees). 5: Family assistance (without regulated remuneration in a family member’s business). 6: Member of a cooperative. 7. Another situation. |
| Gender | P30 | Gender | 1: Male 2: Female |
| Level of studies | P32a | What are the highest-level official studies that you have taken? | 0: Less than five years of schooling. 14: University postgraduate degrees. |
| Income level | P41 | In which section is your personal income, after-tax deductions, that is to say, your net income? | 1: You have no income of any kind. 2: Less than or equal to EUR 300. 3: From 301 to EUR 600. 4: From 601 to EUR 900. 5: From 901 to EUR 1200. 6: From 1201 to EUR 1800. 7: From 1801 to EUR 2400. 8: From 2401 to EUR 3000. 9: From 3001 to EUR 4500. 10: From 4501 to EUR 6000. 11: More than EUR 6000. |
| Degree of Happiness | P6 | In general terms, to what extent do you consider yourself a happy or an unhappy person? | 0: Completely unhappy. 10: Completely happy. |
| P38 | Kolmogorov–Smirnov | Shapiro–Wilk | |||||
|---|---|---|---|---|---|---|---|
| Statistic | df | Sig. | Statistic | df | Sig. | ||
| P6 | 1 | 0.183 | 1752 | <0.001 | 0.906 | 1752 | <0.001 |
| 2 | 0.169 | 613 | <0.001 | 0.908 | 613 | <0.001 | |
| 3 | 0.172 | 136 | <0.001 | 0.917 | 136 | <0.001 | |
| 4 | 0.169 | 411 | <0.001 | 0.917 | 411 | <0.001 | |
| P38 | N | Average | Standard Desv. | % (6 to10) | % (7 to10) | % (8 to10) | % (9 to10) | % 10 |
|---|---|---|---|---|---|---|---|---|
| 1 | 1752 | 7.38 | 0.41 | 87.00 | 77.00 | 52.50 | 22.10 | 10.00 |
| 2 | 613 | 7.19 | 0.76 | 83.10 | 71.00 | 49.00 | 22.40 | 9.50 |
| 3 | 136 | 7.76 | 0.15 | 89.80 | 80.20 | 61.80 | 33.10 | 19.19 |
| 4 | 411 | 7.40 | 0.08 | 87.80 | 75.40 | 53.00 | 23.60 | 9.70 |
| Comparison P38 = 3 with P38 = 2 | ||||||
| Confidence Interval 95% | Value Forecast | |||||
| Degree of Happiness | Sig. | Exp(B) | Inferior | Superior | For P6 = 0 (specificity) | For 6 = 1 (sensibility) |
| Values between 8 and 10 | 0.007 | 1.686 | 0.406 | 0.868 | 85.80% | 21.90% |
| 53.00% | ||||||
| Comparison P38 = 3 with P38 = 1 | ||||||
| Values between 8 and10 | 0.039 | 1.458 | 0.479 | 0.982 | 0% | 100% |
| 53.2% | ||||||
| Comparison P38 = 3 with P38 = 4 | ||||||
| Values between 9 and 10 | 0.029 | 1.601 | 1.048 | 2.445 | 100% | 0% |
| 74% | ||||||
| Comparison P38 = 3 with P38≠3 | ||||||
| Values between 8 and 10 | 0.024 | 1.501 | 0.468 | 0.949 | 0% | 100% |
| 52.3% | ||||||
| Values between 9 and 10 | 0.004 | 1.712 | 0.404 | 0.844 | 100% | 0% |
| 77.1% | ||||||
| Value 10 | <0.001 | 2.160 | 0.297 | 0.723 | 100% | 0% |
| 89.7% | ||||||
| Category 3 | ||||||||
| P6 | P30 | P6 | P30 | Mann–Whitney | t-Student | |||
| P6 | Spearman | 1 | −0.143 | Pearson | 1 | −0.147 | p = 0.097 | p = 0.087 |
| Sig. (bilat.) | 0.097 | Sig. (bilat.) | 0.087 | Man mean (dev) 7.94 (0.171) | Woman mean (dev) 7.40 (0.277) | |||
| Category 4 | ||||||||
| P6 | Spearman | 1 | −0.103 * | Pearson | 1 | −0.106 * | p = 0.037 | p = 0.032 |
| Sig. (bilat.) | 0.037 | Sig. (bilat.) | 0.032 | 7.59 (0.115) | 7.23 (0.119) | |||
| Category 1 | ||||||||
| P6 | Spearman | 1 | −0.007 | Pearson | 1 | −0.017 | p = 0.078 | p = 0.483 |
| Sig. (bilat.) | 0.780 | Sig. (bilat.) | 0.483 | 7.41 (0.057) | 7.35 (0.059) | |||
| Category 2 | ||||||||
| P6 | Spearman | 1 | 0.080 * | Pearson | 1 | 0.071 | p = 0.047 | p = 0.080 |
| Sig. (bilat.) | 0.047 | Sig. (bilat.) | 0.080 | 7.05 (0.116) | 7.32 (0.101) | |||
| Category 3 | ||||||||
| P6 | P32a | P6 | P32a | Kruskal-Wallis | ANOVA | |||
| P6 | Spearman | 1 | −0.091 | Pearson | 1 | −0.042 | p = 0.399 | p = 0.563 |
| Sig. (bilat.) | 0.294 | Sig. (bilat.) | 0.629 | |||||
| Category 4 | ||||||||
| P6 | Spearman | 1 | 0.117 * | Pearson | 1 | 0.114 * | Kruskal-Wallis | ANOVA |
| Sig. (bilat.) | 0.017 | Sig. (bilat.) | 0.021 | p = 0.090 | p = 0.084 | |||
| Category 1 | ||||||||
| P6 | Spearman | 1 | 0.090 ** | Pearson | 1 | 0.089 ** | Kruskal-Wallis | ANOVA (Welch/ Brown-Forsythe) |
| Sig. (bilat.) | <0.001 | Sig. (bilat.) | <0.001 | p = <0.001 | p = (<0.001/<0.001) | |||
| Category 2 | ||||||||
| P6 | Spearman | 1 | 0.176 ** | Pearson | 1 | 0.173 ** | Kruskal-Wallis | ANOVA (Welch/ Brown-Forsythe) |
| Sig. (bilat.) | <0.001 | Sig. (bilat.) | <0.001 | p = <0.001 | p = (<0.001/<0.001) | |||
| Category 3 | ||||||||
| P6 | P41 | P6 | P41 | Kruskal–Wallis | ANOVA (Welch/Brown–Forsythe) | |||
| P6 | Spearman | 1 | 0.008 | Pearson | 1 | 0.036 | p = 0.971 | p = (0.810/0.667) |
| Sig. (bilat.) | 0.942 | Sig. (bilat.) | 0.739 | |||||
| Category 4 | ||||||||
| P6 | Spearman | 1 | 0.127 * | Pearson | 1 | 0.117 | Kruskal–Wallis | ANOVA (Welch/Brown–Forsythe) |
| Sig. (bilat.) | 0.039 | Sig. (bilat.) | 0.057 | p = 0.014 | p = (<0.001/0.008) | |||
| Category 1 | ||||||||
| P6 | Spearman | 1 | 0.035 | Pearson | 1 | 0.012 | Kruskal–Wallis | ANOVA (Welch/Brown–Forsythe) |
| Sig. (bilat.) | 0.220 | Sig. (bilat.) | 0.670 | p = <0.001 | p = (<0.001/< 0.001) | |||
| Category 2 | ||||||||
| P6 | Spearman | 1 | 0.144 ** | Pearson | 1 | 0.163 ** | Kruskal–Wallis | ANOVA (Welch/Brown–Forsythe) |
| Sig. (bilat.) | 0.001 | Sig. (bilat.) | <0.001 | p = 0.007 | p = (<0.001/<0.001) | |||
| Category 4 | ||||||
| Comparison P41 = 4 con P41 = 2 | ||||||
| Confidence Interval 95% | Value Forecast | |||||
| Degree of Happiness | Sig. | Exp(B) | Inferior | Superior | For P6 = 0 (specificity) | For 6 = 1 (sensibility) |
| Values between 7 and 10 | 0.003 | 6.452 | 0.044 | 0.540 | 0% | 100% |
| 70.60% | ||||||
| Values between 8 and 10 | <0.001 | 4.310 | 0.099 | 0.544 | 86.80% | 39.70% |
| 63.20% | ||||||
| Comparison P41 = 4 con P41 = 3 | ||||||
| Values between 8 and 10 | 0.024 | 2.421 | 0.192 | 0.890 | 0% | 100% |
| 56.20% | ||||||
| Comparison P41 = 4 con P41 = 1 | ||||||
| Values between 8 and 10 | 0.008 | 3.425 | 0.118 | 0.724 | 68.9% | 48.9% |
| 58.8% | ||||||
Publisher’s Note: MDPI stays neutral with regard to jurisdictional claims in published maps and institutional affiliations. |
© 2021 by the authors. Licensee MDPI, Basel, Switzerland. This article is an open access article distributed under the terms and conditions of the Creative Commons Attribution (CC BY) license (https://creativecommons.org/licenses/by/4.0/).
Share and Cite
Ravina-Ripoll, R.; Foncubierta-Rodríguez, M.-J.; Ahumada-Tello, E.; Tobar-Pesantez, L.B. Does Entrepreneurship Make You Happier? A Comparative Analysis between Entrepreneurs and Wage Earners. Sustainability 2021, 13, 9997. https://doi.org/10.3390/su13189997
Ravina-Ripoll R, Foncubierta-Rodríguez M-J, Ahumada-Tello E, Tobar-Pesantez LB. Does Entrepreneurship Make You Happier? A Comparative Analysis between Entrepreneurs and Wage Earners. Sustainability. 2021; 13(18):9997. https://doi.org/10.3390/su13189997
Chicago/Turabian StyleRavina-Ripoll, Rafael, María-José Foncubierta-Rodríguez, Eduardo Ahumada-Tello, and Luis Bayardo Tobar-Pesantez. 2021. "Does Entrepreneurship Make You Happier? A Comparative Analysis between Entrepreneurs and Wage Earners" Sustainability 13, no. 18: 9997. https://doi.org/10.3390/su13189997