Article

Integrating Ecosystem Service Values and Economic Benefits for Sustainable Land Use Management in Semi-Arid Regions in Northern China

1
Center for Human-Environment System Sustainability (CHESS), Beijing Normal University, Beijing 100875, China
2
State Key Laboratory of Earth Surface Progress and Resources Ecology, Beijing Normal University, Beijing 100875, China
3
School of Natural Sciences, Faculty of Geographical Science, Beijing Normal University, Beijing 100875, China
*
Author to whom correspondence should be addressed.
Sustainability 2021, 13(18), 10431; https://doi.org/10.3390/su131810431
Submission received: 8 August 2021 / Revised: 15 September 2021 / Accepted: 16 September 2021 / Published: 18 September 2021

Abstract

:
Studies on land use structural optimization can support the sustainability of land resources. The Taipusi Banner lies in the arid and semiarid area of northern China, with rapid economic development and a vulnerable ecological condition. Taking the Taipusi Banner as a research case, we adopted a land use map and statistical data, and employed the ecosystem process model to establish five scenarios, including an economically optimal scenario, an ecologically optimal scenario, a comprehensively optimal scenario, a status quo, and a projected scenario. Based on multi-objective linear programming, the land use demand was optimized; then, the CLUE-S model and adaptability evaluation were adopted to establish spatial patterns. The ecological and economic benefits were then analyzed and policy suggestions are provided. The main results include the following: (1) The optimization outputs of various scenarios show that under optimization, cropland and forestland increased by 9.13% and 18.9%, respectively, and grassland decreased by 9.81%. (2) The land use optimization shows that comprehensive optimization aimed at achieving comprehensive benefits, ecological benefits, and economic benefits increased these benefits by 3.89%, 2.1%, and 6.2%, respectively. Compared with other scenarios, focusing on the comprehensive benefits of land use can result in the greatest increase in benefits to improve sustainability land resources. Land use optimization must consider not only the optimization of both the quantity and configuration but also the dimensions of both ecology and the economy. Land use should be based on a land suitability evaluation and optimization of the land use spatial configuration to update ineffective land uses and should gradually adjust both the ecological and engineering measures.

1. Introduction

Land use and land cover is defined by an assemble of anthropogenic and natural factors, and, as an essential part of the terrestrial ecosystems and the place of human activities, it can provide abundant ecological services and economic profits [1,2]. With the acceleration of population growth and urbanization, both the quantity and quality of land are facing severe challenges [3,4]. First, in terms of the quantity of land use, intensive human activities have greatly increased the demand for land resources, but the supply of land resources is limited due to scarcity [5,6]. Second, regarding the quality of land use, human over-exploitation of land resources has led to land degradation [7,8,9].
Especially in the Agro-Pastural Transitional Zone of Northern China (APTZNC), the ecological condition is fragile and sensitive to human interactions [10,11]. China has vigorously promoted the Grain for Green Program, which is one of the ecological conservation projects that has benefited many people and has had the great investments [12,13]. It has intensely shaped landscape patterns in the APTZNC, especially for the cultivated land, forestland, and grassland. Therefore, the land use in the APTZNC reflects both the protection of local ecological security and a response to national policies; moreover, social land use behavior is mainly based on the principle of using economic maximization to make decisions. The inevitable trade-off between economic development and ecological protection has also deepened the human–land divide in the APTZNC, which has made the optimization of land use structures an important issue [14,15,16]. In the Taipusi banner, Deng et al. [17] employed CLUE-S (the Conversion of Land Use and its Effects at Small Regional Extent) and optimized various land use sectors both quantitatively and spatially, including the referring scenario, economic scenario, and ecological scenario.
The objective of the optimization is comprehensive sustainability in land use. This means a long-term balance between economic development, environmental protection, efficient resource use, and social equity [18]. The optimization of land use structures is based on optimal ecological and economic targets, as well as on a land suitability evaluation that synthesizes the natural conditions and socioeconomic factors to optimize land use types in both their quantity demands and spatial patterns [19,20,21].
The development of land use optimization can be summarized by several stages. First was the “empirical planning stage.” The earliest research on land use optimization began around the beginning of the 19th century with Germany’s location layout theory [22], Weber’s agricultural location theory [23], and Christaller’s central place theory [24]. Most of these theories used qualitative empirical planning methods to develop arrangements for the rational use of land but did not involve true optimization methods and means, thus they remained only theoretical explorations. The second stage was “the initial stage of substantive planning”. With the continuous development of the social economy and in productivity, changes in the structure of land use had become intense and the spatial layout of land use had also become more complicated. After the 1970s, the United Nations Food and Agriculture Organization (FAO) systematically compiled the “Land Evaluation Outline” [25]. Countries around the world have used this outline as a basis to evaluate land quality [26,27]. As a result, land resource allocation and optimization research had also entered the stage of substantive applications. The third stage was the “single target planning stage”. This stage focused more on land use optimization with a single objective function. Under certain socio-economic constraints, linear programming was used to find the optimal solution [28]. The single-objective optimization model only sought to maximize economic benefits but land use optimization needed to consider multiple objectives, such as both economic development and ecological protection [29,30,31]. The fourth stage was the “multi-objective optimization stage”. Multi-scale, multi-objective, and multi-scenario land use optimization research gradually emerged in this stage [32]. At the county level, Tang et al. [33] estimated the allocation efficiency from the perspective of sustainable development to optimize the allocation between agricultural and non-agricultural land. At the country level, Jiang et al. [16] optimized China’s six land types by adopting the integrated socioeconomic and ecological model. In addition, advanced methods have been continuously promoted and applied, including gray linear analysis [34], the genetic algorithm [35], and the multi-agent system [36]. Based on the system dynamics model, considering both the complexity of macro driving factors and the complexity of micro pattern evolution of the land use system, He et al. [37] simulated the scenarios of land use change in 13 provinces in northern China in future scenarios. In summary, the development direction of land use optimization was shifting from a single economic goal to the coordinated optimization of multiple goals related to ecology and the economy, from the optimization of land quantity to the rational optimization of the entire spatial pattern, as well as from the optimization of built-up land to an optimization process for multiple land use types. In our study, we optimize land use under multiple goals with multiple land use types and optimize both the quantity and the spatial patterns.
Most previous studies have qualitatively described the characteristics of the scenarios of land use optimization. However, it remains necessary to explore how to quantitatively evaluate the effects of land use planning programs, as the evaluation of land use benefits can be a powerful tool. The evaluation of land use benefits mainly includes the evaluation of ecological benefits, economic benefits, and comprehensive benefits (integrated ecological and economic benefits) [38,39,40]. Although there are many studies on individual evaluations, there are few studies that simultaneously consider all three benefits. First, the evaluation of ecological benefits mainly focuses on the evaluation of ecosystem services, with an increasing number of studies on the evaluation methods for biodiversity and ecosystem services [41,42,43,44,45,46], which are represented by the evaluation of global ecosystem assets such as Costanza [47,48,49]. In China, Xie et al. [50] and others used Costanza’s accounting theory and the Delphi method to propose formulas and coefficients for the value of ecosystem services. Yang et al. [51] studied the increase of ecological benefits after returning farmland to forestland by using the ecological analytic hierarchy process and considering five ecosystem functions. In addition, the widely-adopted interface-friendly InVest (Integrated Valuation of Ecosystem Services and Trade-offs) provides multiple ecosystem service evaluation modules that can systematically and spatially evaluate ecosystem services [52]. Second, the evaluation of economic benefits originated with the theory of land rent and land prices [53]. In the 1930s, the German government tried for the first time to evaluate the economic benefits of agricultural arable land; after that, different scholars performed related research on the classification methods for the economic benefits of land use. Most of the research in China focused on the economic benefits in the development and use of built-up areas [54]. Different evaluation index systems for the economic benefits of land use have been established and the evaluation methods tend to be varied. The most commonly used evaluation methods include the Delphi method, the analytic hierarchy process, and the entropy method [55]. Third, only assessing the benefits of one aspect of land use does not necessarily fully reflect the actual situation of land use. The ecological and economic benefits of land use must be considered to not only meet the needs of national production and life, but to also ensure that the ecological system is dynamically stable [56]. Gong et al. [57] took the structure and layout of land resources within the industrial sector of the national economy as a research object, established multi-objective optimization models such as for ecological and natural benefits, and discussed how to optimize the allocation of urban land use quantity. Research on the comprehensive benefits of land is usually carried out by establishing different evaluation index systems [58]. Therefore, research on the benefits of land use, especially research on the economic benefits and comprehensive benefits of land use, is more focused on establishing evaluation index systems and methods for determining the index weight. At the regional scale, there are more evaluations on the benefits of the urban environment in economically developed areas, with fewer evaluations on economically underdeveloped areas (e.g., APTZNC) and other land types.
The aim of this research study is to optimize the quantitative structures and spatial patterns of land use by exploring the response relationships between social policies, land use changes, and the ecological and economic benefits of land use using methods such as linear programming and multi-objective optimization. The following questions motivated our research: (1) How can the amount of land use be distributed among different land use sectors to achieve the optimal economic, ecological, or comprehensive benefits? What are the characteristics of the corresponding spatial patterns? (2) What are the differences in the economic, ecological, or comprehensive benefits under different optimization scenarios? Which scenario will help promote the regional sustainability and rational utilization of land resources? In our research, we provide a basis for formulating reasonable and long-term land use policies and food security policies, and also provide a reference for the sustainable use of land resources in this region.

2. Materials and Methods
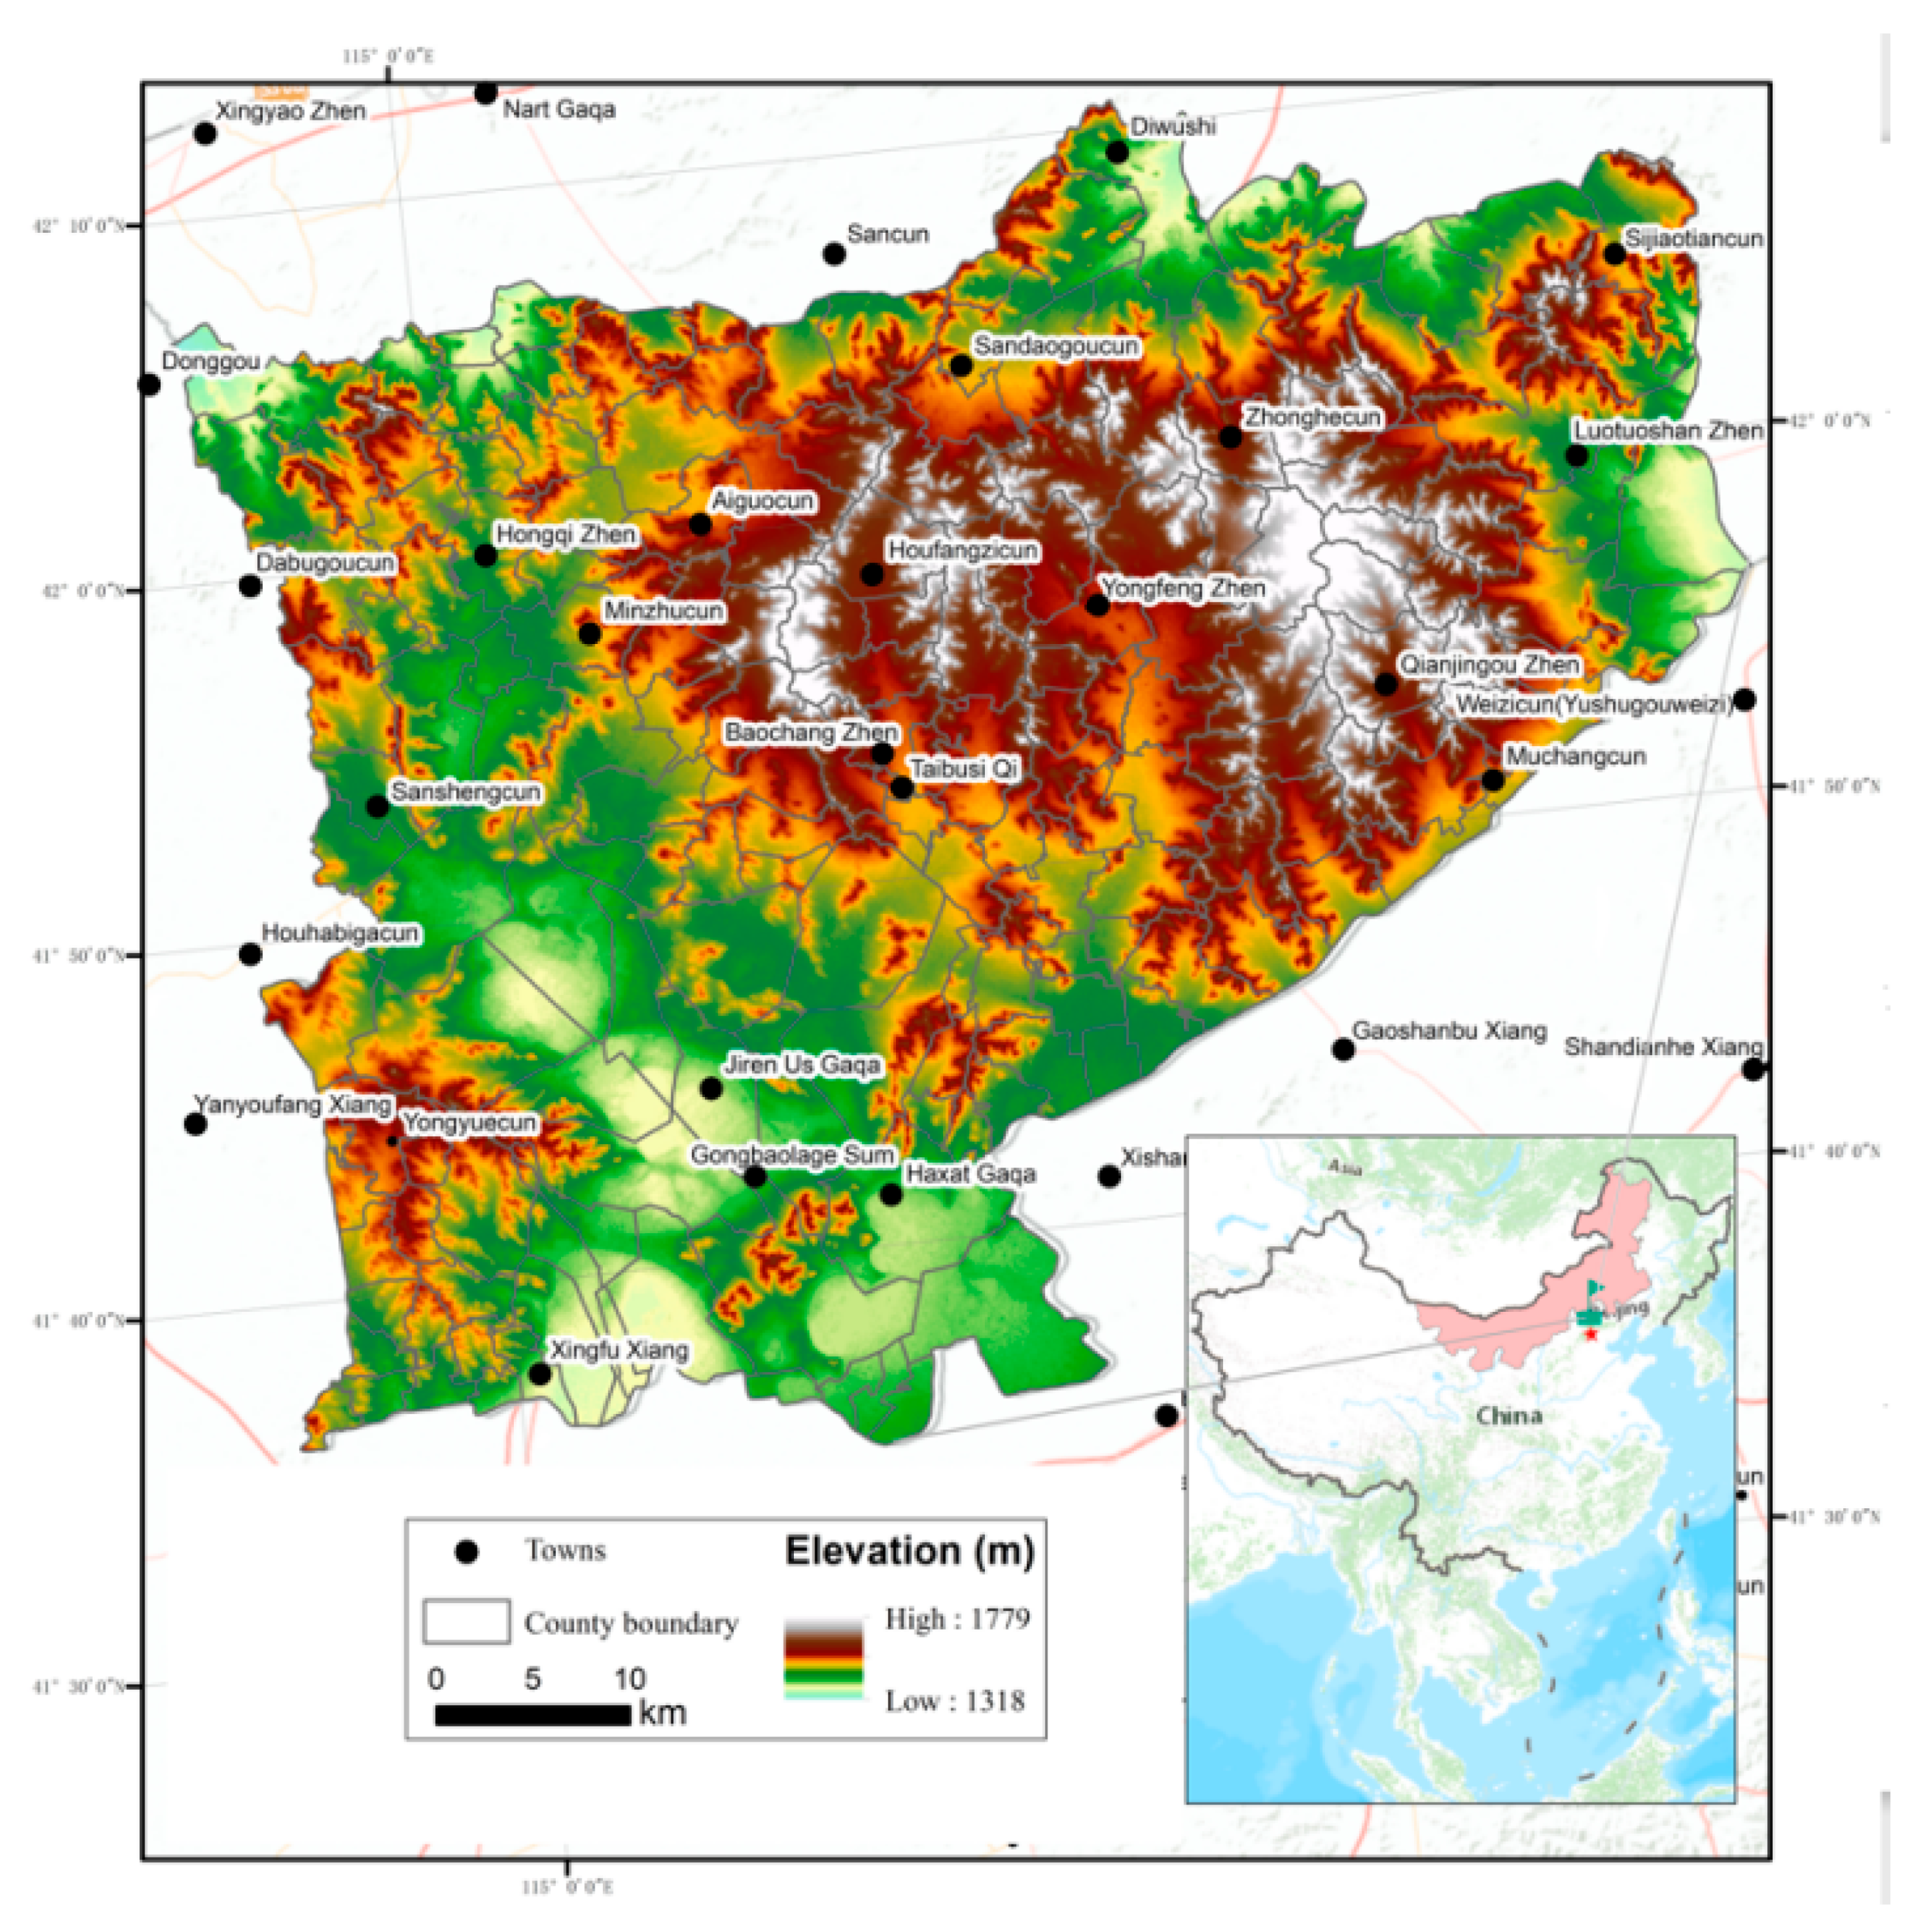
2.1. Study Area

The Taipusi Banner is located in the central Inner Mongolia in southwest Xilin Gol League from 114°51′ E to 115°49′ E and from 41°35′ N to 42°10′ N (Figure 1). The entire area is located in the eastern part of the Yinshan Mountain and is adjacent to Hebei Province in the southeast and west. The study area is 85 km long and 65.5 km wide [59]. Since 2006, four towns, one county, and 175 villages have been established in the study area, with a total area of 3476 km2. This area is a typical farming and pastoral transition zone, whose ecological environment is very fragile and features specific environmentally sensitive areas [60]. The region is in a semi-arid continental climate zone. Years of meteorological data (1971–2015) show that the annual average temperature in the Taipusi Banner is 2.2 °C, but during the growing season, the average monthly temperature climbs above 15 °C. The annual precipitation is about 350–430 mm, with more rain falling in June, July, and August; the total rainfall in these months amounts to 64.86% of the annual precipitation. In addition to the hilly landscape, the region contains some high valleys, basins, and a river valley region. The elevation within the region is relatively low and the slope is gentle; the altitude is between 1256 m and 1785 m. Taipusi County is one of the ecologically vulnerable areas in north China. In order to improve ecosystem functions, ecosystem services, and the overall well-being of humans, a set of ecological conversation projects have been implemented here, which brought new opportunities for land use sustainability.

2.2. Data Sources

This research study included land use data, natural background data (climate, topography, and soil), and socioeconomic data. The land use data from 2008 were provided by the Bureau of Land Resources, with a resolution of 2.5 m by 2.5 m, including cropland, grassland, forestland (forest and shrub), and other land uses (built-up, water body, and bare land). The proportion of the three land use types is small. In particular, our study actually assumed frozen (unchanged) built-up and water bodies to represent land use dynamics. The natural background data were derived from the spatial distribution map of soil that was released by the Institute of Geography, Chinese Academy of Sciences, in 1995, as well as from field research. The socioeconomic data were derived from the statistics yearbook provided by the Taipusi Bureau of Statistics. The data were pre-processed using ArcGIS and counted using Excel.

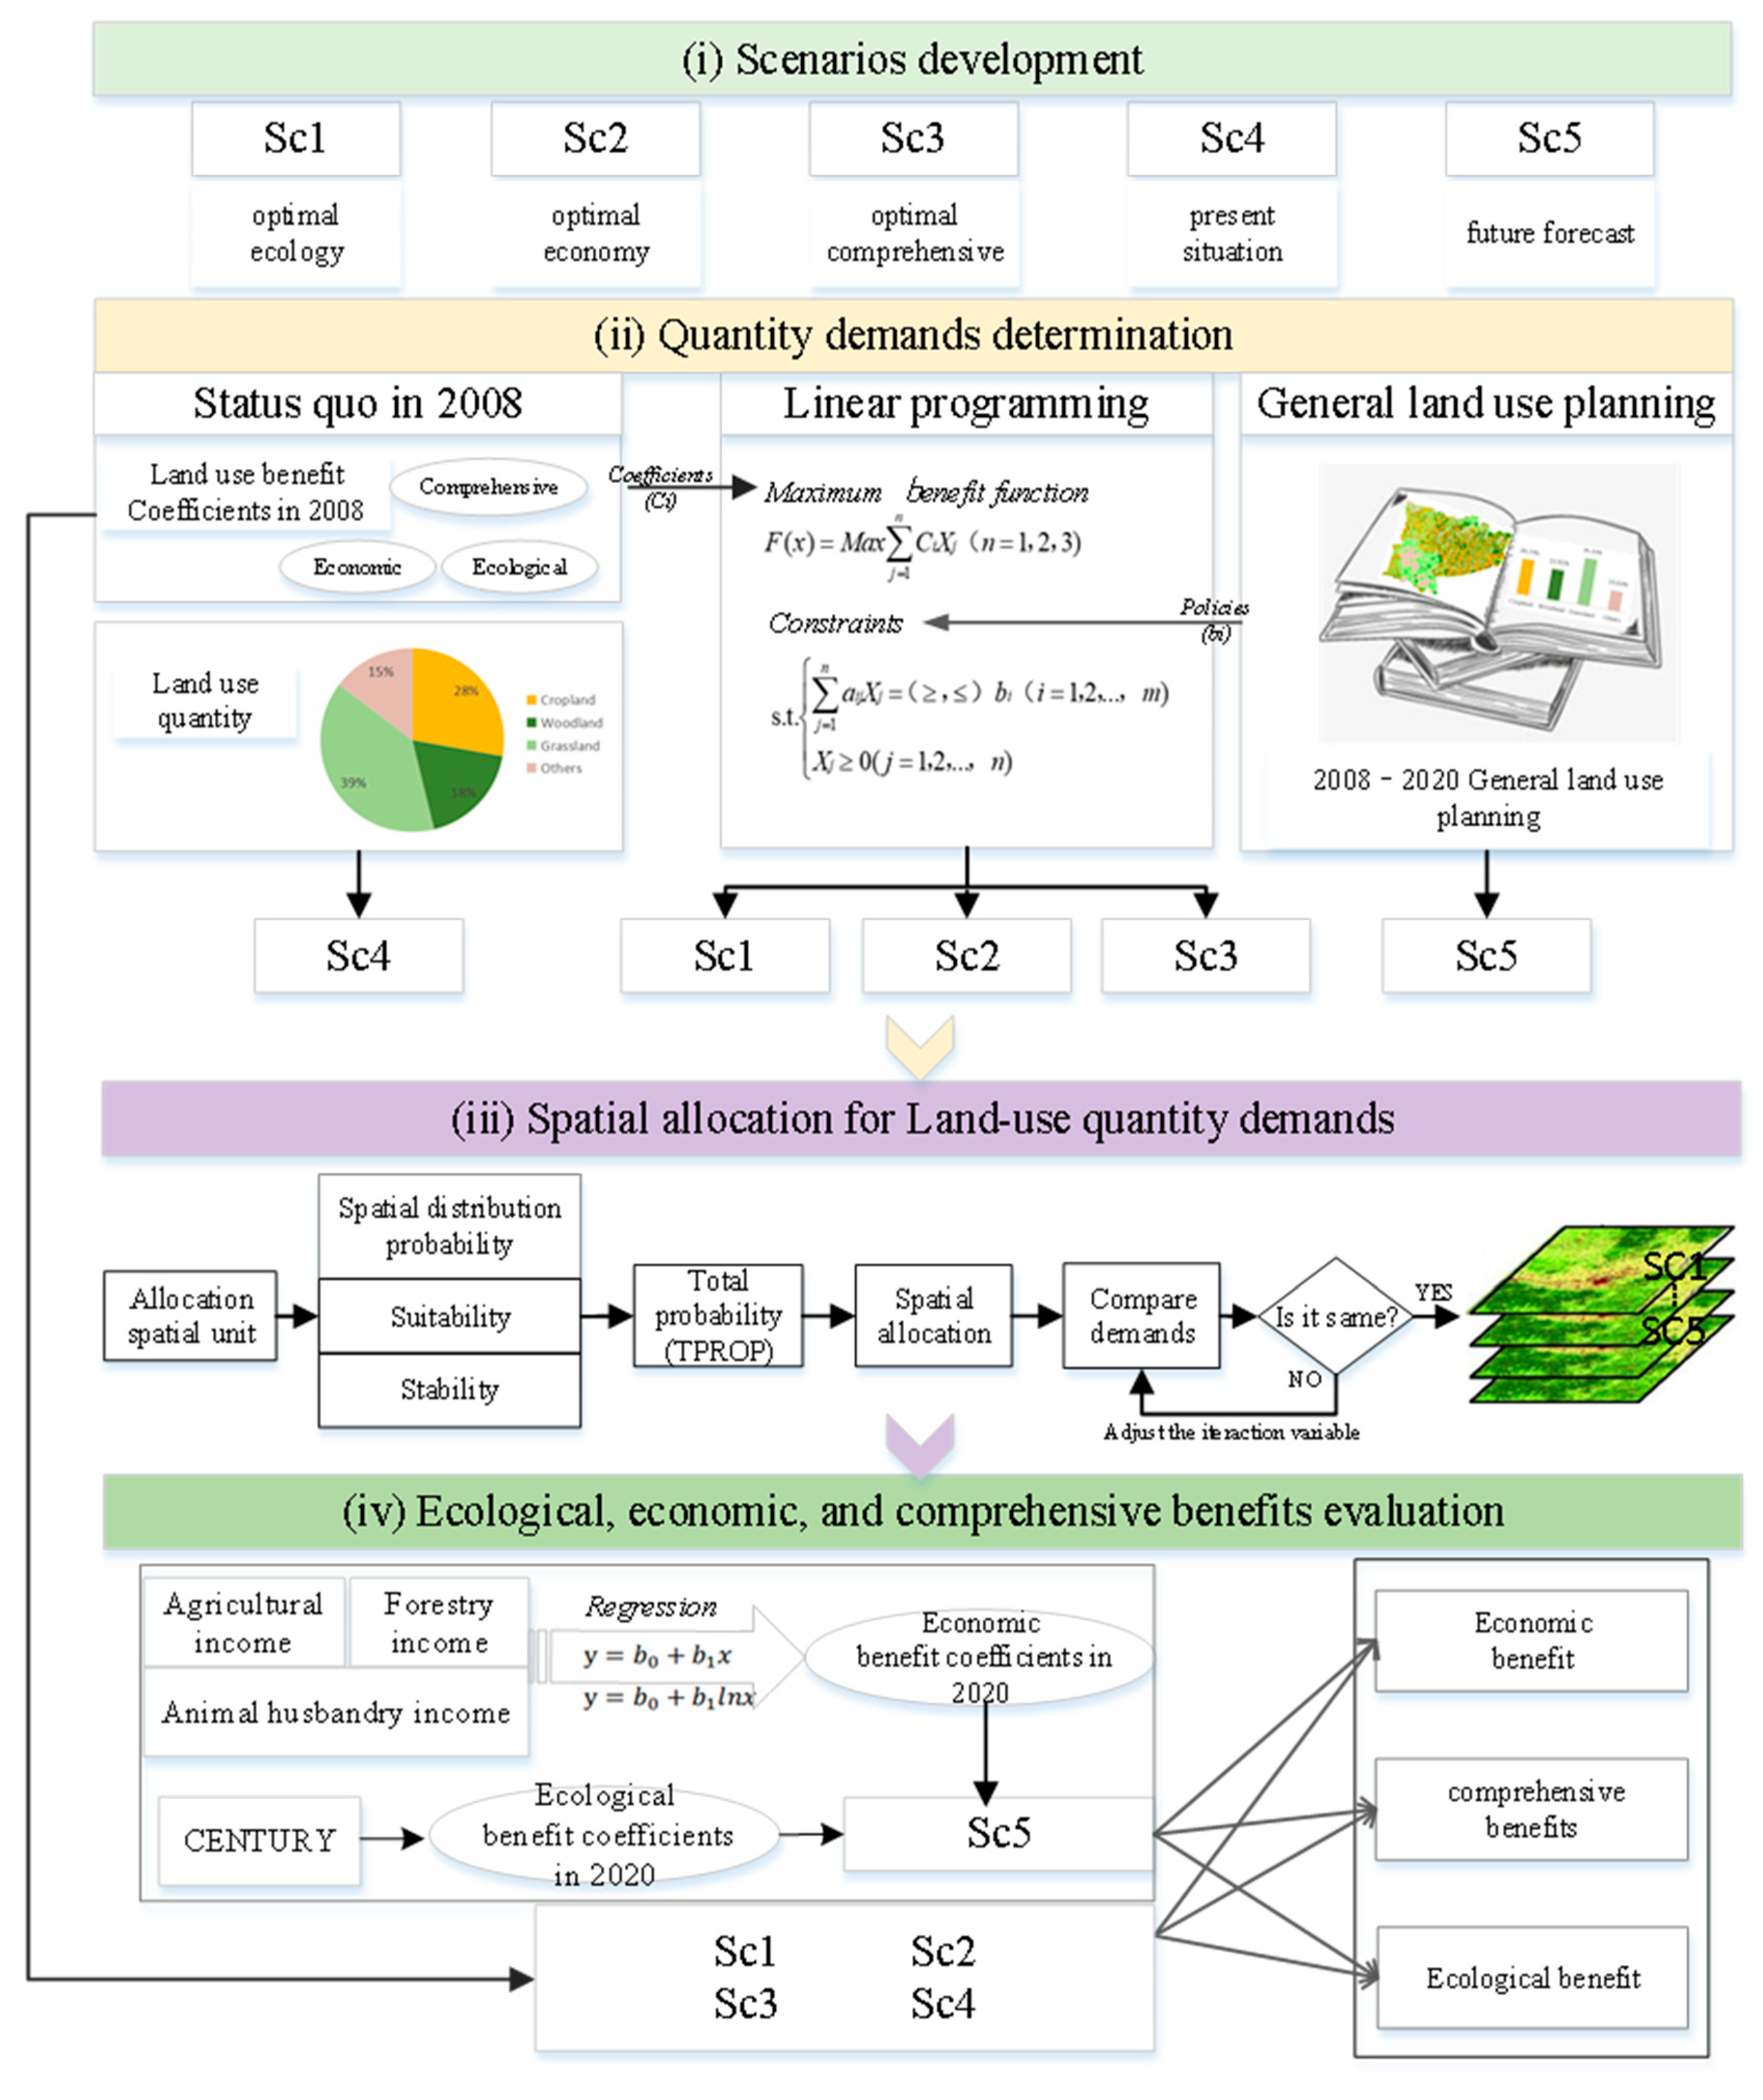
2.3. Optimization of the Land Use Pattern

As the basic unit of administrative management, the village is spatially responsible for improving the status quo of agriculture and rural areas, as well as for undertaking important functions such as higher planning requirements. Rural land use not only faces practical problems, such as the fragmentation of rural arable land, disordered spatial layouts, inefficient use of land resources, and degradation of ecological quality, but also the high-level deployment of comprehensive land consolidation and ecological civilization construction throughout the whole region. The implementation of rural revitalization is also of note. In order to quantify the complex influence and constraint of economy and ecology factors to land use changes, the analysis methods in our research focused on the multiple land use sector, multiple perspectives of economy and ecology, and multiple indices. The optimization of the land use pattern in the whole region under the five scenarios can be divided into the following four steps (Figure 2): (i) Under the status quo and upper-level planning, five development scenarios are developed in this stage, including an economically optimal scenario, an ecologically optimal scenario, a comprehensive scenario, the status quo, and the projected scenario (for details, see Section 2.3.1). (ii) The next step involved identifying the quantity demands of the land use under different scenarios (Figure 2(i)). A Linear programming model was adopted in this stage to optimize land use quantity demands. First, we evaluated the present beneficial coefficients of land use, including the economic benefits, ecological benefits, and comprehensive benefits. The present land use benefit coefficients are shown in Table 1. The present benefits were adopted to construct a maximum benefit function that constraints the multi-objective land use quantity optimization model (Equation (1) in Section 2.3.2). Second, a series of constrains were set based on relevant regional development plans to provide constraints for the maximum benefit function (Equation (2) in Section 2.3.2). Then, the optimized land use quantity demands could be identified. (iii) The third step involved the spatial allocation for land use quantity demands (Figure 2(iii)). The spatial patterns of land use under the proposed scenarios were obtained through the spatial optimization model of land use (Equation (3) in Section 2.3.3). (iv) After obtaining the land use patterns under different scenarios, various land use benefits could be determined based on the benefit coefficients (Figure 2(iii), Equations (4)–(9) in Section 2.4).

2.3.1. Scenario Development

In this study, we established five scenarios to optimize the structure of land use, including an ecological optimization scenario (Sc1), an economic optimization scenario (Sc2), a comprehensive optimal scenario (Sc3), the status quo (Sc4), and a projected scenario (Sc5).
For the ecologically optimal scenario (Sc1), all kinds of land use types must interact with the ecological environment. When fully considering the economic benefits of land use, the ecological benefits cannot be ignored. Therefore, the first goal is to maximize the ecological benefits. In this study, the optimal goal of ecological benefits is mainly achieved by setting the amount of cultivated land and increasing the proportion of forest and grassland.
The economically optimal scenario (Sc2) involves making limited land produce with as many products and services as possible. This is always the main goal of land use; thus, the second goal is an economic benefit goal. From the perspective of economic benefits, the outputs of various types of land are required to be as large as possible to maximize the total social benefits.
Under the comprehensively optimal scenario (Sc3), the single pursuit of ecological or economic benefits cannot achieve the sustainable use of land resources. Ecological and economic benefits must be considered comprehensively so that land use can ensure ecological safety and maximize economic output. Therefore, this scenario establishes a comprehensive optimal situation that maximizes the comprehensive benefits of land use.
The status quo (Sc4) is based on data from the land use map. This serves as a comparison scenario with the other four scenarios.
The projected scenario (Sc5) is based on data from the land use project in 2020 from the 2008–2020 general land use planning document provided by the league Bureau of Land Resources in Taipusi.

2.3.2. Optimization of the Land Use Quantity Demands

Optimization of the land use demand is a prerequisite for optimization allocation and the aim of this process is to optimize the land use quantity demands under the ecologically optimal scenario (Sc1), economically optimal scenario (Sc2), and comprehensively optimal scenario (Sc3).
Linear programming model Equations (1) and (2) are adopted to optimize the land use demands:
F ( x ) = M a x ( i = 1 n C j , k X j , k ) ( n = 3 ; j = 1 , 2 , 3 ; k = 1 , 2 , 3 )
C o n { j = 1 n a i , j X j ( , ) b j   ( i = 1 , 2 , , 5 ) X j 0
where F(x) is the maximum benefit function; n is the total number of land use types; and n = 3; j represents the jth land use type, where j = 1 = cropland, j = 2 = forestland and j = 3 = grassland. In addition, Cj,k denotes the benefit coefficient of the jth land use type under the kth scenario, where k represents one of the three scenarios: k = 1 = ecologically optimal scenario (Sc1), k = 2 = economically optimal scenario (Sc2), and k = 3 = comprehensively optimal scenario (Sc3) (Table 1). Xj,k corresponds to the optimized quantity demand of the jth land use type, which is the parameter to be solved by linear programming model Equations (1) and (2). In Equation (2), Con is a bundle of constraints derived from policies, module rules (e.g., the area of each land use type is not less than 0), and the study area’s characteristics (e.g., the sum of the area of all land use types is equal to the area of the study area). The constraints are shared by the three scenarios (i.e., Sc1, Sc2, and Sc3). ai,j is the coefficient that corresponds to the jth land use type in the ith constraint factor and bi is the constant value of the ith constraint factor. The constraint conditions for Equation (2) are listed in Table 2.

2.3.3. Spatial Allocation for Land Use Quantity Demands

According to the land use model of structural optimization, the demand of all land use types of each scenario is calculated and the CLUE-S [61] model is used to allocate the space for possible land use types on a county scale. The spatial allocation simulation of land use changes mainly synthesizes the results of the land demand forecasting and land suitability evaluations. This research was based on the theoretical framework of the CLUE-S model [62,63] considering the limitations of biophysical factors on a certain land use type at the local scale (Table S1).
The total suitability values of land use types can be calculated by the following formula [64,65,66,67]:
T S V i = P i + S i + E i + I T E R i
where TSVi is the total suitability values distributed over the ith unit; Pi is the probability values distributed over the i unit by the binary regression model; Si is the suitability index value distributed over the i unit by the fuzzy membership function; Ei is the stability index according to the transition matrix among the land use types; and ITERi represents the iterative parameters. The initial value of ITERi was 0. After the first allocation, if the specific land area was greater than the demand, ITERi was supposed to be reduced and vice versa.

2.4. Ecological, Economic, and Comprehensive Benefit Evaluations

After optimizing the landscape patterns, the ecological, economic, and comprehensive benefit evaluations can be carried out to analyze the differences in land use benefits under the five scenarios. For Sc1, Sc2, and Sc3, the present benefit coefficients (in Table 1 and the detailed evaluation processes are provided in the Supplementary Materials in Section S3) were adopted to identify the land use benefits. For the status quo, Sc4 also adopted the present benefit coefficients (Table 1). However, under the planning scenario (Sc5), this research adopted the tendency analysis method to construct a unitary regression model of the historical gross income and time to obtain the economic benefit coefficients for 2020 (Equations (6) and (7)). At the same time, based on the century model and the land use data, the ecological benefits were simulated for Sc5 and then we obtained the ecological benefit coefficients.

2.4.1. Ecological Benefit Evaluation

The evaluation of ES was increasingly triggered considering that when making decisions, the benefits provided by the natural ecosystems were often underestimated and the ecosystem service value was conducive to the addition of different services so as to determine the overall services of concern. According to the Costanza classification system, referring to the method used by Wang Ailing to research the measurements of ecological properties [66] and considering the status quo of the study area, we classified the ecosystem services into five assessment indices: organic material production, the regulation of carbon dioxide and oxygen, nutrient cycling in the ecosystem, water conservation, and soil conservation (the detailed illustration about these concepts is provided in the Supplementary Materials in Section S4). Referring to the simulation data used by Li [67] in the CENTURY model to simulate the value of the net primary product and soil organic carbon, we calculated the ecological benefits of land use for Sc1, Sc2, Sc3, and Sc4 in 2008, and for Sc5 in 2020, including primary production, climate regulation, nutrient cycling, water conservation, and soil erosion, by employing the method outlined by Jiang et al. to develop the ecosystem assessments [68].
The formula to compute the total ecological benefits of land use in a certain area is as follows:
V 1 = j = 1 n R j × X j   ( n = 3 )
where V1 represents the ecological benefits of land use, Xj corresponds to the variables of three land use types, and j is equal to the cropland, forestland, or grassland. Rj corresponds to the unit area of the ecological benefits for the jth land use types.

2.4.2. Economic Benefit Evaluation

Existing economic benefit assessments of land use were used to calculate the economic benefits. We adopted the analytic hierarchy process and entropy evaluation [69,70], combined with an assessment indicator system, to account for the economic benefits on a regional scale [54]. The formula used to compute the total economic benefits of land use in a certain area is as follows:
V 2 = j = 1 n C j × X j   ( n = 3 )
where V2 is the economic benefits of land use, Xj corresponds to the variables of the three land use types, and j is equal to the cropland, forestland, or grassland. Cj corresponds to the unit area of the economic benefits of land use types. Thus, we defined the economic coefficient from different years with different land use types to determine the direction of production per unit of land area according to socioeconomic statistical data; the economic coefficient equals the corresponding area divided by the total income of the industry (Table 2). This is the economic product value per unit of land area for each land use type (unit: CNY/ha).
We referred to the map provided by the Bureau of Statistics and Bureau of Land Resources, divided by the administrative regions of the county, to predict various economic indicators in 2020 (Sc5). This research employed a regression model, such as the linear model and the logarithmic model, as follows:
C = b 0 + b 1 x
C = b 0 + b 1 l n x
where, using the county as a unit, the benefit of the average area is C and x is time series. When determining the regression curves, empirical observation was initially applied and the fitting formulations, a linear simulation, and logarithmic simulation were identified. Then, using the MATLAB software, we performed the simulations and compared the two R square values of the simulations to determine the most suitable model for each village. The model was then used with the original data to calculate the total farm income, forestry income, and animal husbandry income of each village. The data collected from Bureau of Land Resources in Taipusi was used to provide the trend that was used to predict the economic indices in Sc5. The R square values of the regression coefficient of determination were 0.8025 and 0.8712 in the simulation between agricultural income, animal husbandry, and year, indicating a good relationship between income and time in the Banner scale (Figure S1).

2.4.3. Comprehensive Benefit Evaluation

The comprehensive benefits of land use are equal to the weighted ecological benefits plus the weighted economic benefits; the weight coefficients were determined [50,71] according to the specific aim of this research study (Table 2). The formula to compute the total comprehensive benefits of land use in a certain area is as follows:
V = V 1 ×   W 1 + V 2 ×   W 2
V = W 1   ×   j = 1 n R j ×   X j + W 2 ×   j = 1 n C j ×   X j   ( n = 3 )  
where V is the comprehensive benefits; V1 and V2 are the ecological benefits and economic benefits of land use; and W1 and W2 are the weight coefficients of the ecological and economic benefits. When W1 equals 0, the weight of the ecological benefits is 0 and the goal of land use is to maximize the economic benefits. When W2 equals 0, the weight of the economic benefits is 0 and the goal of land use is to maximize the ecological benefits. When W1 and W2 are both 0.5, the ecological and economic benefits are equally important land use goals (Table 2). The benefit coefficient was used to synthesize the amount of cropland, forestland, and grassland in Taipusi in 2008, which allowed us to calculate the comprehensive benefit of land use as CNY 51,922 million.

3. Results

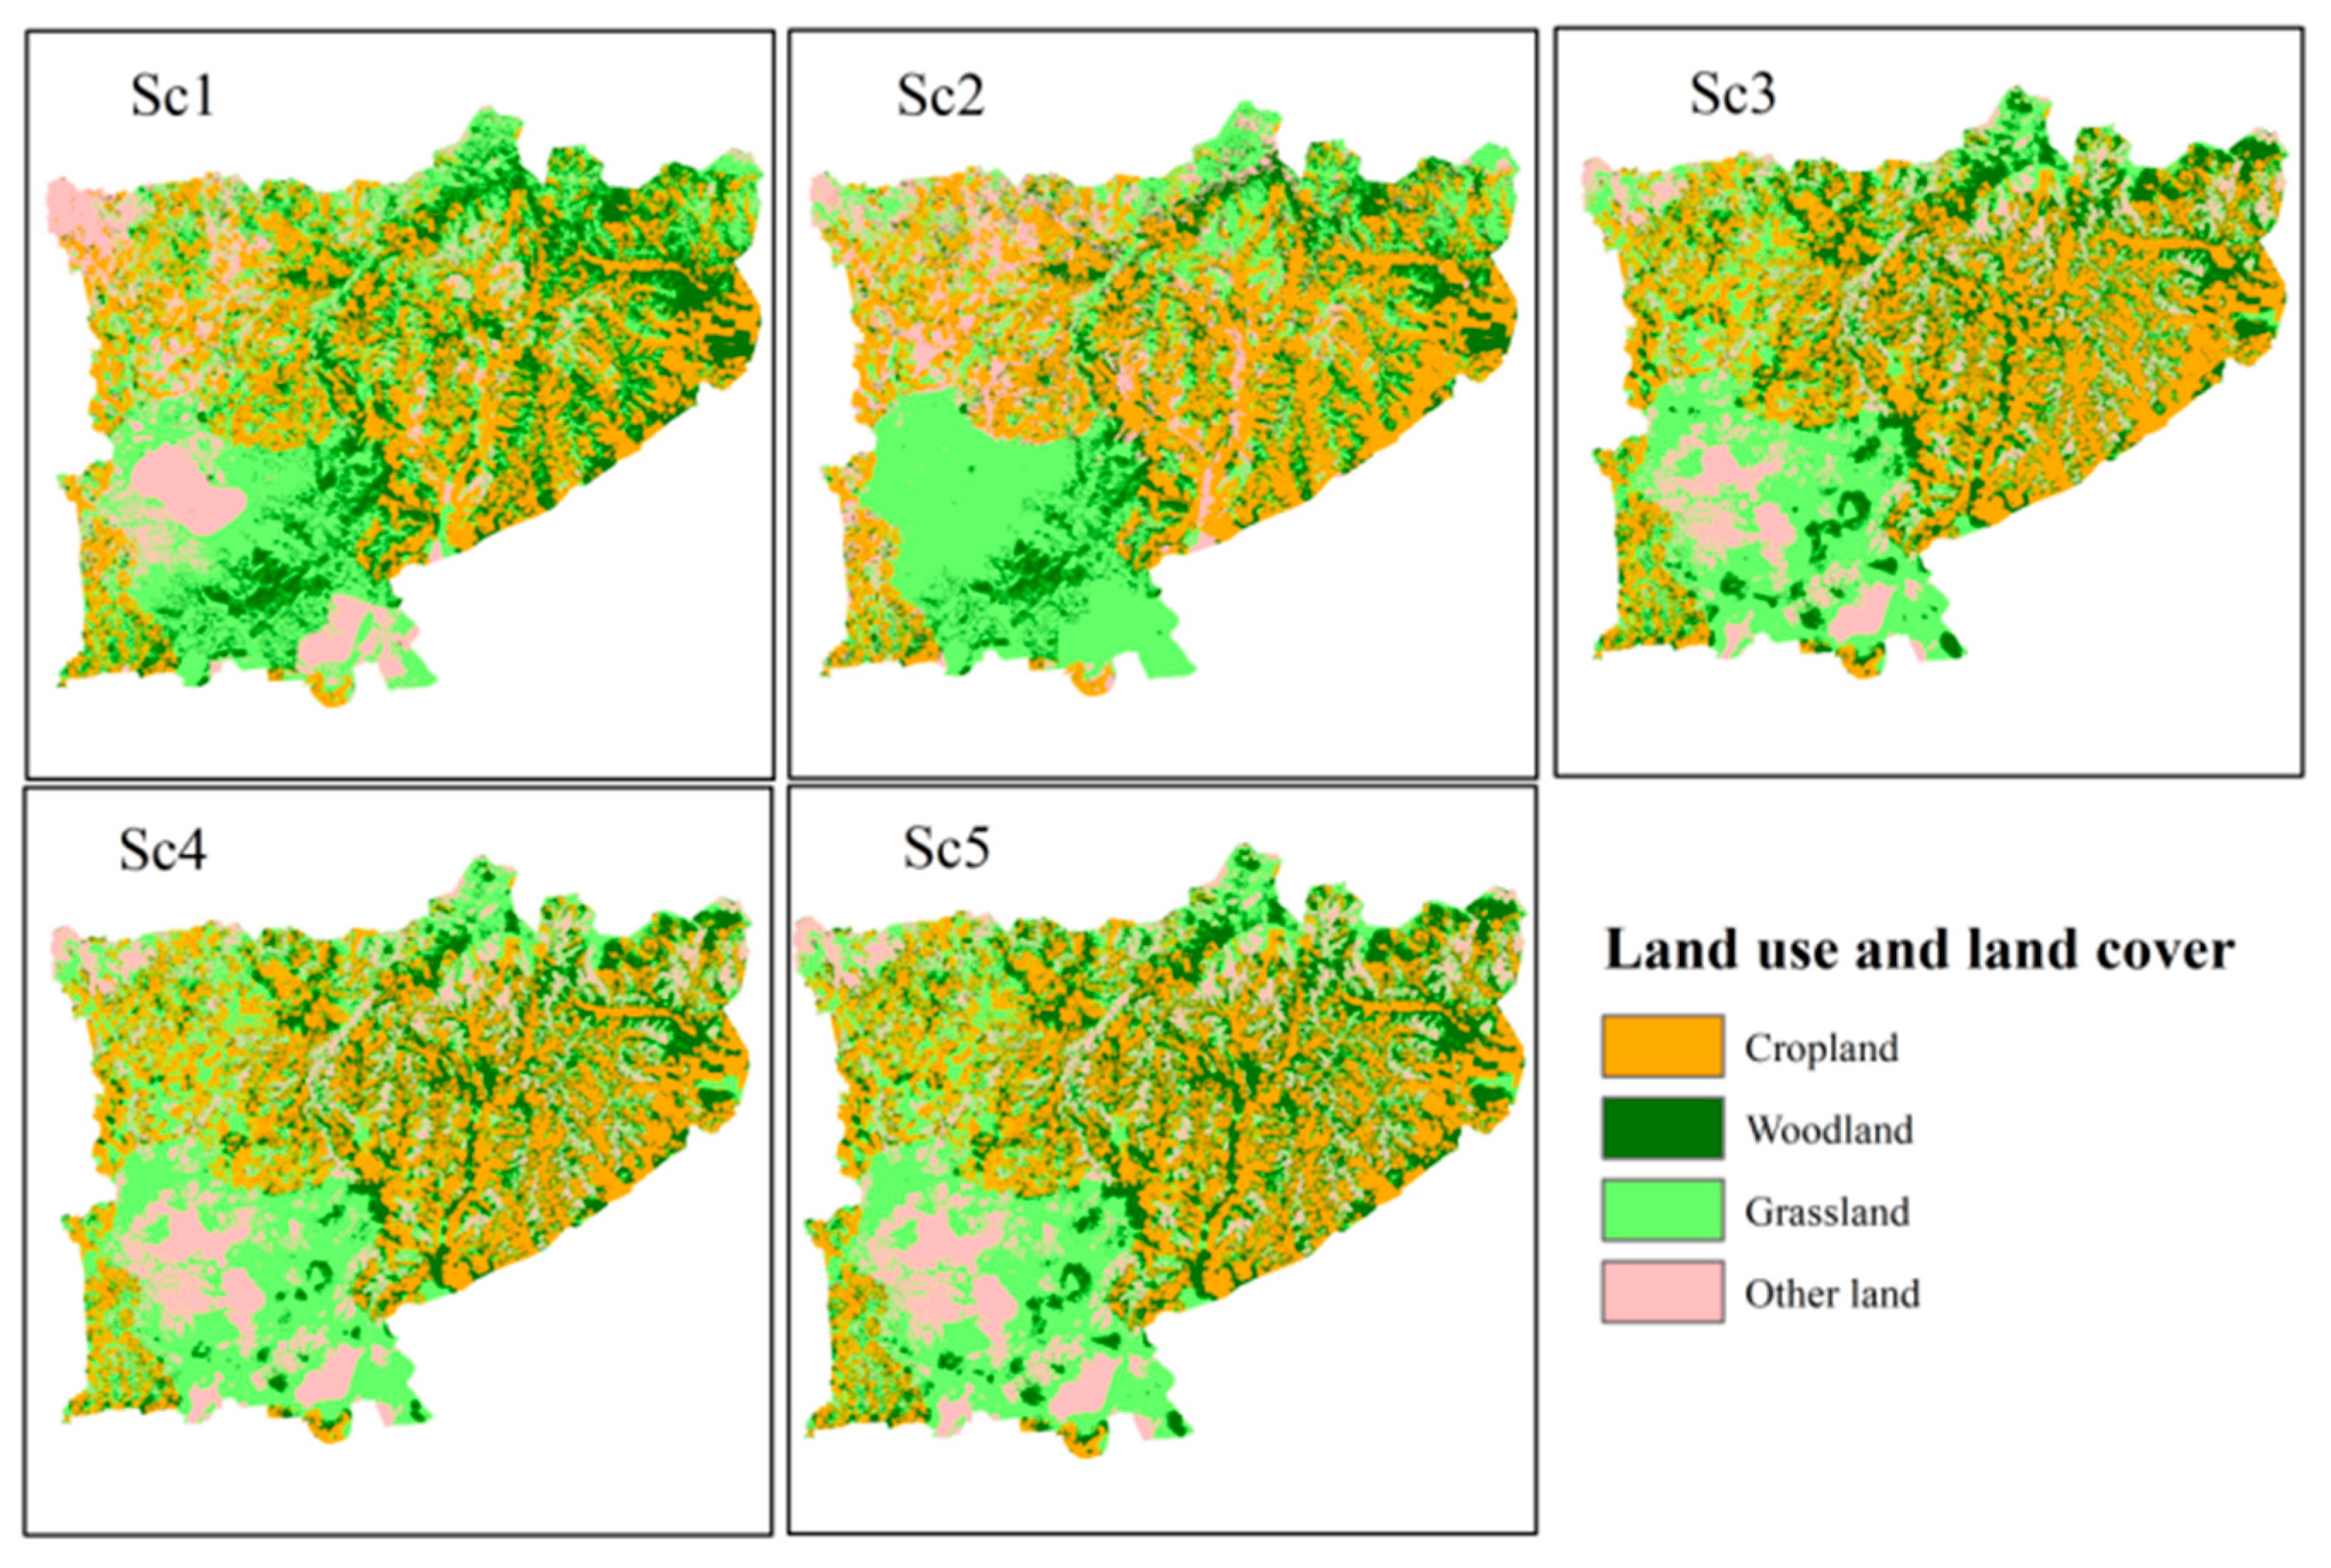
3.1. The Optimization Results of Land Use

Environmentally oriented scenarios (i.e., ecologically optimal scenario) experienced the conservation of forest and grassland, while economically oriented scenarios (i.e., economically optimal scenario) were characterized by a significant loss of natural land covers and expansion of agricultural land uses. In detail, three scenarios—the comprehensively optimal scenario, the ecologically optimal scenario, and the projected scenario—had a higher proportion of forestland, with more than 20%. Two scenarios—the economically optimal scenario and the comprehensively optimal scenario—featured higher proportions of cropland, with over 30%. Among the five scenarios, the proportion of grassland was largest for more than 35% of all land use types (Table 3). The relationship between the optimization goal and the proportion of land use for all kinds of land shows that forestland had the greatest effect on ecological benefits; cropland had a significant effect on economic benefits; and grassland had a medium effect on comprehensive benefits. Therefore, compared to the status quo, the proportion of cropland and forestland under the comprehensively optimal scenario increased by 2.5% and 3.5%, respectively, while other land uses (only bare land) decreased by 2.2%.
The land use spatial pattern (Figure 3) shows that under the ecologically optimal scenario, the distribution of forestland was more concentrated; the distribution of cropland was concentrated in the eastern and northeastern region; and the grassland was mainly concentrated in the southeastern area. The land use spatial pattern in other regions was similar to that in the status quo. Cropland and forestland were more widely distributed in the northeastern area under the comprehensively optimal scenario than in the status quo and the spatial pattern showed little difference in other regions. Since the implication of the actual policies, cropland would decrease and forestland would increase in Baochang County in the projected scenario. However, the reduction of cultivated land area was controlled at a reasonable level and there was no large-scale reduction, which ensured food security. This is the same as the status quo in the northeastern counties.

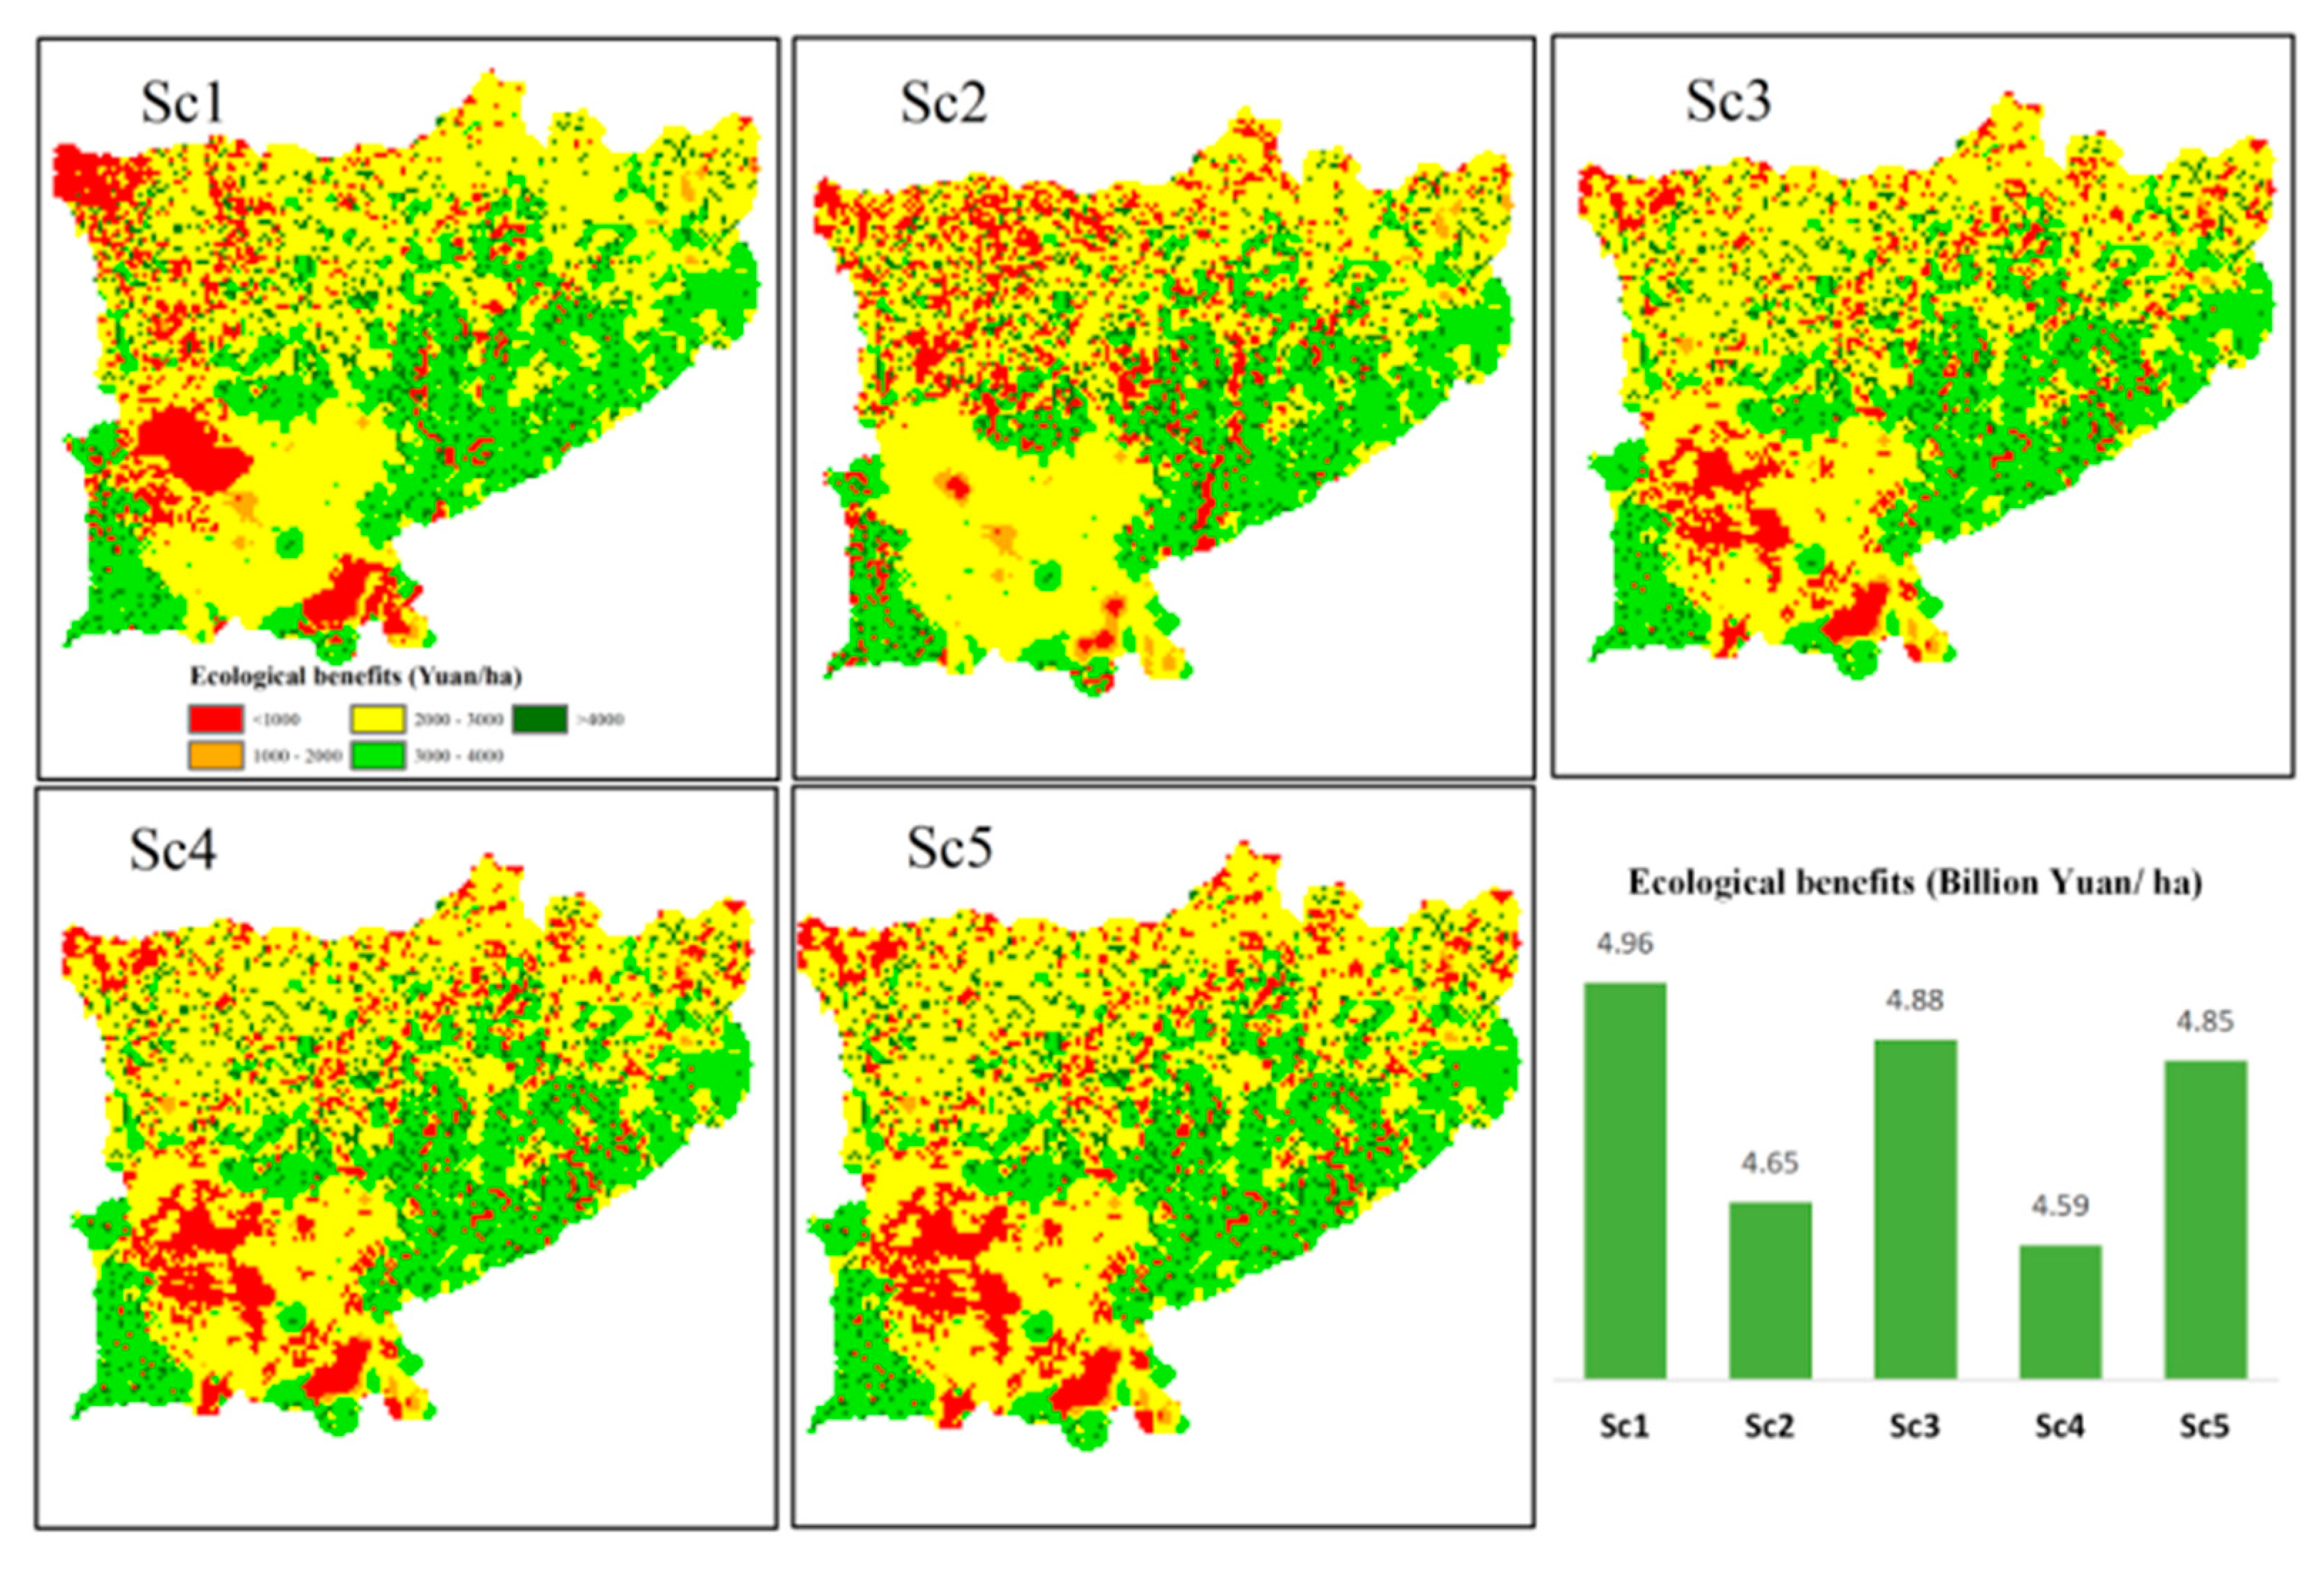
3.2. The Ecological Benefits and Spatial Patterns under the Five Scenarios

As can be seen from the ecological benefits (Figure 4), under the ecologically optimal scenario, the ecological benefits were the greatest, while in the status quo, the ecological benefits were the smallest, with a difference of 7.9%. This was consistent with the goal of optimization, indicating much room for optimization in the status quo. The ecological benefits in the comprehensively optimal scenario did not differ significantly from the projected scenario. The variation between the two was less than 2.5%, which means that the overall planning of land use meets the target of maximized ecological benefits. Under the economically optimal scenario, the ecological benefits were lower and only 1.3% higher than those in the status quo, which shows that a single goal cannot meet the requirements for the sustainable development of land resources. After a comprehensive optimization of the status quo, the ecological benefits of land use increased by 6.2% and the ecological benefits increased by 5.5% under the projected scenario compared with the status quo.
Spatially, the ecological benefits were high in the southeastern region and low in the northwestern region. Among the five scenarios, the greatest differences appeared in the southern and northwestern regions. Specifically, under the ecologically optimal scenario, the ecological benefits of more than CNY 3000/ha were in the northeastern region and there was a distinct part in the southeastern region that would benefit from less than CNY 1000/ha. Under the economically optimal scenario, the ecological benefits in the southeast were well-distributed, totaling to about CNY 2000/ha. Compared with the status quo, the regions with ecological benefits greater than CNY 3000/ha in the northeast clearly decreased and the overall area of high ecological benefits decreased in the middle region. Among the scenarios, including the comprehensively optimal scenario, the status quo, and the projected scenario, there was only a slight difference in achieving ecological benefits.

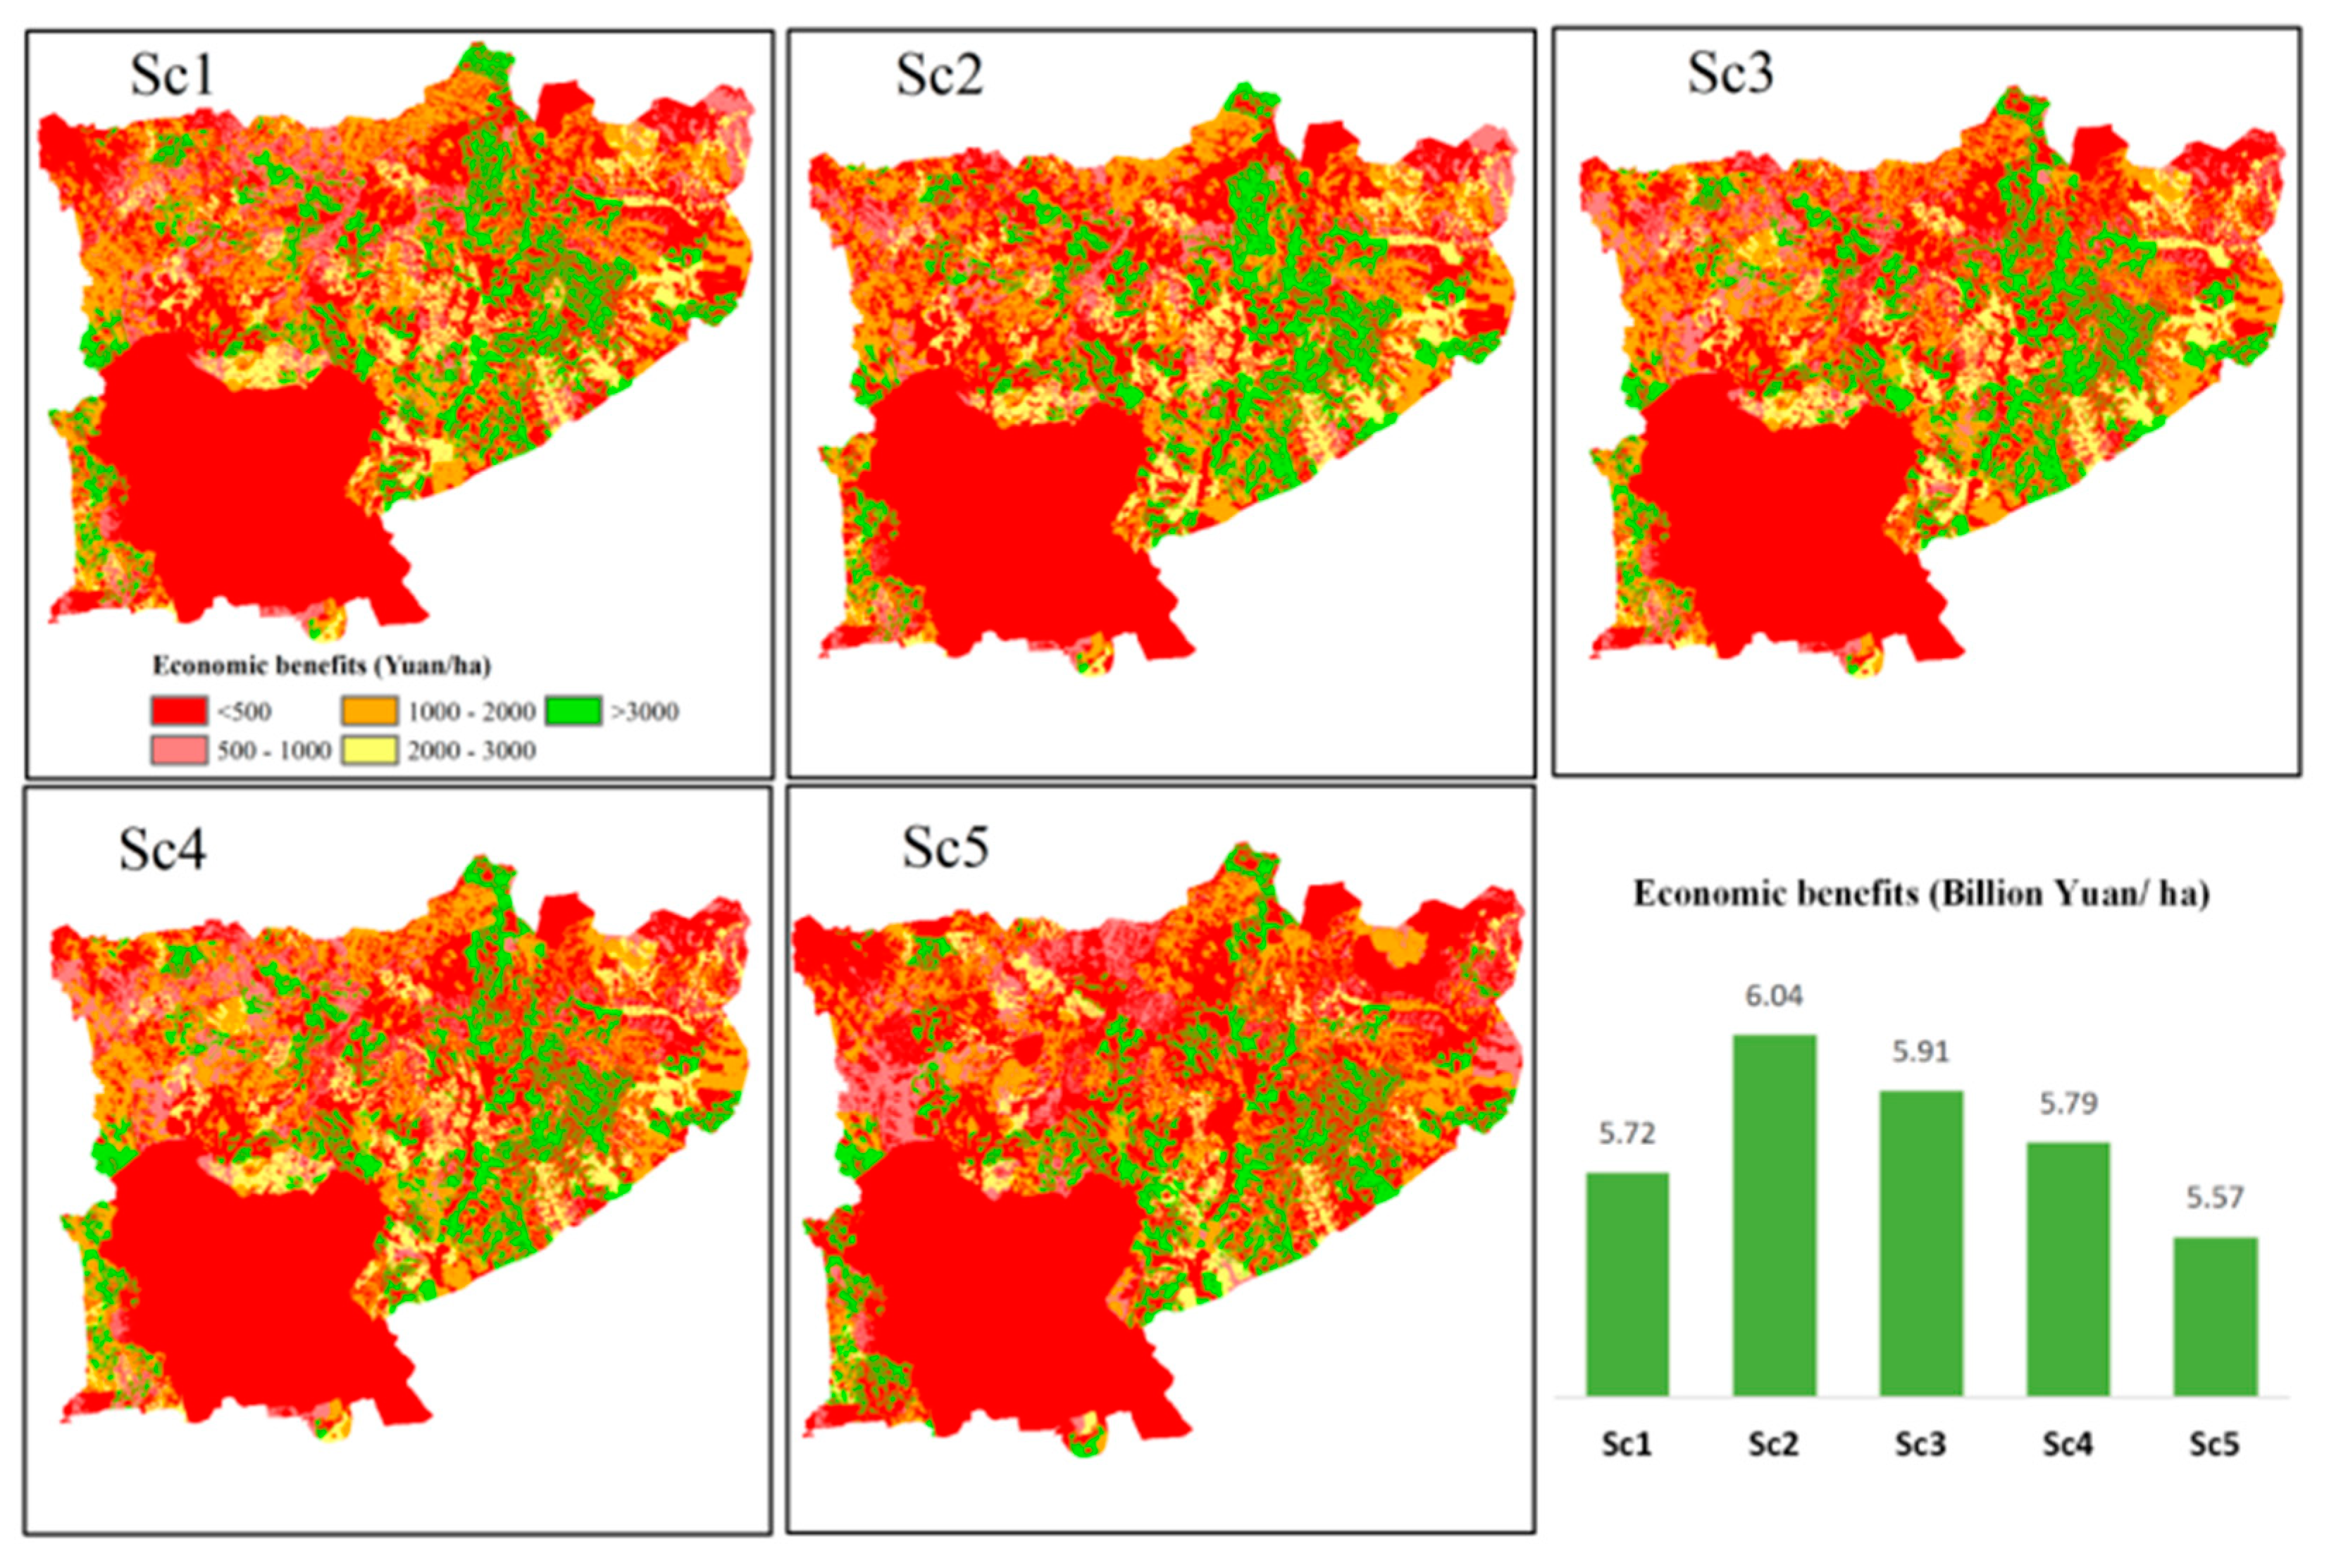
3.3. The Economic Benefits and Spatial Patterns under the Five Scenarios

From highest to lowest, the order of the economic benefits under different scenarios are as follows: economically optimal, comprehensively optimal, the status quo, ecologically optimal, and the projected scenario (Figure 5). Specifically, compared with the status quo, the scenario with highest economic benefits was higher by 8% than that of the lowest scenario; however, after comprehensive optimization, the economic benefits increased by 2.1%. In addition, the economic benefits in the projected scenario are 3.9% lower than that in the status quo.
Spatially, the economic benefits were higher in northeastern Taipusi in terms of forestland and lower in the southwestern region. The economic benefit was clearly the lowest under the projected scenario. The higher-value region was concentrated in the northeastern region with over CNY 2000/ha. In northern region, the distribution of economic benefits was scattered with less than CNY 1000/ha; in the southwestern region, however, it showed the lowest economic benefit out of all the five scenarios.

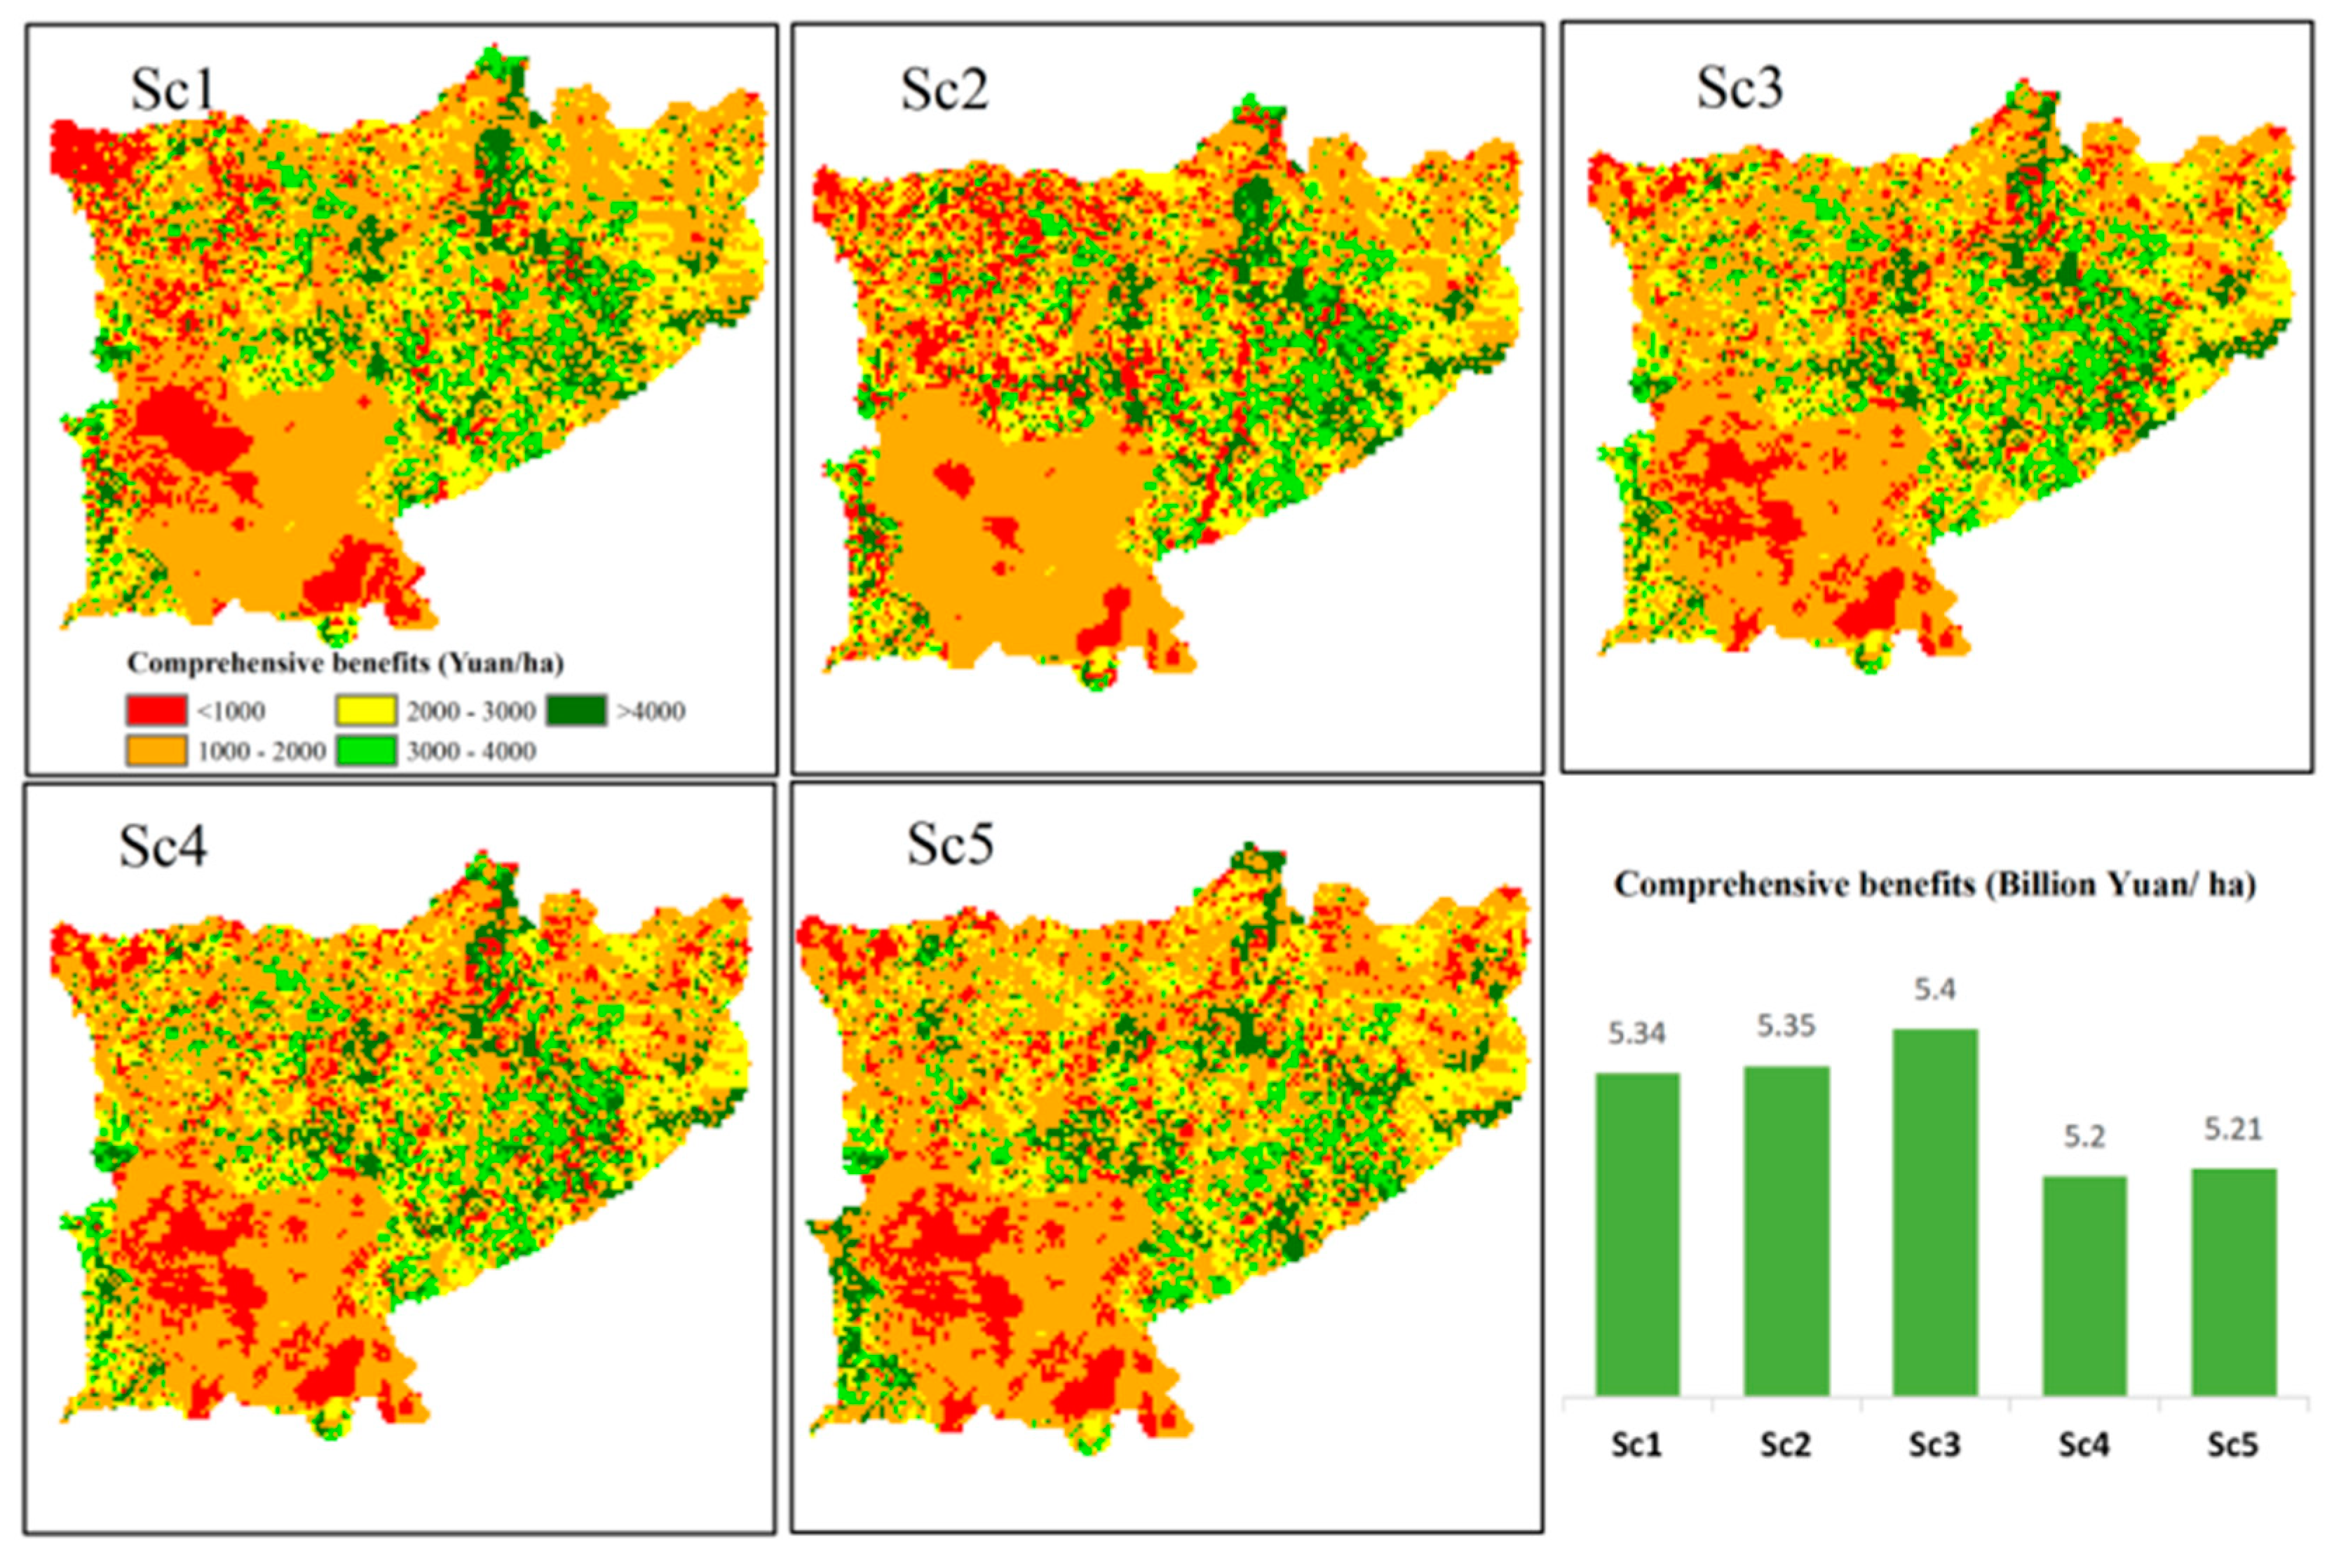
3.4. The Comprehensive Benefits and Spatial Patterns under the Five Scenarios

The comprehensive benefits under the different scenarios, derived from the comprehensive benefit function, are the largest in the comprehensively optimal scenario (Figure 6). The comprehensive benefits in the status quo are the smallest, with a difference of 0.2 billion and a change rate of 3.89%, which shows that after comprehensive optimization, the comprehensive benefits significantly increase, indicating that the structure of the status quo needs to be optimized.
We then compared the differences of spatial patterns of comprehensive benefits under the five scenarios. Overall, the comprehensive benefits are high in the northeastern area and low in the southwestern area. Among these scenarios, the greatest discrepancy appeared in the southern Gongbao Raga Farm. The area with low benefits in the west is the smallest. The distribution of the high-benefit areas in the northeast is more concentrated in the comprehensively optimal scenario than in either the economically optimal scenario and projected scenario. There is little change in the distribution in the other scenarios.
Taken together, the comprehensive optimal scenario is promising and although both its economic and ecological benefits are not the highest, it is a balanced development scenario. It provides a possible solution for a regional ecological and economic ‘win-win’. The forestland in the southeastern region provided many economic and ecological benefits. It should also be noted that grassland in the south areas provided lower economic benefits but notably higher ecological benefits. Thus, the fragile grassland should be protected when considering land cultivation.

4. Discussion

Land is the foundation for human survival and development. How to realize the ecological, social, and economic benefits of land through the optimal allocation has important practical significance. The sustainability of land use includes three dimensions: ecology, society, and economy [72,73]. For “strong” sustainability, natural capital and human capital are regarded as not interchangeable and therefore not tradable. Thus, the practice of sacrificing the environment in exchange for one-time economic growth is unsustainable [74]. Therefore, when optimizing land use, it is impossible to pursue only ecological benefits or only economic benefits. It’s rational for governments and stakeholders to consider local biophysical factors to identify stable equilibrium points and achieve a win-win situation for ecology benefits and economic profits [75].
Greater room for optimization than in the status quo still exists. In terms of target benefit improvement, under the economic priority scenario, the economic benefits have increased compared to the current scenario, but the ecological benefits have been reduced to varying degrees, that is, high economic benefits are obtained at the cost of a certain ecological quality, which is not conducive to regional sustainable development especially in the northeast where the Agro-Pastoral Transitional Zone is located. If the benefits of land use in the status quo do not decrease and the ecological benefits increase, the economic benefits and comprehensive benefits will be the greatest when the structure of land use is comprehensively optimized. This process is referred to as the Pareto optimality [76,77]. Through comprehensive optimization, the area of forestland increased greatly, the area of arable land increased slightly, and the area of grassland decreased slightly, indicating that the optimized land use structure simultaneously considers the ecological, economic, and comprehensive benefits of land use. Moreover, all three benefits of land use improved, with a greater increase than that under the other scenarios. This result is in line with Taipusi Banner’s social economy. Thus, the comprehensive optimal scenario is of practical significance for the sustainable use of regional land and should be encouraged.
Following optimization, the structure of land use becomes more scientific, making it more feasible to meet some demands, such as saving grain, cleaning the environment, or ensuring that land utilization is highly efficient. In areas where the value of ecosystem services is severely low, the strategy of maximizing the value of ecosystem services is more advantageous than the strategy of maximizing economic benefits; this is consistent with the study of Ma et al. [78]. However, the comprehensive benefits in the economically optimal scenario and ecologically optimal scenario are lower than those in the comprehensive optimal scenario. The ecological benefits in the projected scenario are higher than those in the status quo, which shows that it is feasible to consider the structure of land use in decision-making and that the benefits of doing so are becoming both increasingly clear and represent a suitable goal of policy-making.
The results of this scenario analysis could provide possible blueprints for future land use practice. First, follow the principle of adjusting measures to local conditions. In the study area, the Taipusi Banner, the heterogeneity in the natural conditions, such as the terrain and precipitation, shaped a land use pattern where grassland is located in the southwest and cultivated land is located in the northeast [79,80]. When returning farmland to forestland, drought and cold tolerant tree species should be selected considering this region is characterized by drought and low temperature conditions. Therefore, the land use general panning is supposed to be on the basis of land suitability evaluations according to the characteristics of local conditions. Second, ecological conservation policies should still be upheld and encouraged. Specifically, we have the following recommendations: In the northeastern forest area, strengthen the construction of the “Three North” shelterbelt project and the implementation of the “Natural Forest Resources Protection” project to protect and increase ecological land such as forestland. In the southwest grassland, overgrazing and other activities should be controlled to protect vegetation and avoid grassland degradation. In the agricultural and pastoral transition zone, while implementing ecological construction projects, it is necessary to strictly implement farmland protection policies, enhance the availability of farmland, improve the quality of farmland, and ensure food security in advance of ecological priority. Additionally, we recommend strengthening land use planning throughout this region, promoting the conversion of bare land to forest and grassland. Last but not least, land resource management can be integrated with socio-economic processes. For agriculture, abandoning the high-input, high- benefits path may contribute to sustainable production practices. In Europe, markets pay different prices for agricultural products with different levels of fertilization and governments compensate farmers for lower yields as a result of reduced fertilization [81].
However, land use practice is uncertain when considering the ecological conservation, economic development, and national policies, as well as other factors [82]. Since calculating the ecological and economic benefits of land use involves many factors, such as ecosystems and socio-economic systems, and since there is no uniform standard, the quantitative analysis of the ecological and economic benefits of land use has always been difficult [83,84]. Based on the theory of land use ecosystem service value and the direct output income of the land, this study constructed an ecological economic benefit function for land use and used the same weight to construct a comprehensive benefit function of land use, which has certain limitations. Therefore, it is necessary to further improve the evaluation system for the ecological and economic benefits of land use in future works and explore more comprehensive as well as complete calculation methods for the comprehensive benefits of land use to facilitate land use decision-making and ecosystem management.

5. Concluding Remarks

In the context of regional sustainable development, linear programming and CLUES models were conducted in the Taipusi Banner to optimize land use patterns at the county scale under different scenarios. Greater room for optimization than that offered by the status quo still exists. Through comprehensive optimization, the area of forestland increased greatly, the area of arable land increased slightly, and the area of grassland decreased slightly. In areas where the value of ecosystem services is severely low, the strategy of maximizing the value of ecosystem services is more advantageous than the strategy of maximizing economic benefits. Our research intended to provide possible blueprints for future land use practice. In our next study, some consideration will be offered to the following aspects: For the protection of biodiversity, just as for animal species, it is not enough to restrict changes in ecological reserves. Adding the loss of biodiversity caused by land use as a variable to land use optimization is the next step to be improved. In addition to considering natural and economic factors, cultural factors and conversion cost also need to be considered to make land use planning more feasible.

Supplementary Materials

The following are available online at https://www.mdpi.com/article/10.3390/su131810431/s1, Table S1: The physical and environmental factors that are used as constraint factors, Table S2: Evaluation index of economic benefits of land-use, Table S3: Weighted value of factors for economic evaluation of land use, Figure S1: The relationship between income and time, (a) is the relationship between agricultural income and time; (b) is the relationship between animal husbandry income and time.

Author Contributions

Conceptualization, X.X.; methodology, H.J.; software, T.Z.; validation, L.W.; formal analysis, T.Z.; resources, H.J.; writing—original draft preparation, X.X.; writing—review and editing, X.X. and H.J. All authors have read and agreed to the published version of the manuscript.

Funding

This research was funded by the National Key Research and Development Program of China, grant number 2017YFA0604902.

Data Availability Statement

The data used to support the findings of this study are available from the corresponding author upon request. The data are not publicly available due to privacy.

Acknowledgments

We appreciate the editors and anonymous reviewers’ suggestions in improving our manuscript. We would like to thank the high-performance computing support from the Center for Geodata and Analysis, Faculty of Geographical Science, Beijing Normal University. We are pleased to acknowledge Hongqiao Ling (Wuhan University) for the invaluable assistance and pre-editing on the original manuscript.

Conflicts of Interest

The authors declare no conflict of interest.

References

  1. Foley, J.A.; DeFries, R.; Asner, G.P.; Barford, C.; Bonan, G.; Carpenter, S.R.; Chapin, F.S.; Coe, M.T.; Daily, G.C.; Gibbs, H.K.; et al. Global Consequences of Land Use. Science 2005, 309, 570–574. [Google Scholar] [CrossRef] [Green Version]
  2. Lambin, E.F.; Geist, H.J. (Eds.) Land Use and Land-Cover Change: Local Processes and Global Impacts; Springer Science & Business Media: New York, NY, USA, 2008. [Google Scholar]
  3. Lu, D.D.; Guo, L.X. Man-earth areal system—The core of geographical study—On the geographical thoughts and academic contributions of academician Wu Chuanjun. Acta Geogr. Sin. 1998, 2, 97–105. [Google Scholar]
  4. Tang, H.J.; Wu, W.B.; Yang, P.; Chen, Y.Q.; Verburg, P.H. Recent progresses of land use and land cover change (LUCC) models. Acta Geogr. Sin. 2009, 64, 456–468. [Google Scholar]
  5. Lambin, E.F.; Baulies, X.; Bockstael, N.; Fischer, G.; Krug, T. Land use and land-cover change (LUCC): Implementation strategy, International Geosph-Biosph. In Program, International Human Dimensions Programme on Global Environmental Change (IHDP); IGBP Secretariat: Stockholm/Bonn, Sweden, 1999. [Google Scholar]
  6. Lambin, E.F.; Geist, H.J.; Lepers, E. Dynamics of land use and land-cover change in tropical regions. Annu. Rev. Environ. Resour. 2003, 28, 205–241. [Google Scholar] [CrossRef] [Green Version]
  7. Blaikie, P.; Brookfield, H. (Eds.) Land Degradation and Society; Routledge: London, UK, 2015. [Google Scholar]
  8. Barrow, C.J. Land Degradation: Development and Breakdown of Terrestrial Environments; Cambridge University Press: New York, NY, USA, 1991. [Google Scholar]
  9. Jin, S.Q.; Fang, Z. Zero growth of chemical fertilizer and pesticide use: China’s objectives, progress and challenges. J. Resour. Ecol. 2018, 9, 50–58. [Google Scholar]
  10. Wang, J.A.; Xu, X.; Liu, P.F. Landuse and land carrying capacity in ecotone between agriculture and animal husbandry in northern China. Resour. Sci. 1999, 21, 19–24. [Google Scholar]
  11. Jiang, H.; Xu, X.; Guan, M.; Wang, L.; Huang, Y.; Jiang, Y. Determining the contributions of climate change and human activities to vegetation dynamics in agro-pastural transitional zone of northern China from 2000 to 2015. Sci. Total Environ. 2020, 718, 134871. [Google Scholar] [CrossRef]
  12. Guo, L.; Shan, N.; Zhang, Y.; Sun, F.; Liu, W.; Shi, Z.; Zhang, Q. Separating the effects of climate change and human activity on water use efficiency over the Beijing-Tianjin Sand Source Region of China. Sci. Total Environ. 2019, 690, 584–595. [Google Scholar] [CrossRef]
  13. Zhang, P.; Shao, G.; Zhao, G.; Le Master, D.C.; Parker, G.R.; Dunning, J.B.; Li, Q. China’s forest policy for the 21st century. Science 2000, 288, 2135–2136. [Google Scholar] [CrossRef] [Green Version]
  14. Liu, J.; Jin, X.; Xu, W.; Gu, Z.; Yang, X.; Ren, J.; Fan, Y.T.; Zhou, Y. A new framework of land use efficiency for the coordination among food, economy and ecology in regional development. Sci. Total Environ. 2020, 710, 135670. [Google Scholar] [CrossRef]
  15. Shi, T.; Yang, S.; Zhang, W.; Zhou, Q. Coupling coordination degree measurement and spatiotemporal heterogeneity between economic development and ecological environment—Empirical evidence from tropical and subtropical regions of China. J. Clean. Prod. 2020, 244, 118739. [Google Scholar] [CrossRef]
  16. Jiang, H.; Xu, X.; Guan, M.; Wang, L.; Huang, Y.; Liu, Y. Simulation of spatiotemporal land use changes for integrated model of socioeconomic and ecological processes in China. Sustainability 2019, 11, 3627. [Google Scholar] [CrossRef] [Green Version]
  17. Deng, X.; Liu, J.; Zhan, J.; Zhao, T. Dynamic simulation on the spatio-temporal patterns of land use change in taibus county. Geogr. Res. 2004, 23, 147–156. [Google Scholar]
  18. Dewan, A.M.; Yamaguchi, Y. Land use and land cover change in Greater Dhaka, Bangladesh: Using remote sensing to promote sustainable urbanization. Appl. Geogr. 2009, 29, 390–401. [Google Scholar] [CrossRef]
  19. Jin, G.; Deng, X.; Chu, X.; Li, Z.; Wang, Y. Optimization of land-use management for ecosystem service improvement: A review. Phys. Chem. Earth 2017, 101, 70–77. [Google Scholar] [CrossRef]
  20. Liu, X.; Ou, J.; Li, X.; Ai, B. Combining system dynamics and hybrid particle swarm optimization for land use allocation. Ecol. Model. 2013, 257, 11–24. [Google Scholar] [CrossRef]
  21. Xu, X.; Jiang, H.; Wang, L.; Guan, M.; Zhang, T.; Qiao, S. Major consequences of land-use changes for ecosystems in the future in the agro-pastoral transitional zone of Northern China. Appl. Sci. 2020, 10, 6714. [Google Scholar] [CrossRef]
  22. Ullman, E. A Theory of location for cities. Am. J. Sociol. 1941, 46, 853–864. [Google Scholar] [CrossRef]
  23. North, D.C. Location theory and regional economic growth. J. Political Econ. 1955, 63, 243–258. [Google Scholar] [CrossRef]
  24. Christaller, W. Die Zentralen Orte in Suddeutschland: Eine Okonomisch-Geographische Untersuchung Uber die GE-setzmaBigkeit der Verbreitung der Siedlungen mit Stadtischen Funktionen. Ph.D. Thesis, Erlangen, Gustav Fischer, Jena, Germany, 1933. [Google Scholar]
  25. George, H. An Overview of Land Evaluation and Land Use Planning at FAO; FAO: Rome, Italy, 2005. [Google Scholar]
  26. FAO. A Framework for Land Evaluation Rome; Food and Agriculture Organization of the United Nation: Rome, Italy, 1976. [Google Scholar]
  27. Purnell, M.F. Application of the FAO framework for land evaluation for conservation and land use planning in sloping areas: Potentials and constraints. In Land Evaluation for Land Use Planning and Conservation on Sloping Areas; International Institute for Land Reclamation and Improvement: Wageningen, The Netherlands, 1986; Volume 40, pp. 17–31. [Google Scholar]
  28. Ahlqvist, O. In search of classification that supports the dynamics of science: The FAO land cover classification system and proposed modifications. Environ. Plan. B Plan. Des. 2008, 35, 169–186. [Google Scholar] [CrossRef] [Green Version]
  29. Sadeghi, S.; Jalili, K.; Nikkami, D. Land use optimization in watershed scale. Land Use Policy 2009, 26, 186–193. [Google Scholar] [CrossRef]
  30. Wu, J.; Hobbs, R. Key issues and research priorities in landscape ecology: An idiosyncratic synthesis. Landsc. Ecol. 2002, 17, 355–365. [Google Scholar] [CrossRef]
  31. Liu, Y.S. Introduction to land use and rural sustainability in China. Land Use Policy 2018, 74, 1–4. [Google Scholar] [CrossRef]
  32. Turner, B.L.; Lambin, E.F.; Reenberg, A. The emergence of land change science for global environmental change and sustainability. Proc. Natl. Acad. Sci. USA 2007, 104, 20666–20671. [Google Scholar] [CrossRef] [Green Version]
  33. Tang, L.; Wang, D. Optimization of county-level land resource allocation through the improvement of allocation efficiency from the perspective of sustainable development. Int. J. Environ. Res. Public Health 2018, 15, 2638. [Google Scholar] [CrossRef] [PubMed] [Green Version]
  34. Ligmann-Zielinska, A.; Church, R.L.; Jankowski, P. Spatial optimization as a generative technique for sustainable multiobjective land-use allocation. Int. J. Geogr. Inf. Sci. 2008, 22, 601–622. [Google Scholar] [CrossRef]
  35. Aerts, J.C.J.H.; Eisinger, E.; Heuvelink, G.B.M.; Stewart, T.J. Using linear integer programming for multi-site land-use allocation. Geogr. Anal. 2003, 35, 148–169. [Google Scholar] [CrossRef]
  36. Cao, K.; Huang, B.; Wang, S.; Lin, H. Sustainable land use optimization using boundary-based fast genetic algorithm. Comput. Environ. Urban Syst. 2012, 36, 257–269. [Google Scholar] [CrossRef]
  37. He, C.; Shi, P.; Chen, J.; Li, X.; Pan, Y.; Li, J.; Li, Y. Research on land use scenario model based on system dynamics model and cellular automata model. Sci. China D Earth Sci. 2005, 35, 464–473. [Google Scholar]
  38. Wu, J.; Tu, J.; Yan, X.; Zhou, Y. Study on the coupling mechanism between urban land use benefits and urbanization in China. Urban Stud. 2011, 8, 155. [Google Scholar] [CrossRef]
  39. Pannell, D.J. Public benefits, private benefits, and policy mechanism choice for land-use change for environmental benefits. Land Econ. 2008, 84, 225–240. [Google Scholar] [CrossRef]
  40. Murdiyarso, D.; van Noordwijk, M.; Wasrin, U.; Tomich, T.; Gillison, A. Environmental benefits and sustainable land-use options in the jambi transect, Sumatra. J. Veg. Sci. 2002, 13, 429–438. [Google Scholar] [CrossRef]
  41. Bertaud, A.; Malpezzi, S. Measuring the costs and benefits of urban land use regulation: A simple model with an application to Malaysia. J. Hous. Econ. 2011, 10, 393–418. [Google Scholar] [CrossRef] [Green Version]
  42. Reid, W.V.; Mooney, H.A.; Cropper, A.; Capistrano, D.; Carpenter, S.R.; Chopra, K.; Zurek, M.B. Millennium Ecosystem Assessment, Ecosystems and Human Well-Being: Synthesis; Island Press: Washington, DC, USA, 2005. [Google Scholar]
  43. Millennium Ecosystem Assessment Board. Ecosystems and Human Well-Being: Current State and Trends. In Millennium Ecosystem Assessment; Global Assessment Reports; Island Press: Washington, DC, USA, 2005. [Google Scholar]
  44. Jing, X.; He, J. The relationship between biodiversity, ecosystem multi functionality and multi service ability: Literature overview and research advances. Chin. J. Plant. Ecol. 2021, 45. [Google Scholar]
  45. Zhang, K.; Gao, J.; Zou, C.; Lin, N.; Yu, D.; Cao, B.; Wang, Y. Expansion of protected area networks integrating eco-system service and social-ecological coordination. Glob. Ecol. Conserv. 2020, 24, e01298. [Google Scholar] [CrossRef]
  46. Maes, J.; Liquete, C.; Teller, A.; Erhard, M.; Paracchini, M.L.; Barredo, J.I.; Grizzetti, B.; Cardoso, A.; Somma, F.; Petersen, J.-E.; et al. An indicator framework for assessing ecosystem services in support of the EU Biodiversity Strategy to 2020. Ecosyst. Serv. 2016, 17, 14–23. [Google Scholar] [CrossRef] [Green Version]
  47. Costanza, R.; d’Arge, R.; De Groot, R.; Farber, S.; Grasso, M.; Hannon, B.; Van Den Belt, M. The value of the world’s ecosystem services and natural capital. Nature 1998, 25, 3–15. [Google Scholar]
  48. Costanza, R.; De Groot, R.; Sutton, P.; Van Der Ploeg, S.; Anderson, S.J.; Kubiszewski, I.; Farber, S.; Turner, R.K. Changes in the global value of ecosystem services. Glob. Environ. Chang. 2014, 26, 152–158. [Google Scholar] [CrossRef]
  49. Costanza, R.; De Groot, R.; Braat, L.; Kubiszewski, I.; Fioramonti, L.; Sutton, P.; Farber, S.; Grasso, M. Twenty years of ecosystem services: How far have we come and how far do we still need to go? Ecosyst. Serv. 2017, 28, 1–16. [Google Scholar] [CrossRef]
  50. Xie, G.D.; Zhang, C.X.; Zhang, L.M.; Chen, W.H.; Li, S.M. Improvement of the evaluation method for ecosystem service value based on per unit area. J. Nat. Resour. 2015, 30, 189–196. [Google Scholar]
  51. Yang, J.; Wang, L. Means of eco-benefit evaluation of returning farmland to woodland. China Land Sci. 2003, 17, 54–58. [Google Scholar]
  52. Tallis, H.T.; Ricketts, T.; Guerry, A.D.; Nelson, E.; Ennaanay, D.; Wolny, S.; Sharp, R. Invest 2.1 Beta User’s Guide. In The Natural Capital Project; The Natural Capital Project: Stanford, CA, USA, 2011. [Google Scholar]
  53. Ouyang, Z.; Zheng, H.; Xiao, Y.; Polasky, S.; Liu, J.; Xu, W.; Wang, Q.; Zhang, L.; Xiao, Y.; Rao, E.; et al. Improvements in ecosystem services from investments in natural capital. Science 2016, 352, 1455–1459. [Google Scholar] [CrossRef]
  54. Alonso, W. Location and land use toward a general theory of land rent. Location and land use. In Toward a General Theory of Land Rent; Harvard University: Cambridge, MA, USA, 1964. [Google Scholar]
  55. Liu, Y.S. Analysis on relativity of land location and land benefit in city. J. Shaanxi Norm. Univ. Nat. Sci. Ed. 1995, 23, 95–100. [Google Scholar]
  56. Jiao, Y.F. Probing into the estimation of the economic benefit of urban land of chongqing. J. Chongqing Norm. Univ. Nat. Sci. Ed. 2006, 23, 76–96. [Google Scholar]
  57. Gong, J.; Liu, Y.; Zhang, L. The optimal allocation of land use and its potential appraisal in guangzhou city. Acta Geogr. Sin. 2010, 65, 1391–1400. [Google Scholar]
  58. Zhang, Z.G.; Gao, J. Analysis of the economic efficiency and ecological efficiencyof landuse and discussion of landuse model. China Popul. Resour. Environ. 2002, 14, 104–107. [Google Scholar]
  59. Wang, R.; Zhang, G.L. The evaluation of urban land use efficiency in Harbin city. Nat. Resour. J. Harbin Norm. Univ. 2010, 26, 105–109. [Google Scholar]
  60. Ouyang, Z.; Song, C.; Zheng, H.; Polasky, S.; Xiao, Y.; Bateman, I.J.; Liu, J.; Ruckelshaus, M.; Shi, F.; Xiao, Y.; et al. Using gross ecosystem product (GEP) to value nature in decision making. Proc. Natl. Acad. Sci. USA 2020, 117, 14593–14601. [Google Scholar] [CrossRef] [PubMed]
  61. Cai, Y.; Liu, Y.; Yu, Z.; Verburg, P.H. Progress in spatial simulation of land use change-CLUE-s model and its application. Progress Geogr. 2004, 23, 63–71. [Google Scholar]
  62. Verburg, P.H.; Dearing, J.A.; Dyke, J.G.; Van Der Leeuw, S.; Seitzinger, S.; Steffen, W.; Syvitski, J. Methods and approaches to modelling the Anthropocene. Glob. Environ. Chang. 2016, 39, 328–340. [Google Scholar] [CrossRef] [Green Version]
  63. Chen, Y.; Zhang, L.; He, L.; Men, M. Multi-scenario simulation of land use structure based on dual combined models. Acta Ecol. Sin. 2016, 36, 5391–5400. [Google Scholar]
  64. Xu, X.; Li, X.; Xiao, C.; Ou, M. Land use layout optimization under different scenarios by using the CLUE-S model. Acta Ecol. Sin. 2016, 36, 5401–5410. [Google Scholar]
  65. Zhang, Y.; Zhao, S.; Verburg, P.H. CLUE-S and its application for simulating temporal and spatial change of land use in Naiman Banner. J. Nat. Resour. 2013, 18, 310–318. [Google Scholar] [CrossRef]
  66. Wang, A.; Zhu, W.; Jing, L.I.; Chen, Y. Measurement of ecosystem service value based on remote sensing—A case study in inner Mongolia, China. Sci. Geogr. Sin. 2007, 27, 325–330. [Google Scholar]
  67. Li, Y. Spatial Optimization for Land Use in North China under Settlement Constraint—A Case Study in Taips County in Inner Mongolia. Master’s Thesis, Beijing Normal University, Beijing, China, 2011. [Google Scholar]
  68. Jiang, L.; Xia, X.U.; Liu, Y.; Li, X.U.; Tian, Y. Evaluation of Ecosystem Service Value based on Land Use-Terrestrial Eco-System Coupled Model. In A Case Study from the Farming-Grazing Transitional Zone of Northern China; Tianjin Agricultural Sciences: Tianjin, China, 2014; Volume 20, pp. 74–81. [Google Scholar]
  69. Xia, X.U.; Liu, H.; Gao, Q. Dynamic simulation on the optimal patterns of land use change for the farming-pastoral zone in North China. Prog. Geogr. 2008, 27, 80–85. [Google Scholar]
  70. Hu, Y. Responces of Ecosystem NPP and SOC to Climate and Land Use Changes in Taipusi County. Master’s Thesis, Beijing Normal University, Beijing, China, 2012. [Google Scholar]
  71. Zhang, K.X. Evaluation on the comprehensive benefits of cultivated land use of counties in harbin. J. Anhui Agric. Sci. 2012, 40. [Google Scholar]
  72. Daly, H.E. On wilfred beckerman’ s critique of sustainable development. Env. Values 1995, 4, 49–55. [Google Scholar] [CrossRef]
  73. Holland, A. Substitutability: Or, why strong sustainability is weak and absurdly strong sustainability is not absurd. In Valuing Nature? Ethics, Economics and the Environment; Foster, J., Ed.; Routledge: London, UK, 1997; pp. 119–134. [Google Scholar]
  74. Wu, J. Landscape sustainability science: Ecosystem services and human well-being in changing landscapes. Landsc. Ecol. 2013, 28, 999–1023. [Google Scholar] [CrossRef]
  75. Xu, X.; Gao, Q.; Peng, C.; Cui, X.; Liu, Y. State key laboratory of earth face and resource ecology, Integrating global socioeconomic influence into regional land use change model for China. Front. Earth Sci. 2014, 8, 81–92. [Google Scholar] [CrossRef]
  76. Zhang, J.; Cui, P.; Song, H. Impact of urban morphology on outdoor air temperature and microclimate optimization strategy base on Pareto optimality in Northeast China. Build. Environ. 2020, 180, 107035. [Google Scholar] [CrossRef]
  77. Verstegen, J.A.; Jonker, J.G.G.; Karssenberg, D.; van der Hilst, F.; Schmitz, O.; de Jong, S.; Faaijd, A. How a Pareto frontier complements scenario projections in land use change impact assessment. Environ. Model. Softw. 2017, 97, 287–302. [Google Scholar] [CrossRef] [Green Version]
  78. Ma, B.Y.; Huang, J.; Li, S.C. Optimal allocation of land use types in the Beijing-Tianjin-Hebei urban agglomeration based on ecological and economic benefits trade-offs. Prog. Geogr. 2019, 38, 26–37. [Google Scholar]
  79. Hu, X.; Liu, L.Y.; Yan, P.; Meng, X.L. The effect of different soil surface on wind erosion in Taipusi County, Inner Mongolia. Res. Soil Water Conserv. 2006, 13, 116–119. [Google Scholar]
  80. Hao, H.; Li, X. Agricultural land use intensity and its determinants in ecologically-vulnerable areas in North China: A case study of Taipusi County, Inner Mongolia autonomous region. J. Resour. Ecol. 2011, 2, 117–125. [Google Scholar]
  81. Li, C.; Zhang, F.R.; Song, N.P.; Kong, X.B.; Chen, H.W. Discussion on theory and method of optimal regional allocation of land use structure. Geogr. Geo-Inf. Sci. 2003, 19, 52–55. [Google Scholar]
  82. Dang, A.N.; Kawasaki, A. Integrating biophysical and socio-economic factors for land-use and land-cover change projection in agricultural economic regions. Ecol. Model. 2017, 344, 29–37. [Google Scholar] [CrossRef]
  83. Lindberg, K. Policies for Maximizing Nature Tourism’s Ecological and Economic Benefits; World Resources Institute: Washington, DC, USA, 1991. [Google Scholar]
  84. Münier, B.; Birr-Pedersen, K.; Schou, J. Combined ecological and economic modelling in agricultural land use scenarios. Ecol. Model. 2004, 174, 5–18. [Google Scholar] [CrossRef]
Figure 1. Location and topography of the Taipusi Banner.
Sustainability 13 10431 g001
Figure 2. Flow chart of the optimization of land use patterns. The detail explanation for the (i) scenarios development can be found in Section 2.3.1 below. The detail explanation for the (ii) quantity demands determination can be found in Section 2.3.2 below. The detail explanation for the (iii) spatial allocation for land use quantity demands can be found in Section 2.3.3 below. The detail explanation for the (iv) ecological, economic, and comprehensive benefits evaluation can be found in Section 2.4 below.
Sustainability 13 10431 g002
Figure 3. Land use patterns for different scenarios in the Taipusi Banner.
Sustainability 13 10431 g003
Figure 4. Ecological benefits under different scenarios in the Taipusi Banner.
Sustainability 13 10431 g004
Figure 5. Economic benefits for different scenarios in the Taipusi Banner.
Sustainability 13 10431 g005
Figure 6. Comprehensive benefits for different scenarios in the Taipusi Banner.
Sustainability 13 10431 g006
Table 1. The benefit coefficients of land use.
Benefit Coefficients (Cj,k)Cropland
(j = 1) (CNY/ha)
Woodland
(j = 2) (CNY/ha)
Grassland
(j = 3) (CNY/ha)
Ecological benefit coefficients (k = 1 or k = 3)11192981.21258.38
Economic benefit coefficients (k = 2 or k = 3)3056.5791.971809.82
Comprehensive benefit coefficients (k = 3)2087.7518871534
Table 2. The constraints of the optimization of the land use demands from land use policies.
Land Use TypesConstraint ConditionArea Interval (%)Description
CroplandCropland land retention(26.73, 30.34)In accordance with the provisions of basic farmland protection.
WoodlandPolitical constraint(18.02, 22.91)According to the policy of returning farmland to forestland/grassland in the Taipusi Banner.
GrasslandPolitical constraint(35.33, 47.82)According to the policy of returning farmland to forestland/grassland in the Taipusi Banner.
-Mathematical model rule≥0The figure of the land use area cannot be negative.
-Total agricultural land area100The sum of all types of land area is equal to the current land use area.
Table 3. Quantitative structure of land use under different scenarios (percentage).
DescriptionProportion of Land Use Types (%)Structure
CroplandForestlandGrasslandOther Use (Bare Land)
Sc1Ecologically optimal scenario26.7322.9137.8712.491.17:1:1.65:0.55
Sc2Economically optimal scenario30.3418.0239.1512.491.68:1:2.17:0.69
Sc3Comprehensively optimal scenario30.3421.8635.3312.481.39:1:1.62:0.57
Sc4Status quo27.8018.3839.1714.651.51:1:2.13:0.80
Sc5Projected scenario26.7322.9135.3315.031.17:1:1.54:0.66
Publisher’s Note: MDPI stays neutral with regard to jurisdictional claims in published maps and institutional affiliations.

