
Fiber-Reinforced Sand-Fixing Board Based on the Concept of “Sand Control with Sand”: Experimental Design, Testing, and Application

Abstract
:1. Introduction
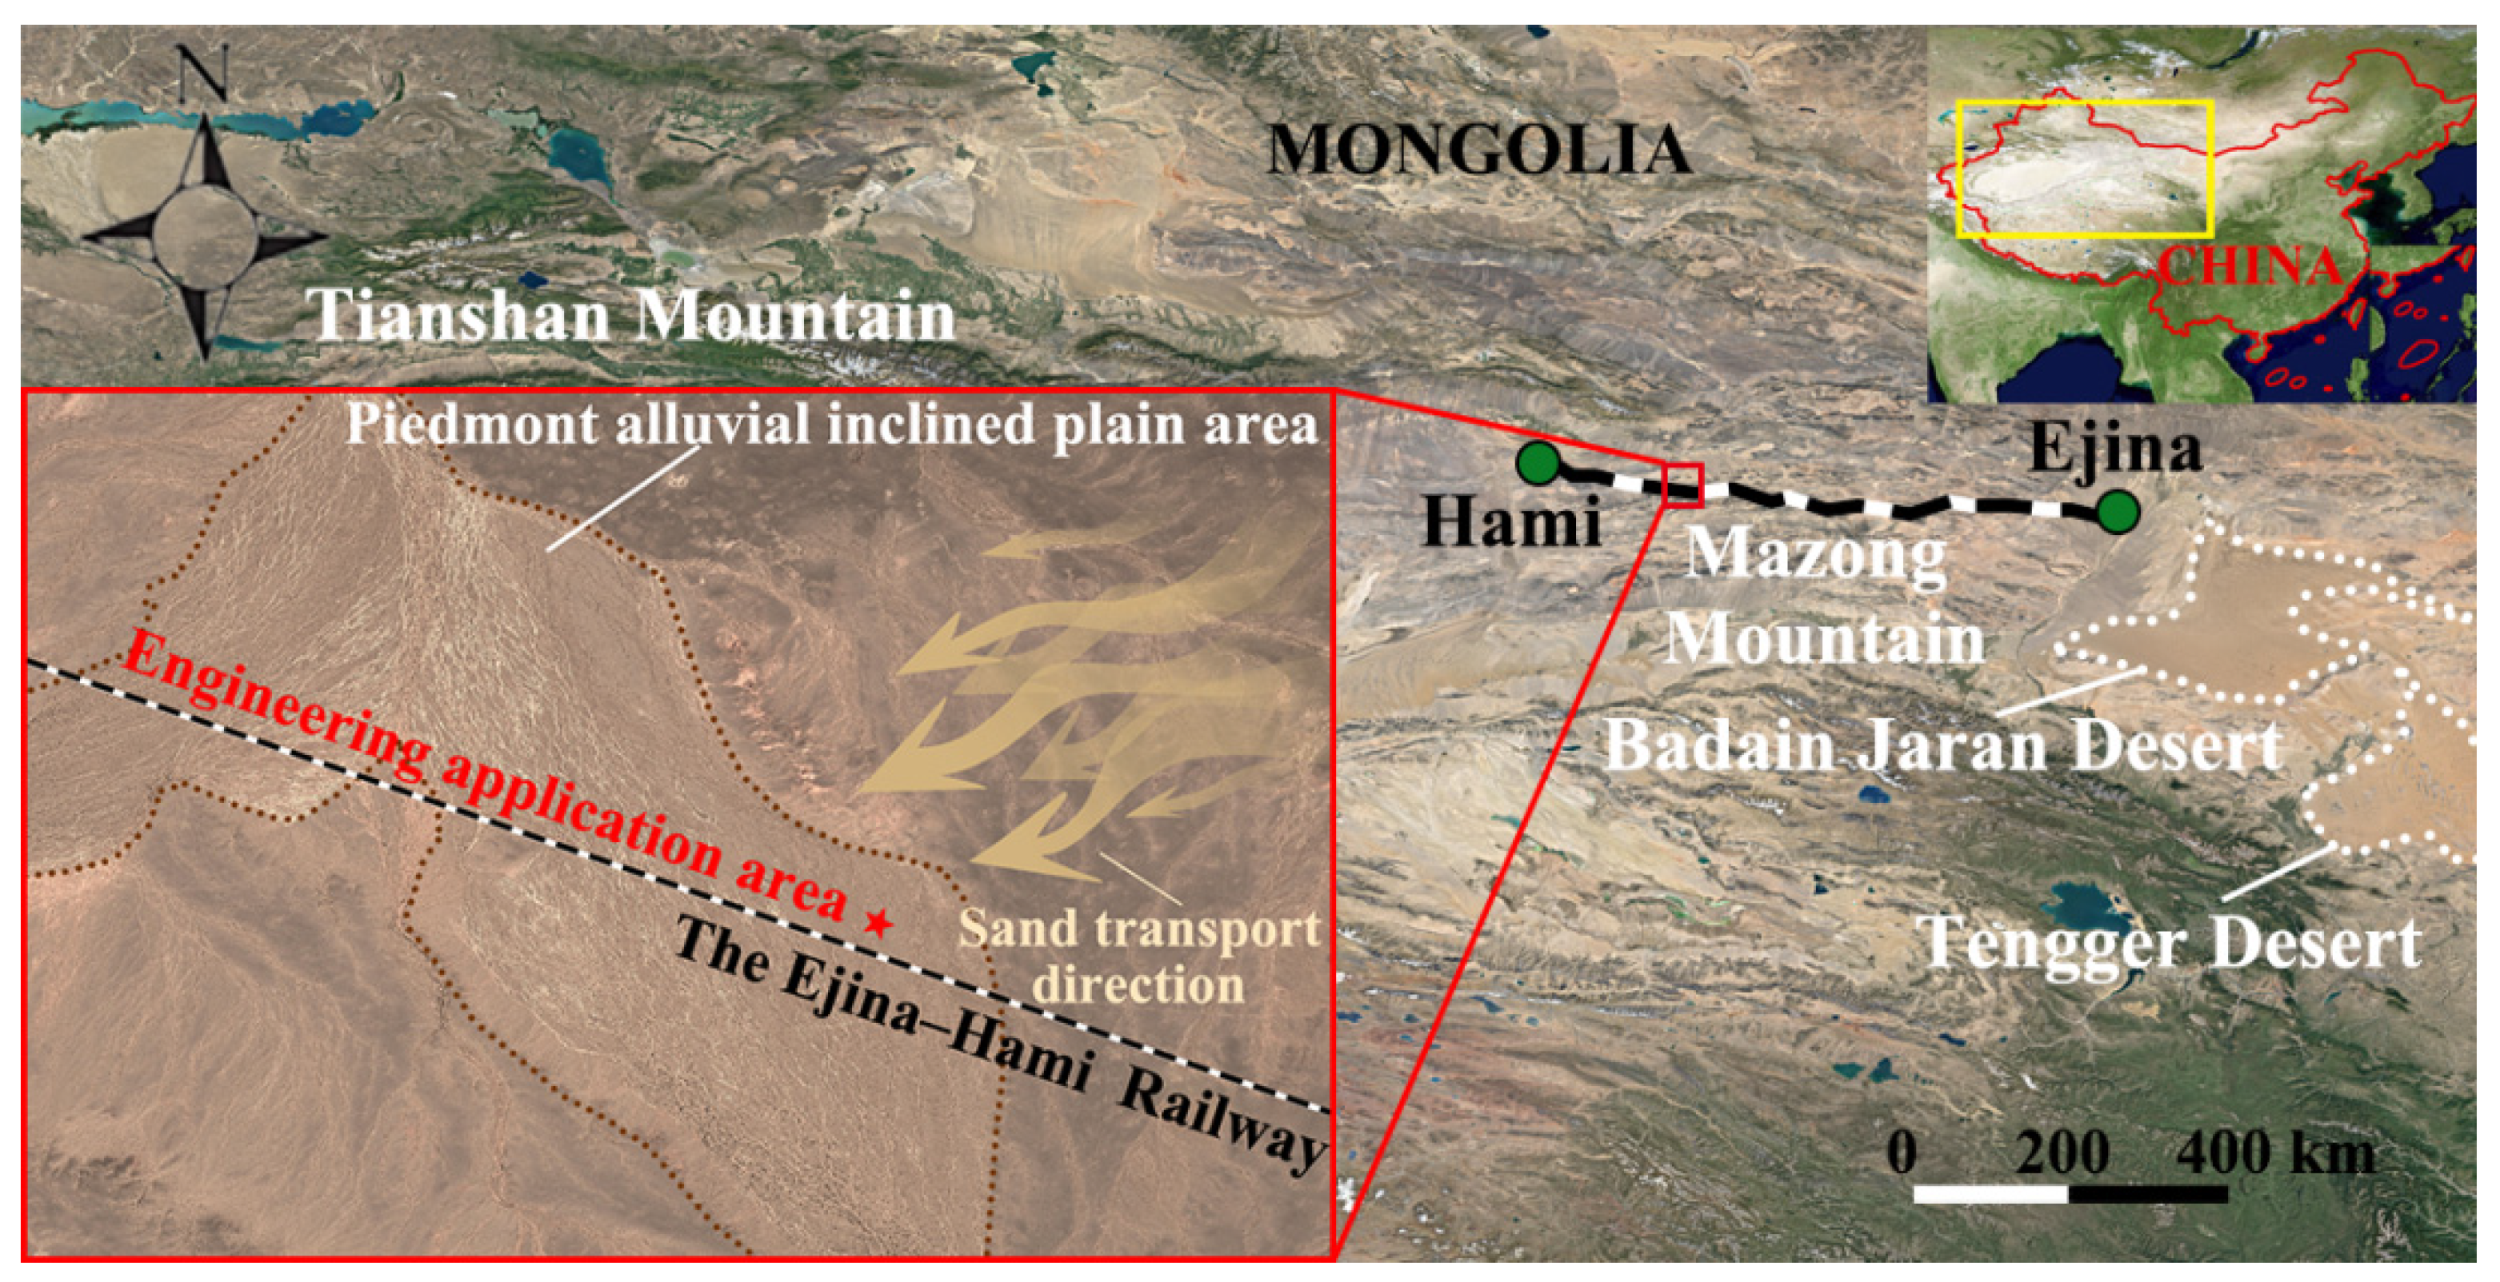
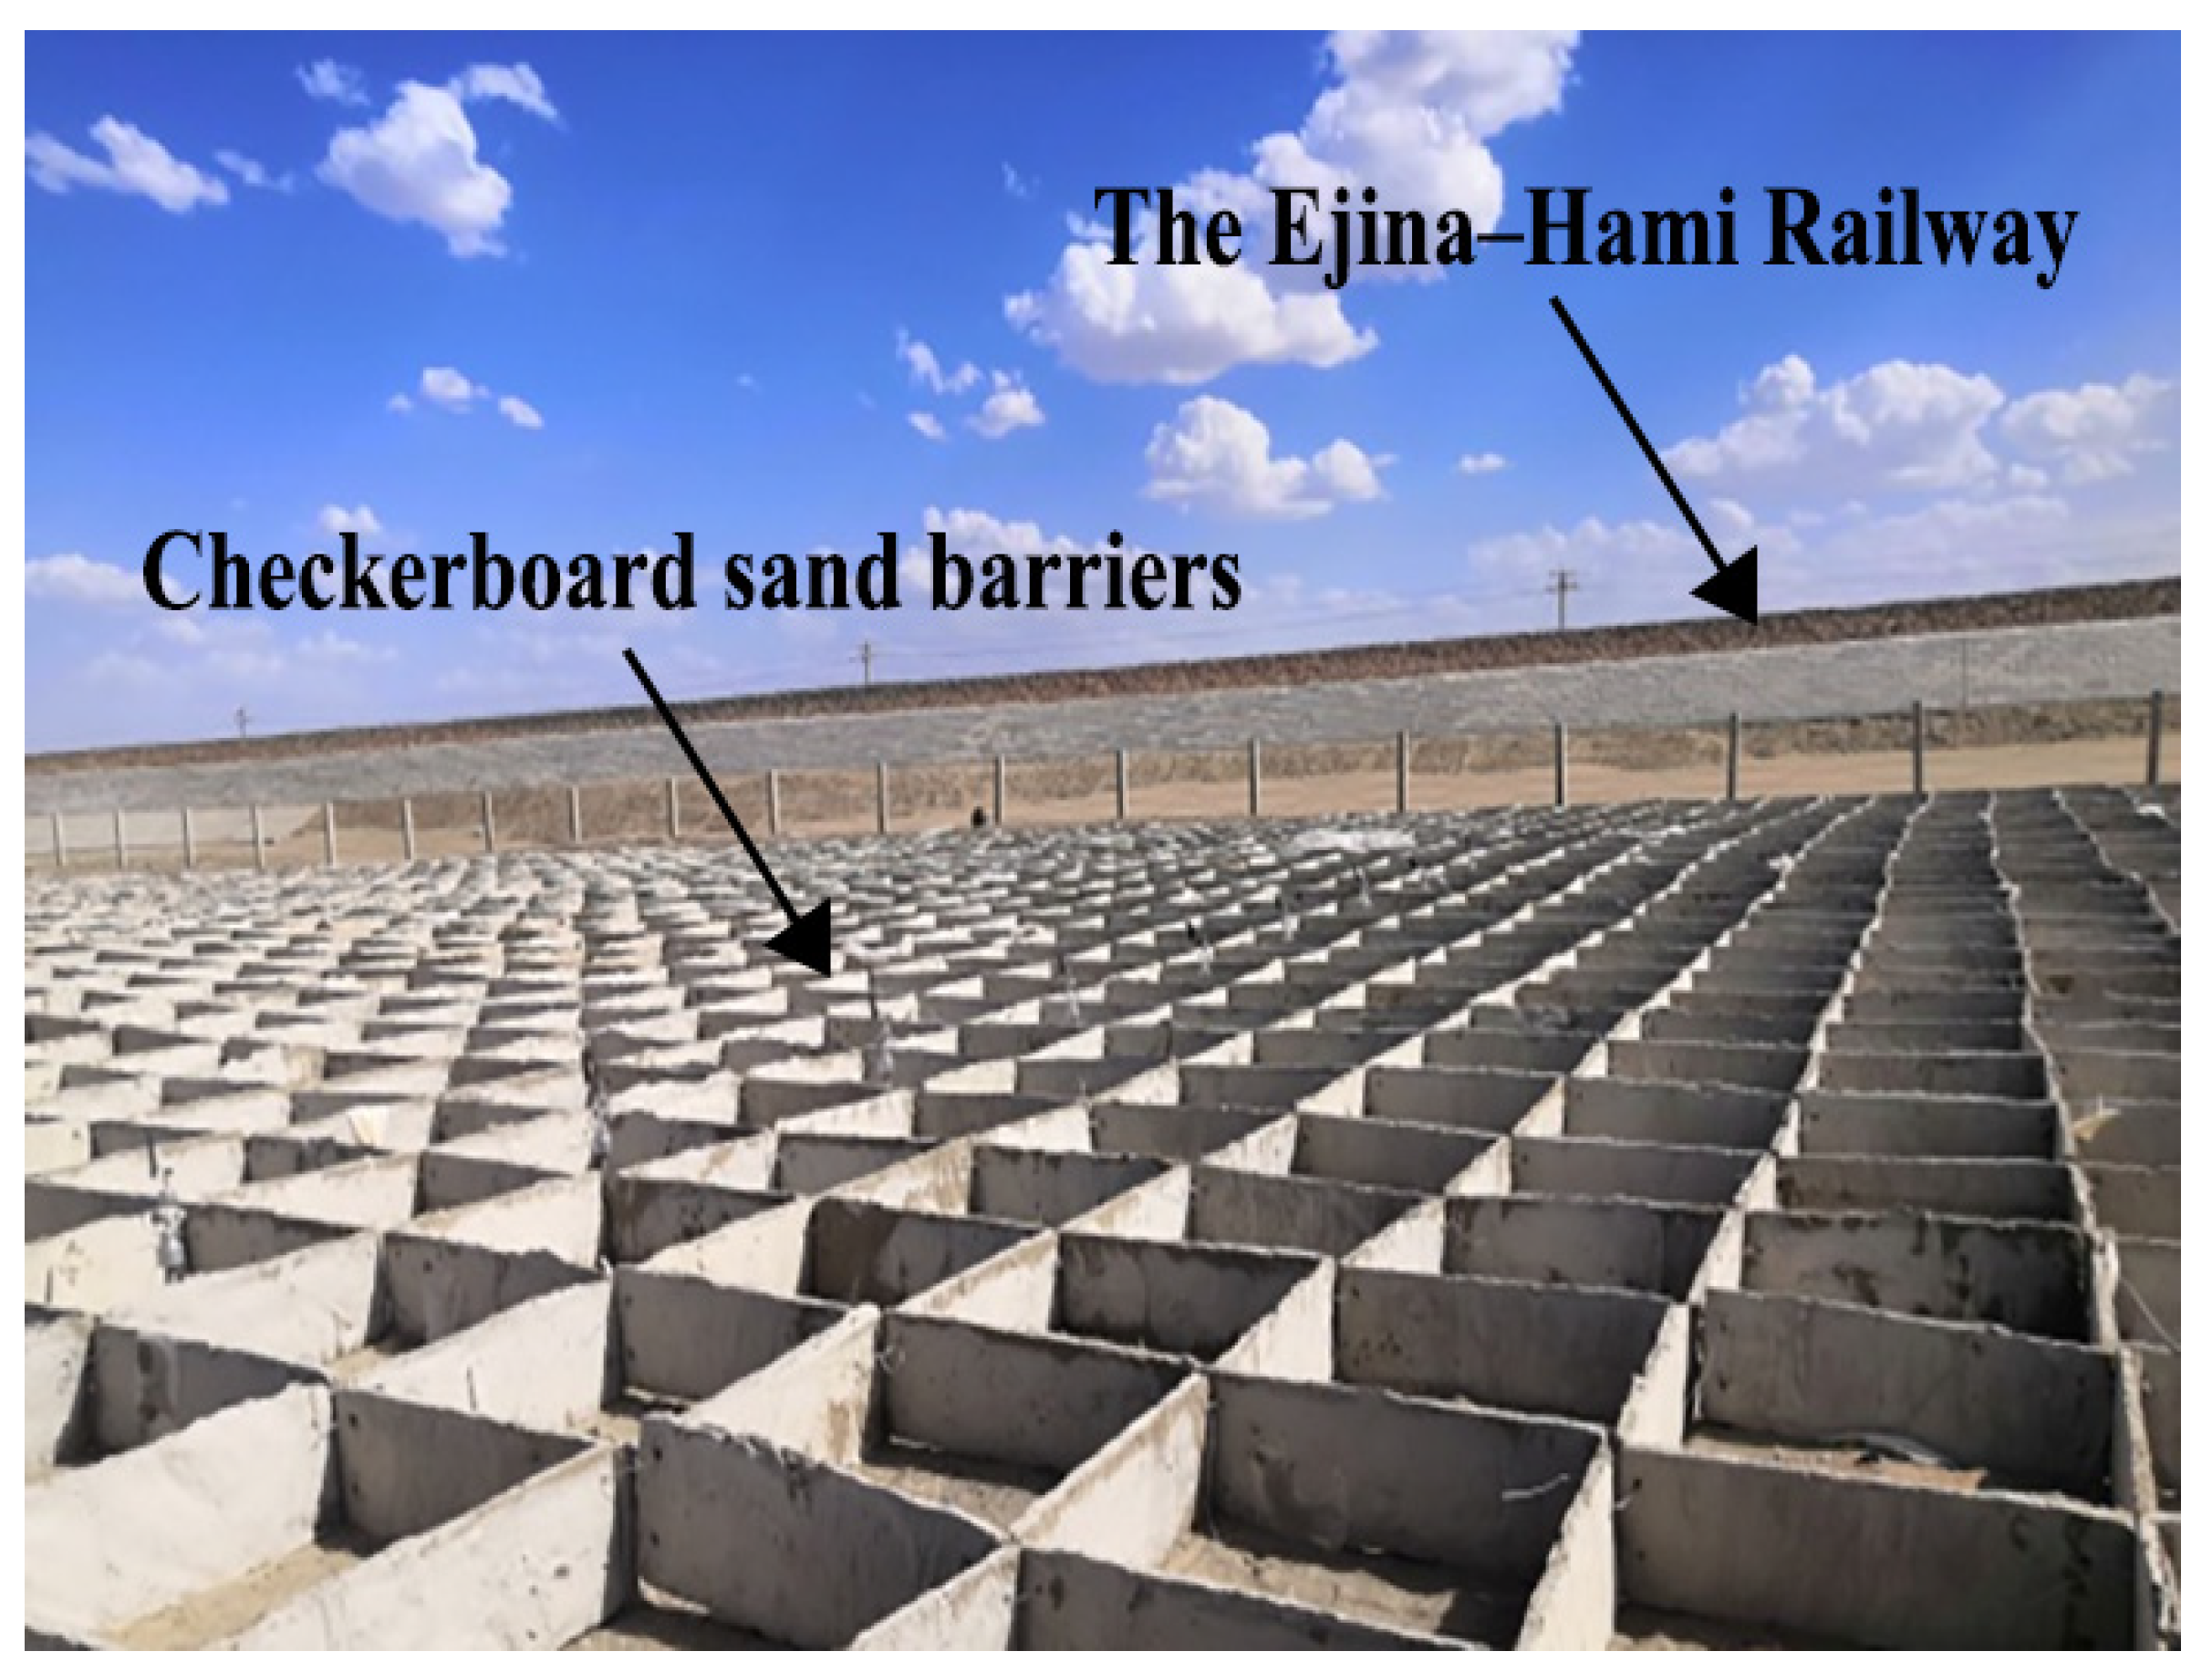
2. Overview of the Study Area
2.1. Regional Geographical Characteristics
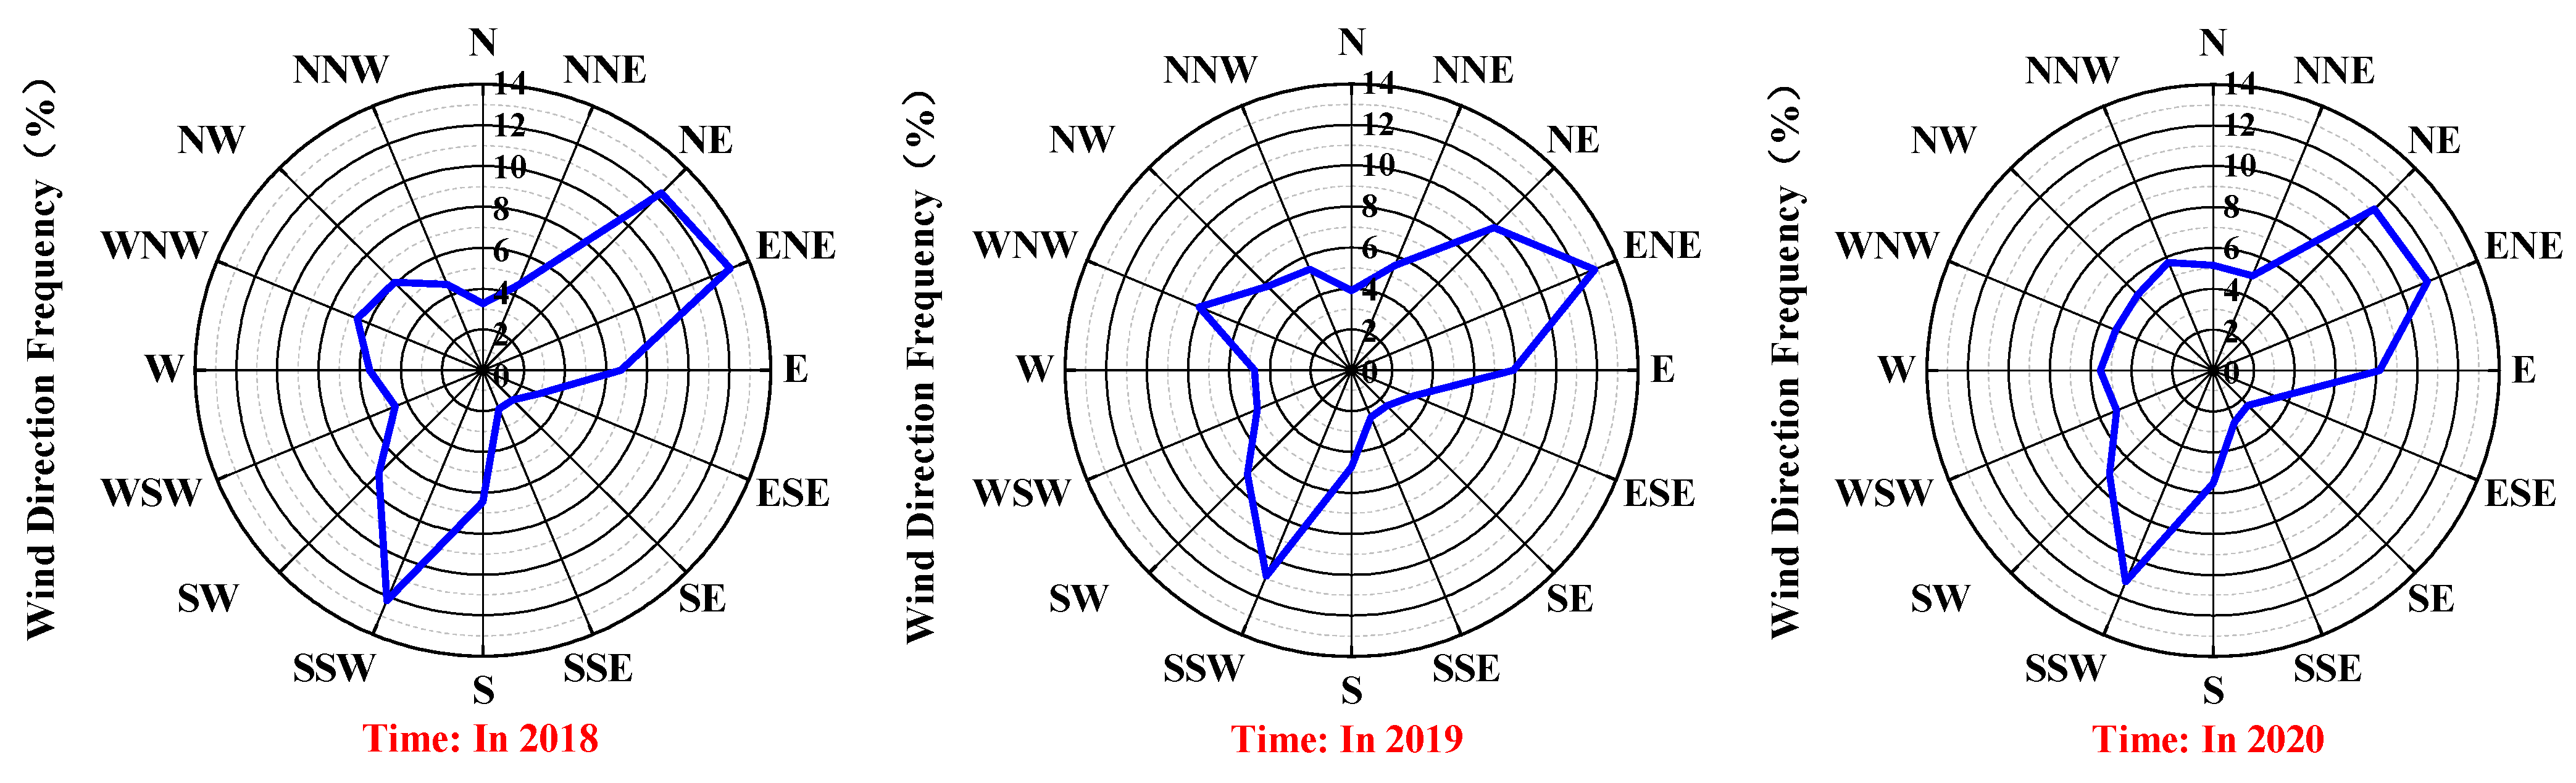
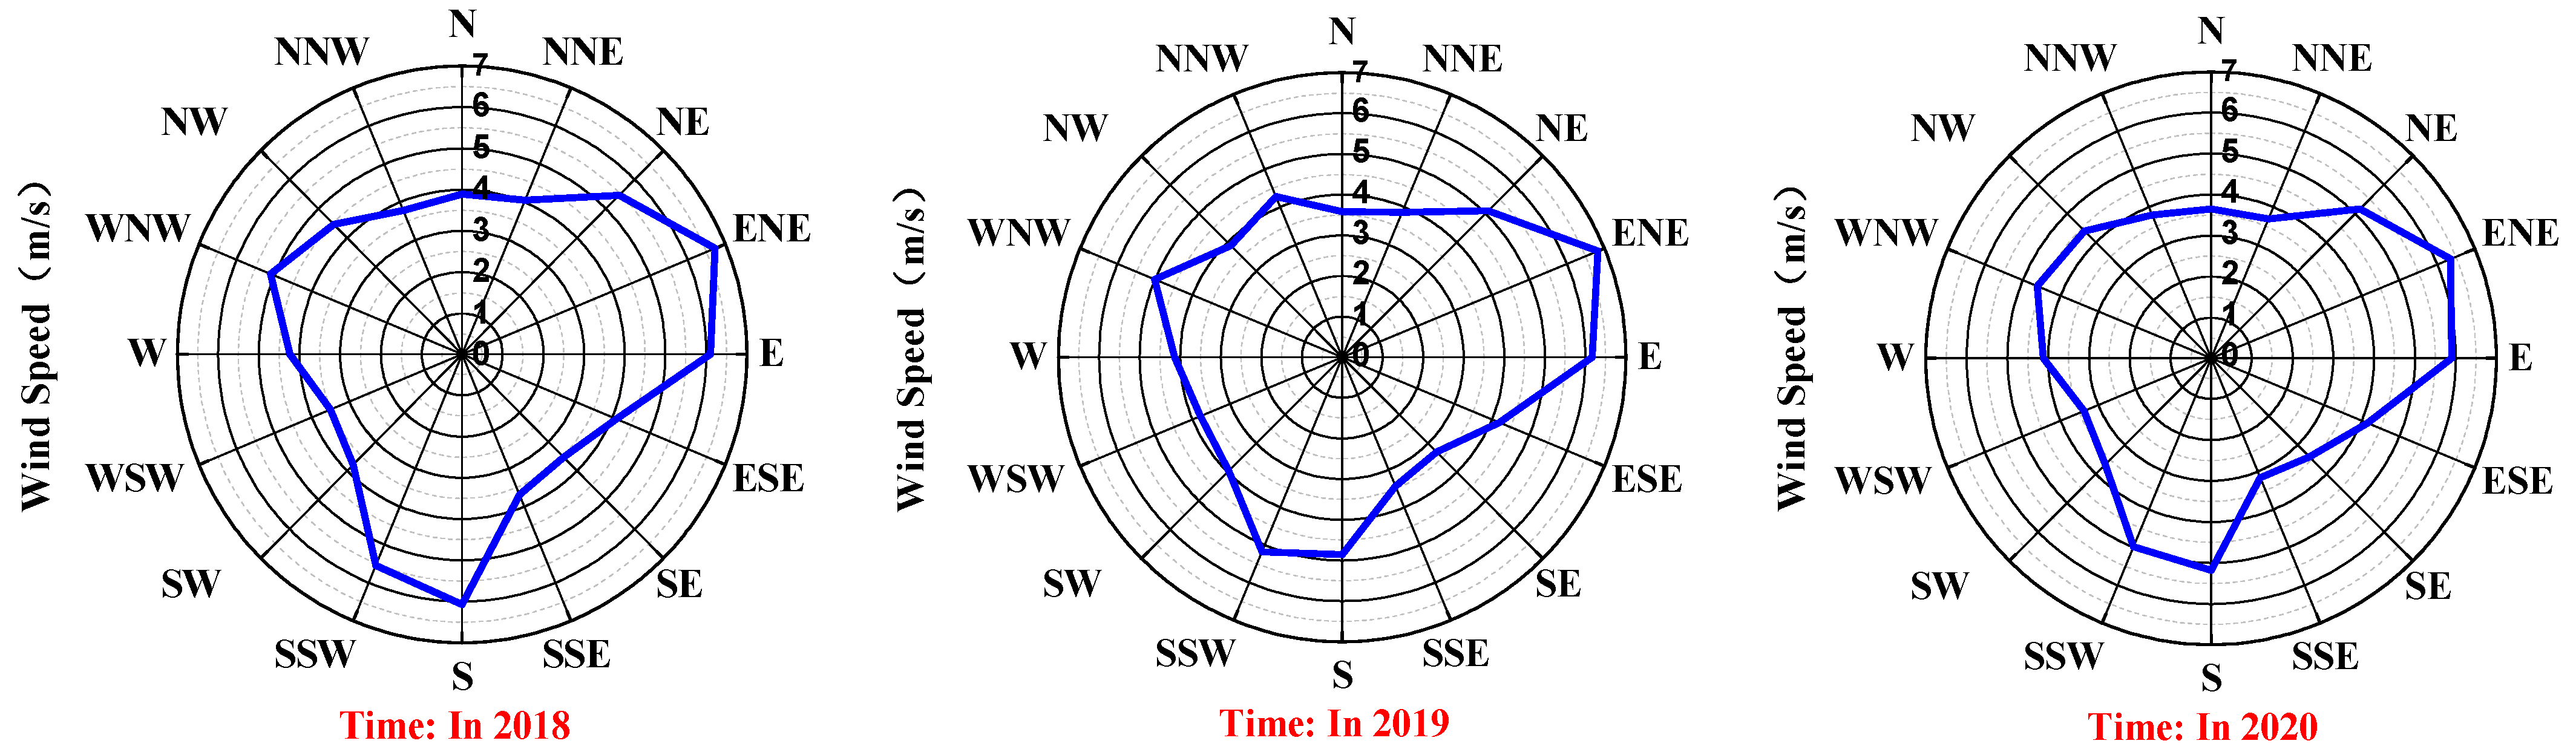
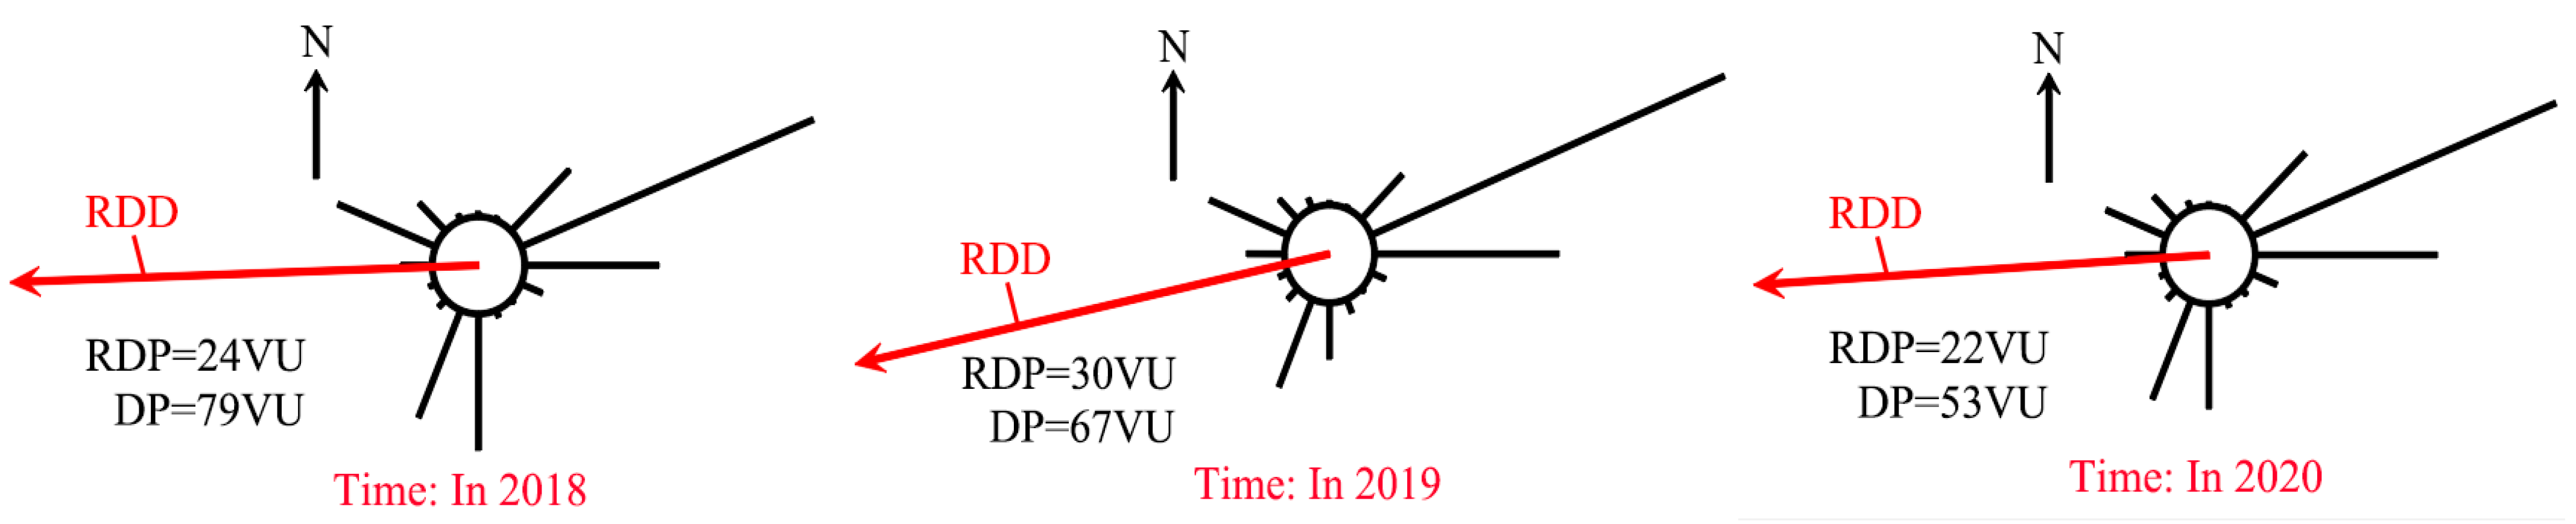
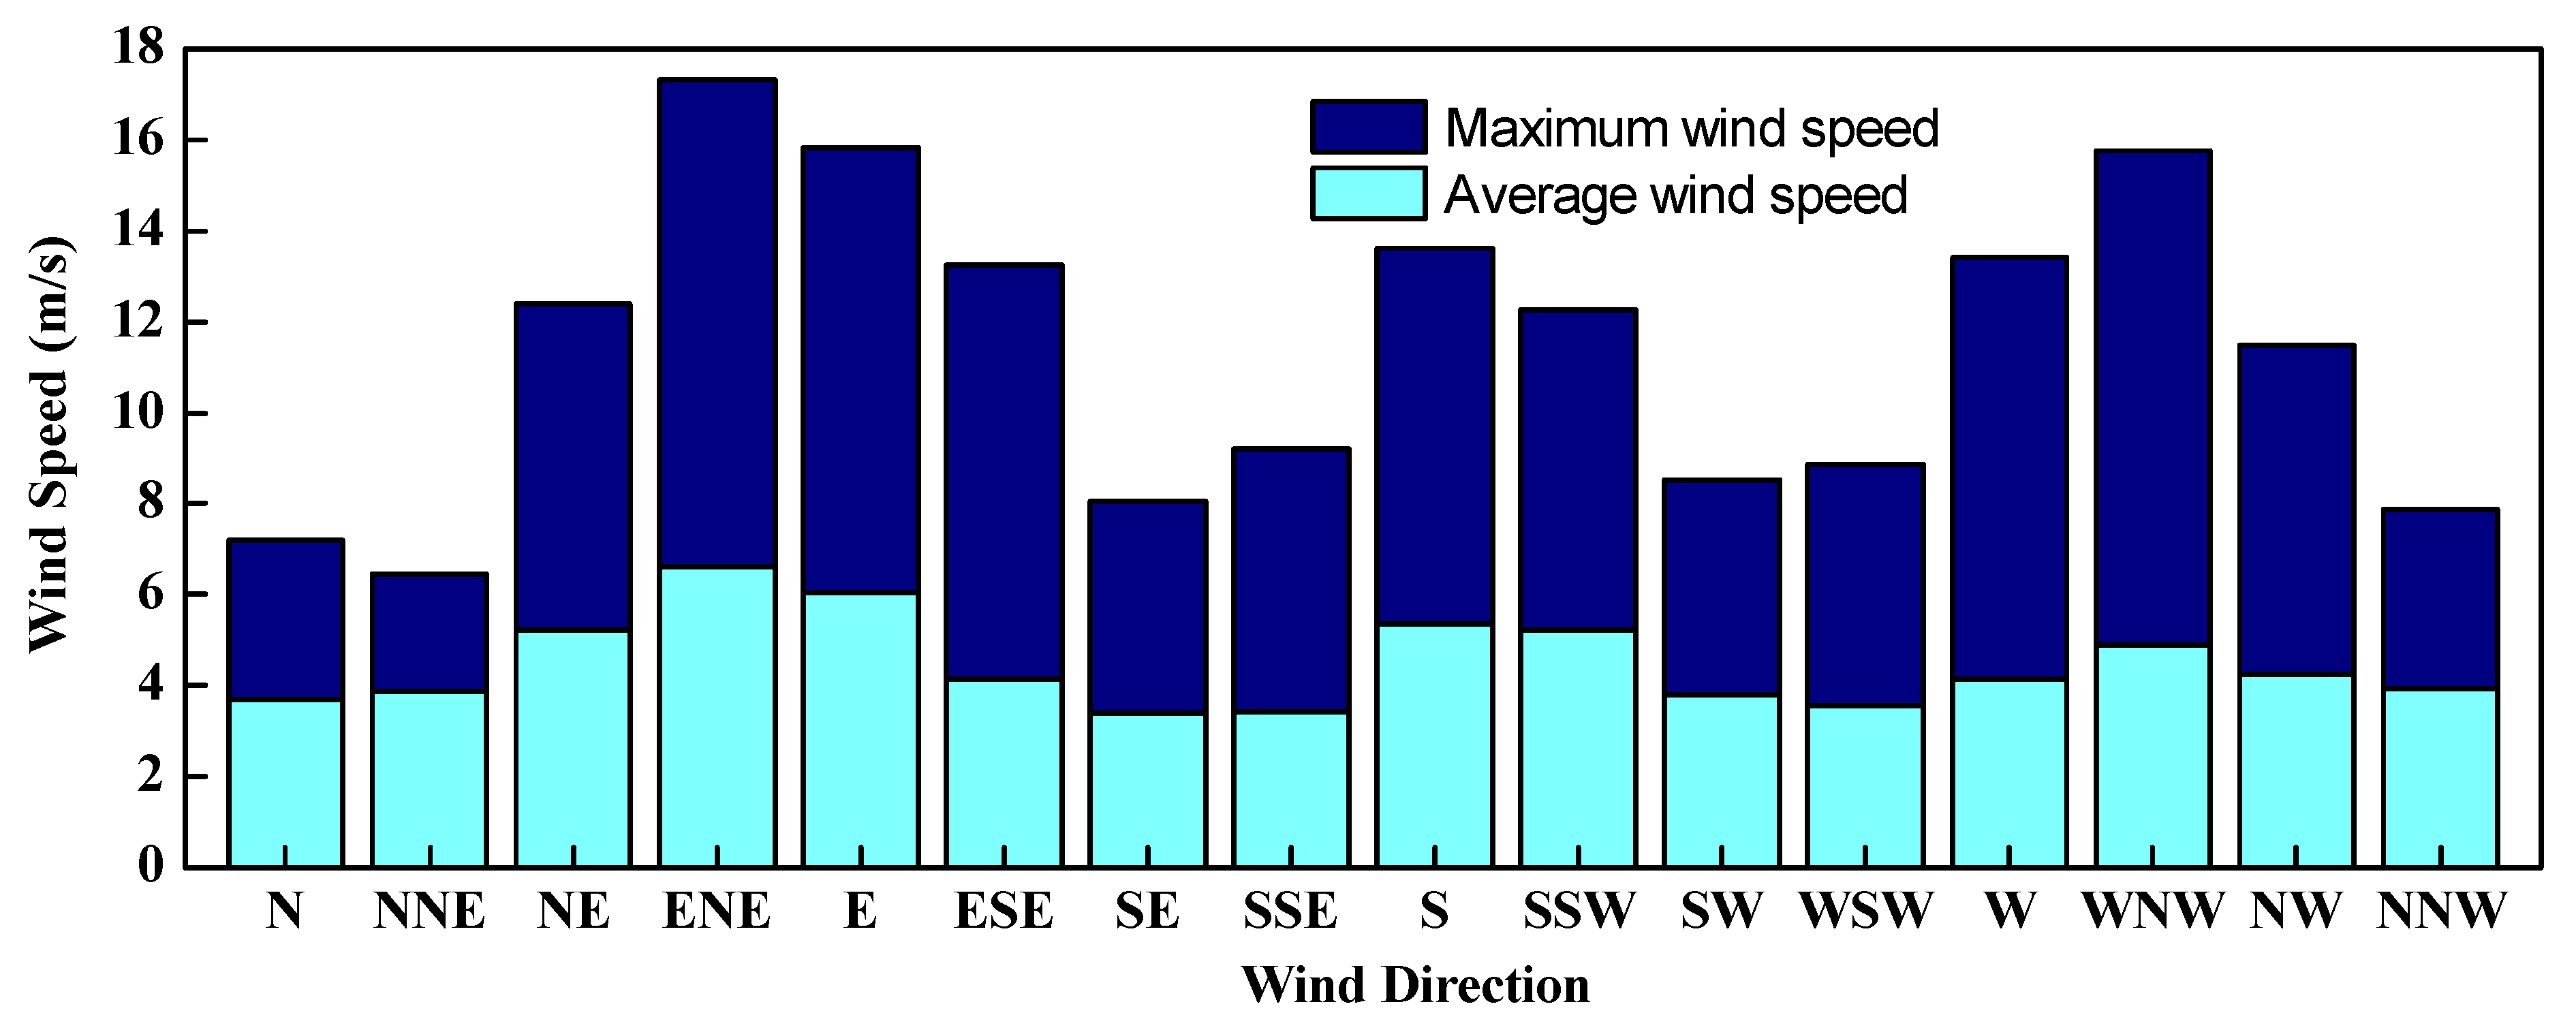
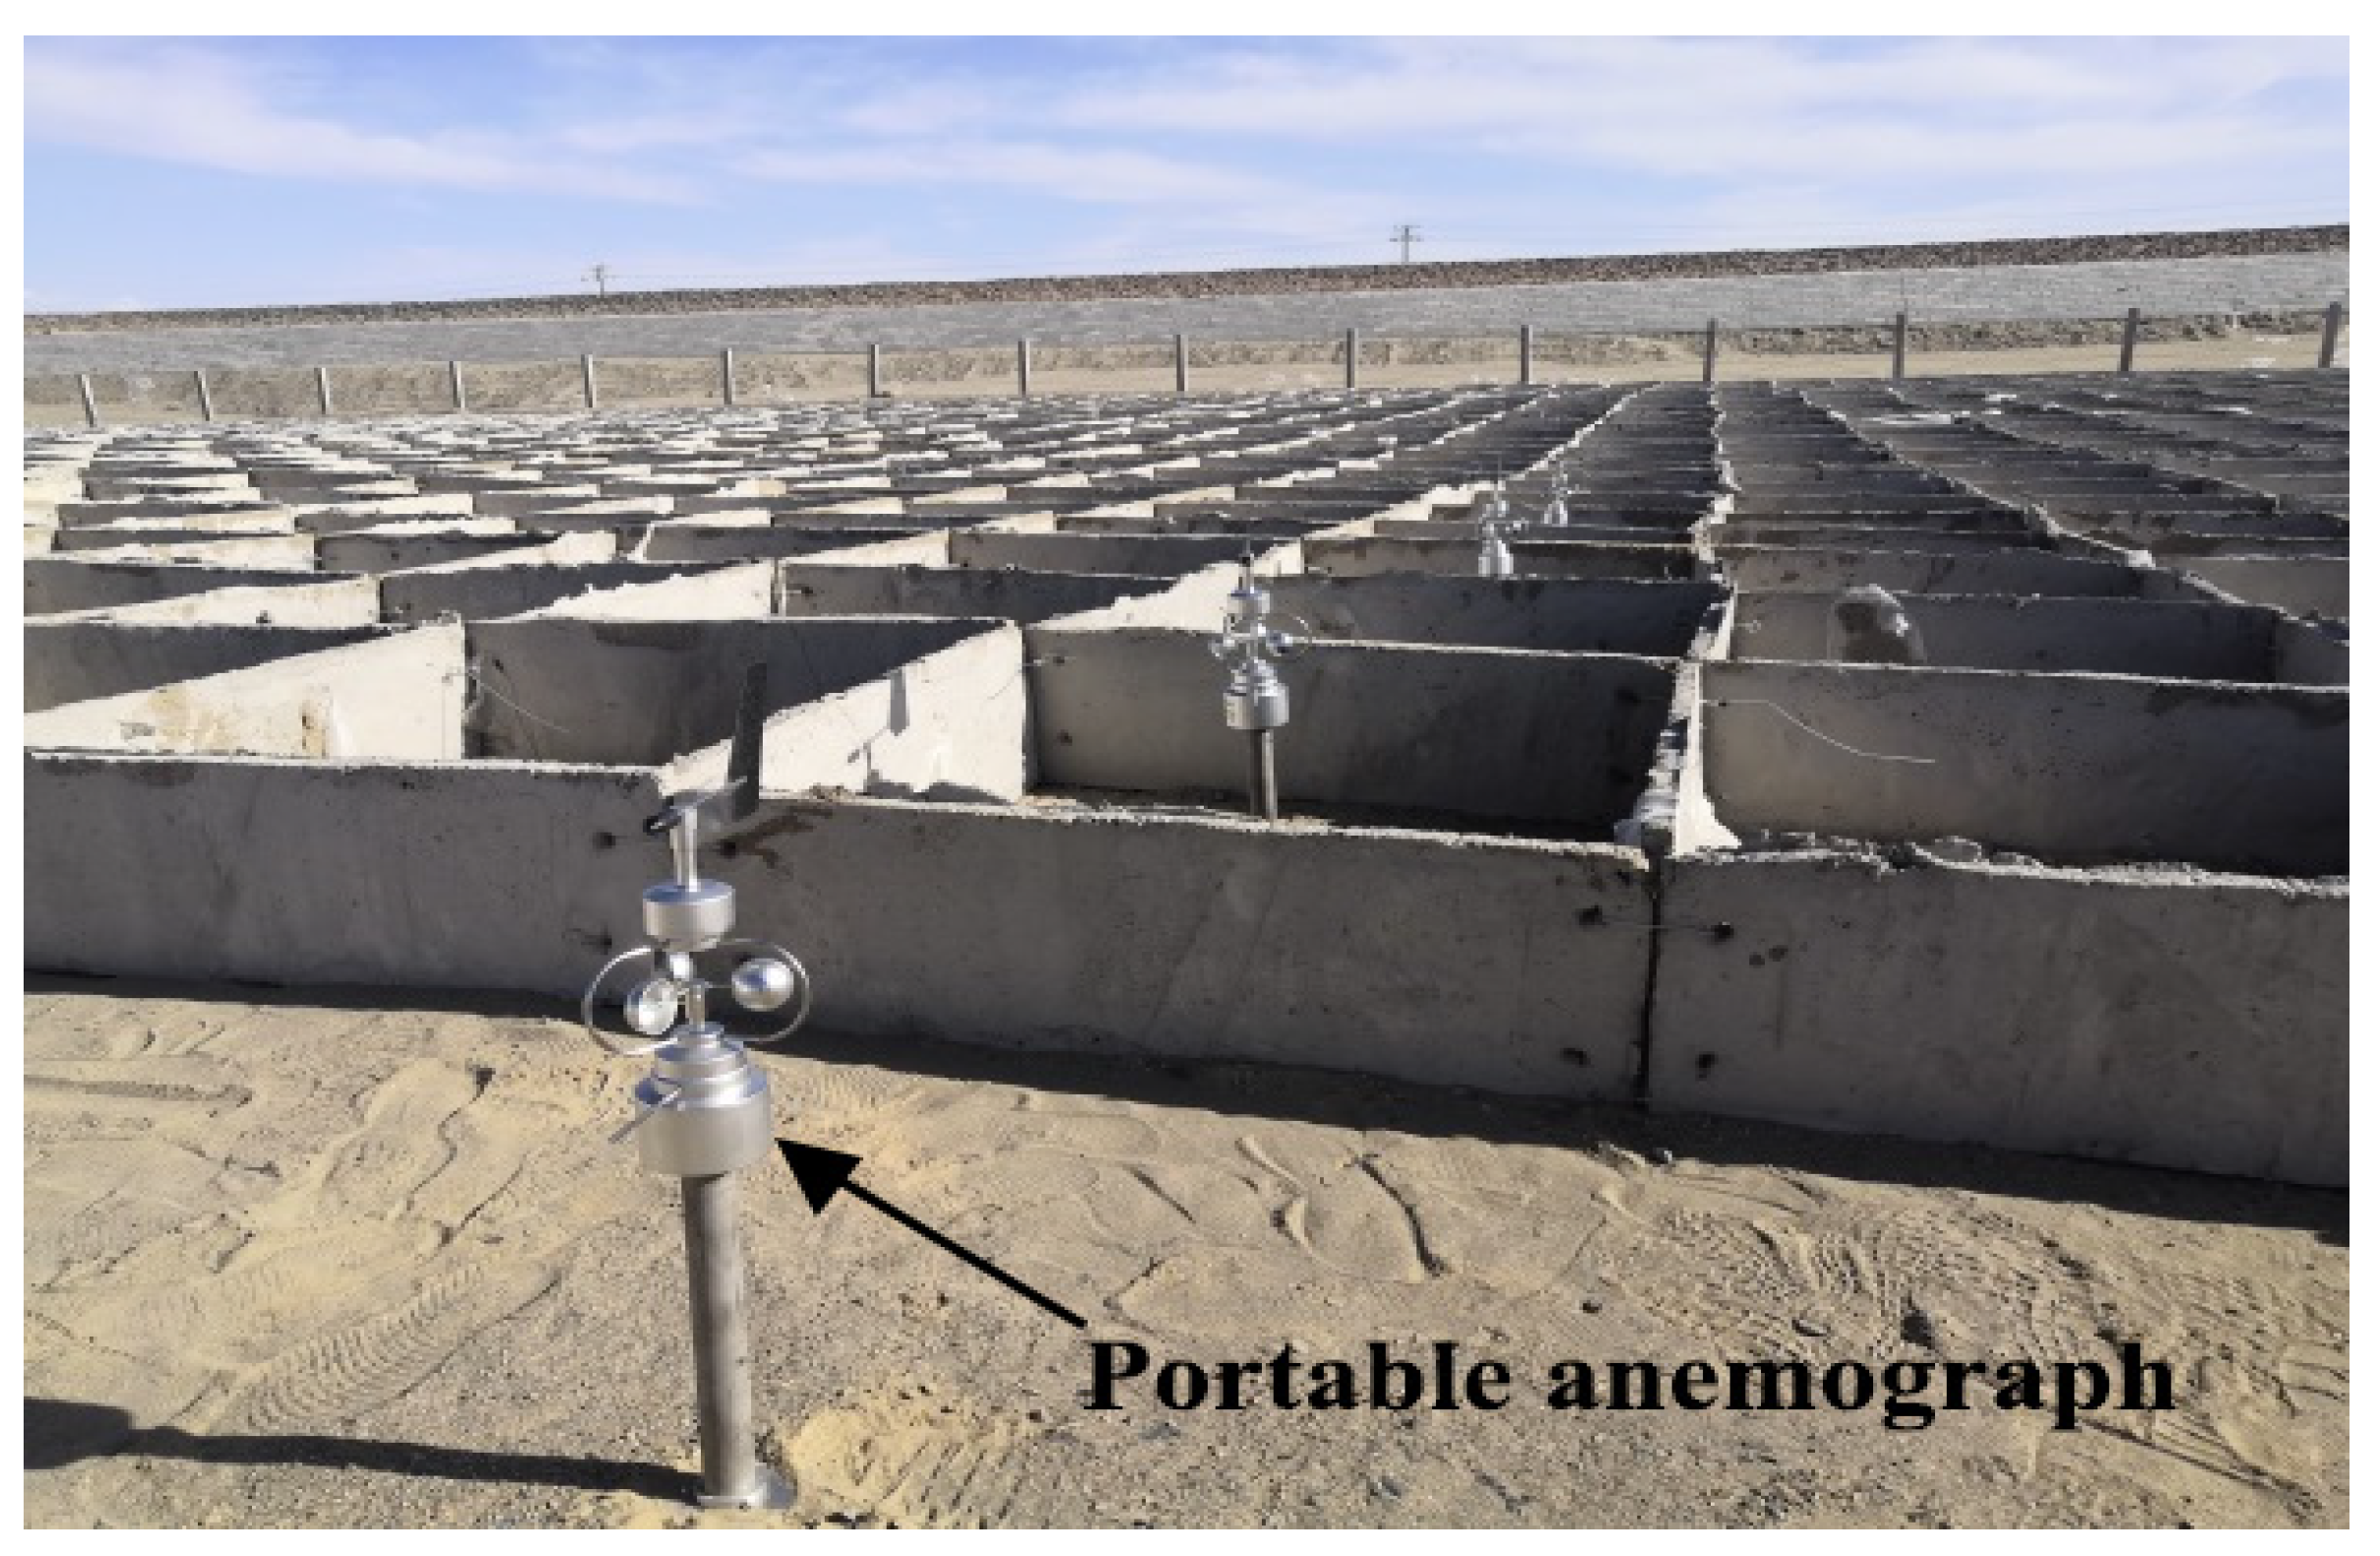
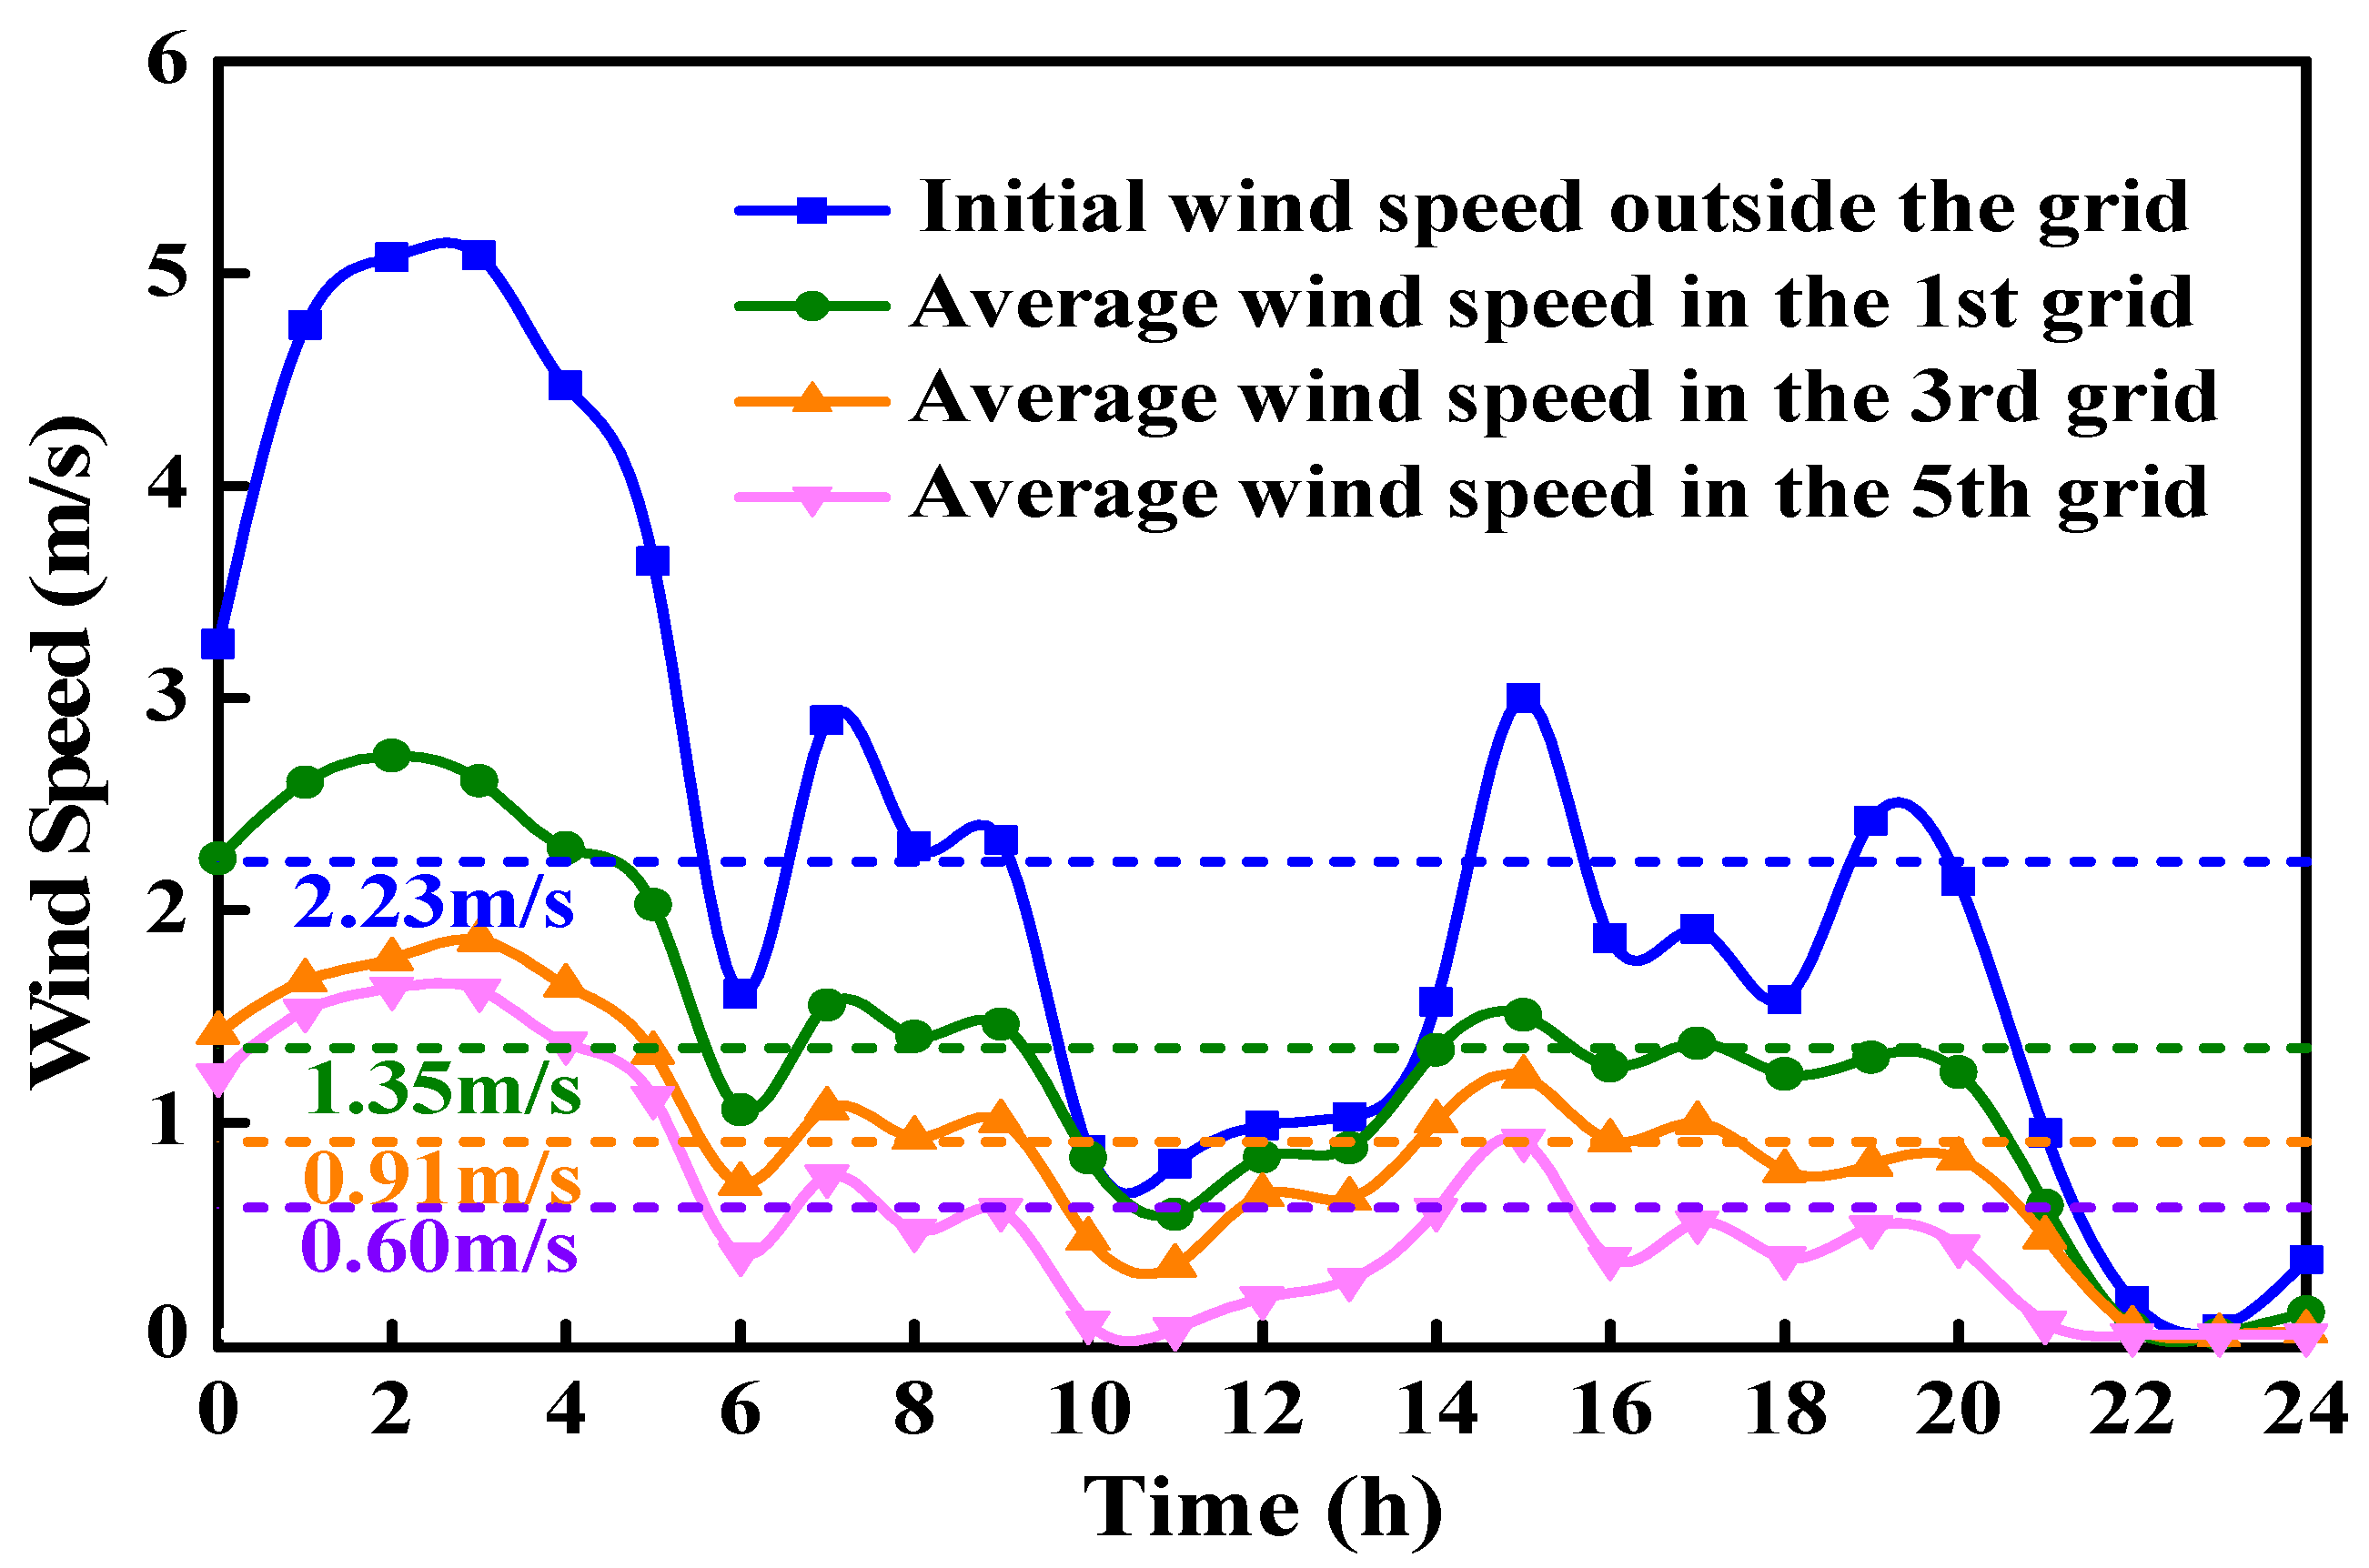
2.2. Regional Wind Conditions
3. Materials and Methods
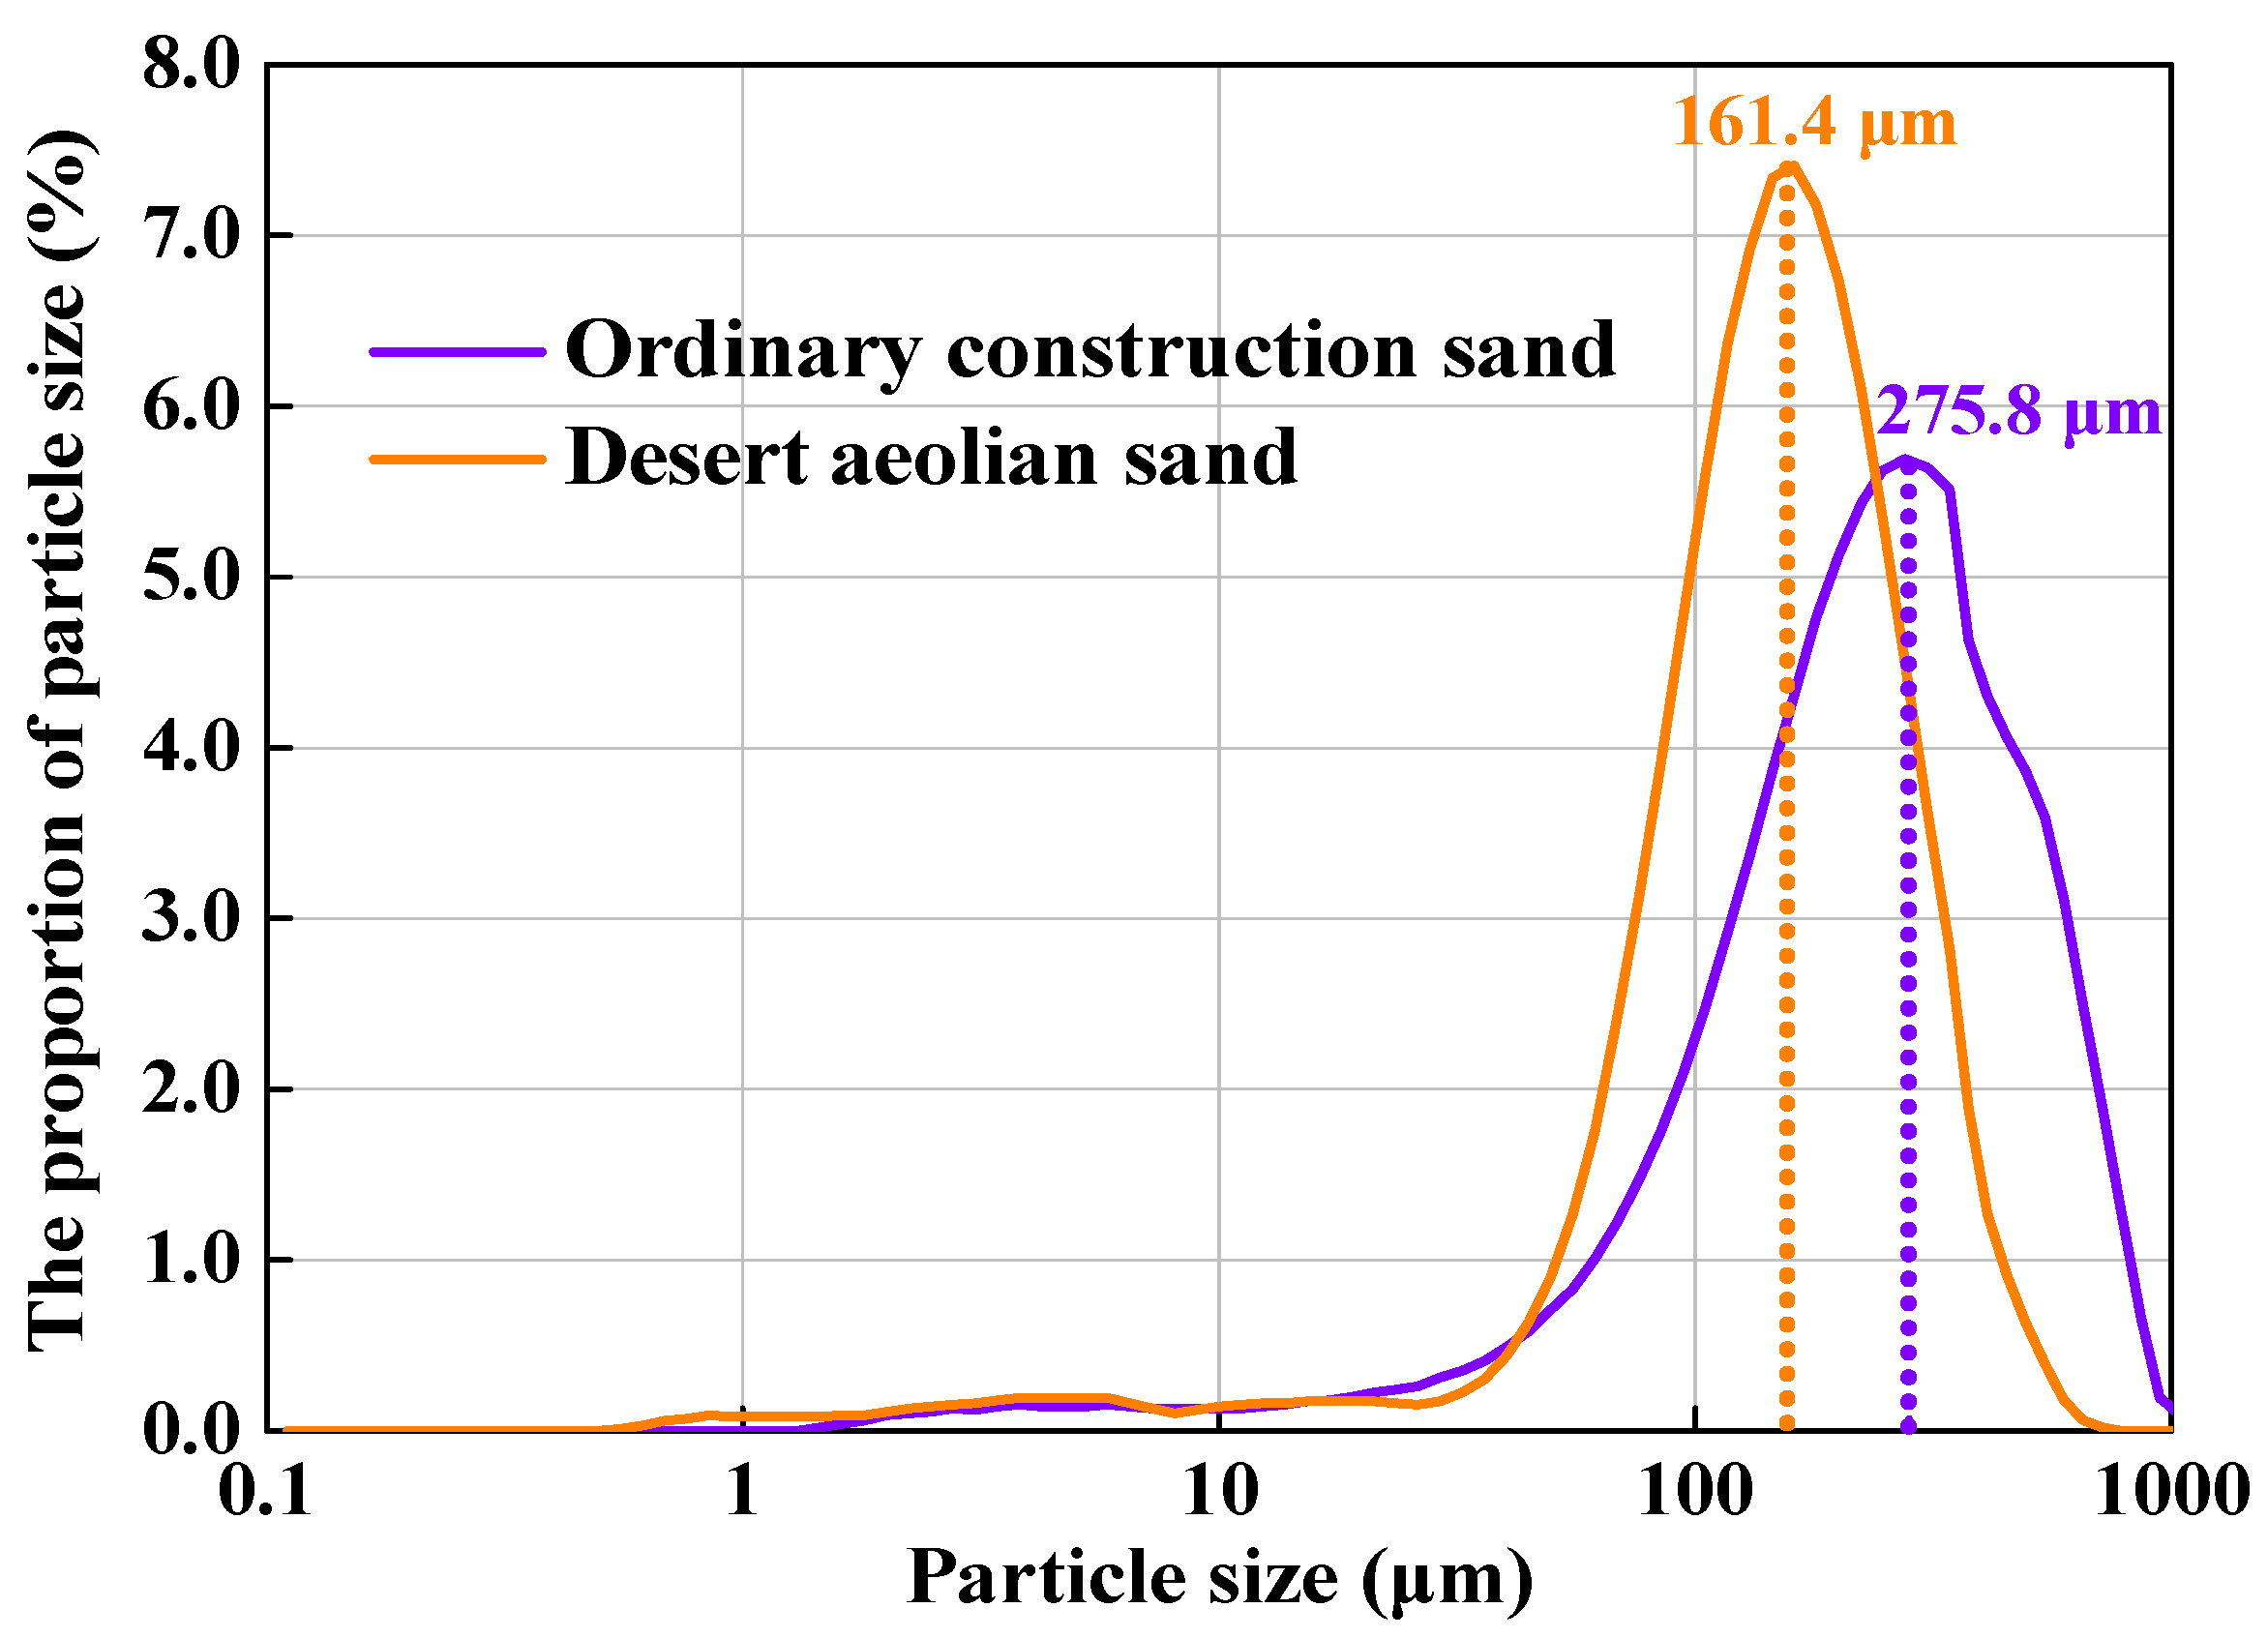
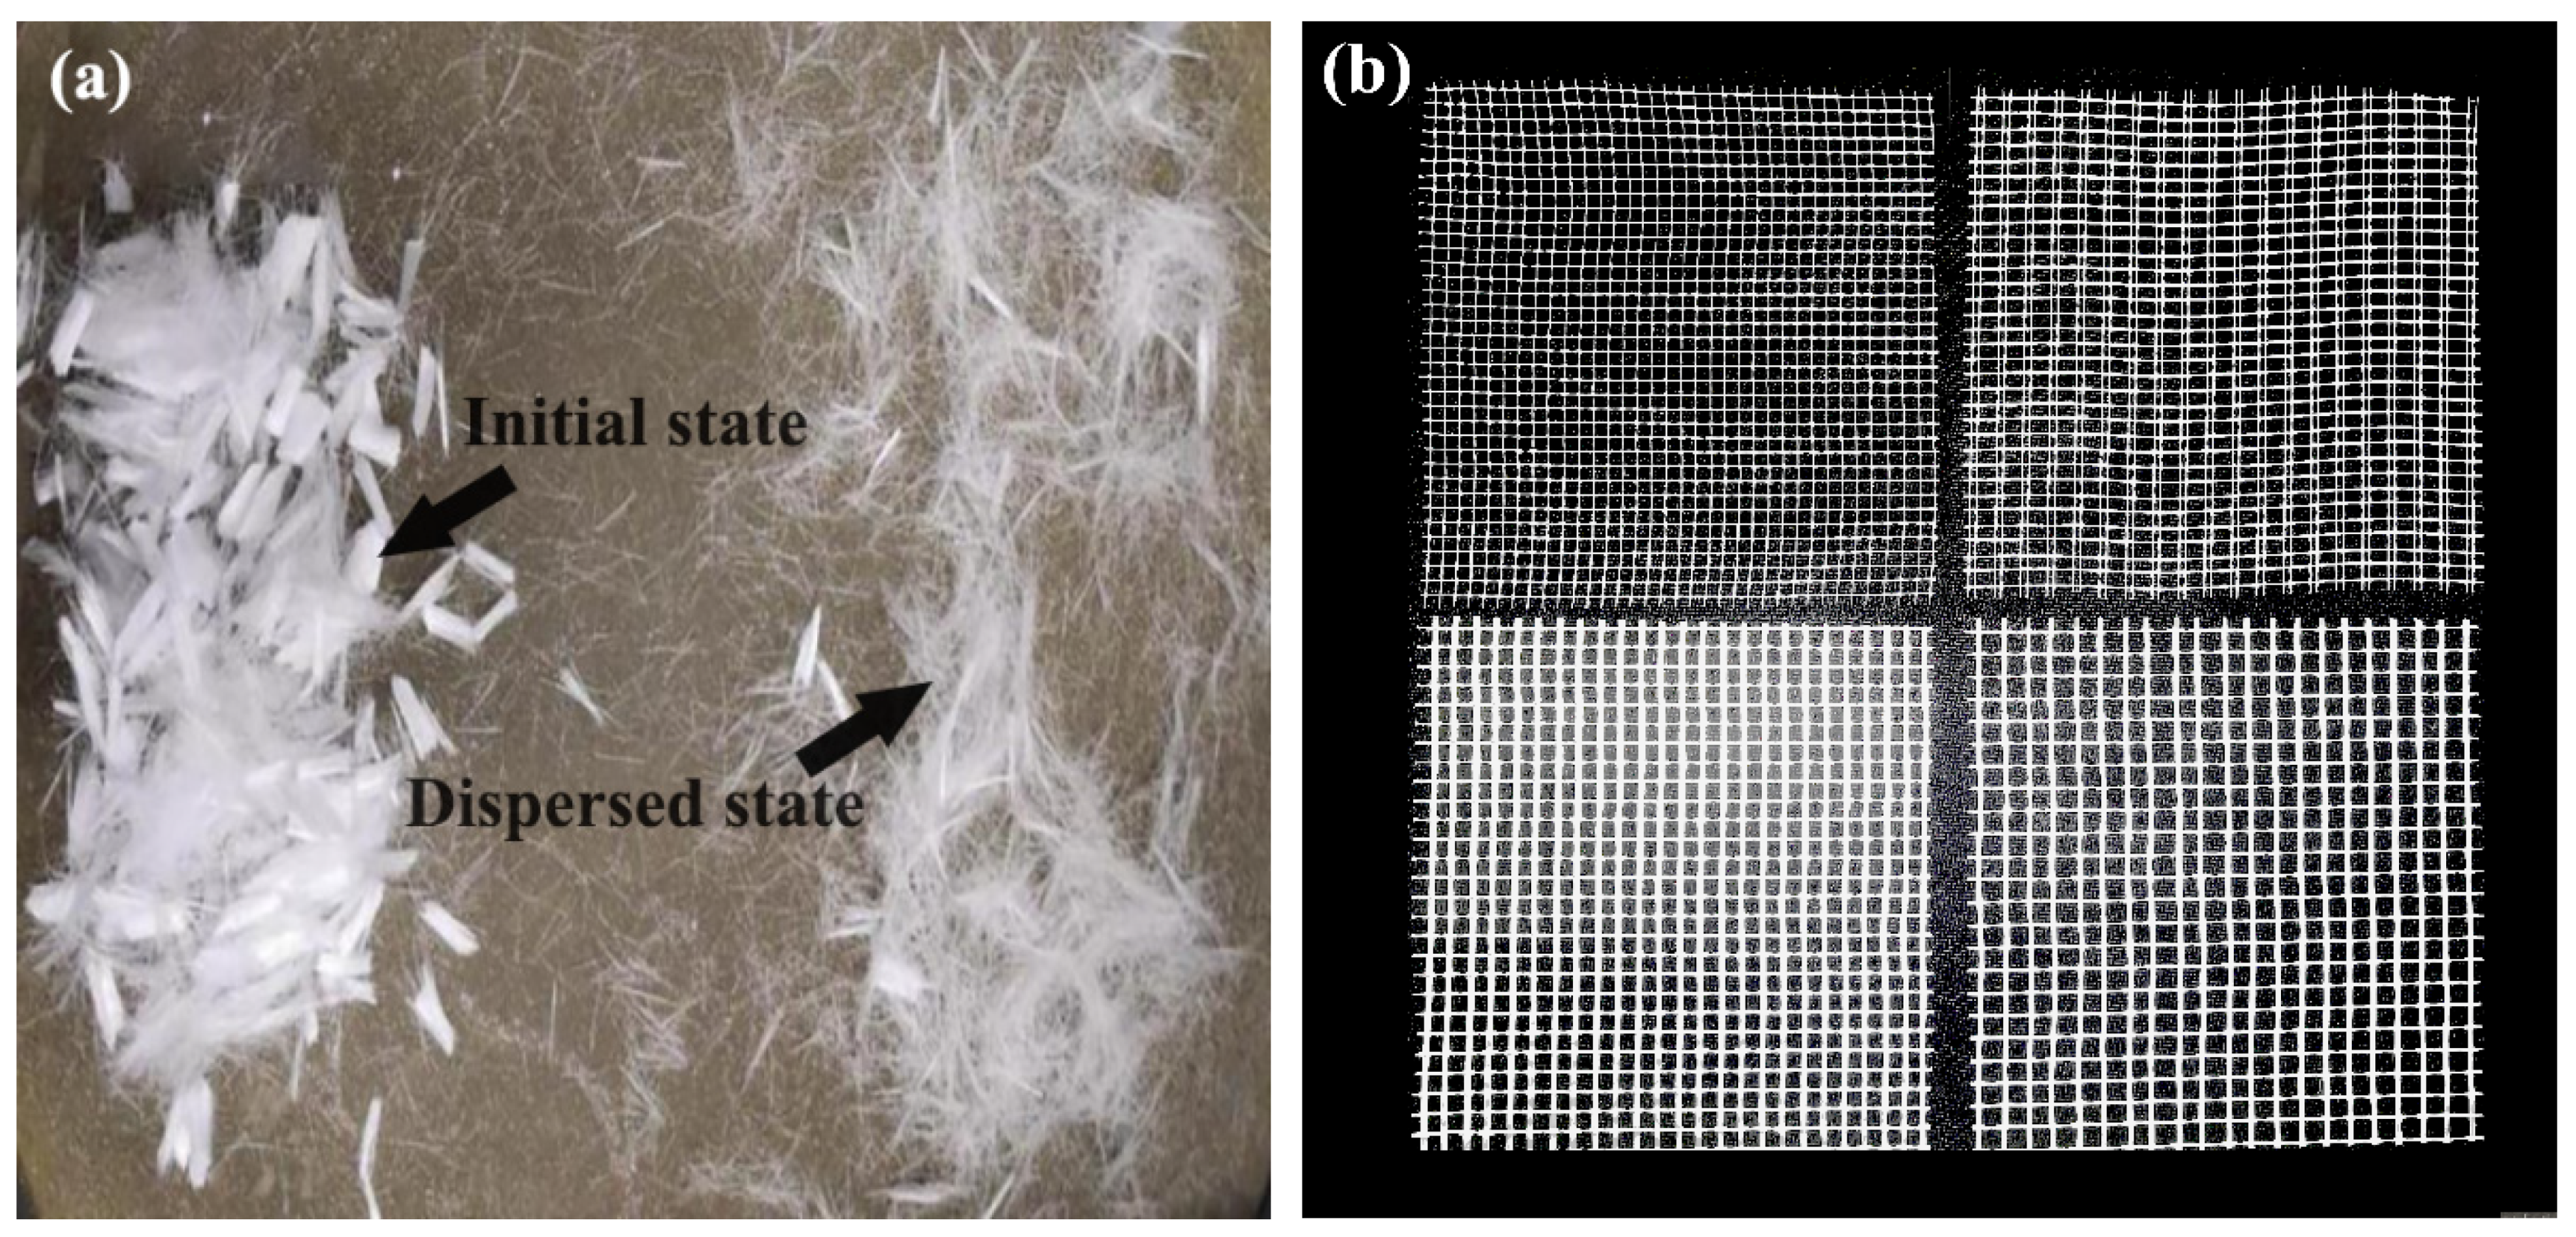
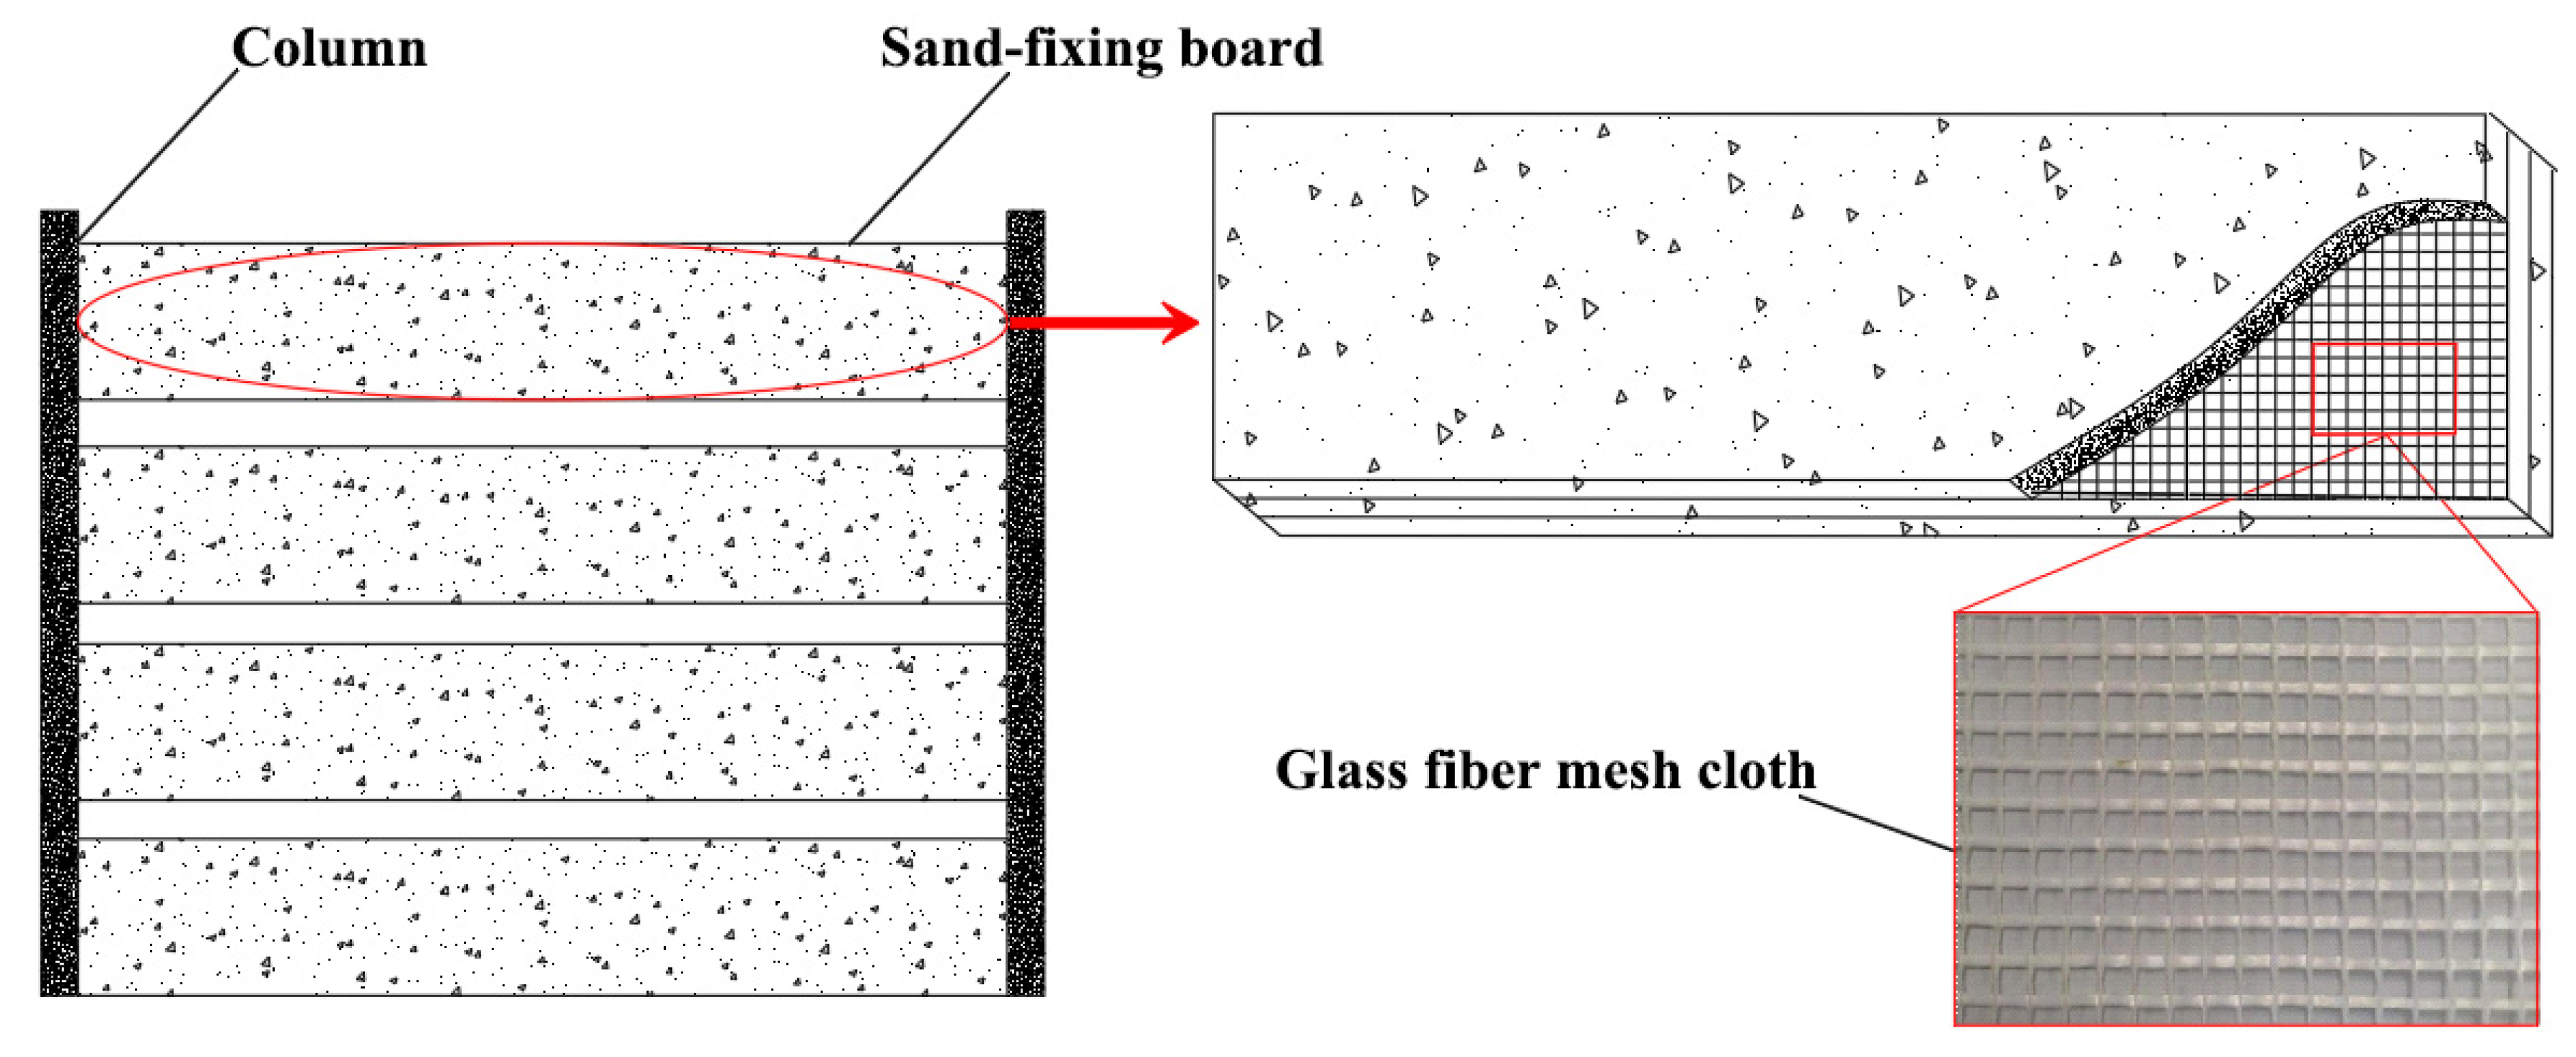
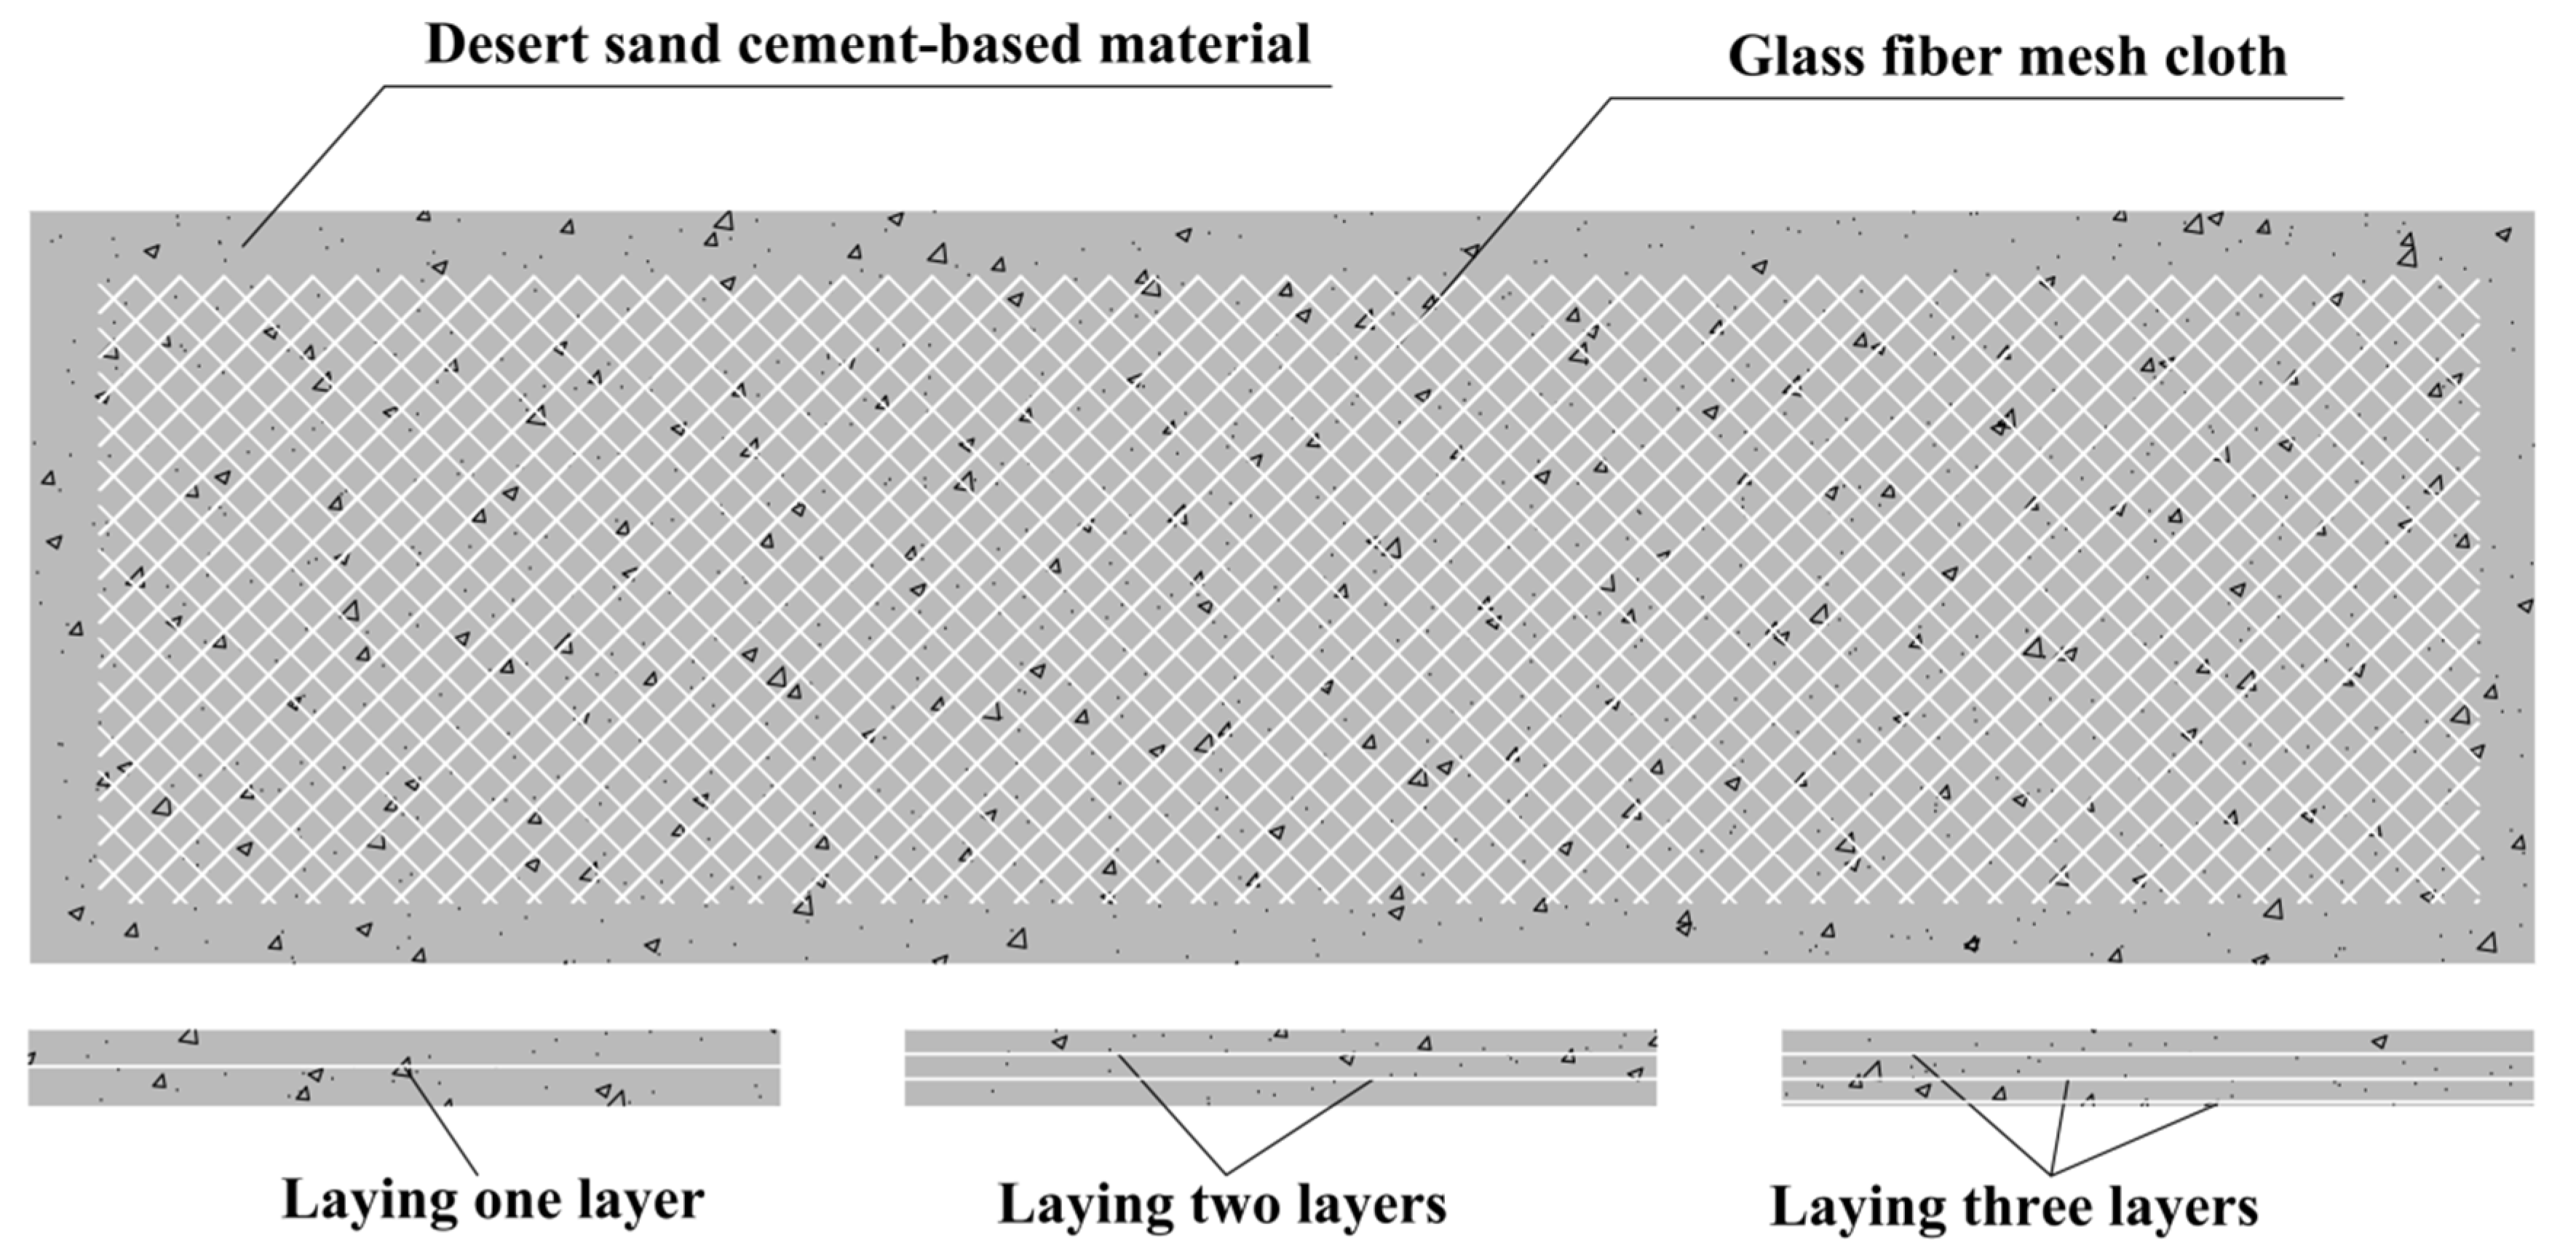
3.1. Sand-Fixing Board Material
3.2. Experimental Design and Testing
3.2.1. Mechanical Properties
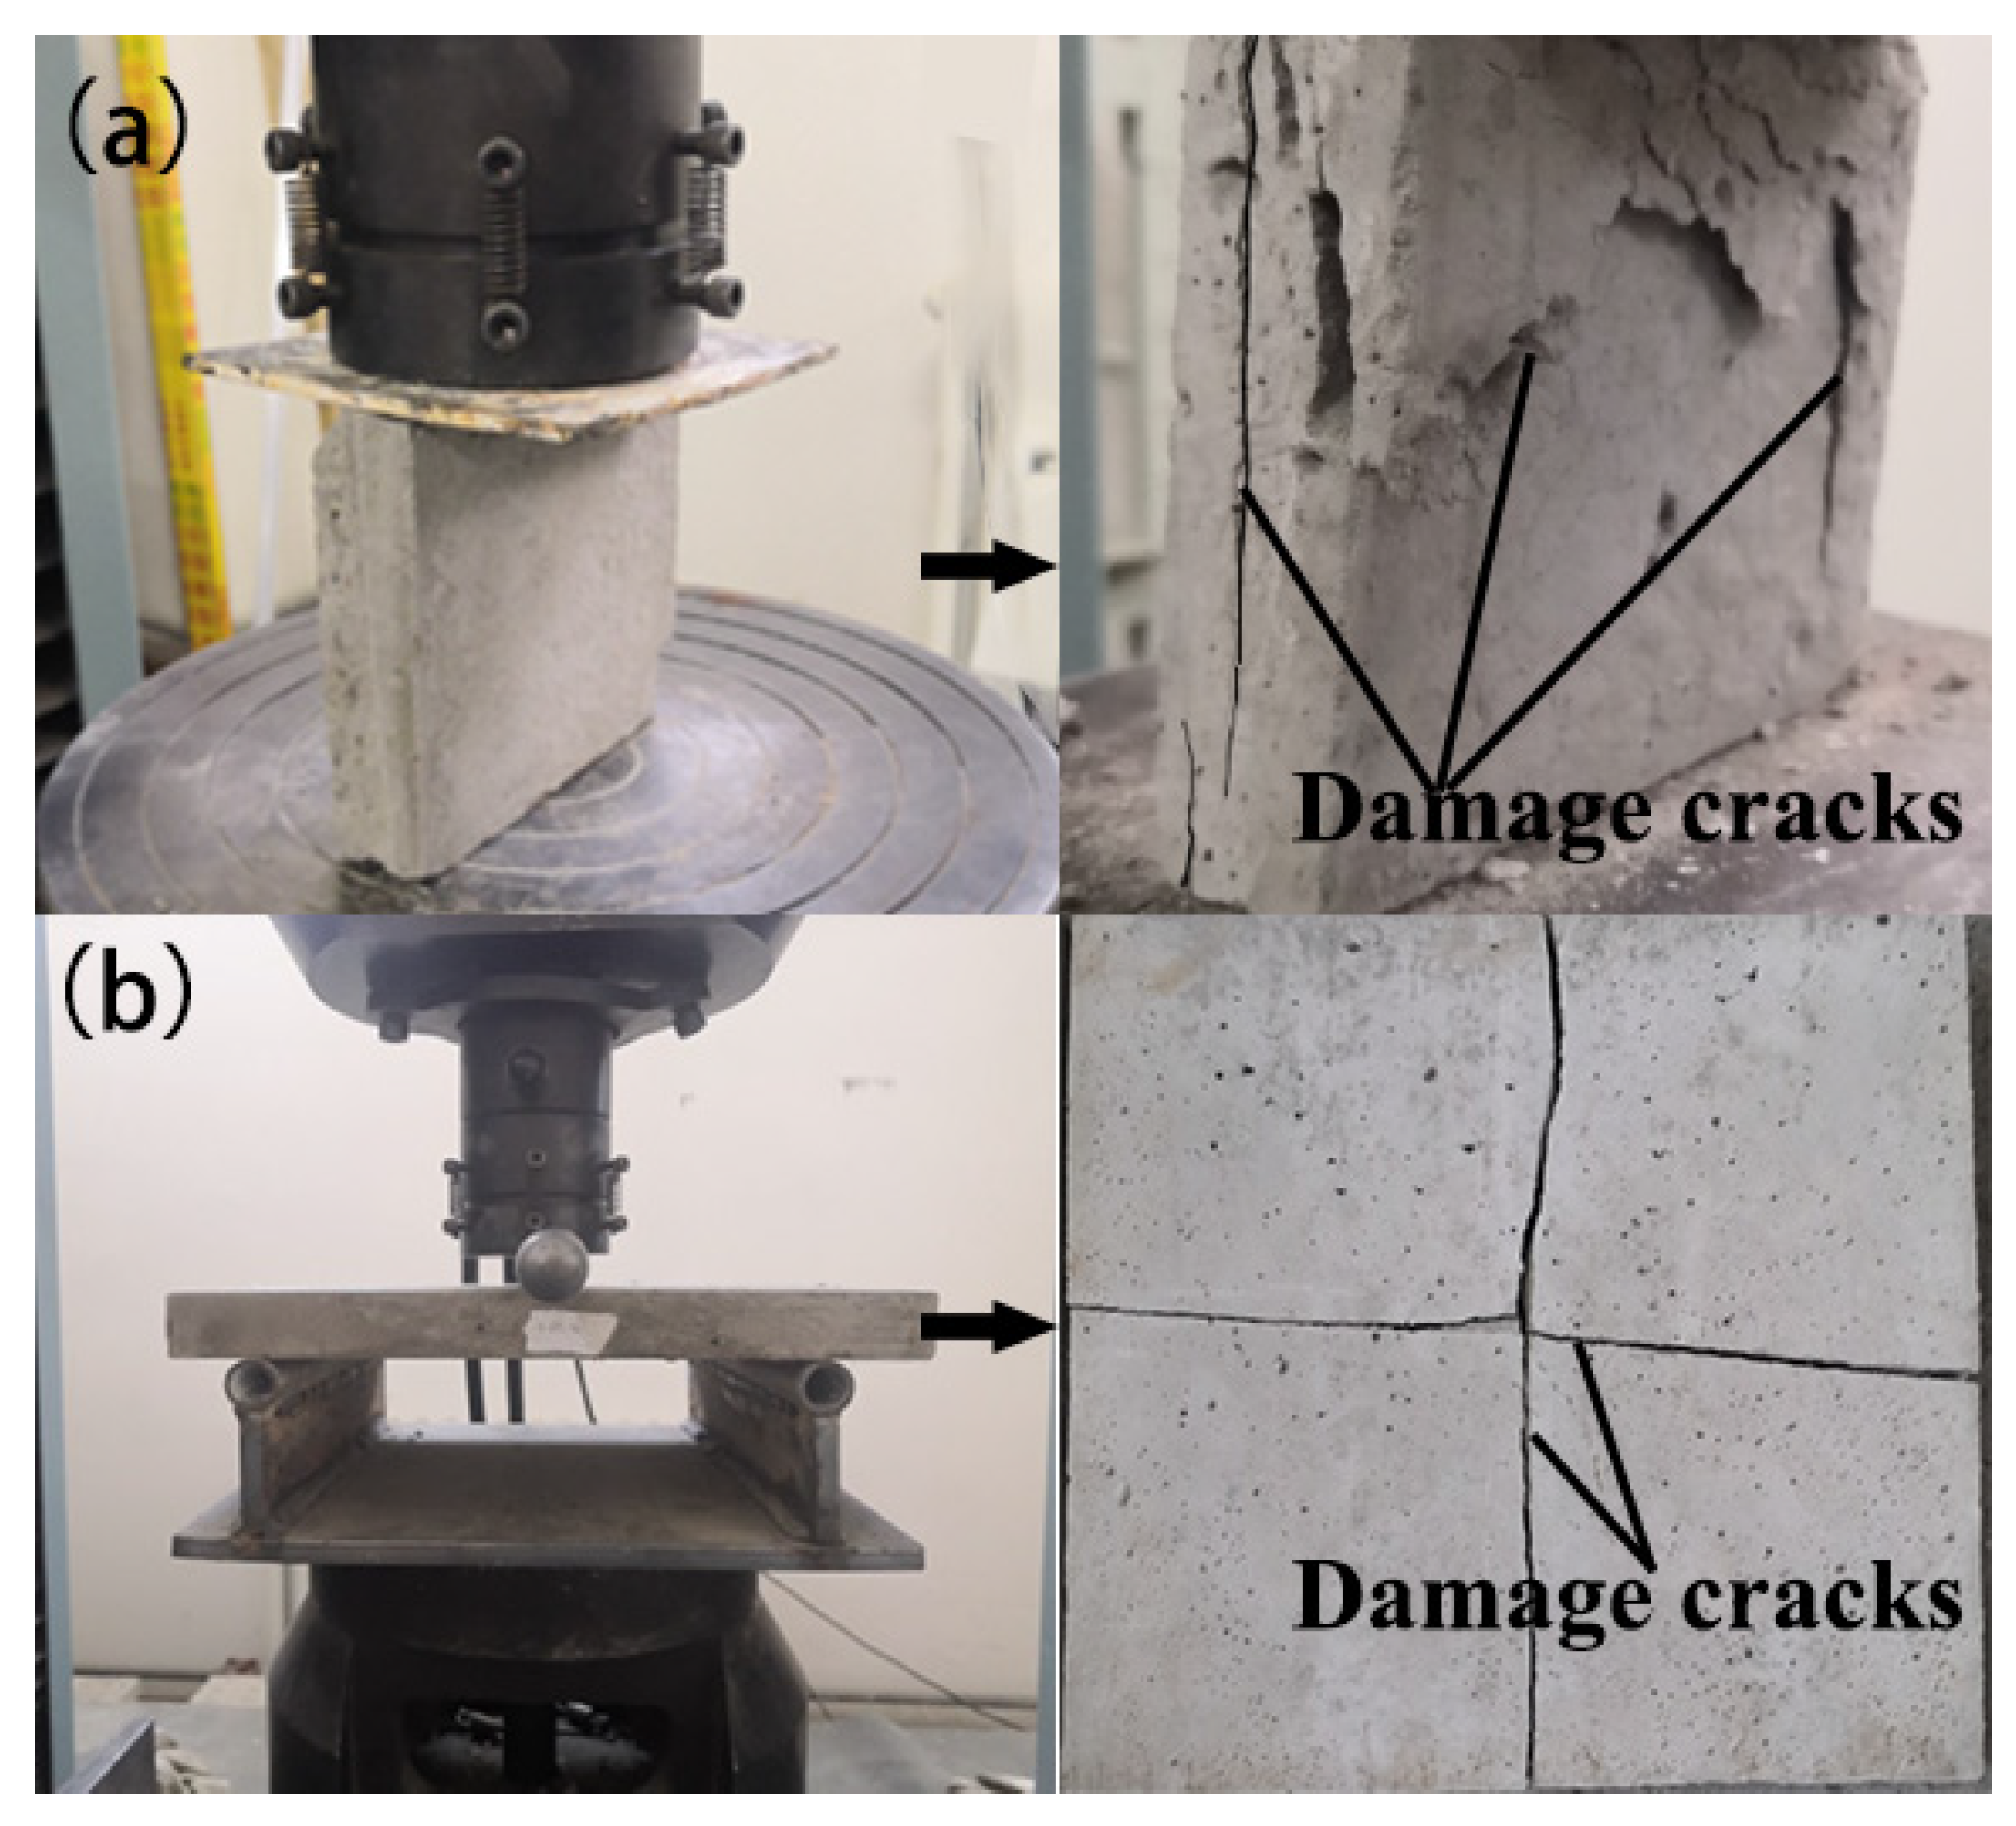
Compressive Strength
Flexural Strength
3.2.2. Durability
4. Results and Discussion
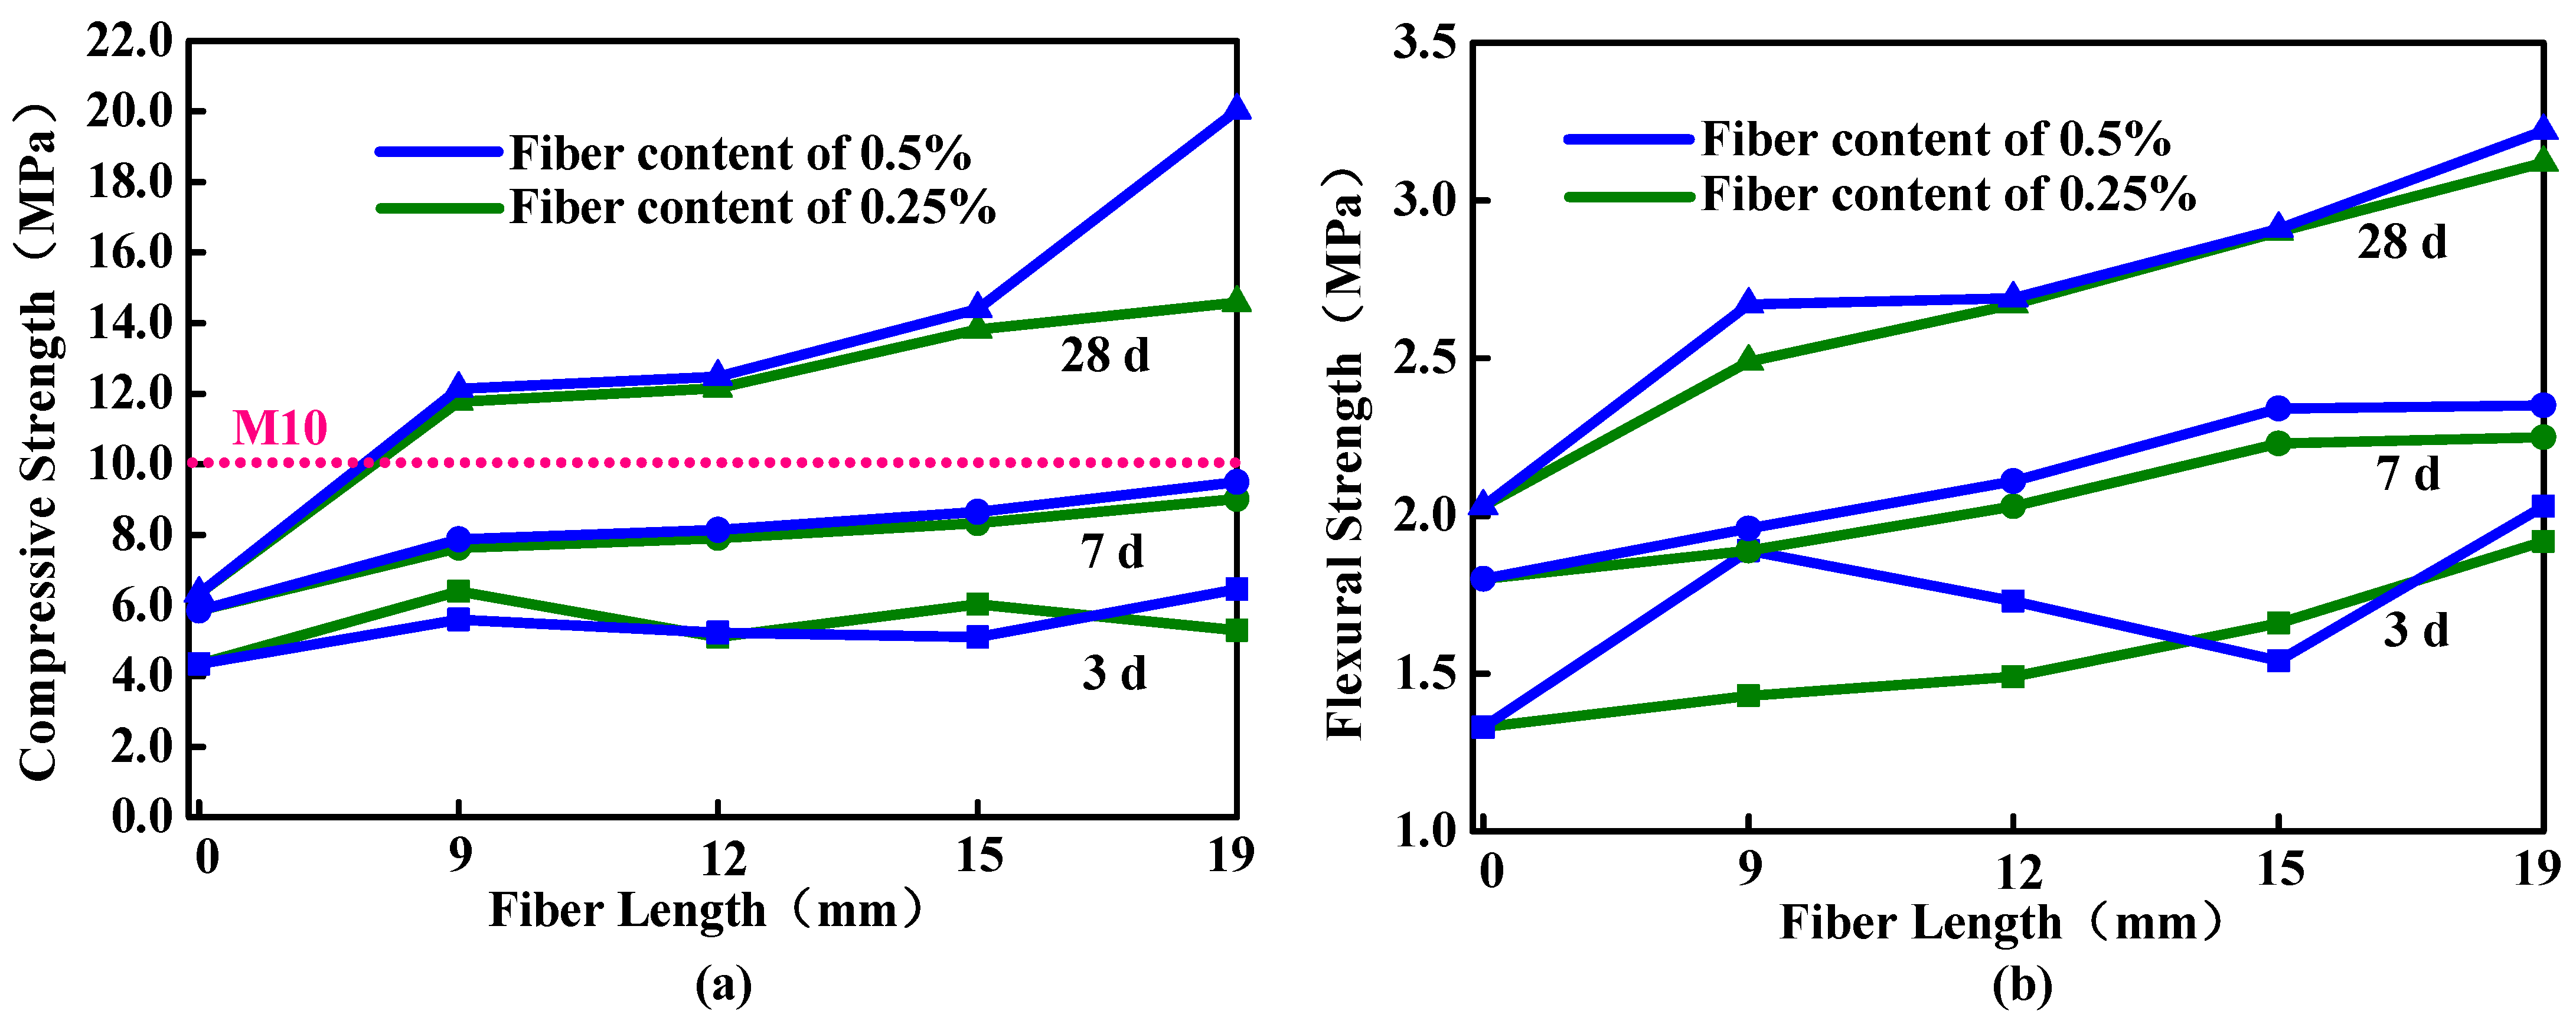
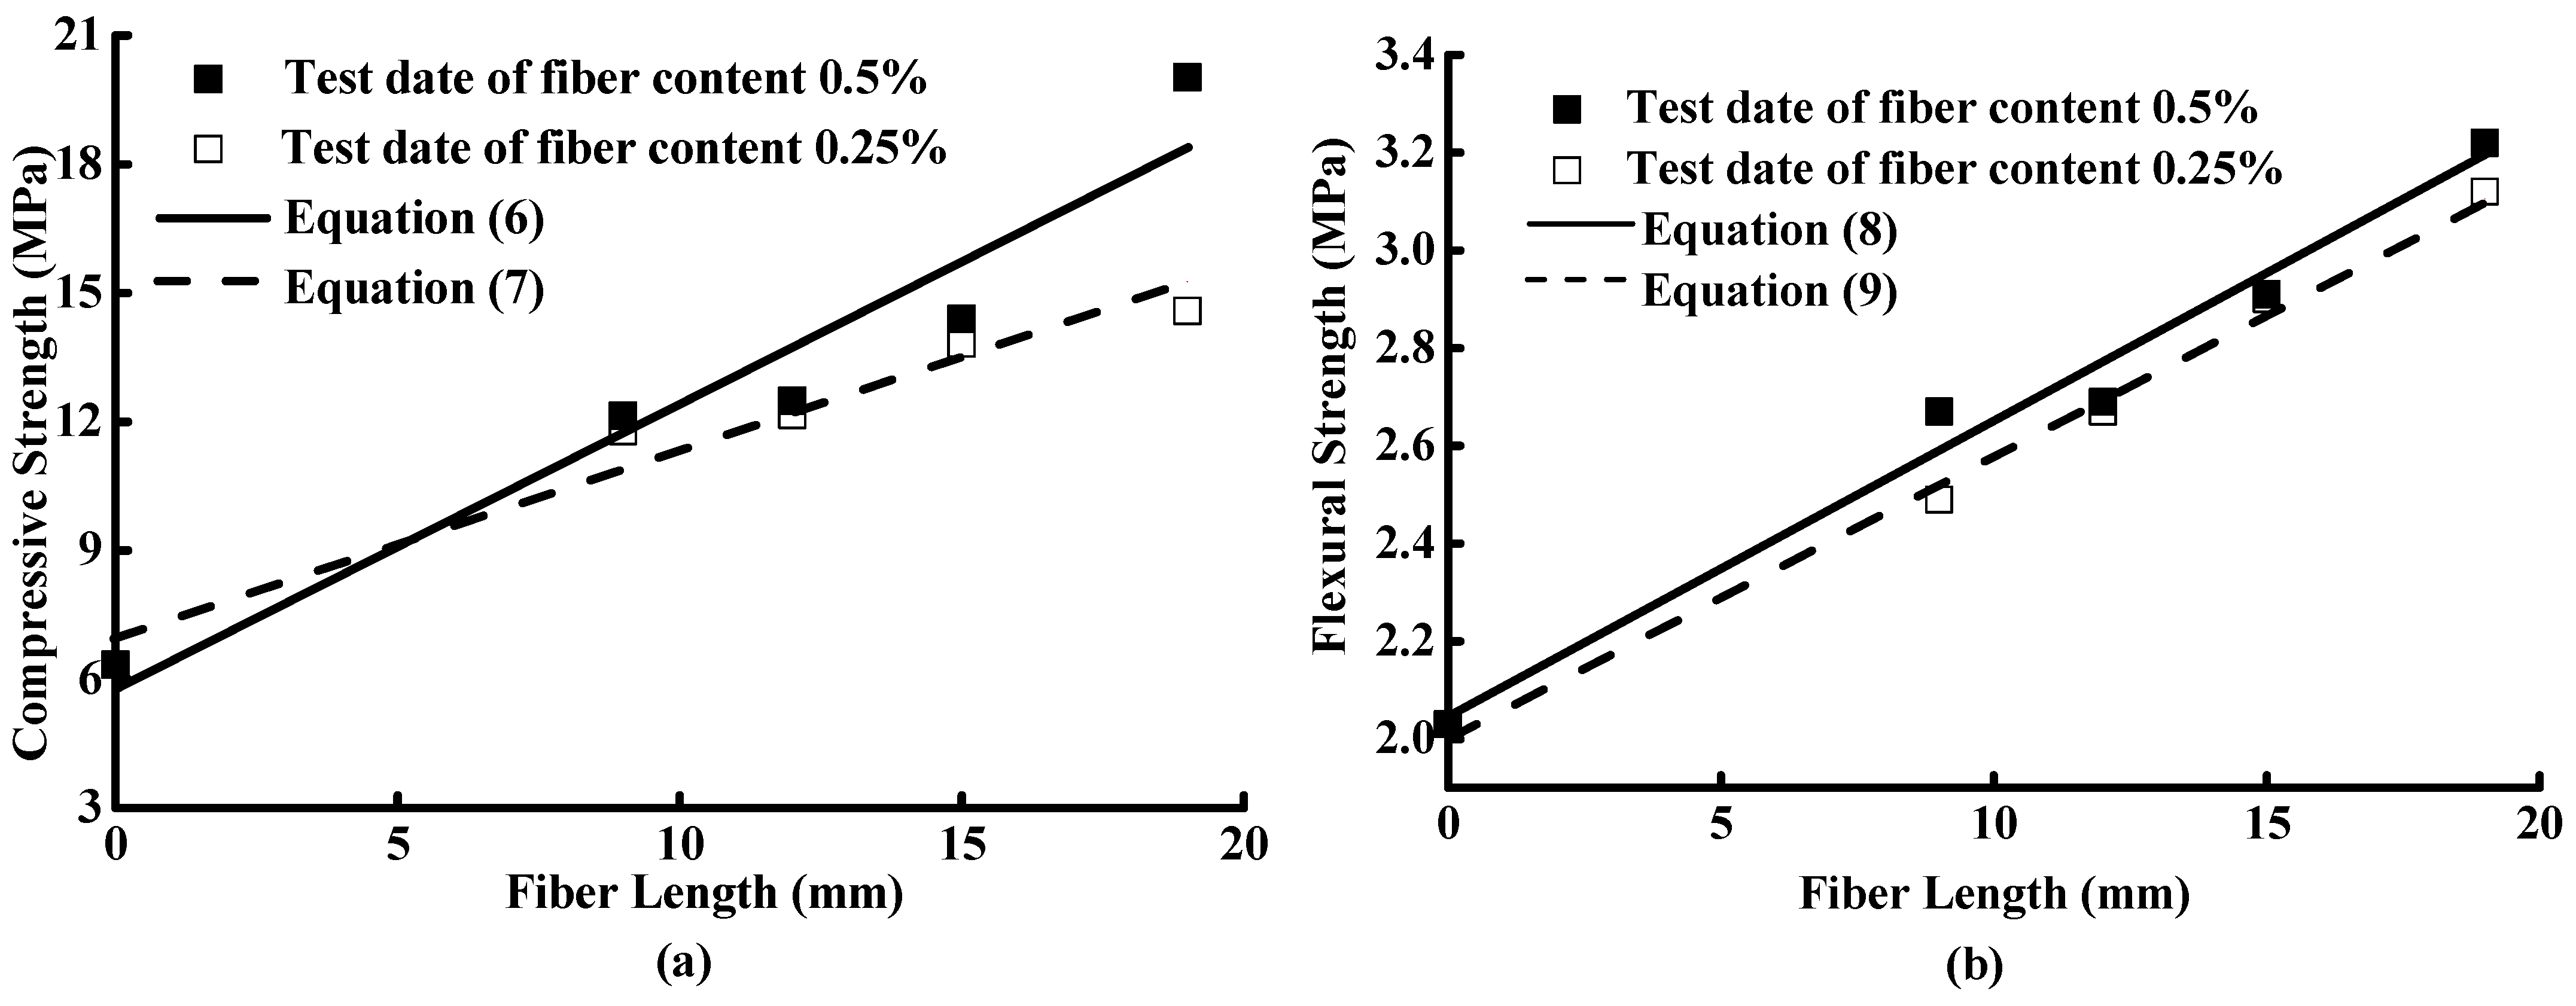
4.1. Analysis of Mechanical Properties
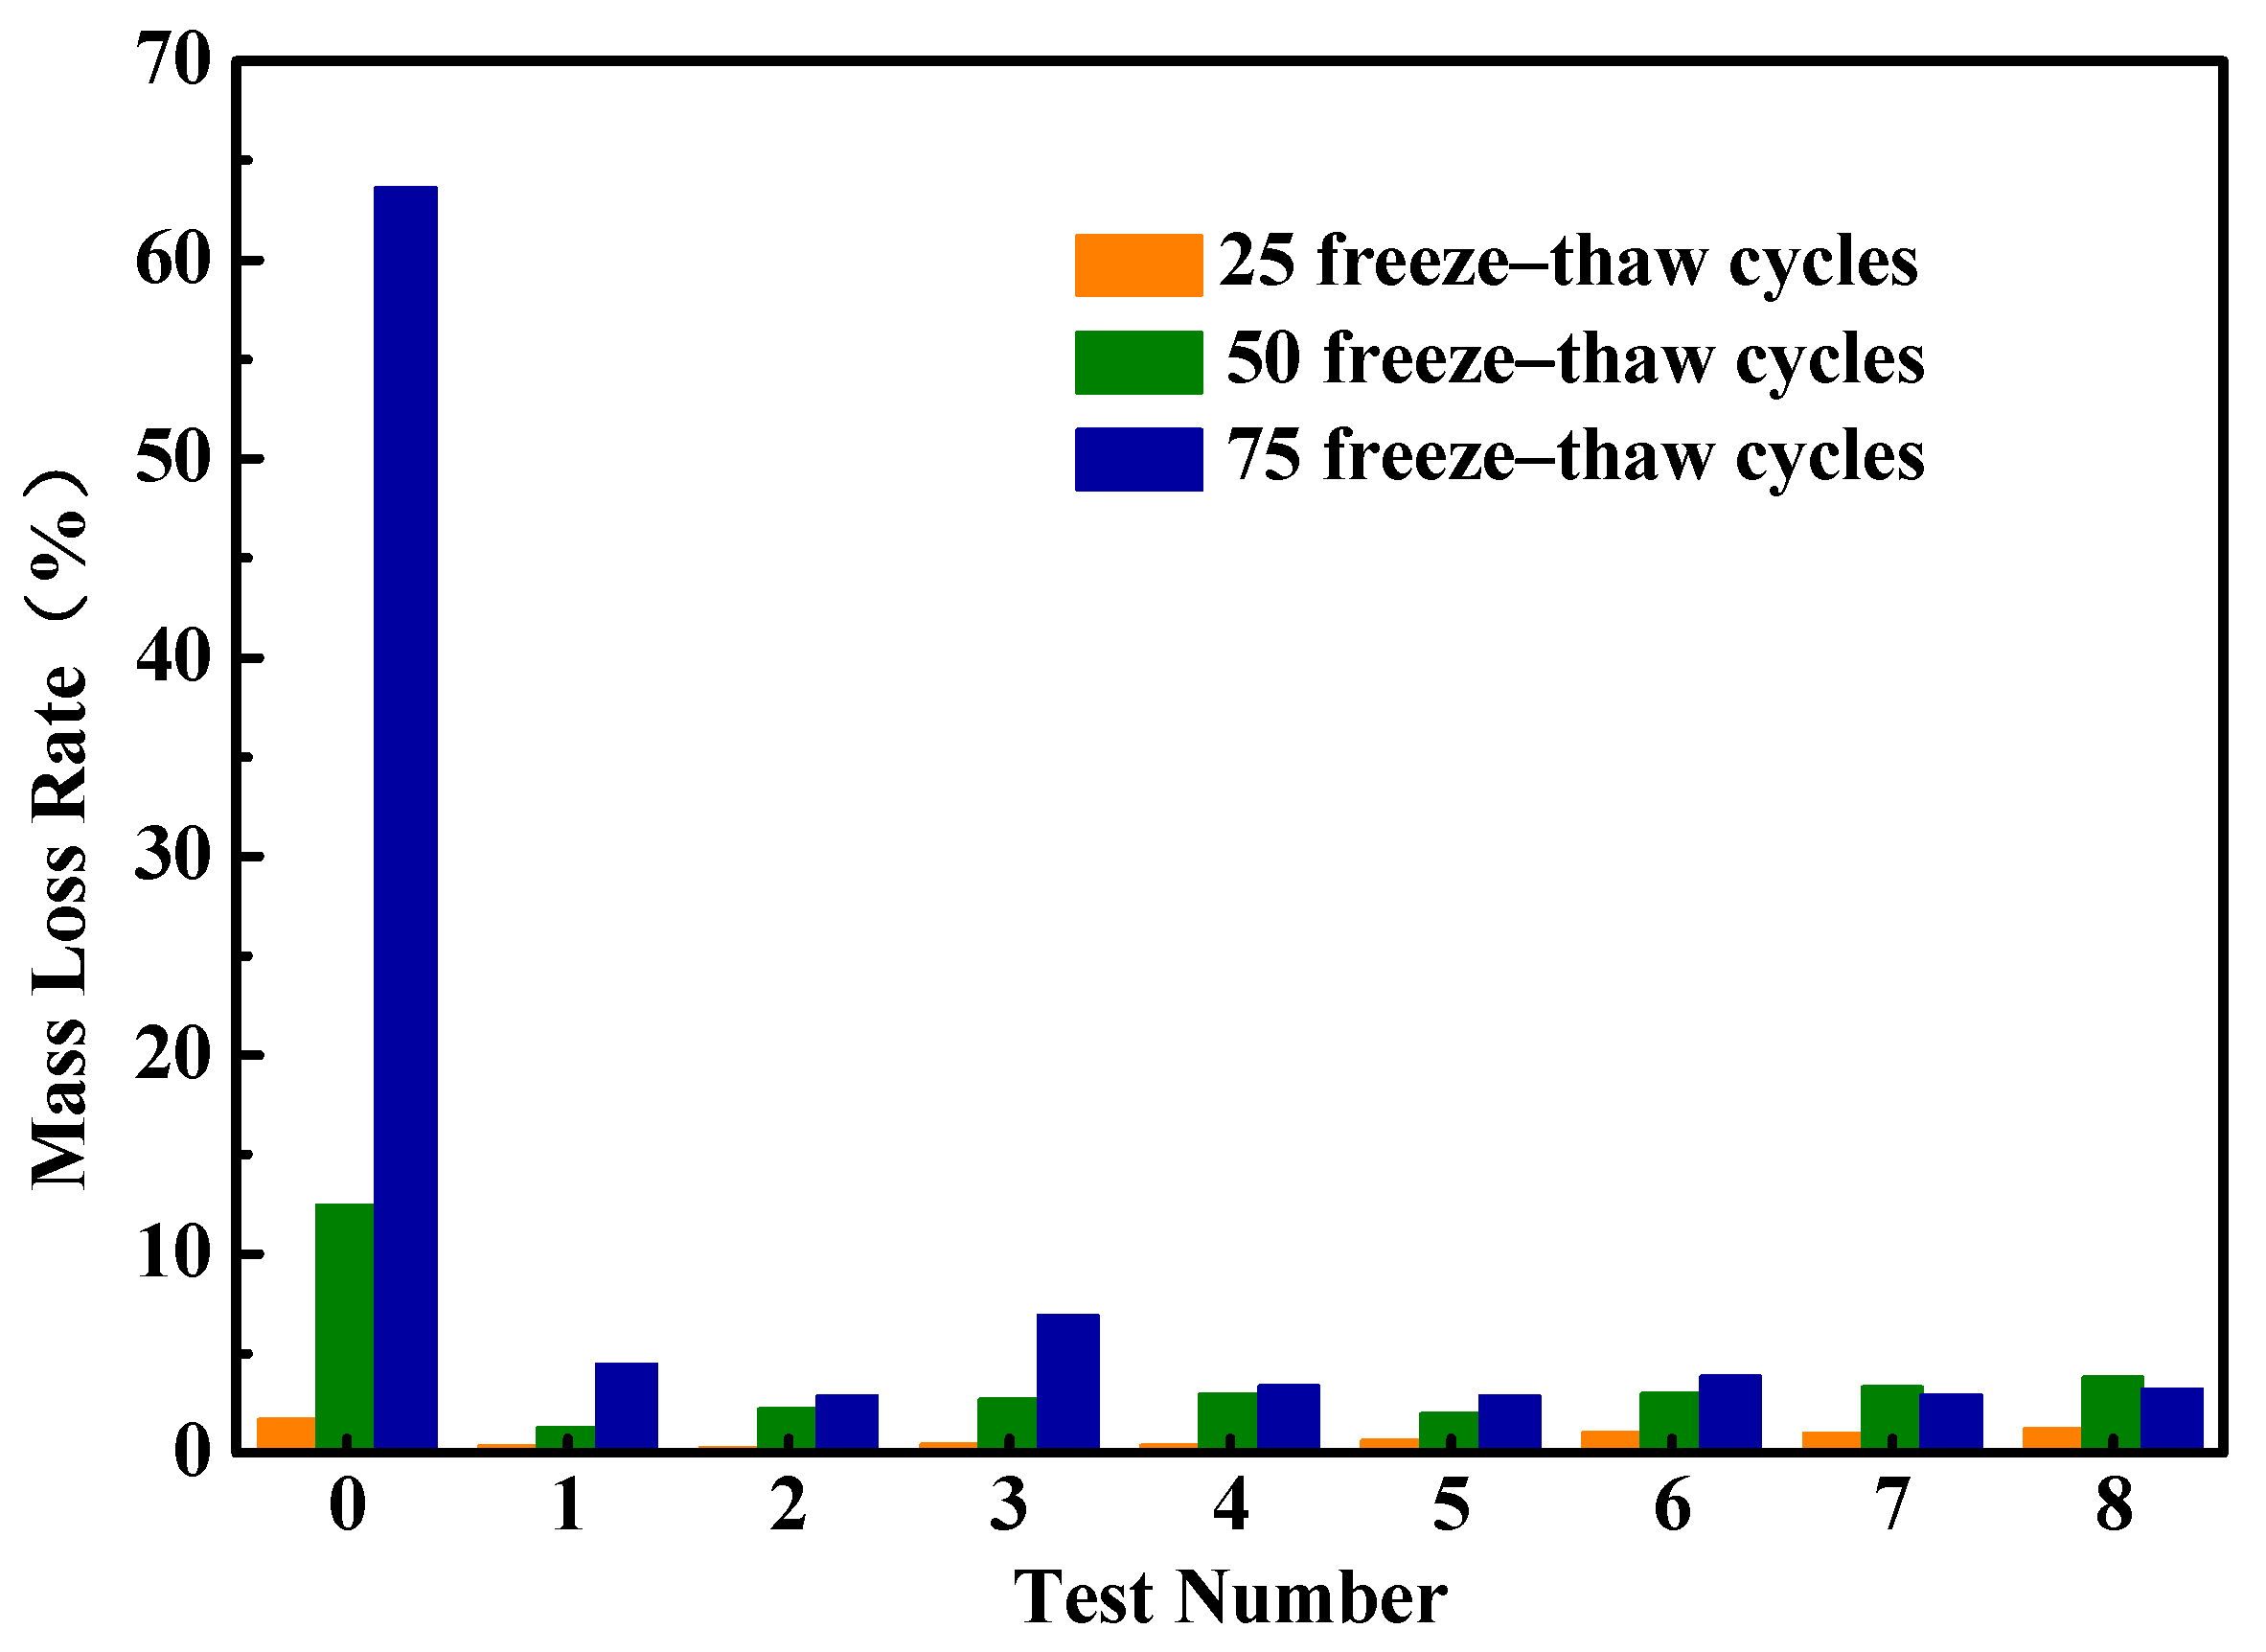
4.2. Durability Analysis
4.3. Mechanism Analysis
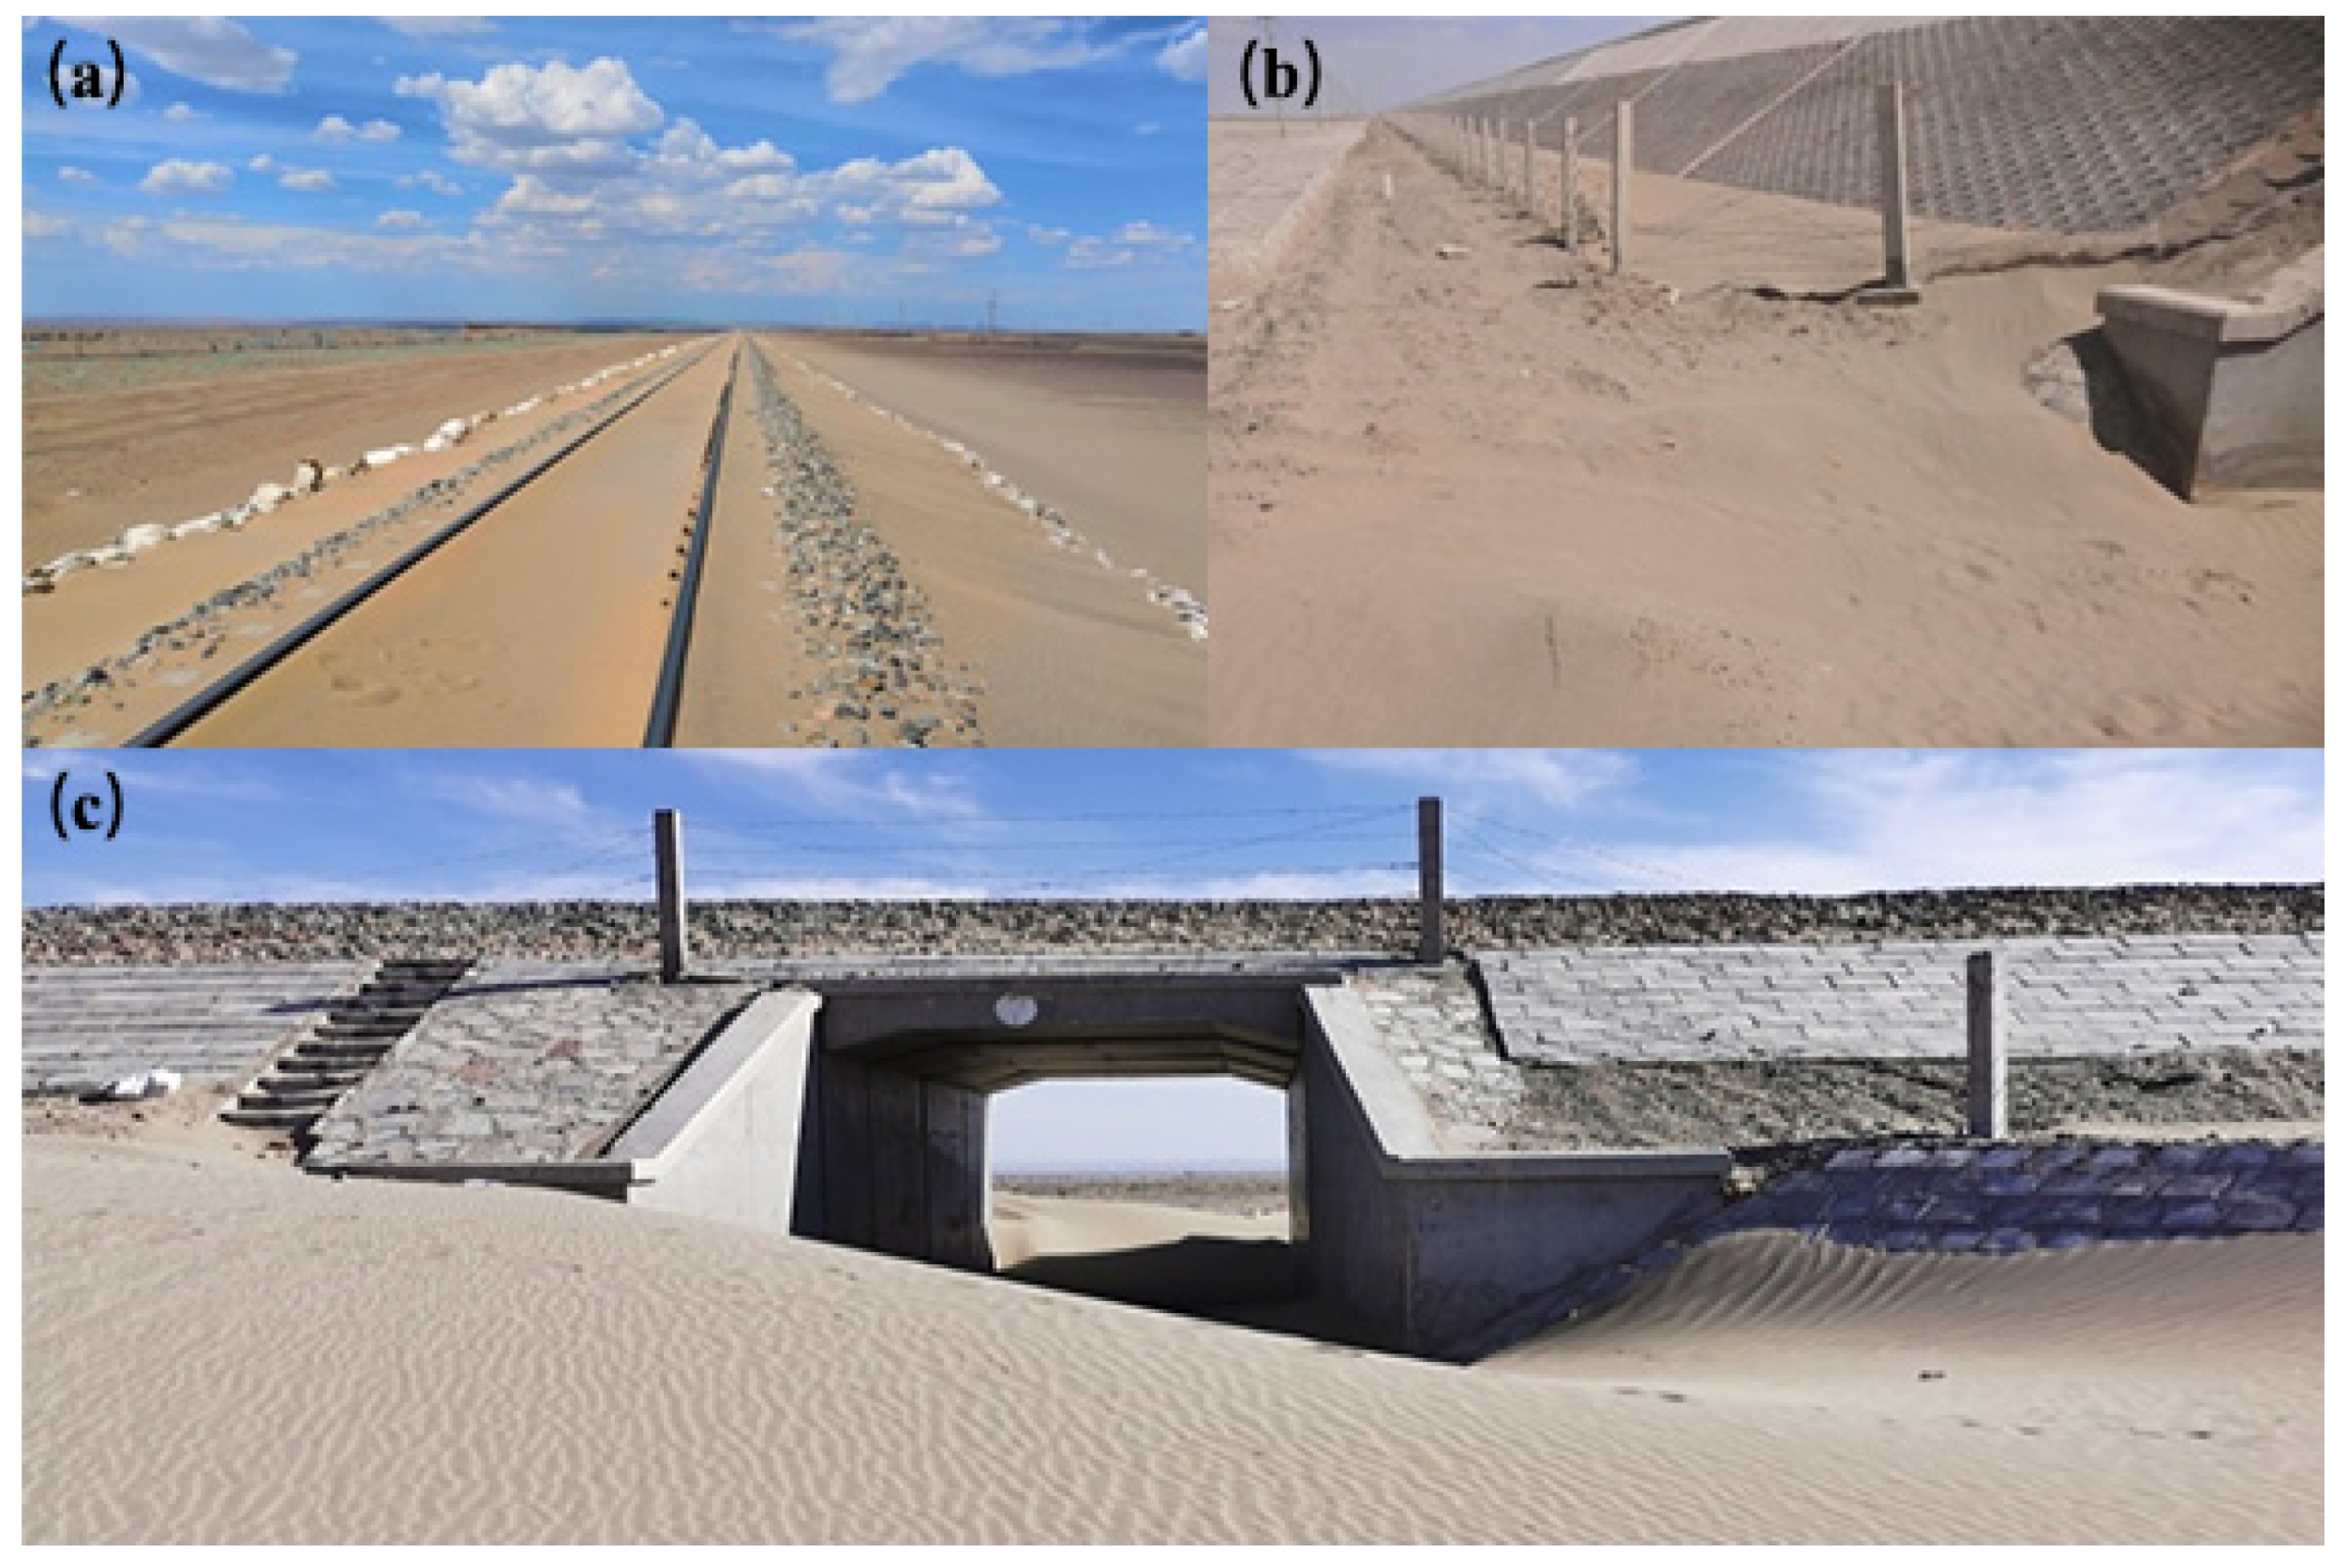
5. Engineering Applications
5.1. Construction Technology
- (1)
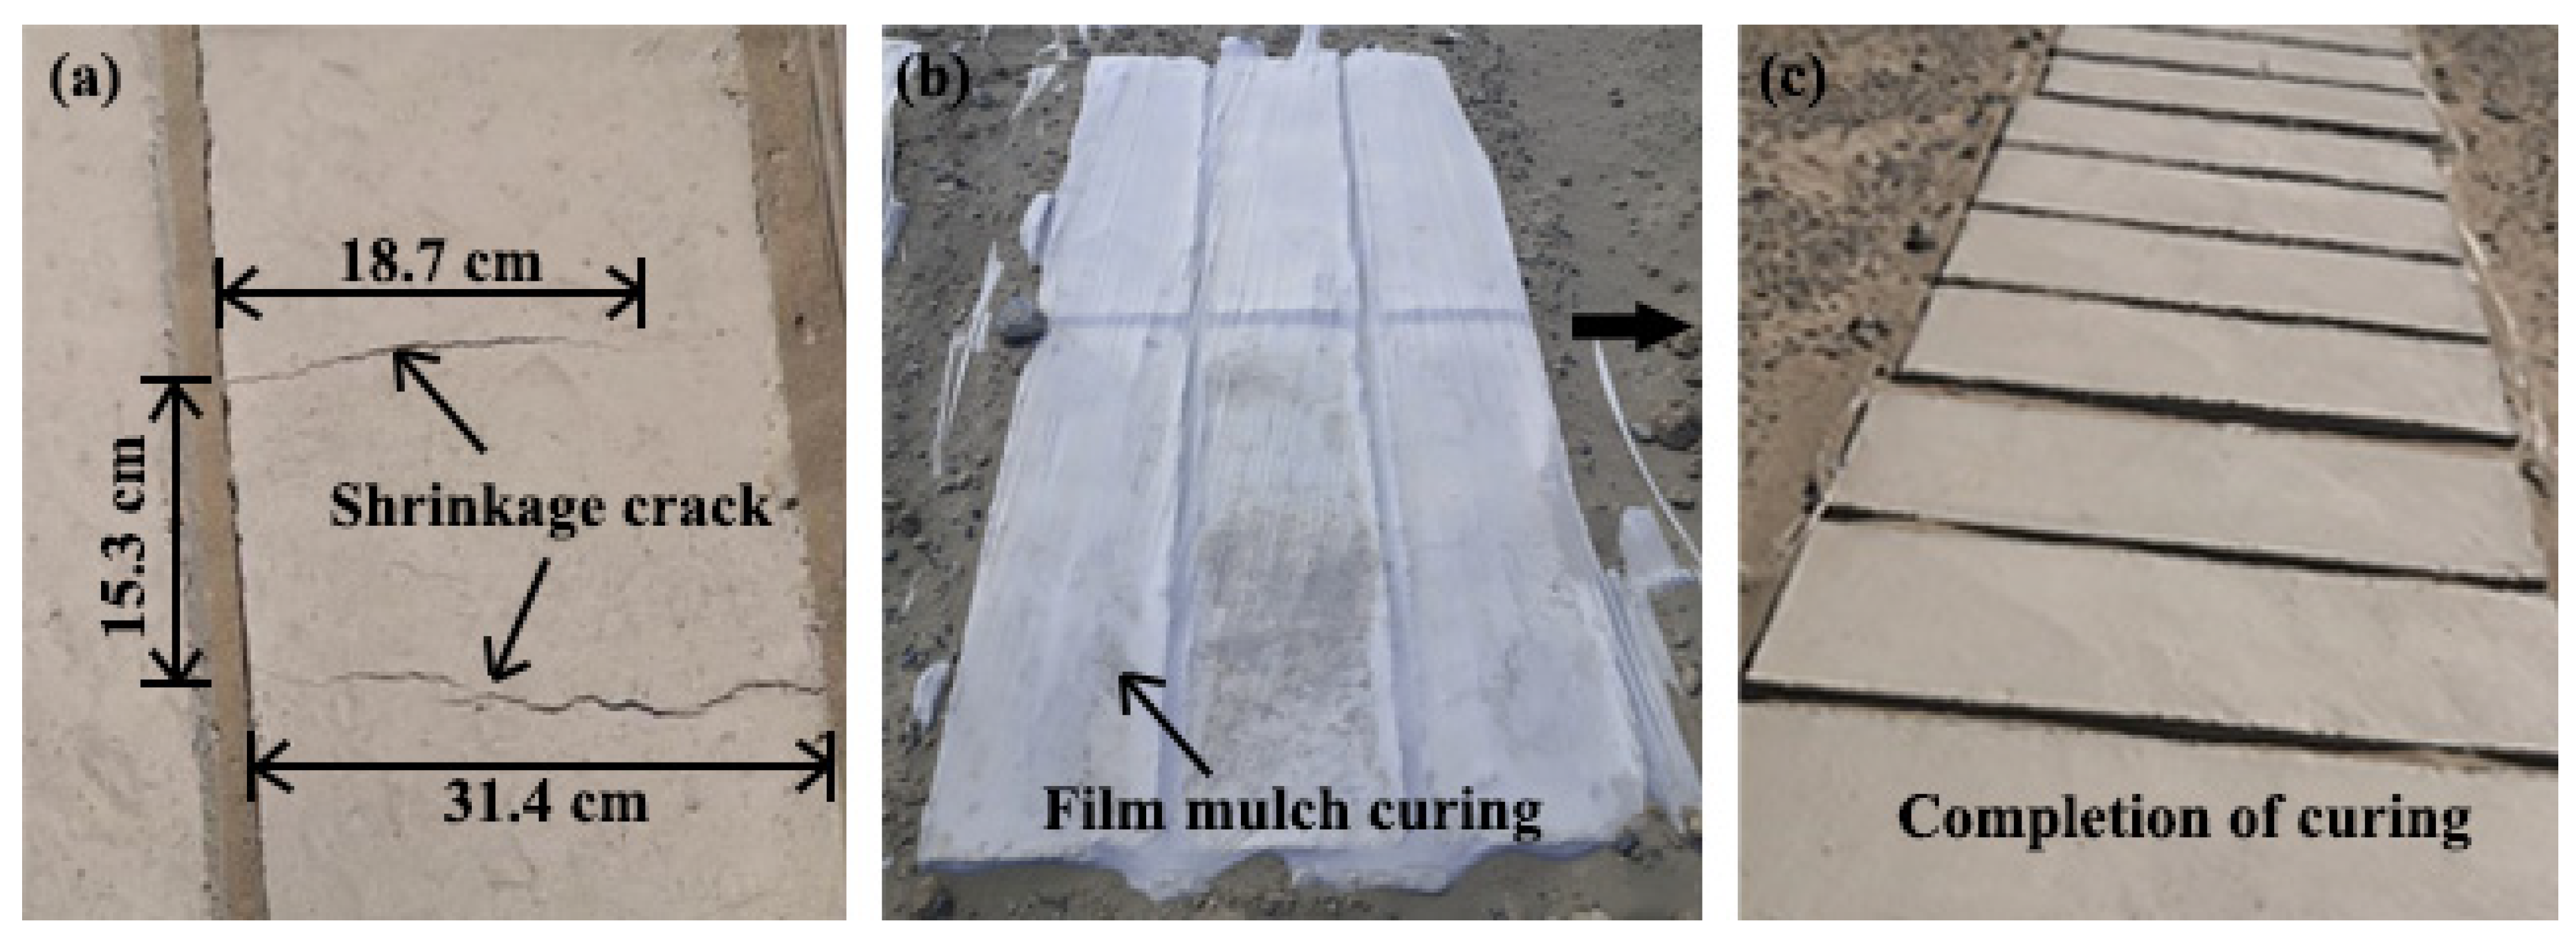
- Through field construction, the premature removal of molds under natural curing conditions resulted in too rapid water loss inside the board, inadequate hydration reaction, and a large number of early cracks. Given this, by delaying the demolding time and adopting the method of film curing, as shown in Figure 18, cracking could be significantly minimized.
- (2)
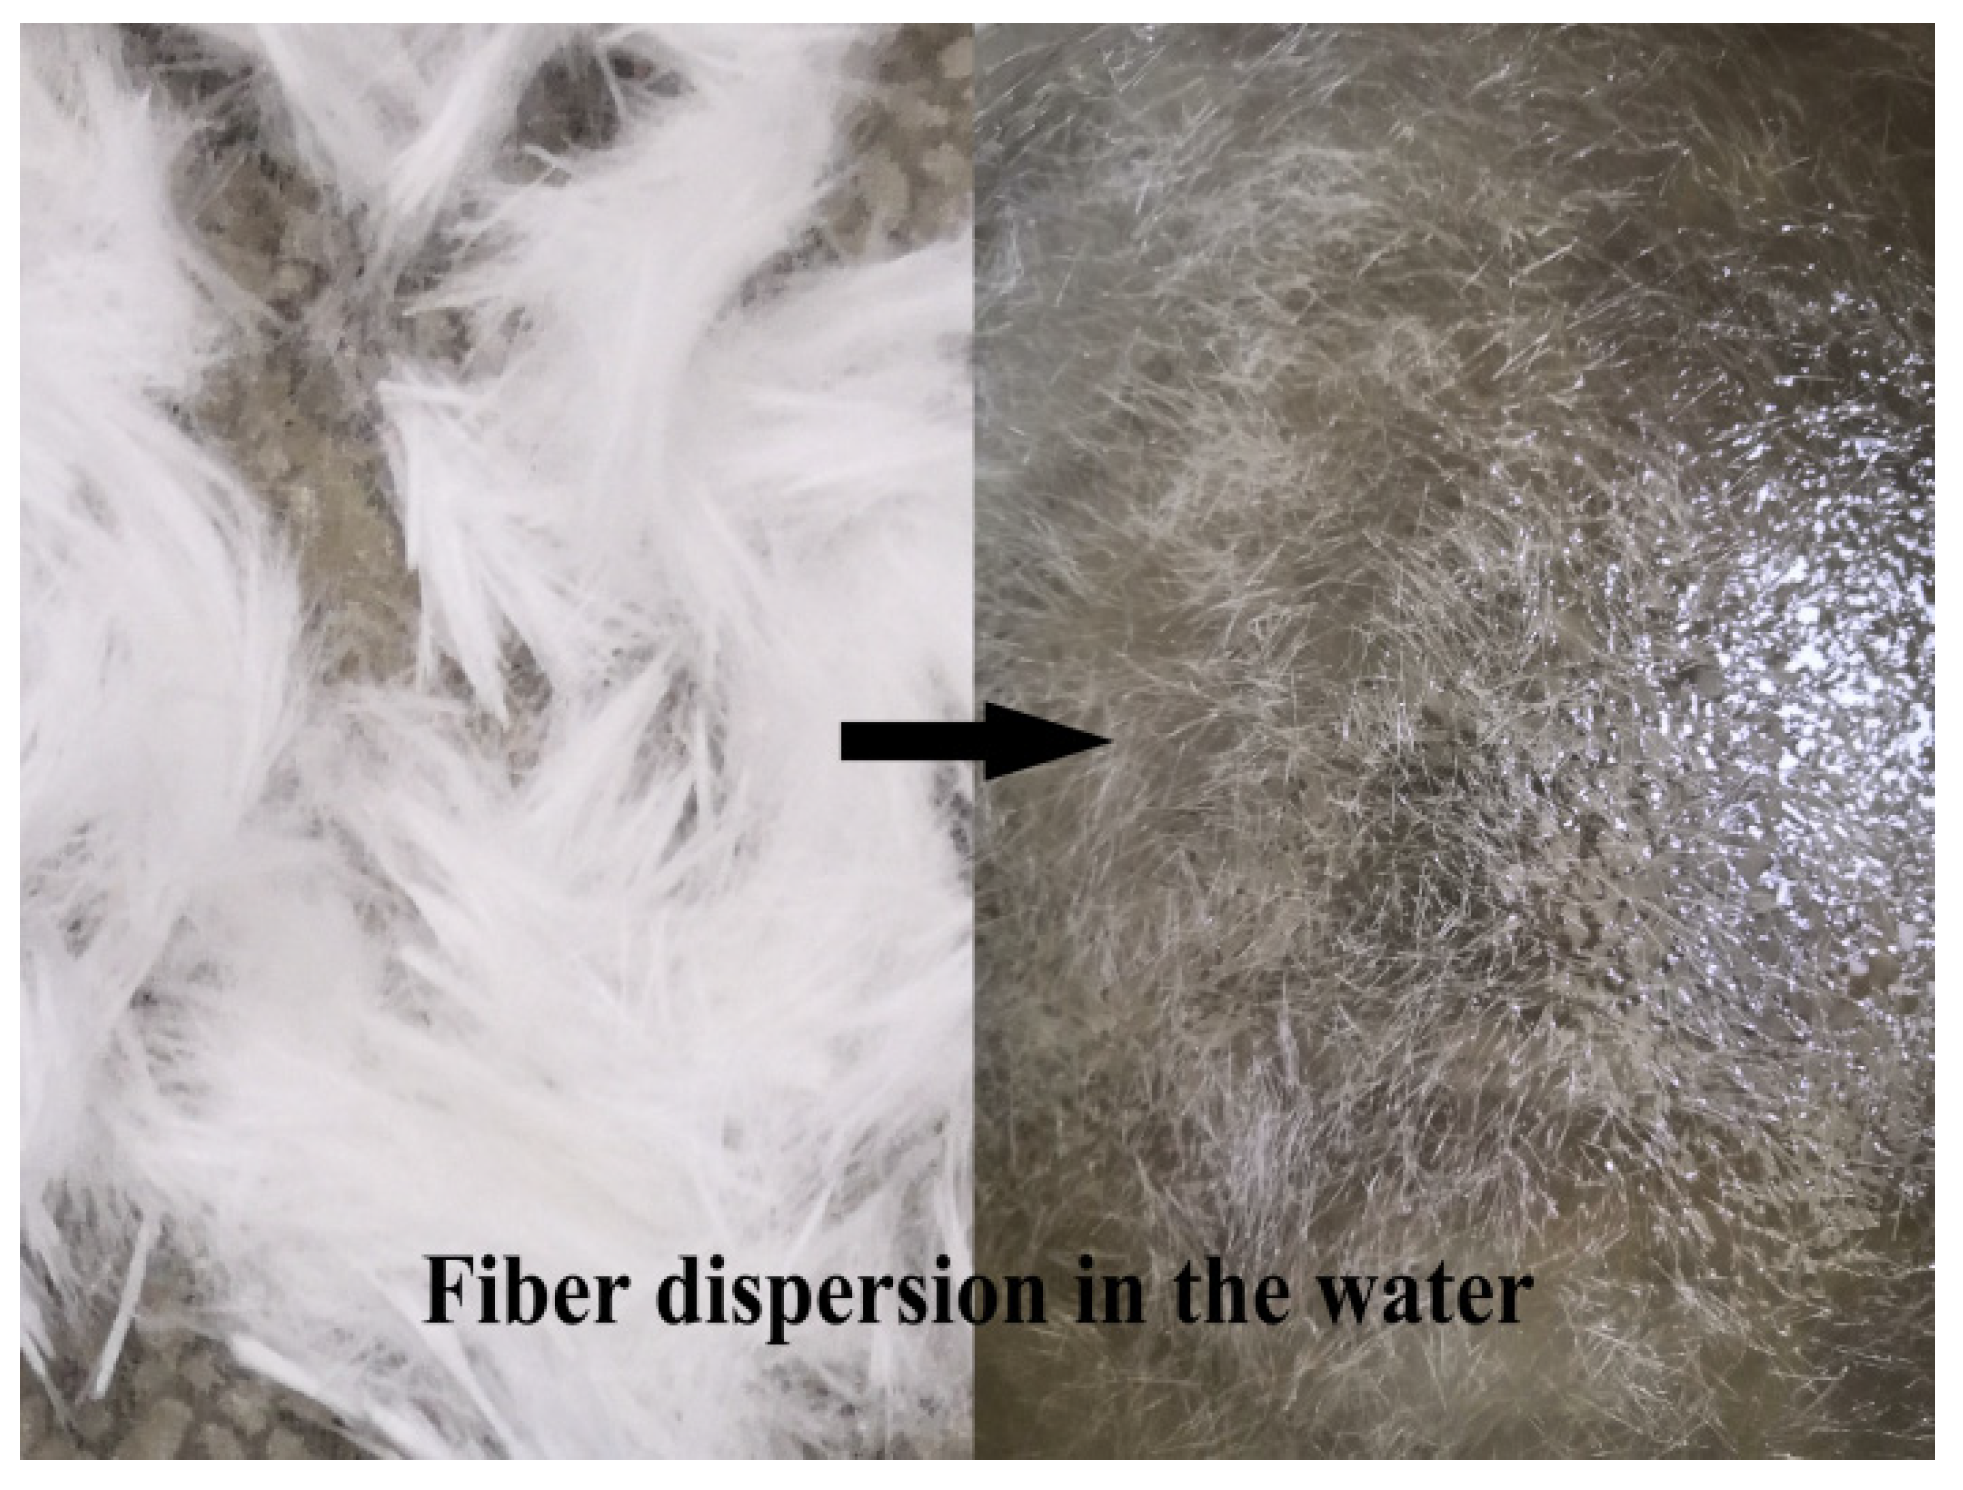
- The large-scale machinery used in the batch production of sand-fixing boards could not reach the same level of accuracy as that obtained in the laboratory, resulting in an uneven dispersion and agglomeration of fibers when directly mixed and stirred with aeolian sand cement-based materials. To keep the costs low, the fibers could be mixed and dispersed in water (Figure 19).
- (1)
- Weighing: Determine and weigh the dosage of each component of the sand-fixing board. The weighing accuracy should meet the requirements of ±1% for desert aeolian sand and ±0.5% for water, cement, fiber, etc.
- (2)
- Feeding sequence: To ensure that the fibers are uniformly dispersed and not agglomerated during the mixing process, other materials are first mixed and, subsequently, the fibers and water are added. The fiber-dispersing machine could be used for longer fibers.
- (3)
- Stirring: It is advisable to use a mixer, and the mixing amount should be 50 to 80% of the specified capacity of the mixer. Manual mixing could also be used on a steel plate or another non-absorbent platform. The plate and shovel surfaces are first wetted with a cloth, and various materials are added, followed by the addition of water for wet-mixing. During stirring, a shovel is used for mixing. The mixing time should not be less than 3 min.
- (4)
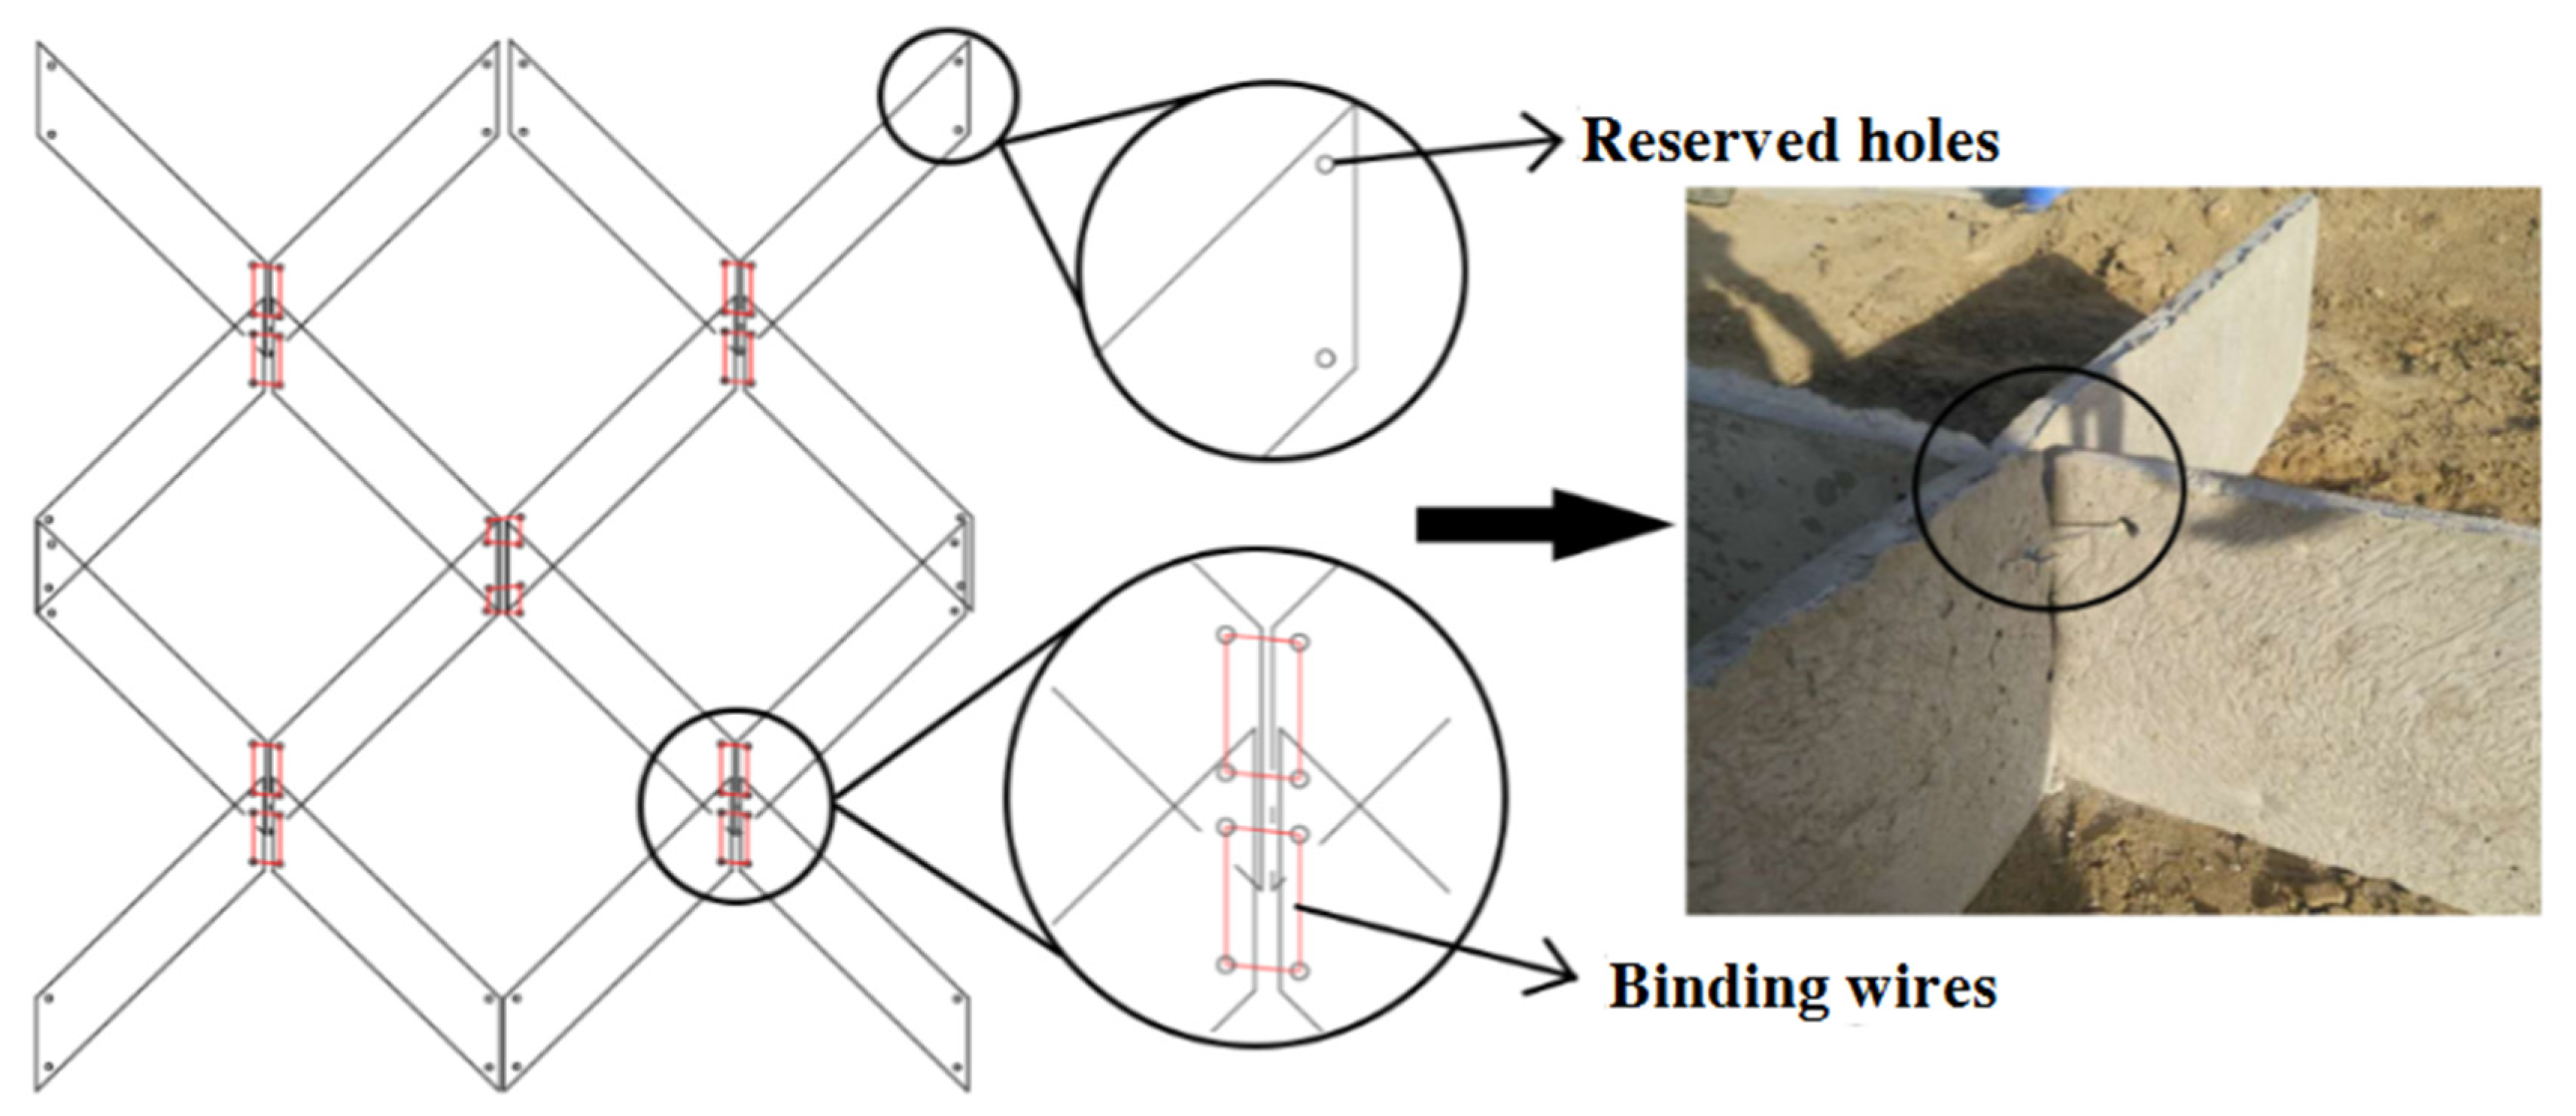
- Die filling: Small holes should be reserved at four corners of the mold bottom, and fixed piles, such as steel bars or bamboo poles, should be inserted to connect after sheet forming. Immediately, the die is filled in. The time interval should not exceed 15 min. The mold is filled as densely as possible, compacted, and flattened.
- (5)
- Curing and splicing: After die filling, the upper part must be covered with a film for curing. After 3 days of curing, the mold should be removed to take out the fixed pile. After reaching 70% of the design strength, the adjacent board should be assembled and spliced with iron wires for sand control projects, as shown in Figure 20.
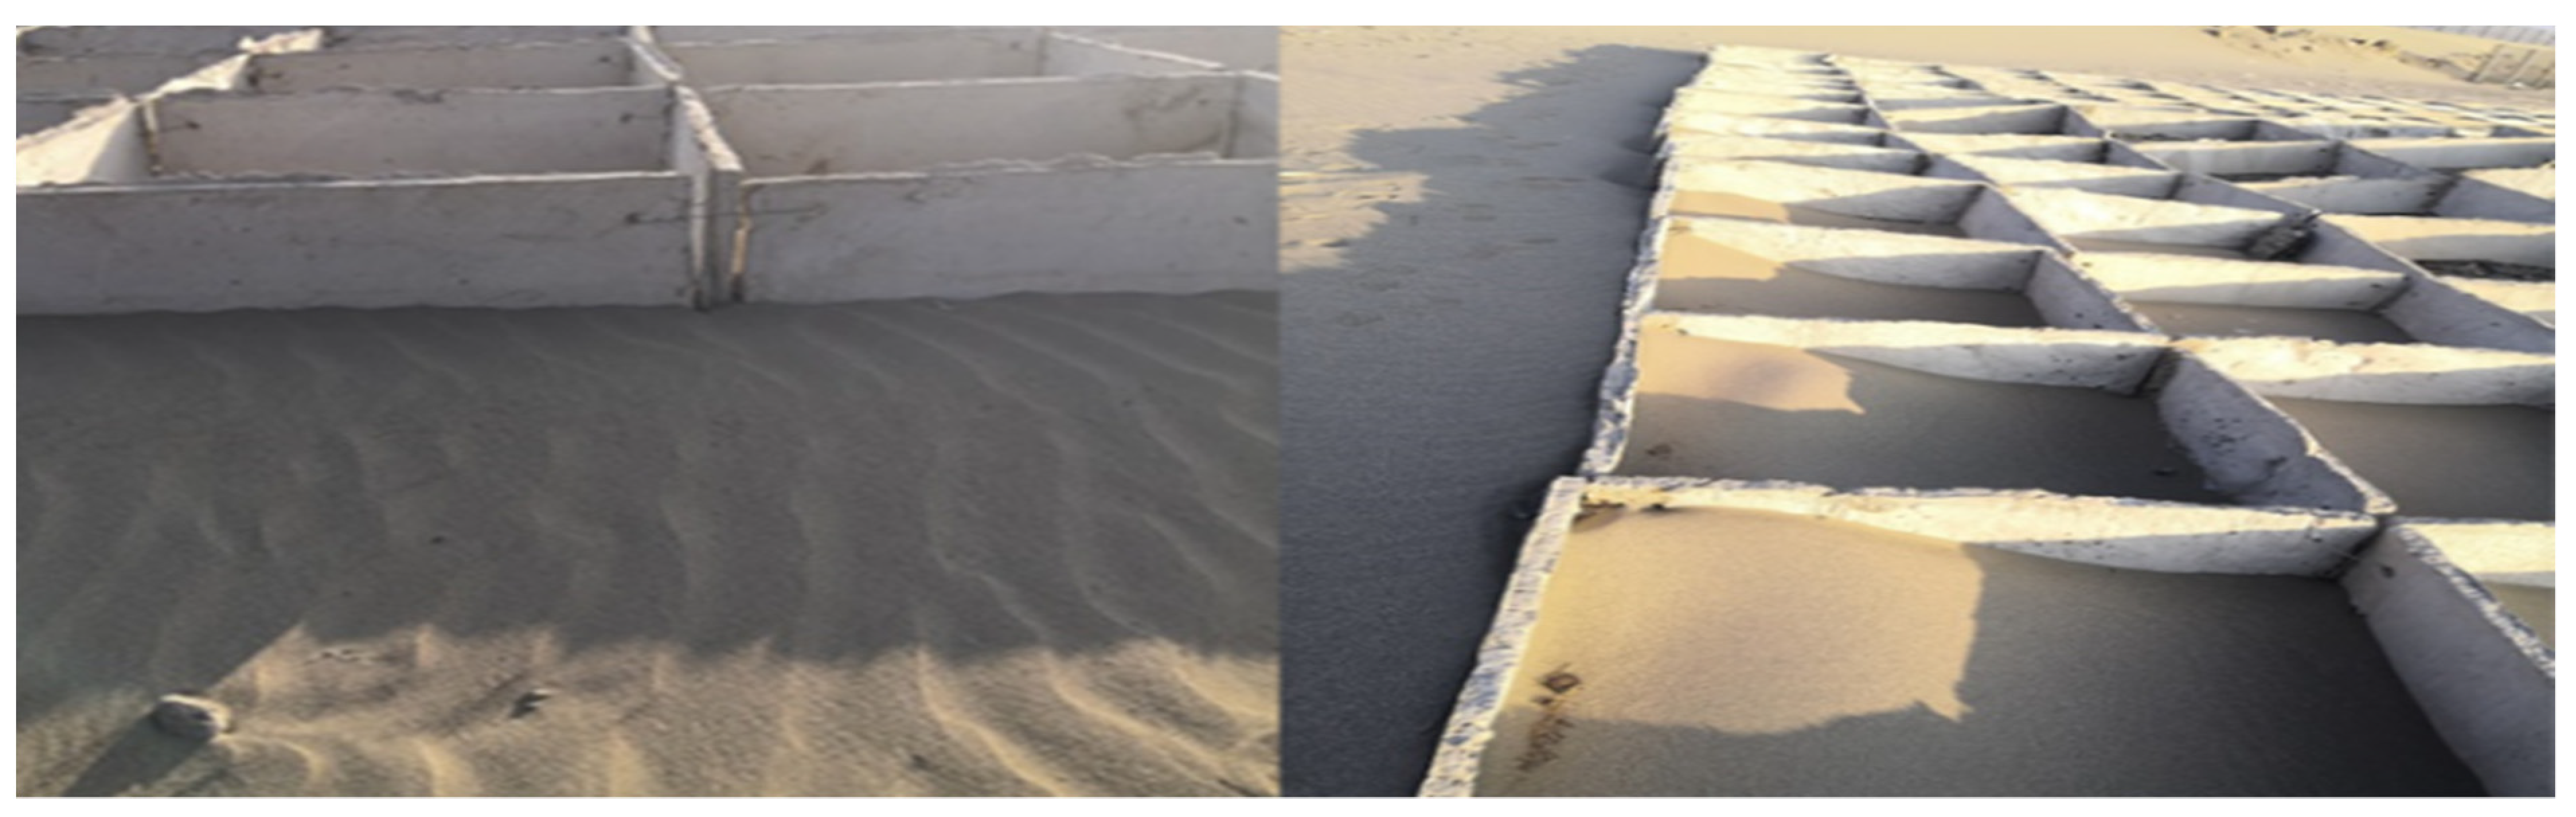
5.2. Project Effectiveness
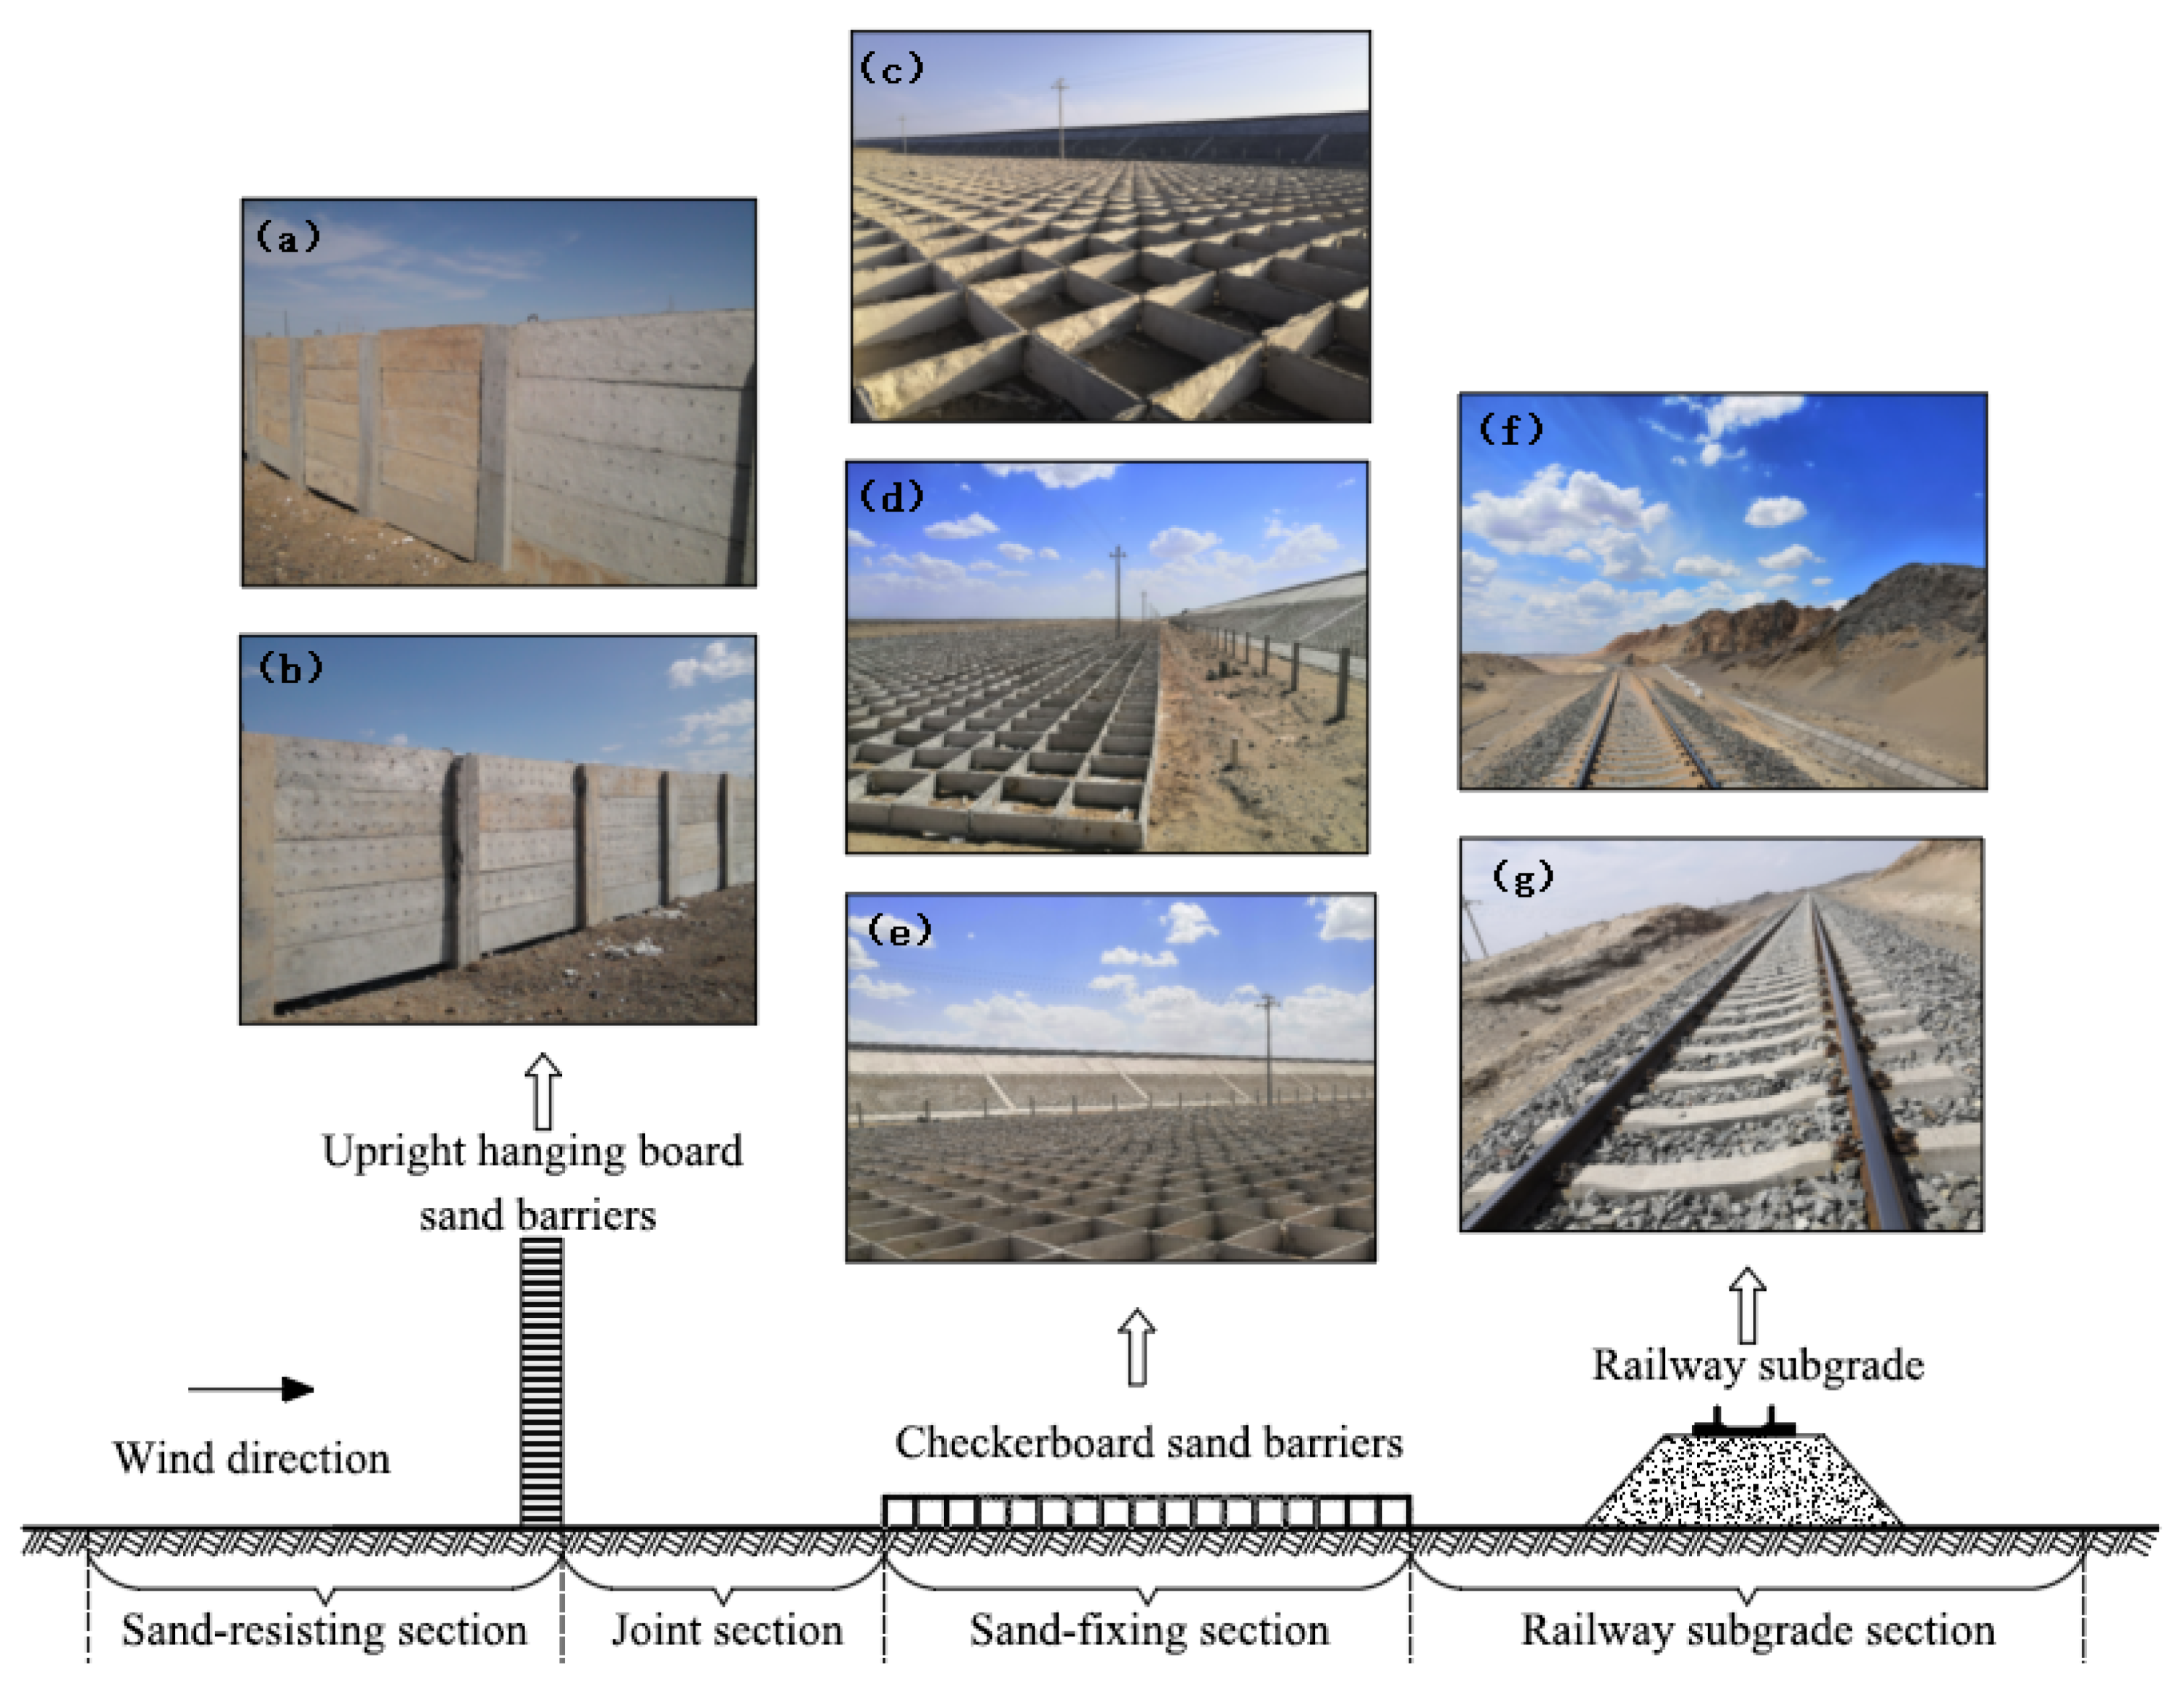
5.3. Sand-Resisting-Sand Fixing System
6. Conclusions
- (1)
- Against the background of the lack of raw materials and high transportation costs for the railway sand control project in the uninhabited area of the Gobi Desert, a new type of sand-fixing board was prepared using fiber-modified aeolian sand and applied to the checkboard sand barrier. It could increase the surface roughness to effectively reduce near-surface wind speed and the sand-carrying capacity of the wind. After long-term use, sand accumulation in the checkboard sand barrier was obvious, and the engineering structure was complete. The scientific concept of “sand control with sand” was therefore put forward.
- (2)
- The mechanical strength of the sand-fixing board had different degrees of improvement with the addition of fiber. With the increase in fiber content and length, the overall strength of the board showed an upward trend. When the fiber content was 0.5% and the fiber length was 19 mm, the compressive strength of the sand-fixing board reached 20.03 MPa and the flexural strength reached 3.22 MPa after 28 days. Compared with the control group, the compressive strength and flexural strength increased by 2.15 and 0.59 times, respectively.
- (3)
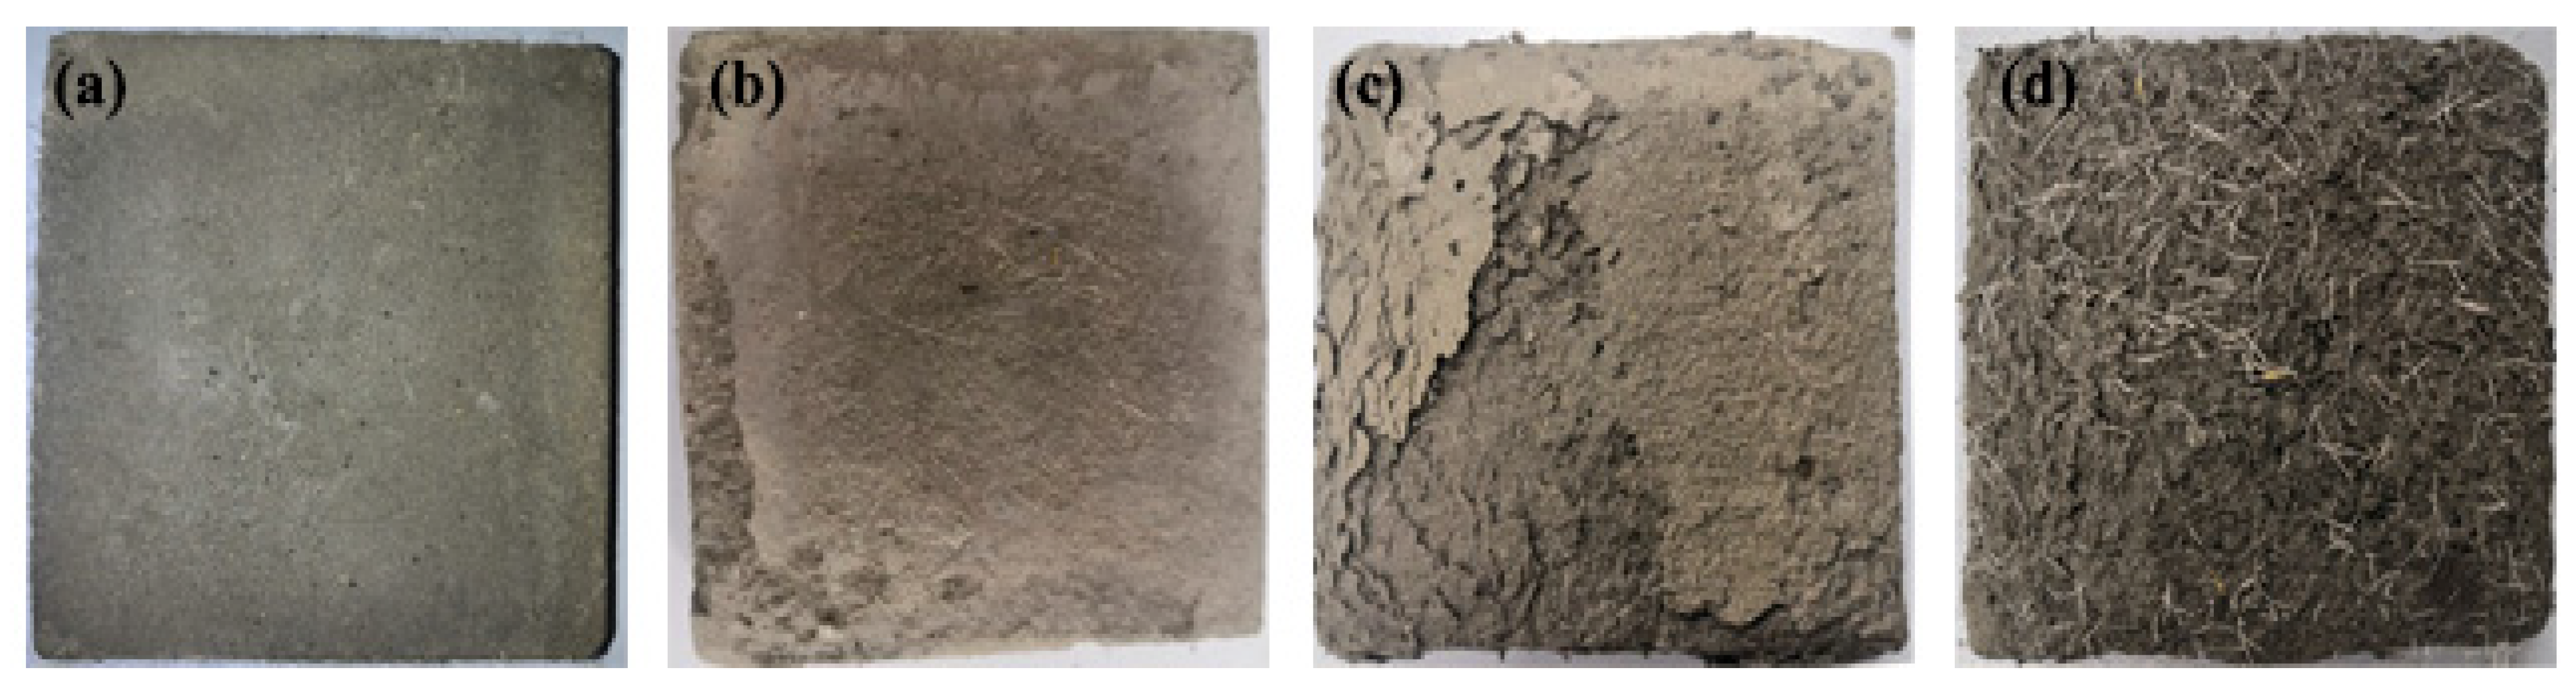
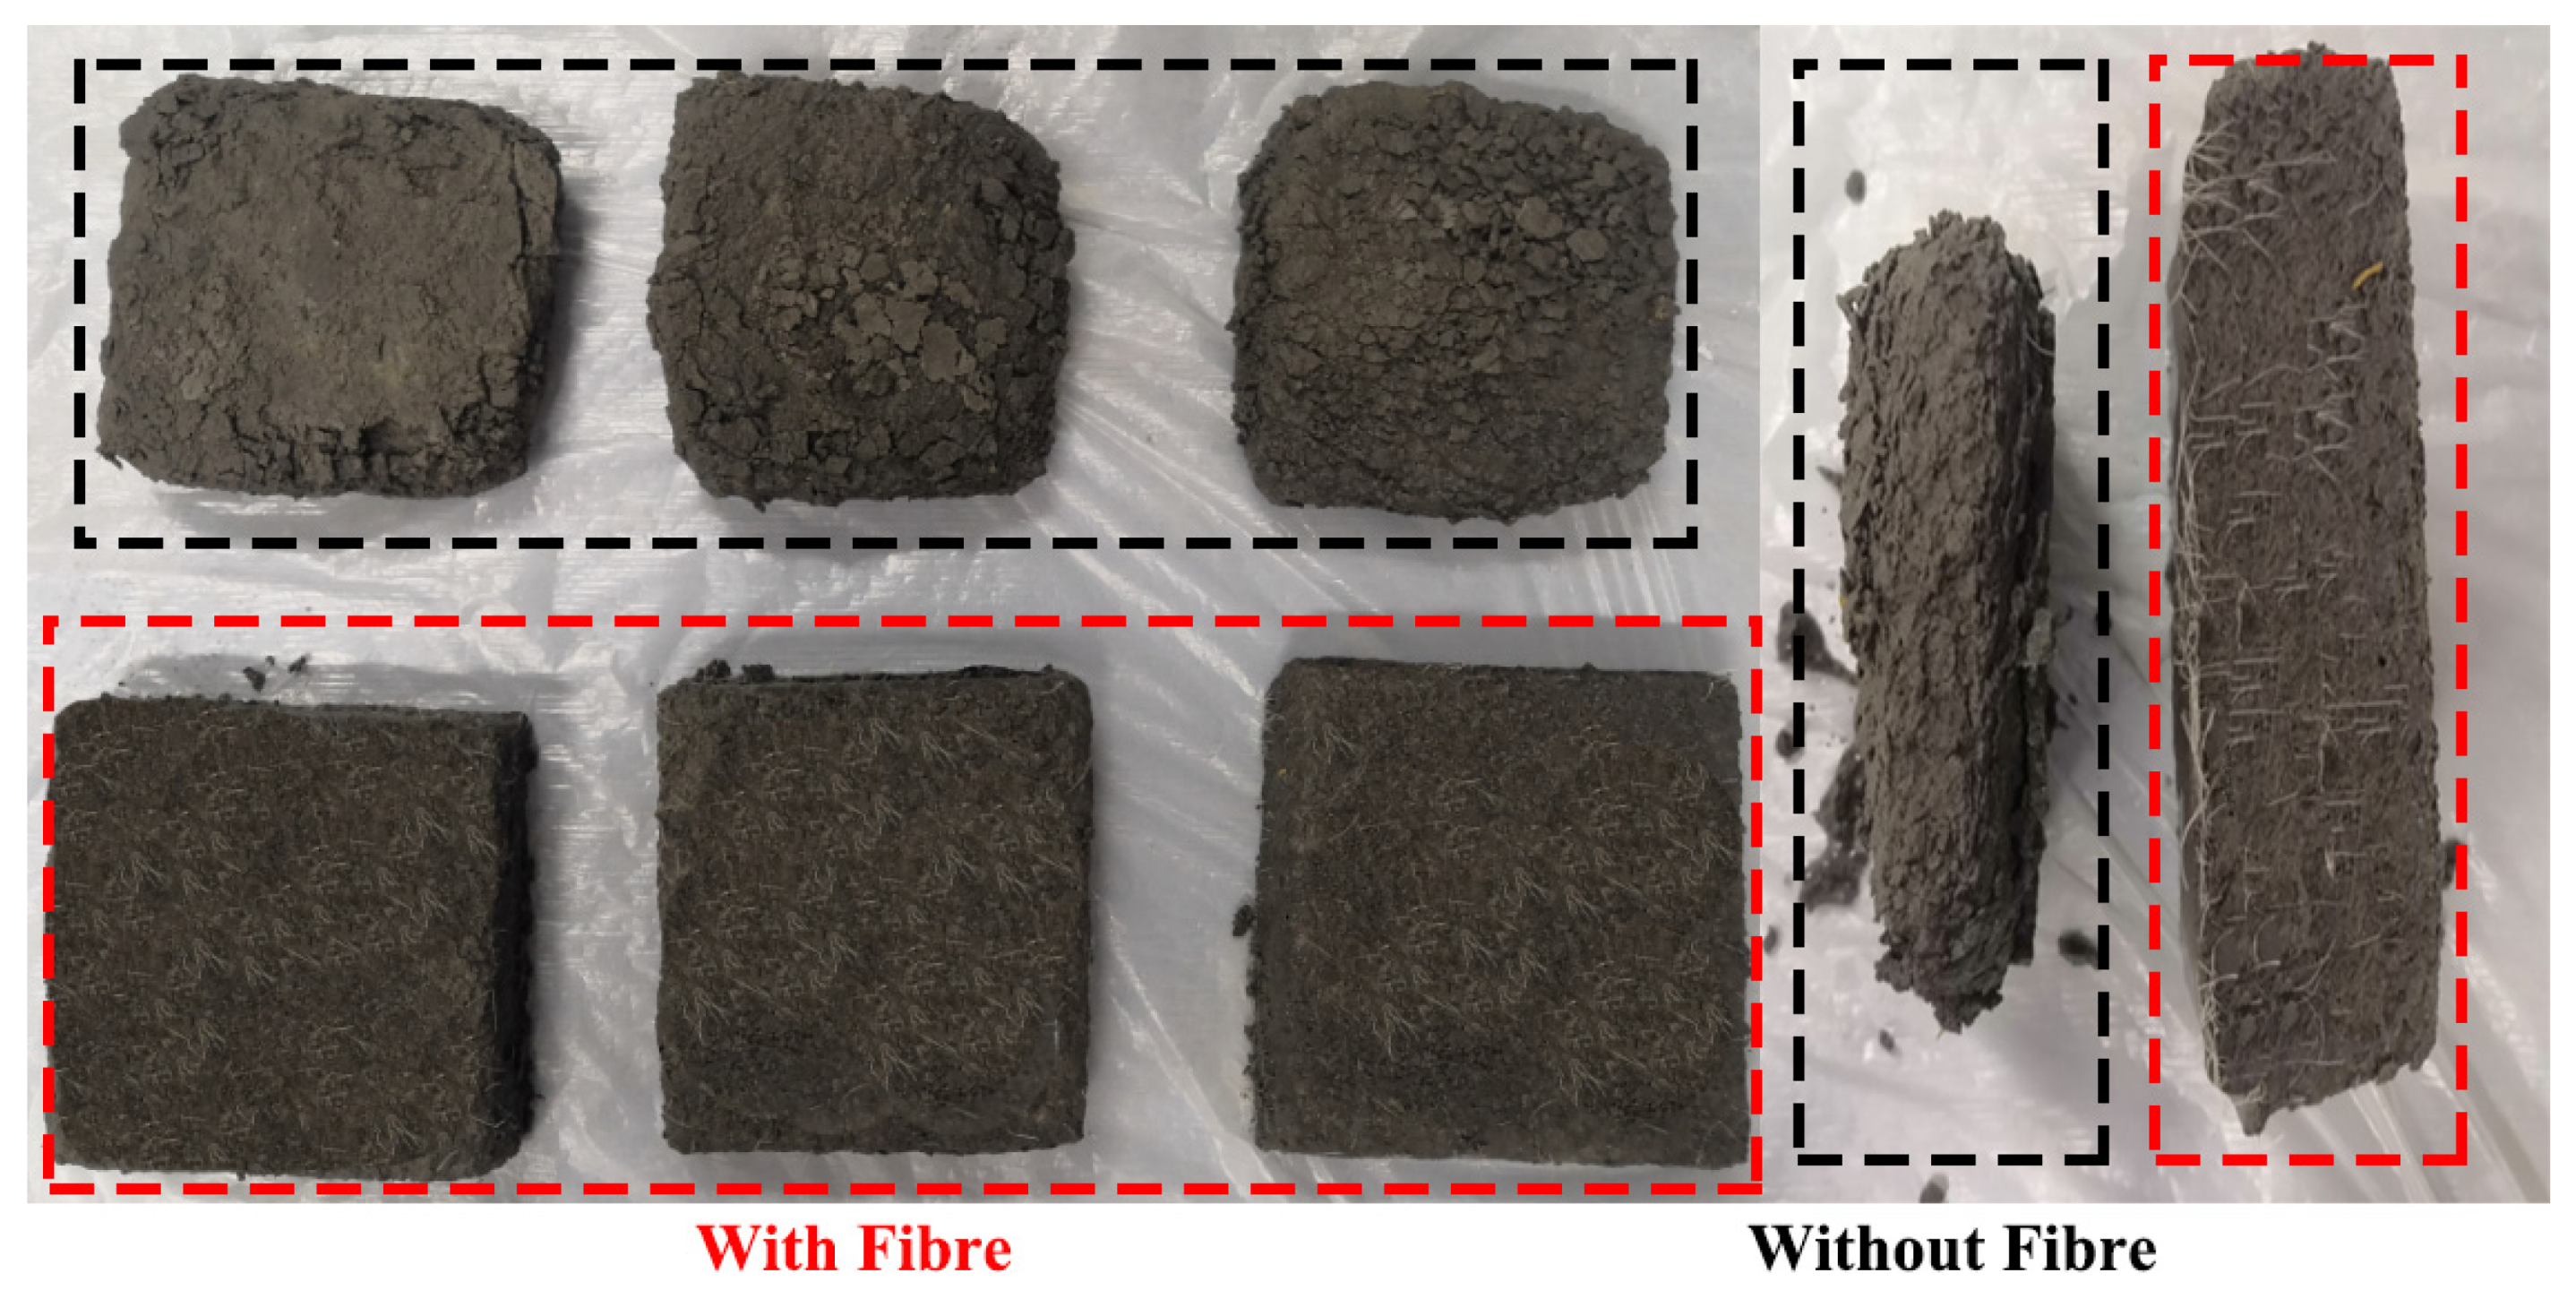
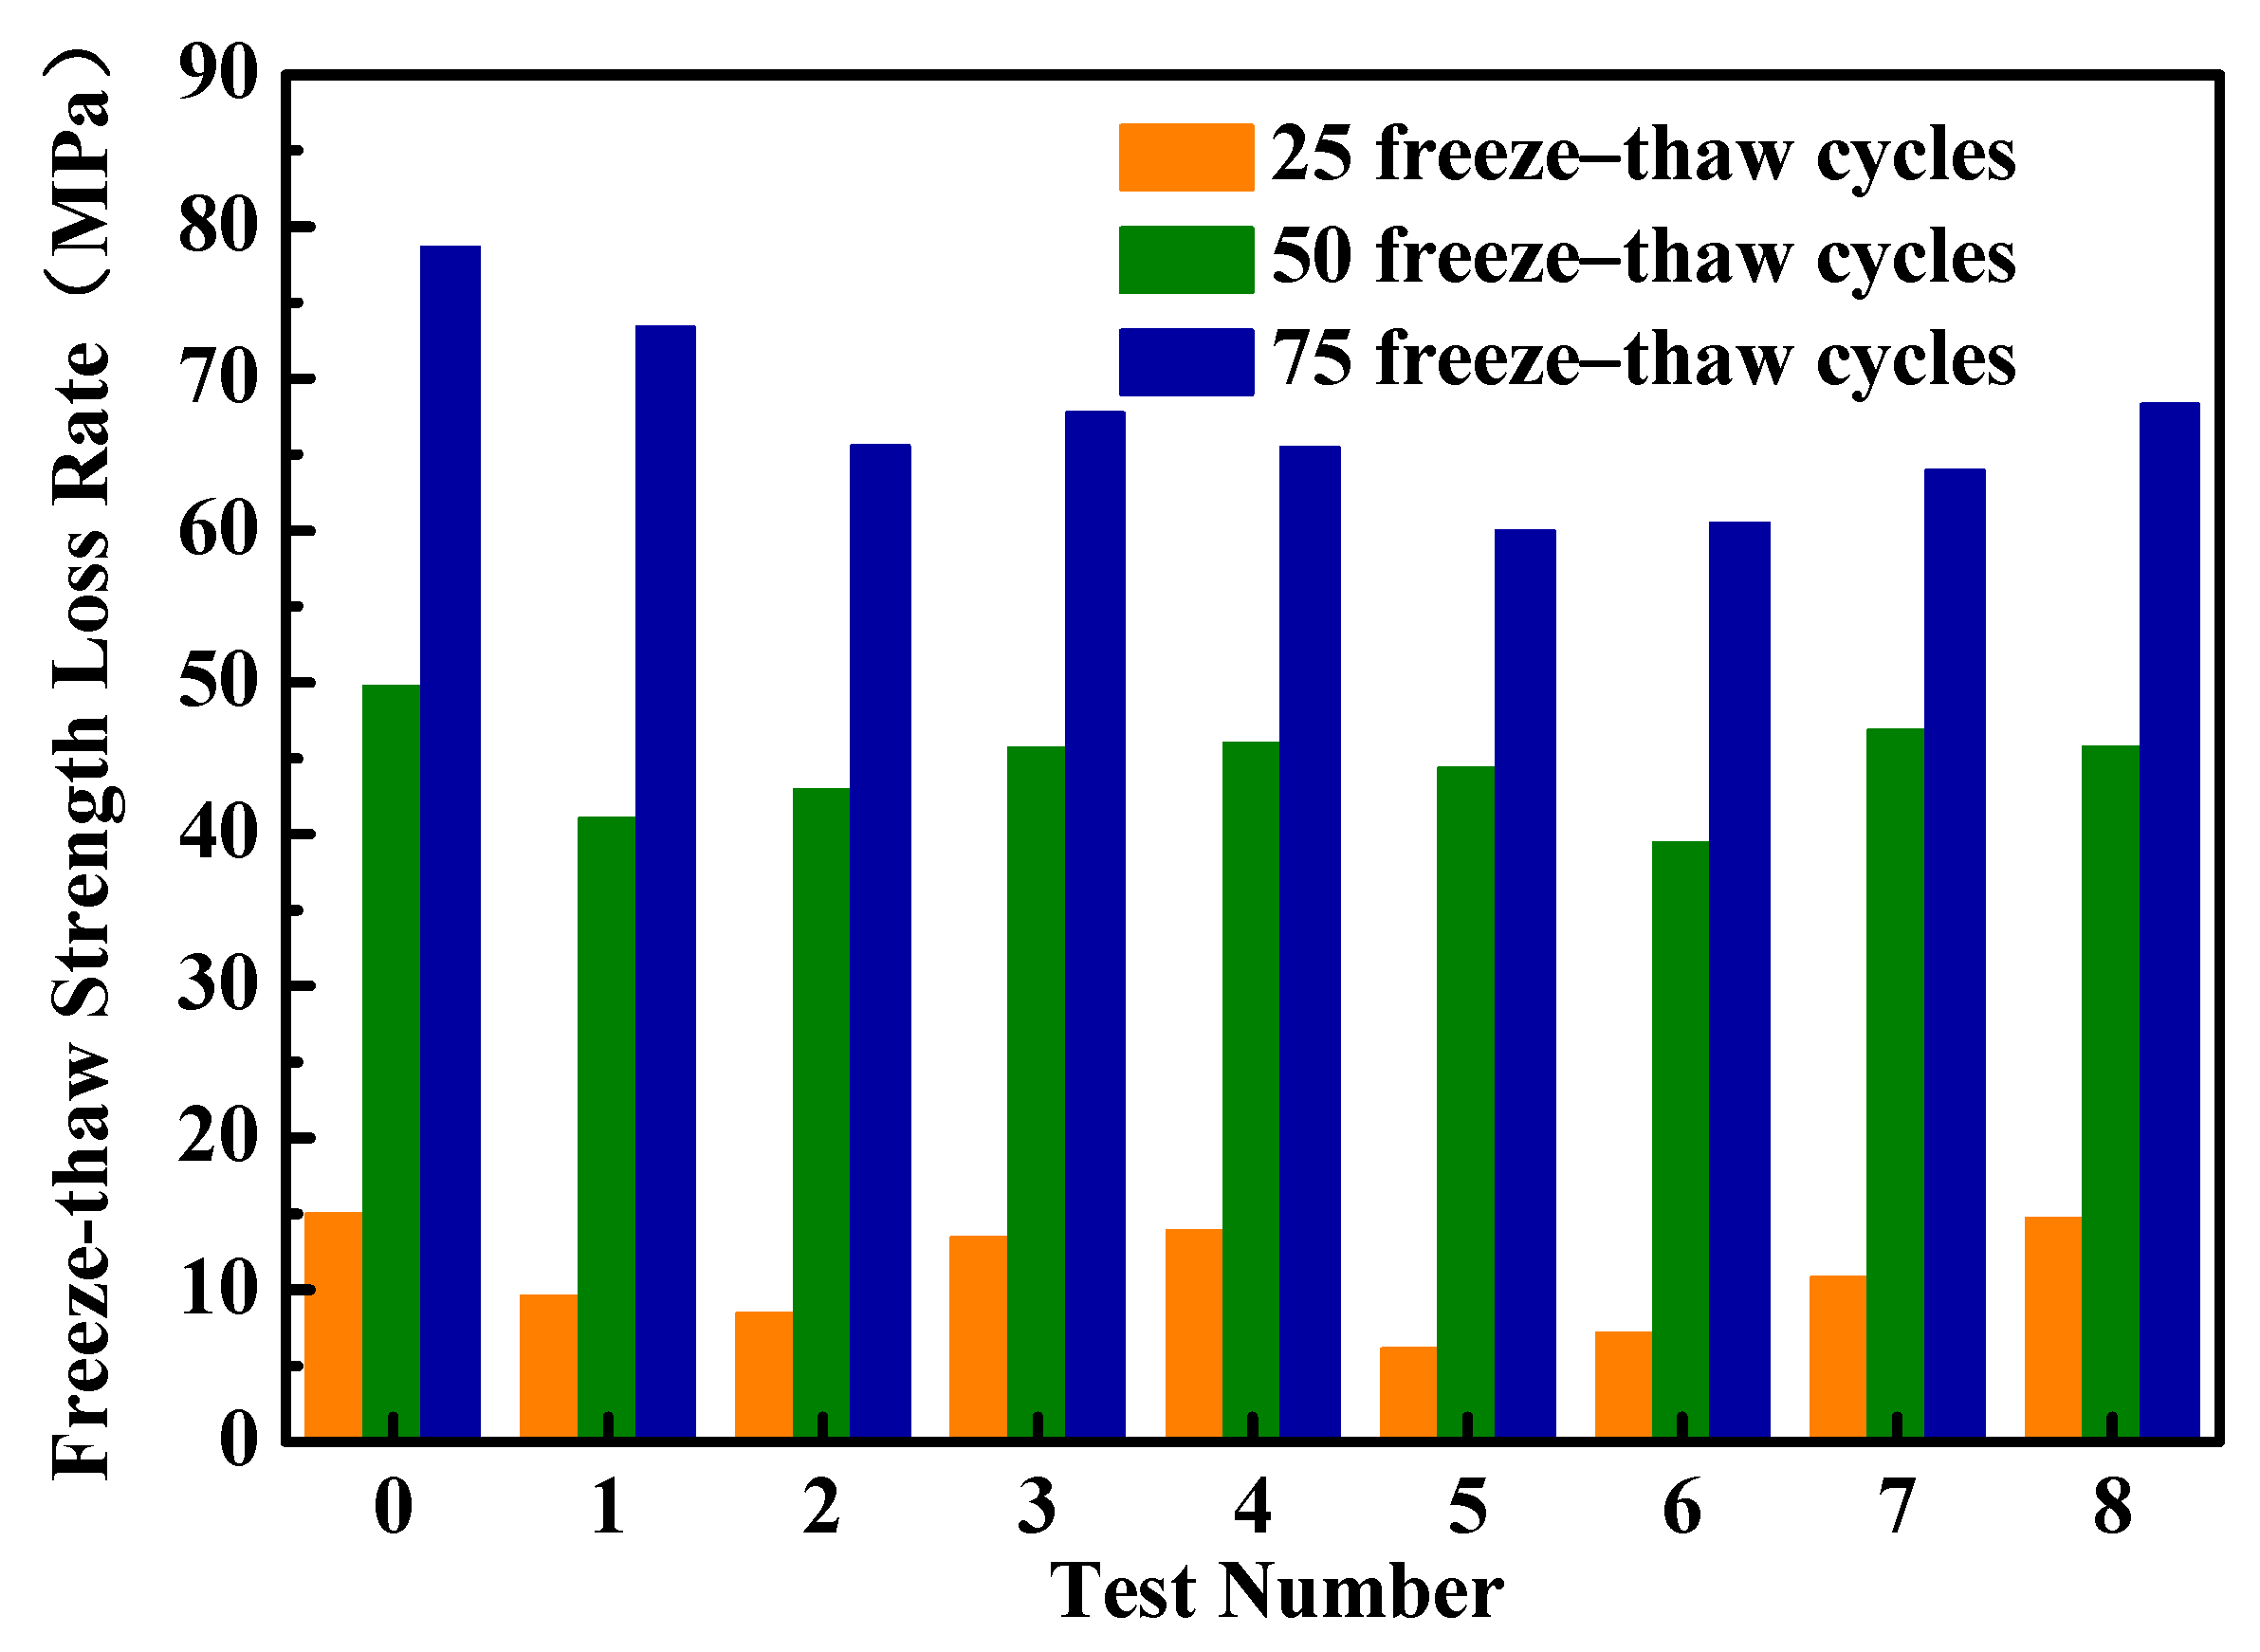
- The apparent morphology of the sand-fixing board was gradually destroyed as the number of freeze–thaw cycles increased. When the numbers of freeze–thaw cycles were 0, 25, 50, and 75, the degree of damage was a complete structure (no freezing damage), slag on the surface and the corner of the mortar falling off (slight freezing damage), the surface layer falling off in a large area with obvious mass loss (moderate freezing damage), completely exposed internal fiber and a soft surface with obvious cracks and pores inside the structure (severe freezing damage). With the increase in the number of freeze–thaw cycles, the improvement in the mass loss rate of the sand-fixing board by the fiber became more obvious. After 75 freeze–thaw cycles, the mass loss rate of most boards did not exceed 5%, with a reduction of more than 60%.
- (4)
- To avoid dry shrinkage cracking and an uneven fiber dispersion during the on-site production of the sand-fixing board, a complete set of fiber-reinforced sand-fixing board construction techniques can be summarized as follows: weighing, feeding sequencing, stirring, die filling, curing, and splicing. This can be used to guide on-site construction and has a practical reference value for the application of field projects.
Author Contributions
Funding
Data Availability Statement
Acknowledgments
Conflicts of Interest
References
- DeJong, J.T.; Fritzges, M.B.; Nusslein, K. Microbially induced cementation to control sand response to undrained shear. J. Geotech. Geoenviron. Eng. 2006, 132, 1381–1392. [Google Scholar] [CrossRef]
- Zhao, W.Z.; Hu, G.L.; Zhang, Z.H.; He, Z.B. Shielding effect of oasis-protection systems composed of various forms of wind break on sand fixation in an arid region: A case study in the Hexi Corridor, northwest China. Ecol. Eng. 2008, 33, 119–125. [Google Scholar] [CrossRef]
- Liu, J.; Shi, B.; Lu, Y.; Jiang, H.; Huang, H.; Wang, G.; Kamai, T. Effectiveness of a new organic polymer sand-fixing agent on sand fixation. Environ. Earth Sci. 2012, 65, 589–595. [Google Scholar] [CrossRef]
- Ju, Y.F.; Qiu, M.X.; Zhu, J.K.; Zhang, J.M.; Zhou, Y. Advances in sand-fixing material research in China and the application prospect. J. Arid Land Resour. Environ. 2019, 33, 138–144. [Google Scholar] [CrossRef]
- Qu, H.J.; Zu, R.P.; Zhang, K.; Fang, H.Y. Field observations on the protective effect of semi-buried checkerboard sand barriers. Geomorphology 2007, 88, 193–200. [Google Scholar] [CrossRef]
- Wang, T.; Qu, J.J.; Niu, Q.H. Comparative study of the shelter efficacy of straw checkerboard barriers and rocky checkerboard barriers in a wind tunnel. Aeolian Res. 2020, 43, 100575. [Google Scholar] [CrossRef]
- Azoogh, L.; Moghadam, B.K.; Jafari, S. Interaction of petroleum mulching, vegetation restoration and dust fallout on the conditions of sand dunes in southwest of Iran. Aeolian Res. 2018, 32, 124–132. [Google Scholar] [CrossRef]
- Wang, Y.M. Study on mechanism of chemical desert control. J. Catastrophol. 2008, 23, 32–35, (in Chinese with English abstract). [Google Scholar] [CrossRef]
- Meng, X.; Peng, G.; Liu, B.L.; Wang, B.; Chen, H.L.; Luo, R.; Dong, Z.B.; Li, Y.; Zhang, B.; Luo, L.H. Synthesis and Sand-Fixing Property of Cationic Poly(Vinyl Acetate-Butyl Acrylate-DMC) Copolymer Emulsions. Polym. -Plast. Technol. Eng. 2013, 52, 931–939. [Google Scholar] [CrossRef]
- Dang, X.G.; Chen, H.; Shan, Z.H. Preparation and characterization of poly(acrylic acid)-corn starch blend for use as chemical sand-fixing materials. Mater. Res. Express 2017, 4, 075506. [Google Scholar] [CrossRef]
- Gong, W.; Li, M.L.; Zang, Y.X.; Xie, H.; Liu, B.L.; Chen, H.L. The synthesis of salt-resistant emulsion and its application in ecological sand-fixing of high salt-affected sandy land. Plast. Rubber Compos. 2017, 46, 163–172. [Google Scholar] [CrossRef]
- Liu, X.; Tie, S. Weather resistance of CaSO4⋅1/2H2O-based sand-fixation material. Int. J. Mod. Phys. B 2017, 31, 1744084. [Google Scholar] [CrossRef]
- Xie, H.; Liu, B.L.; Chen, H.L.; Xu, Q. Inner relationship between the damping property and the sand-fixing durability of polymer materials. J. Appl. Polym. Sci. 2019, 136, 47208. [Google Scholar] [CrossRef]
- DeJong, J.T.; Mortensen, B.M.; Martinez, B.C.; Nelson, D.C. Bio-mediated soil improvement. Ecol. Eng. 2010, 36, 197–210. [Google Scholar] [CrossRef]
- Van Paassen, L.A.; Ghose, R.; van der Linden, T.J.M.; van der Star, W.R.L.; van Loosdrecht, M.C.M. Quantifying Biomediated Ground Improvement by Ureolysis: Large-Scale Biogrout Experiment. J. Geotech. Geoenviron. Eng. 2010, 136, 1721–1728. [Google Scholar] [CrossRef]
- Burbank, M.B.; Weaver, T.J.; Green, T.L.; Williams, B.C.; Crawford, R.L. Precipitation of Calcite by Indigenous Microorganisms to Strengthen Liquefiable Soils. Geomicrobiol. J. 2011, 28, 301–312. [Google Scholar] [CrossRef]
- Fujita, Y.; Taylor, J.L.; Wendt, L.M.; Reed, D.W.; Smith, R.W. Evaluating the potential of native ureolytic microbes to remediate a 90Sr contaminated environment. Environ. Sci. Technol. 2010, 44, 7652–7658. [Google Scholar] [CrossRef] [PubMed]
- Okwadha, G.D.O.; Li, J. Biocontainment of polychlorinated biphenyls (PCBs) on flat concrete surfaces by microbial carbonate precipitation. J. Environ. Manag. 2011, 92, 2860–2864. [Google Scholar] [CrossRef]
- Rusu, C.; Cheng, X.H.; Li, M. Biological Clogging in Tangshan Sand Columns under Salt water Intrusion by Sporosarcina Pasteurii. Adv. Mater. Res.-Switz. 2011, 250–253, 2040–2046. [Google Scholar] [CrossRef]
- Yan, W.L.; Wu, G.; Dong, Z.Q. Optimization of the mix proportion for desert sand concrete based on a statistical model. Constr. Build. Mater. 2019, 226, 469–482. [Google Scholar] [CrossRef]
- Cai, H.; Liao, T.C.; Ren, S.Q.; Li, S.G.; Huo, R.K.; Yuan, J.; Yang, W.C. Predicting the compressive strength of desert sand concrete using ann: Pso and its application in tunnel. Adv. Civ. Eng. 2020, 2020, 8875922. [Google Scholar] [CrossRef]
- Liu, H.F.; Chen, X.L.; Che, J.L.; Liu, N.; Zhang, M.H. Mechanical performances of concrete produced with desert sand after elevated temperature. Int. J. Concr. Struct. Mater. 2020, 14, 26. [Google Scholar] [CrossRef]
- Li, X.A.; Zheng, H.F.; Li, X.X.; Ye, W.J. Test on the mortar mix ratio with aeolian sand of mu us desert. Adv. Mater. Res. 2011, 152–153, 892–896. [Google Scholar] [CrossRef]
- Benabed, B.; Azzouz, L.; Kadri, E.; Kenai, S.; Belaidi, A.S.E. Effect of fine aggregate replacement with desert dune sand on fresh properties and strength of self-compacting mortars. J. Adhes. Sci. Technol. 2014, 28, 2182–2195. [Google Scholar] [CrossRef]
- Al-Lebban, M.F.; Khazaly, A.I.; Shabbar, R.; Jabal, Q.A.; Al Asadi, L.A.R. Effect of polypropylene fibers on some mechanical properties of concrete and durability against freezing and thawing cycles. Key Eng. Mater. 2021, 895, 130–138. [Google Scholar] [CrossRef]
- Zhang, P.; Han, X.; Zheng, Y.; Wan, J.; Hui, D. Effect of PVA fiber on mechanical properties of fly ash-based geopolymer concrete. Rev. Adv. Mater. Sci. 2021, 60, 418–437. [Google Scholar] [CrossRef]
- Zhang, P.; Gao, Z.; Wang, J.; Wang, K. Numerical modeling of rebar-matrix bond behaviors of nano-SiO2 and PVA fiber reinforced geopolymer composites. Ceram. Int. 2021, 47, 11727–11737. [Google Scholar] [CrossRef]
- Zhang, P.; Wang, J.; Li, Q.; Wan, J.; Ling, Y. Mechanical and fracture properties of steel fiber-reinforced geopolymer concrete. Sci. Eng. Compos. Mater. 2021, 28, 299–313. [Google Scholar] [CrossRef]
- Zhang, P.; Li, Q.F. Effect of polypropylene fiber on durability of concrete composite containing fly ash and silica fume. Compos. Part B Eng. 2013, 45, 1587–1594. [Google Scholar] [CrossRef]
- Patel, V.; Singh, B.; Ojha, P.N.; Adhikari, S. Mechanical properties of polypropylene fiber reinforced concrete under elevated temperature. J. Archit. Environ. Struct. Eng. Res. 2021, 4, 45–53. [Google Scholar] [CrossRef]
- Murali, G.; Abid, S.R.; Karthikeyan, K.; Haridharan, M.K.; Amran, M.; Siva, A. Low-velocity impact response of novel prepacked expanded clay aggregate fibrous concrete produced with carbon nano tube, glass fiber mesh and steel fiber. Constr. Build. Mater. 2021, 284, 122749. [Google Scholar] [CrossRef]
- Sucharda, O.; Konecny, P.; Kubosek, J.; Ponikiewski, T.; Done, P. Finite Element Modelling and Identification of the Material Properties of Fibre Concrete. Procedia Eng. 2015, 109, 234–239. [Google Scholar] [CrossRef] [Green Version]


| Fineness Modulus | Compact Bulk Density (kg/m3) | Loose Bulk Density (kg/m3) | Apparent Density (kg/m3) | Porosity (%) | Mud Content (%) |
|---|---|---|---|---|---|
| 0.252 | 1469 | 1307 | 2665 | 44.87 | 3.6 |
| Test Items | Setting Time (min) | Flexural Strength (MPa) | Compressive Strength (MPa) | |||
|---|---|---|---|---|---|---|
| Initial Set | Final Set | 3 Days | 28 Days | 3 Days | 28 Days | |
| Measured value | 134 | 218 | 6.5 | 10.3 | 29.2 | 52.9 |
| Standard deviation | 4.32 | 8.29 | 0.22 | 0.36 | 1.10 | 1.51 |
| Fiber Name | Linear Density (μm) | Tensile Strength (MPa) | Elongation at Break (%) | Modulus (Elongation of 15%) (MPa) | Melting Point (°C) |
|---|---|---|---|---|---|
| Polypropylene fiber | 19.2 | 556.9 | 29.8 | 6822.3 | 160 |
| Unit Area (g/m2) | Pore Size (Mesh × Mesh) | Longitudinal Tensile Strength (N/50 mm) | Transverse Tensile Strength (N/50 mm) | Longitudinal Fracture Strain (%) | Transverse Fracture Strain (%) | Binder Content (%) |
|---|---|---|---|---|---|---|
| 46 | 3 × 3 | 452 | 461 | 3.8 | 3.9 | 13.5 |
| 78 | 5 × 5 | 572 | 606 | 3.6 | 3.9 | 13.4 |
| 121 | 5 ×5 | 751 | 798 | 3.5 | 3.7 | 13.8 |
| 135 | 5 × 5 | 896 | 968 | 3.8 | 3.9 | 13.5 |
| 162 | 5 × 5 | 1221 | 1765 | 3.6 | 3.5 | 13.8 |
| Test Number | Desert Sand | Cement | Fiber | Fiber Length(mm) | Water: Binder Ratio |
|---|---|---|---|---|---|
| JZ0 | 3 | 1 | 0 | 0 | 0.9 |
| DB1 | 3 | 1 | 0.0025 | 9 | 0.9 |
| DB2 | 3 | 1 | 0.0025 | 12 | 0.9 |
| DB3 | 3 | 1 | 0.0025 | 15 | 0.9 |
| DB4 | 3 | 1 | 0.0025 | 19 | 0.9 |
| DB5 | 3 | 1 | 0.005 | 9 | 0.9 |
| DB6 | 3 | 1 | 0.005 | 12 | 0.9 |
| DB7 | 3 | 1 | 0.005 | 15 | 0.9 |
| DB8 | 3 | 1 | 0.005 | 19 | 0.9 |
| Test Number | Compressive Strength (MPa) | Flexural Strength (MPa) | ||||||||||
|---|---|---|---|---|---|---|---|---|---|---|---|---|
| Measured Value | Standard Deviation | Measured Value | Standard Deviation | |||||||||
| 3 Days | 7 Days | 28 Days | 3 Days | 7 Days | 28 Days | 3 Days | 7 Days | 28 Days | 3 Days | 7 Days | 28 Days | |
| JZ0 | 4.34 | 5.86 | 6.34 | 0.52 | 0.84 | 1.03 | 1.33 | 1.80 | 2.03 | 0.19 | 0.24 | 0.19 |
| DB1 | 6.40 | 7.64 | 11.78 | 1.09 | 1.72 | 3.90 | 1.43 | 1.89 | 2.49 | 0.10 | 0.25 | 0.11 |
| DB2 | 5.10 | 7.91 | 12.16 | 0.73 | 0.44 | 0.86 | 1.49 | 2.03 | 2.67 | 0.05 | 0.08 | 0.12 |
| DB3 | 6.03 | 8.33 | 13.82 | 0.54 | 1.03 | 0.78 | 1.66 | 2.23 | 2.9 | 0.10 | 0.51 | 0.21 |
| DB4 | 5.30 | 9.02 | 14.58 | 0.22 | 0.71 | 3.43 | 1.92 | 2.25 | 3.12 | 0.14 | 0.22 | 0.39 |
| DB5 | 5.60 | 7.67 | 12.14 | 0.65 | 0.52 | 0.24 | 1.89 | 1.96 | 2.67 | 0.18 | 0.07 | 0.07 |
| DB6 | 5.23 | 7.94 | 12.49 | 0.59 | 2.17 | 2.08 | 1.73 | 2.11 | 2.69 | 0.16 | 0.06 | 0.12 |
| DB7 | 5.11 | 8.45 | 14.40 | 0.62 | 0.89 | 2.93 | 1.54 | 2.34 | 2.91 | 0.15 | 0.18 | 0.41 |
| DB8 | 6.46 | 9.30 | 20.03 | 0.79 | 0.51 | 1.78 | 2.03 | 2.35 | 3.22 | 0.18 | 0.27 | 0.47 |
| Test Number | Mass Loss Rate (%) | Freeze–Thaw Strength Loss Rate (%) | ||||
|---|---|---|---|---|---|---|
| 25 Cycles | 50 Cycles | 75 Cycles | 25 Cycles | 50 Cycles | 75 Cycles | |
| JZ0 | 1.69 | 12.43 | 63.60 | 15.00 | 49.71 | 78.64 |
| DB1 | 0.33 | 1.25 | 4.43 | 9.58 | 41.01 | 73.40 |
| DB2 | 0.23 | 2.20 | 2.85 | 8.41 | 42.96 | 65.55 |
| DB3 | 0.42 | 2.65 | 6.9 | 13.42 | 45.69 | 67.72 |
| DB4 | 0.38 | 2.93 | 3.35 | 13.88 | 45.94 | 65.50 |
| DB5 | 0.63 | 1.95 | 2.84 | 6.09 | 44.36 | 59.95 |
| DB6 | 1.03 | 2.99 | 3.83 | 7.12 | 39.40 | 60.44 |
| DB7 | 0.96 | 3.33 | 2.90 | 10.82 | 46.84 | 63.98 |
| DB8 | 1.20 | 3.79 | 3.18 | 14.69 | 45.72 | 68.27 |
| Desert Aeolian Sand (kg/m3) | Cement (kg/m3) | Fiber Content (kg/m3) | Fiber Length (mm) | Water (kg/m3) | Sand: Binder Ratio | Water: Binder Ratio |
|---|---|---|---|---|---|---|
| 1338.9 | 446.3 | 2.23 | 19 | 401.7 | 3:1 | 0.9 |
Publisher’s Note: MDPI stays neutral with regard to jurisdictional claims in published maps and institutional affiliations. |
© 2021 by the authors. Licensee MDPI, Basel, Switzerland. This article is an open access article distributed under the terms and conditions of the Creative Commons Attribution (CC BY) license (https://creativecommons.org/licenses/by/4.0/).
Share and Cite
Ding, B.; Cheng, J.; Xia, D.; Wu, X.; Gao, L.; Ma, B.; Li, D.; Lin, Z. Fiber-Reinforced Sand-Fixing Board Based on the Concept of “Sand Control with Sand”: Experimental Design, Testing, and Application. Sustainability 2021, 13, 10229. https://doi.org/10.3390/su131810229
Ding B, Cheng J, Xia D, Wu X, Gao L, Ma B, Li D, Lin Z. Fiber-Reinforced Sand-Fixing Board Based on the Concept of “Sand Control with Sand”: Experimental Design, Testing, and Application. Sustainability. 2021; 13(18):10229. https://doi.org/10.3390/su131810229
Chicago/Turabian StyleDing, Bosong, Jianjun Cheng, Duotian Xia, Xiao Wu, Li Gao, Benteng Ma, Dongsheng Li, and Zhujie Lin. 2021. "Fiber-Reinforced Sand-Fixing Board Based on the Concept of “Sand Control with Sand”: Experimental Design, Testing, and Application" Sustainability 13, no. 18: 10229. https://doi.org/10.3390/su131810229