Article

Is the Aurora Borealis an Inspiration to the Performance of Nordic Economic Sustainability?

by
Manuel Carlos Nogueira
1,* and
Mara Madaleno
2
1
Faculty of Economic and Business Sciences, University of Vigo, 36310 Vigo, Spain
2
GOVCOPP–Research Unit in Governance, Competitiveness and Public Policy, Department of Economics, Management, Industrial Engineering and Tourism (DEGEIT), University of Aveiro, 3810-193 Aveiro, Portugal
*
Author to whom correspondence should be addressed.
Sustainability 2021, 13(17), 9961; https://doi.org/10.3390/su13179961
Submission received: 3 July 2021 / Revised: 30 July 2021 / Accepted: 3 September 2021 / Published: 6 September 2021

Abstract

:
The Nordic countries are well positioned in the main international economic, social, and sustainability indices, and the scientific literature that supports these indices argues that a rise in these rankings promotes economic growth. With this unprecedented empirical study, we intended to assess whether, in the case of the Nordic countries, the long term maintenance of high positions translates into sustainable economic growth. The period considered was between 2004 and 2008, and we used the ARDL methodology to assess time series. The ARDL methodology has the advantage of providing us with short and long term coefficients. Using five of the leading international indices, we conclude that, for the Nordic countries, economic freedom is not important for economic growth, while business friendly regulation is the most important variable. Three important findings of our study (in which Granger causality complemented the ARDL methodology) are that these countries were able to adapt perfectly to the globalization process, entrepreneurship makes an important contribution to the continued economic and social success of these countries (allowing them to continue to enjoy their “Nordic welfare states” in these uncertain times), and corruption harms the Nordic economy. These variables have contributed to the countries’ economic and social sustainability.

1. Introduction

The Nordic countries are culturally homogeneous, relatively wealthy, and have an efficient, productive, and strong public sector, while enjoying a culture of institutional cooperation that defends both public and private interests and acts quickly, so that private initiatives do not get lost in the intricacies of public bureaucracies [1]. The so-called Nordic model, which has brought such success to these countries, is based on three key and unique factors: (1) ancestral political traditions that are exceptionally egalitarian and democratic; (2) generous social states; and (3) exceptional labor market policies and labor relations, where cooperation is widely accepted by companies, workers, associations, and unions [
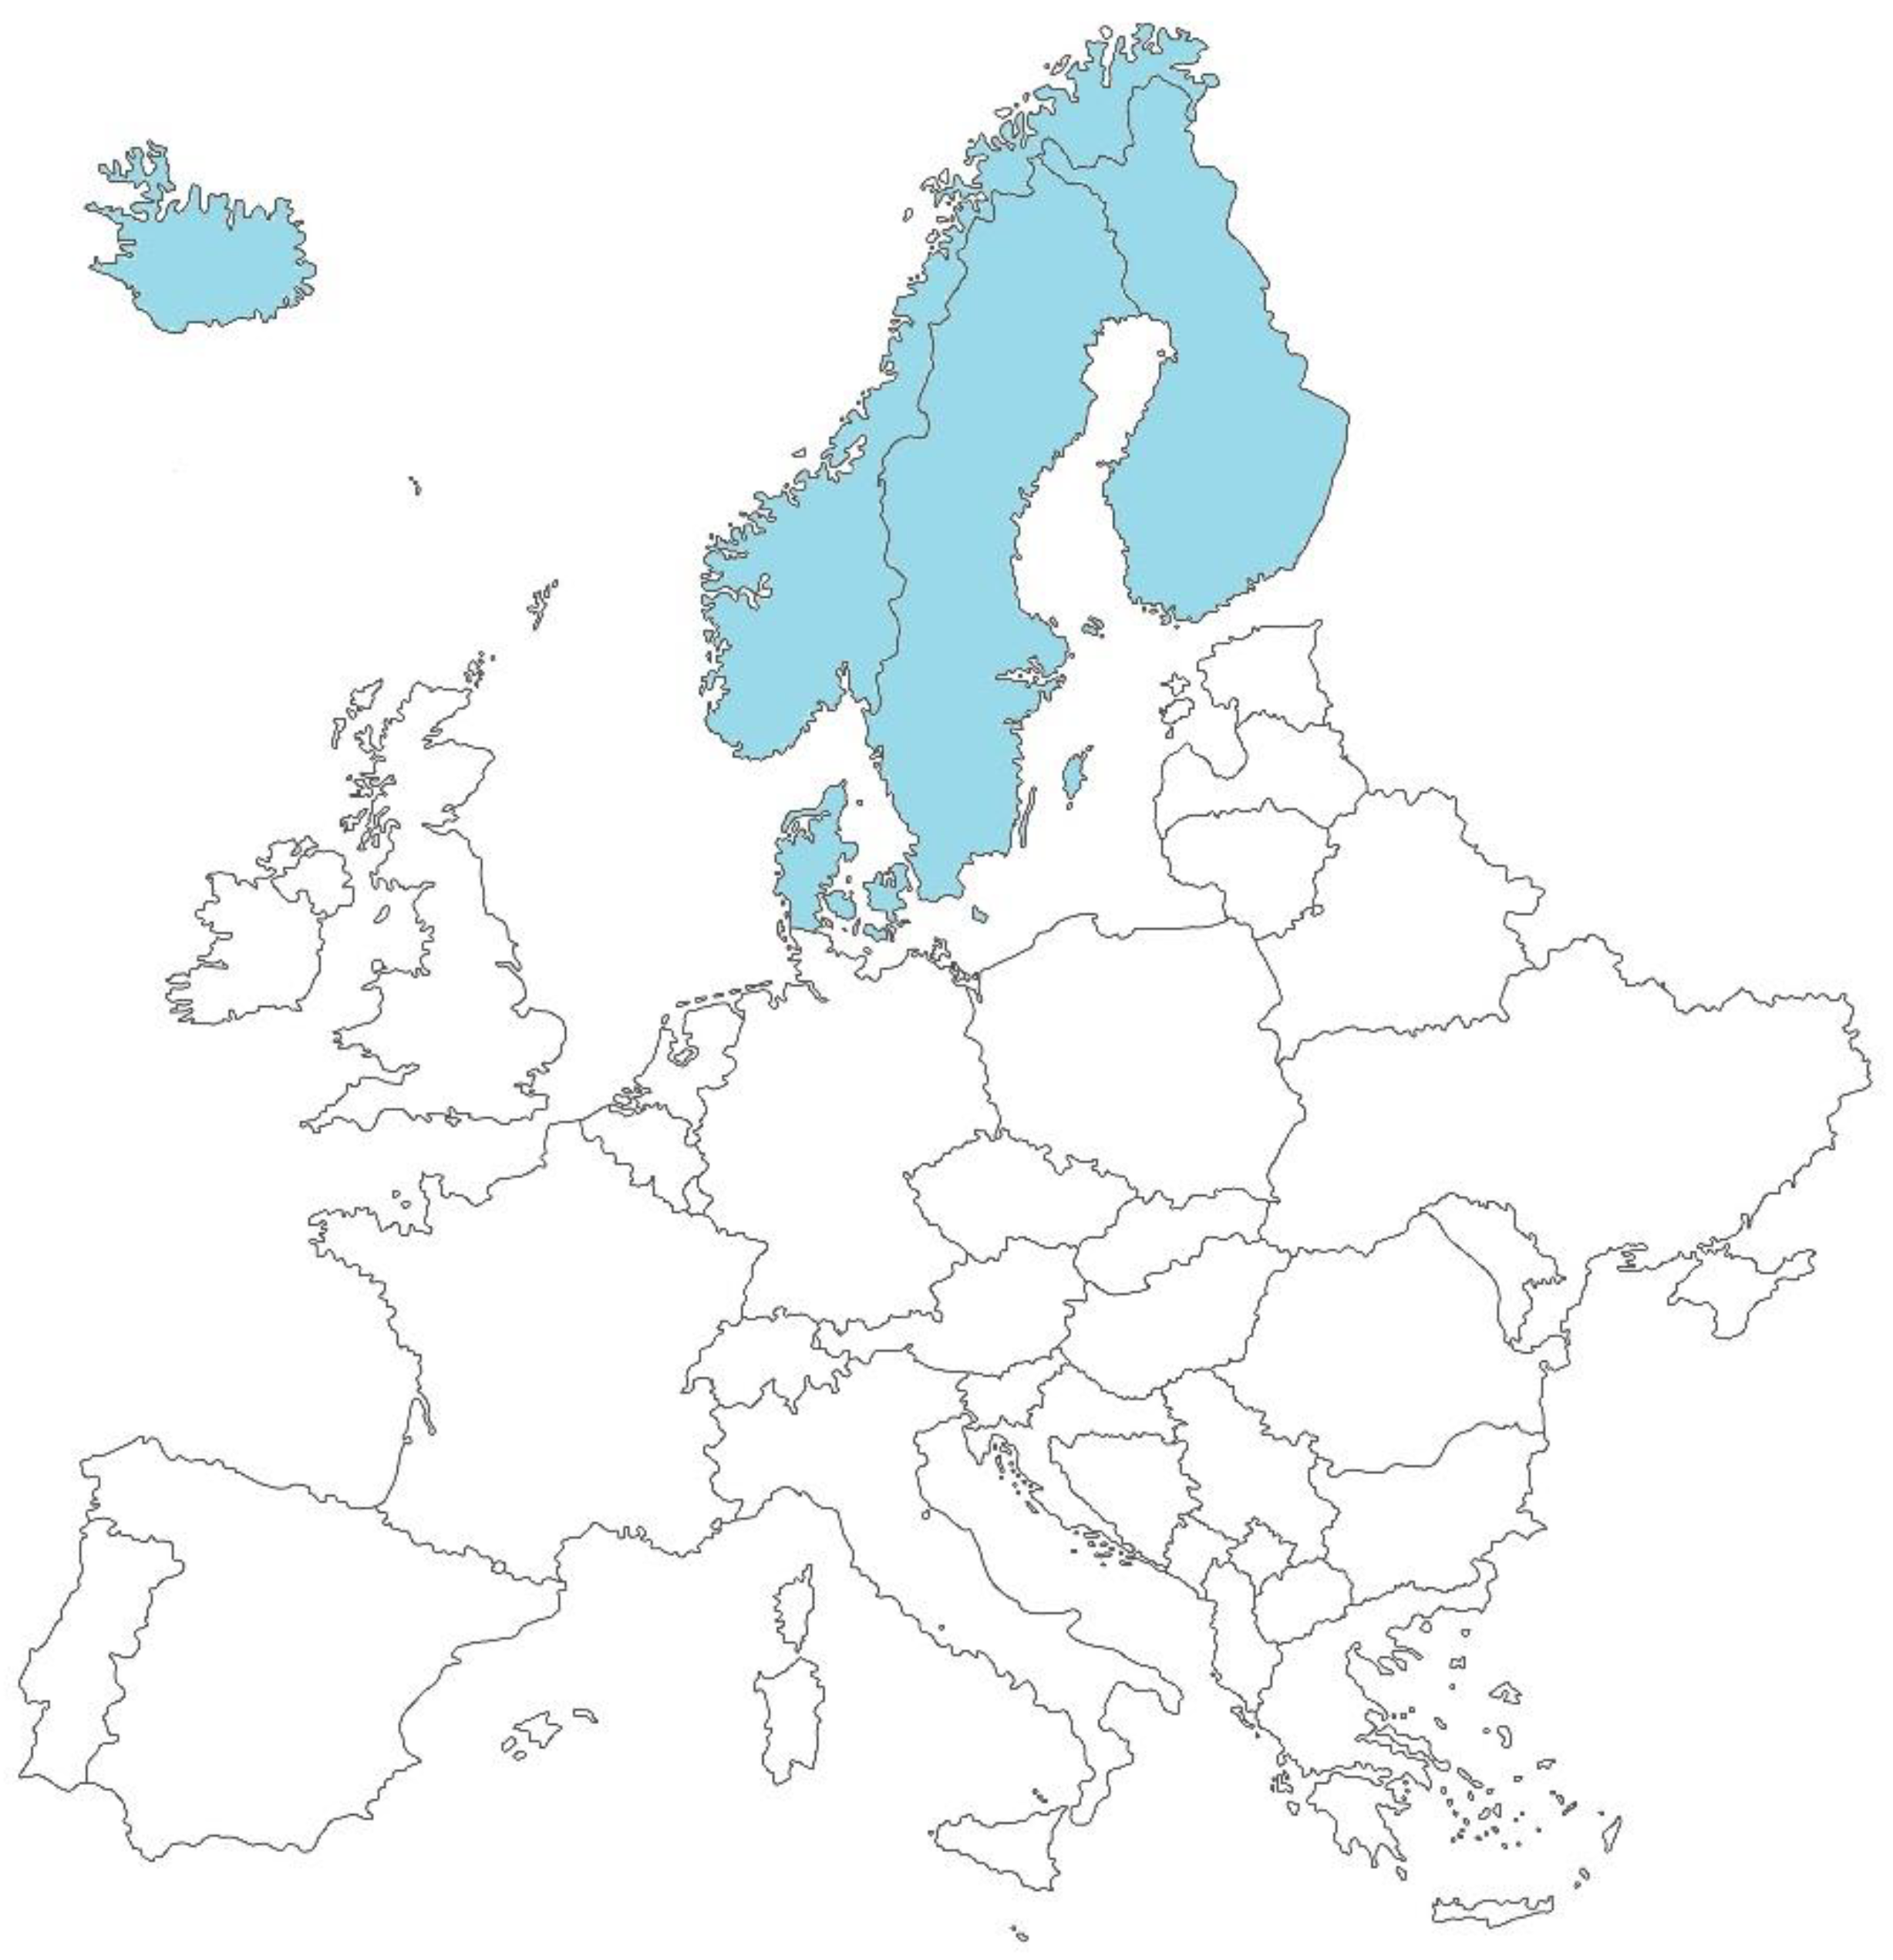
1]. While in many countries unions, associations, and other interest groups are limited to protesting and demanding instead of producing, in the Nordic countries, cooperation is the most important factor: helping to find the best solutions for all interested parties and benefiting both employers and workers. In geographic terms, despite being countries with large territories (except Iceland and Denmark; Figure 1), they have small populations, but they benefit from extensive natural resources, which have been managed sustainably [1].
The great success of the Nordic countries has its roots in the distant past and relies on social trust in institutions, politicians, governments, and the judicial system. Social trust is the most important resource, which helps to promote investment and entrepreneurship, creates jobs, allows economic freedom, and offers countless benefits that stimulate the economy and society [2]. Nordic citizens believe that public agents work fairly and transparently, with a high degree of integrity, and this manifests positive effects and economic successes which spill over into the entire economy, causing economic development [2].
On the one hand, the Nordic countries are characterized by a cycle in which several important institutions and indicators work in unison: democracy, generous social status, low crime rate, low corruption, social trust, free press, high and free schooling, the strong role of civil society, and social cohesion [3]. On the other hand, the Aurora Borealis is an amazing phenomenon of lights in the sky that happens in specific countries, the “blessed” ones. Auroras that occur in the Northern hemisphere are known as aurora borealis, or the “northern lights”. Iceland, Finland, Sweden, Norway, and Denmark are among the top ten countries where the aurora borealis can be seen. Our goal was to assess whether, in the case of these Nordic countries, the long term maintenance of positions at the top of social indices translates into sustainable economic growth, as the aurora borealis phenomenon persists.
With Nordic countries being ranked first in practically all main international indices, the main objective of this work was to assess, with the use of empirical models, whether there is a significant relationship between these positions and economic growth, and which of these indices mostly impact this growth. The aim of this paper was, thus, to fill the identified research gap by conducting a quantitative analysis of the determinants in the five Nordic countries (in blue in Figure 1), for the years 2004–2018, concerning the relationship between economic freedom, ease of doing business, globalization, entrepreneurship, corruption, and economic growth. Another added value of this paper is that, as far as we know, this is the first time these variables have been used jointly for the Nordic countries.
In empirical terms, we first used the ARDL model and obtained the short and long term coefficients. After estimating the VAR model, we performed the Granger causality test. Through the results obtained in this test, we validated almost all of the results obtained in the ARDL model, and concluded that there are several important bidirectional and unidirectional relationships between the independent variables of the ARDL model.
The remainder of this paper is organized as follows: In Section 2, we briefly refer to the relevant literature. Section 3 shows the data, variables, and statistics. Section 4 presents the empirical analysis of the total data using the ARDL methodology and the Granger causality test after resorting to employing VAR modeling, and Section 5 offers the respective discussion. Finally, in Section 6, we conclude the paper.

2. Literature Review and Hypothesis Formulation

2.1. Economic Freedom

The concept of economic freedom is associated with the liberalism that emerged in Europe in the 18th century. Economic liberalism argues that the state should not intervene in the economy, allowing private initiatives to proliferate. More capable and better prepared individuals, through their merit, make the economy flourish. Each person is responsible, because the freedom of people to decide and control their lives improves living standards and, therefore, the state must intervene as little as possible in people’s lives [4].
Under this economic theory, government actions going beyond the minimum necessary level and impose a series of restrictions on economic activities can cause companies’ resources and initiatives to be diverted, leading to a decline in the country’s economic growth. Proponents of this theory argue that economic freedom causes more and better economic growth [5].
Much scientific research has been carried out on economic freedom, namely, on the effect that this freedom has on economic growth. As economies usually work best without outside interference, most studies conclude that increased economic freedom tends to manifest higher rates of economic growth [6].
Neoclassical economic growth models, based solely on production functions that only consider labor, capital, and technology, are incomplete, because they do not include one very important determinant—economic freedom [7].
When counting the number of studies that provide empirical evidence of the existence of positive effects between economic freedom and economic growth, more than 260 studies were found stating that economic freedom has positive impacts, provoking advances in economic growth, living standards, and happiness [7].
Although economic freedom is important for economic growth, increasing economic freedom in general terms does not necessarily promote said growth. This is implied by the fact that there are some dimensions of the index that do not present statistical significance, or even have a negative effect, in which case the most important dimensions should be selected [7].
Free trade facilitates the flow of goods and services worldwide and adds value to local economies, contributing to global economic growth. In the last few decades, free trade has been greatly increased through preferential trade agreements, and the resulting benefits have been increasingly recognized by all stakeholders [8]. As defenders of free trade, these authors end their arguments by stating that this freedom has been the basis of economic advancement and the expansion of global markets, which has proven to be a powerful engine for growth and a key factor in the global fight against poverty. Freer economies also lead in terms of innovation [8].
Recently, in an empirical analysis of 43 European countries between 1995 and 2014, the authors concluded that economic freedom has a positive effect on economic growth [9]. Contrary to most researchers, who find positive correlations between economic freedom and economic growth, a small number have argued that high levels of economic freedom can be detrimental to economic growth. The complete or significant removal of protectionist barriers exposes domestic companies to competition that is difficult to match. This situation is more worrying in developing countries [10].
However, economic freedom has not just been analyzed in terms of the effects it may or may not have on economic growth. In seeking to analyze whether a country’s competitiveness is influenced by economic freedom, and in discovering the nature of this influence, it was found that countries considered highly free in economic terms are also seen as highly competitive. Standard of living, employment rate, productivity, trade balance, and national attractiveness are directly determined by economic freedom [11].
Nordic countries generally have large budget expenditures and large governments, which typically create obstacles to business activity, but companies in these countries enjoy peaceful coexistence with their governments and increasing degrees of economic freedom, and thus achieve economic growth [12]. In Nordic countries, where a well-being mentality is championed, economic freedom is considered a key element to achieving economic sustainability goals [13]. These authors, using an economic freedom index as one of the dependent variables, also state that there is a relationship between the well being mentality and sustainable development.
Given the review of the literature, in general terms and of the Nordic countries, on the effects of economic freedom on the growth of the economy, we formulated the following hypothesis to be tested empirically:
Hypothesis 1.
There is a positive and significant relationship between economic freedom and economic growth.

2.2. Ease of Doing Business

There are countless studies on the relationship between regulation that makes it easier to do business and economic growth. In general, the conclusions are practically unanimous, in that countries with better regulations are growing faster than others. The entry of companies into countries with lower incomes is more expensive and more bureaucratic. Countries with higher regulations have higher corruption, as well as larger unofficial economies [14].
Countries with democratic governments have less regulation regarding the constitution of companies. Such rules provide environments in which new participants, with innovative and motivating ideas, can start a business easily, and in which highly productive companies can invest, expand, and create jobs [14]. On the one hand, countries that reduce regulatory burdens tend to achieve higher business growth rates. On the other hand, when countries in the lowest quartile of the ranking manage to move to the highest quartile, this could add two percentage points to their economic growth, which would represent a large increase [14].
Policies that promote the ease of doing business (EDB) determine the level of income per capita [15]. The classifications in the Doing of Business Index of legal and political–institutional quality are an important explanatory variable for economic growth, as has been empirically tested in several studies. Evidence has been found of the existence of a significant relationship between increases in this index and economic growth per capita, in both the short and the long term. The results obtained suggest that the benefits of economic policy reforms are lasting. This index can provide a tool to promote economic development, as an improvement in the business environment can contribute to greater economic growth [15].
When using EDB indicators as business regulation-level proxies for 172 countries between 2006 and 2010, significant statistical evidence was found for a relationship between business regulatory reforms and economic growth. Each additional reform is associated, on average, with an increase in economic growth by 0.15%, and the countries that carried out more reforms in terms of business regulation before the economic and financial crisis of 2008 mitigated the effects of this crisis more easily [16].
For seven Balkan countries, evidence was found that when a country rises in the ease of doing business ranking, economic growth increases by 0.72 percentage points. Considering the ten dimensions of the Doing Business Report, the one that most impacts economic growth is “Getting credit”; this can promote economic growth per capita by 0.77 percentage points [17].
The Doing Business Report has numerous advantages in terms of measuring and allowing comparisons between countries and the temporal evolution of important business variables therein, such as measuring costs, times, records, credit, contracting, and imports and exports [18].
The higher the position of a country in the ranking, the more favorable its regulatory environment at the business level; that is, the easier it is to create and develop a business.
This World Bank index has become a widely used tool for measuring the quality of business regulations around the world, which substantiates the idea that complicated and unnecessary regulations stifle activity. More favorable business environments are established by removing these regulations [18]. Other authors, in an empirical study, found that there is a positive and significant relationship between the ease of doing business scores and a country’s socioeconomic wealth [19]. The more obstacles to free trade a government introduces in its country, the lower its level of wealth. Some studies have concluded that there is a positive effect on GDP growth per capita, as well as on foreign direct investment (FDI) flows and exports, when regulatory quality is improved at the business level, thus reducing, among other factors, the so-called costs of the transaction [20].
However, the relationship between economic growth and ease of doing business, or any variable that integrates the index, is not always empirically verifiable for all world economies. As, even though significant correlations between the index and the FDI have already been found, these are only for middle income countries. In low income countries, such correlations are not often seen [18], and they have been found to be insignificant in developing countries [21].
Considering the EDB scores and given that the business environment is heterogeneous between countries, the positive effects flow from developed countries to developing countries—the so-called spillover effect [22].
For Nordic countries, an efficient public sector plays an important role in economic growth [23]. The removal of barriers and bureaucracies in the economy raises issues of resistance on the part of workers, but the compensation in economic terms is remarkable and rewarding [23].
Given the importance of the variable that measures business friendly regulations, the Nordic countries were advised to reduce the barriers and administrative bureaucracies involved in the setting up of companies, since they harm economic growth [24].
On the contrary, following the long tradition of corporate movement, several reflection clubs exist in Nordic countries related to business and financed by business associations, which are dedicated to spreading liberal ideas and policies and are designed to encourage the adoption of business friendly approaches [25].
Based on the literature review, both in general terms and specific to the Nordic countries, as well as the variable that measures the existence of business friendly regulations, we formulated the following working hypothesis:
Hypothesis 2.
Removing or simplifying administrative or legal barriers that facilitate business positively and significantly affects economic growth.

2.3. Globalization

In terms of the scientific literature, globalization is usually divided into economic, political, and cultural terms and refers to the increasing integration of peoples. It is characterized by the expansion of relationships between people, and it is difficult to say when the globalization process began. In economic terms, globalization is seen as the increasing integration of goods and capital markets around the world, as well as the lifting of protectionist barriers to trade and investment [26].
As there are no means of the direct measurement of globalization, proxies are also required for this variable. The globalization index developed by the KOF Swiss Economic Institute is one of the most commonly used [26]. In recent decades, economists have begun to pay more attention to the effects of globalization, with the existence of numerous special editions of journals dedicated to this theme, as well as the publishing of several books. In almost all studies, the conclusions were similar, stating that there are positive effects on economic growth brought about by globalization [26]. The Globalization Economic Index indicator was divided into three dimensions, namely, economic, with a weight of 37% in the final score, politics, with a weight of 26%, and social, with a weight of 37% [27]. Two years after its creation, the weight of dimensions in the index became the same (33.33%), and the index is now composed of more than 40 indicators [27].
Several authors have already found evidence of the benefits that globalization brings to Nordic countries’ economies. Nordic countries benefited from the expansion of the world economy in the 1950s and 1960s due to the high degree of openness to the outside it introduced. After the crisis of the 1970s, the Nordic countries invested in the education, health, and the safety of their citizens, which allowed them to relaunch their economies [28].
Using the KOF index as a proxy for globalization, the Nordic countries had higher GDP per capita growth rates than the most developed European and Anglo-Saxon countries, despite undergoing a continuous increase in their openness to the outside [16]. Although a loss of social well being has traditionally been associated with globalization, in the case of Nordic countries, this has not occurred. This proves that social well being and globalization are compatible, as are globalization and the high tax burden that supports Nordic social well being [12].
Still, globalization and the consequent competition provide an opportunity, and not a threat, and this has been the basis of the economic growth of the Nordic countries. Small economies, such as Nordic ones, need to develop and benefit from international contacts derived from globalization [23]. In the case of Denmark, this country has adapted to globalization as a survival strategy [29]. The adaptation was successful, and Denmark successfully established a Scandinavian social welfare model [29]. Although some Nordic countries have a large land area, they are still small economies, are highly open to the outside, and have been able to exploit the advantages of globalization, largely due to their levels of productivity [30].
Additionally, concerning the important issue of productivity, Nordic companies have taken advantage of globalization and increased their production in order to remain competitive in international markets; on average, their productivity is currently higher than U.S. companies [31].
Given the literature review carried out regarding globalization in the context of Nordic countries, we formulated the following hypothesis, to be tested empirically:
Hypothesis 3.
Nordic economies know how to take advantage of globalization to grow economically, without affecting their traditional economic and social models.

2.4. Entrepreneurship

Entrepreneurial activity supports economic growth and causes competition and innovation in the economy [32]. For the top 50 in the ranking of the Global Competitiveness Index, innovation was one of the pillars of the GCI that most contributed to the economic growth of these 50 countries for an extended period [33].
In the Nordic countries, special attention is paid to entrepreneurship, and an organization has been created between these countries, which, in addition to supporting and encouraging innovation projects, also pays attention to entrepreneurship, including entrepreneurship among women (Nordic Innovation). These countries provide high economic and social support to citizens in need, which could discourage entrepreneurship, but because they enjoy high levels of education, entrepreneurs are provided with an abundant, highly qualified workforce, which facilitates innovation and entrepreneurship.
In the Nordic countries, an increase in entrepreneurship has begun to be seen, largely because of the entrepreneurial streak of the children of immigrants. It is very common for second generation immigrants to follow entrepreneurial careers facilitated by their high schooling [34]. Still, on the rates of entrepreneurs, the Nordic countries present low rates in comparison to other European countries or the U.S. [24]. The lack of entrepreneurial capacity, the lack of business skills, the lack of specific financing, and the aversion to risk can help explain the Nordic people’s lack of appetite for entrepreneurship [24]. Perhaps it is because of this lack of appetite of the Nordics that the second generation of immigrants are pursuing entrepreneurial careers, thus taking the place that the natives do not want [34].
In a reflection on entrepreneurship in the Nordic countries leaving some important career paths unfilled, education emerges as preponderant for entrepreneurship, mainly in the training of young people in order to increase their entrepreneurial skills to succeed in the business world. When analyzing the existing entrepreneurship education strategies in the Nordic countries, it was found that these countries have adequate strategies (although they could be improved), and, yet, that they should foster entrepreneurship programs across the different Nordic countries. Perhaps this reality, which was already verified in 2012, has contributed to the importance of entrepreneurship in economic growth [35].
Citing similar conclusions obtained in other studies and for the Nordic countries between 2004 and 2013, it can be concluded that there are positive and significant relationships between entrepreneurial activity and GDP per capita [24].
Studying factors related to entrepreneurship and innovation that influence economic growth, using the quadruple helix model and the traditional north–south comparison, it can be concluded that the northern European countries (mostly Nordic) present better results in innovation and entrepreneurship than the countries of the south, with significant differences for the economy [36].
Moreover, in a north–south comparison, between EU countries only in a cluster division, the integration of Nordic countries into the same cluster showed better performance in terms of innovation potential and capacity for entrepreneurship, demonstrating a high potential for economic development sustainable [37].
Considering these previous findings and concentrating on the Nordic countries, we formulated the following hypothesis, also to be tested empirically:
Hypothesis 4.
There is a positive and significant relationship between entrepreneurial activity and GDP per capita in Nordic countries.

2.5. Corruption

Corruption usually involves bribes paid to public officials and government agents to influence political decisions and to induce large concessions that favor the interests of private companies [38]. Given that these decisions affect free competition and the costs for families and companies, economists and the scientific community have long been interested in analyzing the effects that corruption has on economic activity in different ways, including on economic growth [38]. Corruption is a social problem that corrodes the central institutions of a society, and it is up to the governments of the countries to control it so as to obtain better institutional performance [39].
In the scientific articles related to economic growth, corruption is seen in two ways: (1) as a factor that causes growth, as it helps to circumvent inefficient and rigid regulations, and since without its existence, certain businesses would not actually exist; (2) as a factor that causes economic setbacks because it impedes efficient production and innovation, as a result of unfair and imperfect competition [40]. These two theories have become known by the expressions “grease the wheels” and “sand the wheels,” which describe corruption as being expected to influence economic growth [40].
Although both theoretical and empirical studies provide disparate evidence, usually, the effects of corruption are harmful in terms of economic growth for both developed and developing countries; however, in countries with medium and low incomes, these effects are more intense [41]. Regarding high income countries that present better quality regulation, greater transparency, and more effective control mechanisms, the relationship between the decrease in corruption and economic growth may not be visible in empirical terms [41].
Countries with lower levels of corruption induce greater confidence in institutions in their citizens, which causes greater business activity [42] and, consequently, greater economic growth. High corruption in countries that are more open to the outside world, in addition to having a direct impact on economic growth, tends to affect foreign direct investment, which ends up being detrimental to the economies [42].
In a wide range of EU (developed) countries, in both the short and the long term, empirical evidence has emerged that reducing corruption promotes economic growth, and, thus, countries should seek to take measures to combat it [43].
On the contrary, countries that display high levels of globalization, high incomes, and deep rooted democratic values, as well as political stability, trust in institutions, and legal efficiency, traditionally have low levels of corruption [44].
Since 1995, Transparency International has produced, annually, the Corruption Perceptions Index, which has been widely used in empirical studies on corruption in different countries.
Hypothesis 5.
Corruption has a nonstatistically significant effect, or an effect with significance that is negative and of reduced value, on the GDP per capita of Nordic countries.

3. Data, Variables, and Statistics

The sample used in this study focuses on the period between 2004 and 2018 in the Nordic countries. For the ARDL methodology, we calculated the averages of the variables of the five countries for each year, thus obtaining a time series composed of all variables. Table 1 shows the variables used in the empirical analysis, the units of measurement, and the sources of the data. Table 2 displays the averages of the variables for each country considered, while Table 3 presents the main descriptive statistics, and Table 4 presents the correlations. As shown in Table 2, in terms of average GDP per capita in purchasing power parities, the highest figure was found in Norway. Conversely, in Finland, the average value of this variable was the lowest.
Regarding economic freedom, the highest average value was found in Denmark and the lowest in Iceland. Concerning the ease of doing business as a result of favorable regulatory environments, the highest average value was found in Denmark, and the lowest in Iceland. Regarding the corruption index, it was found to be lower in Denmark and higher in Iceland.
Regarding the variable that measures economic globalization, the highest average value was found in Sweden and the lowest in Iceland. The highest average index of entrepreneurship was found in Iceland and the lowest in Finland.
Table 3 contains the main descriptive statistics of the sample used, as well as the results of the Jarque–Bera test and the asymmetry and kurtosis statistics. The Jarque–Bera test was carried out to determine the normality, together with kurtosis and asymmetry. As shown by the values in Table 3, the variables do not follow normal distribution, since the data present left asymmetry (also referred to as data with negative asymmetry). The kurtosis statistics inform us of the possible existence of outliers. As the statistics are all below three, our variables are platykurtic variables; that is, the value of excess kurtosis is negative, which implies that the distribution will display thinner tails than normal.
To derive accurate results from the empirical analysis, we also considered the problem of multicollinearity. When applied to our variables, the Pearson’s correlation test (Table 4) showed that there is no multicollinearity between the variables considered. We used the value of 0.80 as a limit, as posited by some renowned econometricians, although there is no absolute consensus on this value [44].

4. Empirical Analysis

4.1. Model Specification and Estimation According to the ARDL Methodology

The ARDL (autoregressive distributed lag) cointegration methodology allows for assessing the existence of a relationship between a dependent variable and a set of regressors in cases in which there is no certainty about the stationarity of the regressors. The proposed tests allow for assessing the significance of the lagged levels of the variables via a univariate equilibrium correction mechanism. In terms of economic series, this cointegration becomes the means to determine the long term relationships in the time series [45,46,47,48,49].
As most time series are not stationary—that is, they present large divergences from their mean over time—econometrics have begun to focus on the problem of cointegration, which detects a state of steady equilibrium between variables. If the variables do not cointegrate, then spurious regression problems are seen, and the results become meaningless [45,46,47,48,49].
The ARDL approach has a considerable number of advantages over traditional cointegration. In addition to being more flexible and more rigorous when I(0) or I(1), its implementation and interpretation are more simple because it is just an equation. Unlike other methods, it can be used when the variables assume different lags and are quite reliable in small samples. It also provides impartial long term estimators, and, finally, autocorrelation and endogeneity can be adequately addressed [50].
The ARDL cointegration methodology, in addition to testing the dynamic interactions between variables, also examines the short and long term relationships between variables. This methodology has two further advantages: on the one hand, in the presence of endogeneity, the model has impartial coefficients; on the other hand, it is efficient and consistent in small samples [51].
The ARDL cointegration technique is one of the greatest discoveries of the late 20th century in terms of time series analysis, and it has the advantage of not requiring a pre-test of the unit root, unlike other techniques used in the identification of cointegration vectors. However, if the steps of the methodology are not followed correctly, it can give rise to inconsistent and unrealistic estimates when making forecasts [52].
In the context of the ARDL methodology, we specify below the model we used to empirically assess the existence of a long term relationship between GDP per capita and a set of five internationally recognized indices that measure as many other concepts as possible, and which, in the theoretical and empirical literature, have been shown to cause economic growth in Nordic countries between 2004 and 2018. For bound tests of cointegration, the ARDL model used in our study is given in Equation (1), according to Shahbaz et al. [53]:
Δ G D P p c t = a 0 + i = 1 m α 1 i Δ G D P p c t 1 + i = 1 m α 2 i Δ E F W t 1 + i = 1 m α 3 i Δ E D B t 1     + i = 1 m α 4 i Δ K O F t 1 + i = 1 m α 5 i Δ G E I t 1 + i = 1 m 6 i Δ C P I t 1 + β 1 E F W t 1 + β 2 E D B t 1     + β 3 K O F t 1 + β 4 G E I t 1 + β 5 C P I t 1 + ε t  
where Δ is the first difference operator, a0 the independent term, and ε is the error term. Equation (1) shows the error correction model (ECM), wherein the coefficients are not restricted [48,53]. The terms with summation signs represent the error correction dynamics, and the five β values represent the long term relationship [53]. For the rest of the variables, we advise the reader to consult Table 1.

4.2. Analysis of the Stationarity of Variables

Given that an estimation is possible using the ARDL methodology, it is not necessary to measure the stationarity of the variables [46,47,48,49]. Even so, we decided to carry out two unit root tests for the sake of determining the lag order of the variables with stationarity. We performed the augmented Dickey–Fuller (ADF) and Kwiatkowski–Phillips–Schmidt–Shin (KPSS) tests [54,55], the results of which are shown in Table 5.
The ADF test is based on the null hypothesis that the series is stationary and the alternative hypothesis that the series has a unit root. In the case of t stat <   t crit , we did not reject the null hypothesis, which means that the series is stationary. The KPSS test uses the Lagrange multiplier (LM) statistic, and the test statistic is compared with the critical value of the desired significance level.
Through Table 5, we verified that all variables obtained stationarity until the first differences, at most. As such, although it is not necessary to use the ARDL model in order to test stationarity, we determined that all variables assumed maximum stationarity until the first differences.

4.3. Cointegration Tests and Bonds Tests

Testing cointegration is a necessary step in establishing whether a model empirically exhibits significant long and short term relationships [52].
Thus, using the cointegration tests of the ARDL model, we obtained the ideal lags and tested the possible long term relationships between the variables of the model. The best known of these tests is the AIC criterion, which assesses the quality of a statistical model by calculating the amount of information that a model loses, thus determining the best model. The best choice is that with the lowest AIC score, because, in this case, less information will be lost meaning its quality will be better [52].
Through the analysis of cointegration via the AIC criterion, as shown in Table 6, we can state that the ideal ARDL model is based on a lag for the GDPpc, EFW, and EDB variables, as well as the remaining zero lag variables. Thus, we did not reject the null hypothesis of the nonexistence of cointegration at a significance level of 1%, which implies the existence of long term relationships between the independent variables and the dependent variable, that is, lags (1 1 1 0 0 0).
The F statistic, which was calculated for the cointegration order and chosen using the AIC criterion, was 30.87, and the upper limit of the critical F at the 5% significance level was 4.01. As such, we rejected H0, the nonexistence of a long term relationship between at least one independent variable and the dependent variable GDP per capita, which again confirms the existence of these relationships.
Given the results obtained through the cointegration tests and the bounds tests, the estimation of the ARDL model through the correction of errors seems to be the most appropriate.

4.4. Long Term Coefficients and Short Term Dynamics Based on the ARDL Model

Once the existence of long term relationships between the independent variable and at least one dependent variable had been verified, we estimated, through the ARDL models, the respective coefficients, as well as the short term dynamics. To better interpret the coefficients, we used a log–log model specification, which also has the advantage of obtaining elasticities.
The results of the long term ARDL estimates (Table 7) show that there are significant long term relationships between business friendly regulations, globalization, entrepreneurship, and corruption, which demonstrates the importance of these variables for GDP growth per capita in the Nordic countries. The economic freedom variable was not statistically significant.
Regarding the results of the short term dynamics (Table 8), none of the variables reached statistical significance. The error-correction equations (also called “adjustment spirit”) in the two models show statistical significance at the levels normally considered, which again implies short and long term cointegration between the independent variables and the dependent variable.
These coefficients also indicate the rate of annual adjustment toward equilibrium, with both models showing that the variables contribute to more persistent economic growth, given that, for model 1, economic growth is only adjusted by approximately 25% in a year, and in model 2, this value is approximately 20%.

4.5. Diagnostic and Stability Tests of the Regression Coefficients
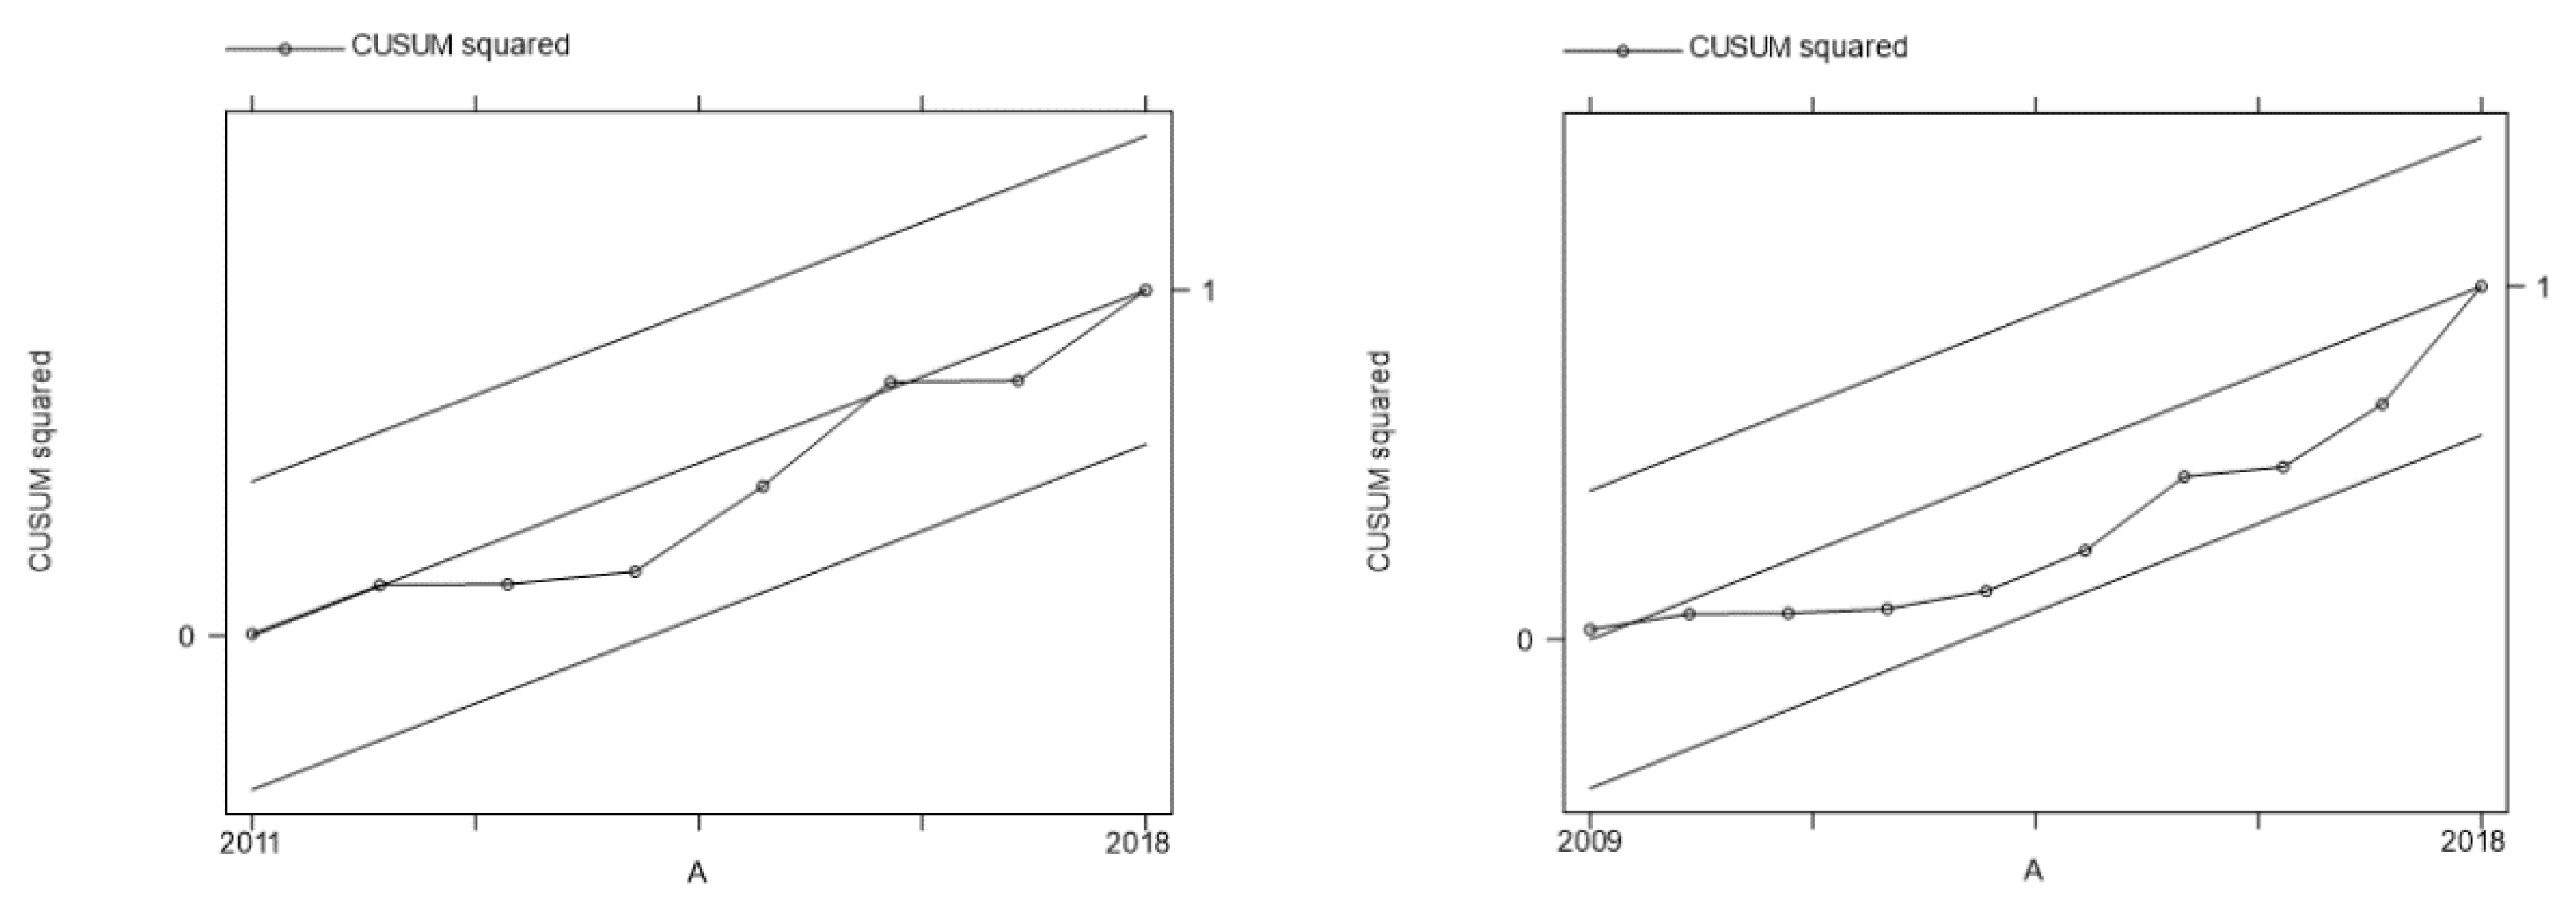
The results in Table 9 verify that the models did not show serial correlations or heteroscedasticity. The CUSUMSQ stability test suggests that the two models were stable, given that they remained within the critical limits for the 5% significance level (Figure 2). We thus guaranteed the robustness of the results [55].

4.6. Granger Causality

Causal tests became more widely used after the publication of an article in the journal Econometrica by the British econometrist Clive Granger. This author assumed that the future cannot cause the present or the past, but the reverse can be true. For example, if event A occurred in the past, event B occurs in the present, and C will occur in the future, this may mean that A causes B or C, but C does not cause B or A [56].
Granger’s methodology is frequently used in the scientific literature on economics to test temporal relations and changes in economic variables; that is, to verify the temporal precedence of one variable in relation to another.
Granger proposed a causality using autoregressive vector linear models (vector autoregressive analysis (VAR)), in which if one time series, x (n) Granger, causes another, y (n), then past knowledge of the first improves the predictability of the second. This is stated in the expression:
x   ( n ) G r a n g e r C a u s e y   ( n )
Importantly, this causality has the property of asymmetry, that is: x   ( n )   G r a n g e r C a u s e   y   ( n ) does not imply that y   ( n )   G r a n g e r C a u s e   x   ( n ) , because there may be a unidirectional relationship but no bidirectional relationship.
In empirical terms, Granger causality is obtained via two regressions, namely, those represented in Equations (3) and (4).
X t = j = 1 m j   x t j + j = 1 m β j   Y t j + ε t
Y t = j = 1 m γ j   y t j + j = 1 m Ø j   x t j + μ t
where ε t and μ t represent the so called white noise that is not correlated, and m is the higher temporal value of the data considered. The validity of the series studied through Granger’s causality is verified via Test F, where the null hypothesis of the coefficients states that, together, j = 1 m β j and/or j = 1 m Ø j   equal zero, as expressed in Equation (4) [37].
F = ( SSSR S R SSSR I R ) ( x ) ( SSSR I R ) ( n k )
In the former, SSSR is the sum of squares of the residuals of the restricted regression; SSSIR is the sum of squares of the residuals of the unrestricted regression; x is the number of lagged errors of variable X; n is the sample size; and k is the number of regressors estimated in the unrestricted regression, including the constant.
If, through the F test, the null hypothesis for Equation (3) is rejected and it is not rejected for Equation (4), this indicates that series y causes x, and not the other way around. If, in turn, the null hypothesis is rejected for both equations using the F test, then one can speak of a bidirectional relationship between the two series (x y). Finally, if the F test does not reject the null hypothesis for both equations, then there is no evidence of causality between the two time series.
The Granger causality test is performed according to two hypotheses.
Null hypothesis: The lagged variable does not cause the other variable.
Alternative hypothesis: The lagged variable causes the other variable.
The decision criteria: Reject the null hypothesis if the p-value of the x 2 statistic is <0.05.
Herein, after analyzing the long term relationship, we used the Granger causality test to determine the potential causality between the variables. Given the verified cointegration between the variables, it is to be expected that there are some uni or bidirectional, and unidirectional causal relationships between them. To be able to perform the Granger causality test, it was first necessary to estimate the VAR model [57].
To evaluate the direction of causality between the study variables, a pairwise Granger causality test was conducted on the variables, and the results are presented in Table 10 below.

5. Discussion

Through the succession of tests carried out in the previous section, we conclude that there are long term relationships between at least one of the independent variables used and the dependent variable of economic growth for the Nordic countries in the period between 2004 and 2018. Still, in the long term, all coefficients assumed a significance that is in line with expectations.
Estimates using the ARDL models (1 1 1 0 0 0) and (1 1 1 0 0) show that the variables that are significant in the long run are business friendly regulations, globalization, entrepreneurship, and corruption; while, in the short term, none of the variables are considered statistically significant. Of the four significant variables, the one that contributes the most to economic growth is business friendly regulation, which again demonstrates its importance for economic growth. The variable of economic freedom is not considered significant here, despite presenting a positive coefficient, as was expected.
Concerning economic freedom, surprisingly, the conclusions that were drawn for the Nordic countries in terms of positive effects on economic growth do not pertain to this specific case. Additionally, for the Nordic countries, the World Economic Forum advises policymakers to reduce administrative barriers for businesses, thereby increasing economic freedom, despite these businesses having already made progress [58]. Perhaps this is why this variable did not assume statistical significance. There are two possible explanations for the results obtained for this variable: (i) the means of measuring these variables is not the most accurate; or (ii) the score attributed to these countries in these years is not the most accurate. On the contrary, some authors have found empirical evidence that, in some situations, increases in economic freedom do not contribute to economic progress [7]. Due to the above, our first hypothesis was not confirmed.
Special attention should be paid to the variable of business friendly regulation, as it is the one that most impacts economic growth. This is in line with the recommendation of the World Bank, in which the countries with the highest scores in the EDB classification enjoy higher economic growth via greater productivity [59]. Lower entry costs encourage the emergence of new and better companies and reduce corruption, which leads to greater employment opportunities. In this way, the private sector has increased opportunities to develop more efficiently.
With more agility in the resolution of legal disputes and insolvencies, credit is easier to obtain and intellectual and industrial property is more and better protected and this attracts investment and facilitates business [59]. In the 2020 index, Denmark occupied fourth place, Norway ninth, Sweden tenth, Finland twentieth, and Iceland twenty sixth. In the 2010 edition, Denmark occupied the sixth place, Norway the tenth, Finland the sixteenth, Sweden the eighteenth, and Iceland the fourteenth. If we add up all of the positions, in ten years, these four Nordic countries (except Iceland) have risen seven positions in the ranking, which further suggests the contribution of this variable to economic growth. Through the results obtained in the econometric models, we can confirm the second hypothesis.
Globalization is a variable and a theme that is increasingly present in the scientific literature. As Nordic countries are known for their “Nordic Welfares States,” with high public sector participation, well developed social security, and high levels of social solidarity (with a focus on social parity and equal opportunities), one would expect that globalization negatively affects the economic growth of these countries [60]. On the contrary, these countries are adapting very well to the globalization process, because they are continuously investing in the educational system, the health system, and productivity, remaining ever ahead of other nations in these regards, which allows them to maintain their living standards [61].
In the second half of the 20th century, the Nordic countries underwent rapid techno-economic development and are now the main drivers of socially sustainable industrial modernity [62]. This accelerates globalization, thus confirming the third hypothesis.
The Nordic countries are unique not only from their historical and sociocultural points of view, but also from the perspective of entrepreneurship and research, which many authors have attributed to the isolation resulting from the extreme geographical and climatic characteristics pertaining for most of the year [63].
Entrepreneurship contributes significantly to economic growth, as has been noted by countless authors for both Nordic countries and others. This remains one of the factors that induces job creation, innovation, technological progress, and competitiveness [24,64,65,66]. Although the coefficient has a low value, we can confirm the fourth hypothesis.
As expected, despite presenting a coefficient with statistical significance, corruption has negative significance, but with low elasticity. In several international institutions in the Nordic countries, corruption is low, and its reduction can only occur in a residual way. It also impacts economic growth, as already verified in other studies for other developed countries [43]. By presenting low levels of corruption, countries can induce greater confidence in their institutions, which increases business activity [39], thus leading to economic growth. Given these results, we can confirm the fifth hypothesis.
The results verified using Granger’s causality almost confirmed the results obtained via the long term ARDL methodology. We found bidirectional causality between business friendly regulations and economic growth (as in the ARDL model), globalization and economic growth (as seen in the ARDL model), corruption and economic growth (as seen in the ARDL model), economic freedom and business friendly regulations, economic freedom and globalization, economic freedom and entrepreneurship, corruption and entrepreneurship, corruption and business-friendly regulations, corruption and globalization, and, finally, between corruption and economic freedom.
Again using Granger’s causality, we managed to obtain three unidirectional causal relationships: between globalization and business friendly regulations, globalization and entrepreneurship, and entrepreneurship and business friendly regulations.
Concerning the potential Granger’s causal relationship between entrepreneurship and GDPpc, we accepted the null hypothesis that there is none. This was the only difference between the results obtained by Granger’s Causality and those from the long term ARDL methodology. This result may not be very surprising, because, in the long term ARDL model, the entrepreneurship variable has the least statistical significance, with a very low coefficient. For a nonsignificant value, it reaches statistical significance at a level of 10%. However, these three variables together contribute significantly to GDPpc growth.
These results are not surprising, and have already been outlined in the general literature and the specific literature on the Nordic countries. As we have already mentioned, these indices are based on variables derived from validated scientific articles.
For 26 European Union countries, similar results were achieved for the short term using the two stage least squares estimation method, in which the only two variables that coincide with this study are the EDB index and entrepreneurship [67]. In this article, the EDB variable was not statistically significant, while in the cluster analysis, in the Nordic group, neither the EDB variable nor the entrepreneurship variable were significant. These two conclusions are significant as they reveal that the conclusions are identical for the Nordic countries when using the Panel IV form and the short term ARDL model.

6. Conclusions

The main objective of this paper, using the ARDL methodology, was to study the effects that economic freedom, business friendly regulation, globalization, entrepreneurship, and corruption tend to have on the economic growth of Nordic countries, and, consequently, on their economic sustainability. As these variables are difficult to measure, we used the best international indicators that are widely used in the scientific literature, for 2004 to 2018, as proxies. Then, we resorted to Granger’s causality tests to check robustness.
As Nordic countries are well positioned in these indices, the questions arise of whether their increases in these scores have grounded economic growth, and whether other countries could take this model as a reference? For the period in question, it was not confirmed that economic freedom contributes to the economic growth of the Nordic countries, despite the coefficient showing a positive sign. In 2016, the World Economic Forum suggested that the Nordic countries remove their unnecessary administrative barriers in order to facilitate the execution of business. In the present study, performed up to 2018, it appears that these obstacles persist. As one of the ultimate objectives of economic policy is to achieve growth, it is suggested that Nordic policymakers directly address the factors that allow for the expansion of economic freedom, such as creating additional competition in business and/or in the credit markets. Regarding the variable economic freedom, Granger’s causality confirmed the results obtained through the ARDL methodology, which proves the robustness of our model.
As in many countries, the Nordic countries’ regulations that streamline business promote the realization of business. It is not a matter of deregulating business, but of assigning legal and political institutions appropriate roles in business in more developed and participatory democracies [59]. The importance of this variable in the Nordic countries confirms the results obtained by several authors already mentioned in this study, in which countries with better rankings were shown to grow faster than others [19]. As such, policymakers should not abandon the models adopted in this area, and, if possible, should reinforce them. For example, this can be achieved through procedures that reduce the time required to start a business, register properties and obtain credit, and the time spent at customs in import processes. Granger’s causality further confirmed the results obtained by the ARDL methodology in this area.
The Nordic countries have obtained good economic results by increasing globalization, thus demonstrating high resilience in the face of this variable, since their welfare states have remained largely intact [12]. According to data from 2020, in one index in which only the 50 most important countries in the world are analyzed, Sweden was in fourth place, with almost 90 points out of a possible 100, while Denmark took eighth place with 88 points, Finland ninth position with 87.7 points, Norway 12th position, and Iceland 50th position with 71.91 points. Apart from Iceland, which is a tiny economy, the average score of the remaining four Nordic countries in 2020 on the Economic Globalization Index was at the level of the score of Germany, which is considered the most advanced economy in Europe.
We recognize the good work that the Nordic countries have carried out in adapting to globalization. They were one of the pioneers of this process when, during the Viking age, they spread to a large part of the northern hemisphere; in addition to barbarism, destruction, and looting, they also practiced trade [68].
By constantly investing in the educational system, R&D, and the health system, the Nordic countries are preparing their youth for the future, transmitting knowledge, and preparing them for adulthood. Policymakers are advised to intensify these procedures so as not to be overtaken by other countries. Important measures to guarantee advantages in the face of globalization include the continuous investment in innovation and productivity, which will allow for maintaining the traditional standards of living in Nordic societies [24]. The results obtained relating to globalization using the Granger causality test confirmed the results obtained by the ARDL methodology.
Entrepreneurship emerged as a corollary of all the variables that we studied previously, and as such has been left until last. Entrepreneurs display one fundamental characteristic, namely, innovation [69]. If there is a positive response in the market to this innovation, and the market has favorable regulations, such conditions facilitate the success of the product [70]. As most innovations are currently made in global markets, there is a mutually beneficial relationship between entrepreneurship and globalization via economic freedom and business friendly regulations [71]. Fostering entrepreneurial clubs that facilitate collective bargaining and support as a means of making entrepreneurs’ products and services more competitive is valuable to the formation of a good business environment, social dialogue, and consensual and mutually beneficial solutions that promote the competitiveness of the economy. These are found in Nordic countries as a way to combat the isolation caused by the climate and the low demographic density. Regarding entrepreneurship, Granger’s causality did not validate the results obtained by the ARDL model, perhaps since the latter’s 10% statistical significance was practically at the limit.
Finally, as predicted, decreases in corruption in the Nordic countries impact their economic growth. The value of this coefficient is small because, according to the Transparency International Organization, the presence of corruption in these countries is among the lowest in the world, which, thus, manifests little positive evolution and, logically, negligible economic impacts. The potential reduction in corruption in developing countries has a greater impact on economic growth due to its greater prevalence and the serious effects it has on the economies of those countries [72].
The results obtained through Granger’s causality tests for the influence of corruption on economic freedom, business friendly regulation, globalization, and entrepreneurship are also noteworthy.
By strengthening themselves economically, the Nordic countries seek to fulfil one of the dimensions of the triple bottom line: the economic dimension. By fulfilling this dimension, the Nordic countries are better prepared to face adverse external shocks or potential financial crises, as was the case with the financial crisis of 2007 (originating in the subprime that slipped into the economy via the strong reduction in bank loans to companies). After 15 years of prosperity, apart from Iceland, the Nordic countries, such as Norway and Sweden, overcame the 2007 crisis faster than most other European countries [73].
The results obtained using Granger’s causality show that the Nordic countries know how to take advantage of globalization so as to achieve economic growth, particularly in terms of imports, and benefit from globalization in order to export more. Increases in globalization benefit the economic growth of Nordic countries. It was also demonstrated that economic growth itself impacts three variables, two of which (globalization and entrepreneurship) display a two way causal relationship between one other, forming a virtuous circle.
This paper should encourage Nordic policymakers to pay more attention to their position in international indices, because rankings represent the economic situation and can be used to analyze changes between countries or over time.
Based on the results obtained, the Nordic countries must facilitate the execution of business, promote entrepreneurial attitudes, and continue to adapt to the ongoing situation of globalization. Regarding corruption, although its perceived level is one of the lowest in the world, it should not be disregarded, as it corrodes the whole of society, negatively influencing all of the studied dimensions.
The Nordic countries know how to adapt to a constantly changing world, and how to carry out economic activities under uncertainty so as not to compromise their livelihoods. This adaptation has allowed them to achieve sustainability in economic terms.
As suggestions for future work, it would be interesting to extend this analysis, using this methodology, to other geographic regions that benefit from privileged relationships, such as Portugal and Spain, the U.S. and Canada, or even the Baltic Republics. Another possible suggestion for future work is to carry out estimations using an alternative proxy, such as the Index of Economic Freedom prepared by the Heritage Foundation, as the economic freedom variable is the only one that does not present statistical significance and is normally positively associated with economic growth.

Author Contributions

Conceptualization, M.C.N. and M.M.; investigation, M.C.N.; methodology, M.C.N.; supervision, M.M.; writing—original draft, M.C.N.; writing—review and editing, M.M. Both authors have read and agreed to the published version of the manuscript.

Funding

This research received no external funding.

Institutional Review Board Statement

Not applicable.

Informed Consent Statement

Not applicable.

Data Availability Statement

Data sharing is not applicable.

Conflicts of Interest

The authors declare no conflict of interest.

References

  1. Ervasti, H.; Fridberg, T.; Hjerm, M.; Kangas, O.; Ringdal, M. Nordic Social Attitudes in a European Perspective; Edward Elgar: Northampton, MA, USA, 2008. [Google Scholar]
  2. Andreasson, U. Trust—The Nordic Gold; Nordic Council of Ministers—Analysis Report: Copenhagen, Denmark, 2017. [Google Scholar]
  3. Helliwell, J.; Layard, R.; Sachs, J.; De Neve, J.E. World Happiness Report 2020; Lara, B., Aknin, L., Huang, H., Wang, S., Eds.; Earth Institute, Columbia University: Vancouver, BC, Canada, 2020. [Google Scholar]
  4. Nikolaev, B.; Bennett, D. Give me liberty and give me control: Economic freedom, control perceptions and the paradox of choice. Eur. J. Polit. Econ. 2016, 45, 39–52. [Google Scholar] [CrossRef] [Green Version]
  5. Mandić, A.; Petric, L.; Pivaevic, S. Film a creative industry constituent and its impacts on tourism development: Evidence from Croatia. ToSEE Tour. S. East. Eur. 2017, 4, 335–348. [Google Scholar] [CrossRef]
  6. Compton, R.; Giedman, D.; Hoover, G. A distributional analysis of the benefits of economic freedom. Eur. J. Polit. Econ. 2014, 33, 121–133. [Google Scholar] [CrossRef]
  7. Hussain, E.; Haque, M. Impact of economic freedom on the growth rate: A panel data analysis. Economies 2016, 4, 5. [Google Scholar] [CrossRef] [Green Version]
  8. Miller, T.; Kim, A.; Roberts, J.; Tyrrel, P. Highlights of the 2020 Index of Economic Freedom; The Heritage Foundation: Washington, DC, USA, 2020. [Google Scholar]
  9. Brkic, I.; Gradojecic, N.; Ignjatijevic, S. The Impact of Economic Freedom on Economic Growth? New European Dynamic Panel Evidence. J. Risk Financ. Manag. 2020, 13, 26. [Google Scholar] [CrossRef] [Green Version]
  10. Almekinders, G.; Fukuda, S.; Mourmouras, A.; Zhou, J.; Zhou, Y. ASEAN Financial Integration; International Monetary Found: Washington, DC, USA, 2015. [Google Scholar]
  11. Bujanca, G.; Ulman, S. The impact of the economic freedom on national competitiveness in the main economic power centers in the world. Procedia Econ. Financ. 2015, 20, 94–103. [Google Scholar] [CrossRef]
  12. Berg, A. Explaining Welfare State Survival: The Role of Economic Freedom and Globalization. 2006. Available online: https://papers.ssrn.com/sol3/papers.cfm?abstract_id=897746 (accessed on 26 May 2021).
  13. Iacobuta, A.; Ifrim, M. Welfare Mentality as a Challenge to European Sustainable Development. What Role for Youth Inclusion and Institutions? Sustainability 2020, 12, 3549. [Google Scholar] [CrossRef]
  14. Djankov, S.; La Porta, R.; Lopez-de-Silanes, F.; Shleifer, A. The Regulation of Entry. Quart. J. Econ. 2002, 117, 1–37. [Google Scholar] [CrossRef]
  15. Gillanders, R.; Whelan, K. Open for business? Institutions, business, environment and economic development. Kyklos 2014, 67, 535–558. [Google Scholar] [CrossRef]
  16. Haidar, J. The impact of business regulatory reforms on economic growth. J. Jpn. Int. Econ. 2012, 26, 285–307. [Google Scholar] [CrossRef] [Green Version]
  17. Pere, E.; Hashorva, A. Business regulation and economic growth in the Western Balkan Countries. East. J. Eur. Stud. 2013, 4, 5–15. [Google Scholar]
  18. Corcoran, A.; Gillanders, R. Foreign direct investment and the ease of doing business. Rev. World Econ. 2015, 151, 103–126. [Google Scholar] [CrossRef] [Green Version]
  19. Leal-Rodriguez, A.; Sanchis-Pedregosa, C. Could the Ease of Doing Business be considered a predictor of countries’ Socio-Economic wealth? An empirical analysis using PLS-SEM. J. Int. Stud. 2019, 12, 229–243. [Google Scholar] [CrossRef] [Green Version]
  20. Tan, K.; Amri, M.; Merdikawati, N. A new index to measure ease of doing business at the sub-national level. Empirical findings from Indonesia. Cross Cult. Strateg. Manag. 2018, 25, 515–537. [Google Scholar] [CrossRef]
  21. Jayasuriya, D. Improvements in the World Bank’s ease of doing business rankings: Do they translate into greater foreign direct investment inflows. Policy Res. Work. Pap. 2011. [Google Scholar] [CrossRef] [Green Version]
  22. Cui, X.; Yao, Y.; Bian, Y.; Cui, L. Can better business environment promote trade partner’s economic growth? Appl. Econ. Lett. 2021, 1–5. [Google Scholar] [CrossRef]
  23. Anderson, T.; Holmstroom, B.; Honkapohja, S.; Korkman, S.; Soderstrom, T.; Vartiainen, J. The Nordic Model—Embracing Globalization and Sharing Risks; The Research Institute of the Finnish Economy (ETLA): Helsinki, Finland, 2007. [Google Scholar]
  24. Dvoulety, O. Determinants of Nordic entrepreneurship. J. Small Bus. Enterp. 2017, 24, 12–33. [Google Scholar] [CrossRef]
  25. Allen, S.; Pollack, E. The Role of Think Tanks in the Swedish Political Landscape. Scand. Polit. Stud. 2020, 43, 145–169. [Google Scholar] [CrossRef]
  26. Gurgul, H.; Lach, L. Globalization and economic growth: Evidence from two decades of transition in CEE. Econ. Model. 2014, 36, 99–107. [Google Scholar] [CrossRef] [Green Version]
  27. Dreher, A.; Gasto, N.; Martens, P. Measuring Globalisation—Gauging Its Consequences; Spring: New York, NY, USA, 2008. [Google Scholar]
  28. Mjoset, L. Nordic economic policies in the 1970s and 1980s. Int. Organ. 1987, 41, 403–456. [Google Scholar] [CrossRef] [Green Version]
  29. Nielsen, K.; Kesting, S. Small is Resilient—The impact of Globalization on Denmark. Rev. Soc. Econ. 2013, 6, 365–387. [Google Scholar] [CrossRef]
  30. Fellman, S. Economic Development in the Nordic Countries. 2019. Available online: https://nordics.info/show/artikel/economic-development-in-the-nordic-countries/ (accessed on 12 June 2021).
  31. Grimalda, G.; Trannoy, A.; Filgueira, F.; Moene, K. Egalitarian redistribution in the era of hyperglobalization. Rev. Soc. Econ. 2020, 78, 151–184. [Google Scholar] [CrossRef]
  32. Klapper, L.; Love, L. The impact of Business Environment Reforms on New Firm Registration. World Bank Policy Res. Work. Pap. 2010, 5493. [Google Scholar] [CrossRef] [Green Version]
  33. Nogueira, M.; Madaleno, M. New evidence of competitiveness based on the global competitiveness index. Econ. Bull. 2021, 41, 788–797. [Google Scholar]
  34. Corbetta, G.; Huse, M.; Ravasi, D. Crossroads of Entrepreneurship; Klumer Academic Publishers: New York, NY, USA, 2004. [Google Scholar]
  35. Chiu, R. Entrepreneurship Education in the Nordic Countries—Strategy Implementation and Good Practices; Nordic Innovation Publication: Oslo, Norway, 2012. [Google Scholar]
  36. Medeiros, V.; Marques, C.; Galvão, A.; Braga, V. Innovation and entrepreneurship as drivers of economic development: Differences in European economies based on quadruple helix model. Compet. Rev. 2020, 30, 681–704. [Google Scholar] [CrossRef]
  37. Ionescu, G.; Firouiu, D.; Pirvu, R.; Enescu, M.; Radoi, M.; Cojocaru, T. The Potential for Innovation and Entrepreneurship in EU Countries in the Context of Sustainable Development. Sustainability 2020, 12, 7250. [Google Scholar] [CrossRef]
  38. Swaleheem, M. Economic growth with endogenous corruption: An empirical study. Public Choice 2011, 146, 23–41. [Google Scholar] [CrossRef]
  39. Leitão, J.; Capucho, J. Institutional, Economic, and Socio-Economic Determinants of the Entrepreneurial Activity of Nations. Adm. Sci. 2021, 11, 26. [Google Scholar] [CrossRef]
  40. Gründler, K.; Potrafke, N. Corruption and economic growth: New empirical evidence. Eur. J. Polit. Econ. 2019, 60, 101810. [Google Scholar] [CrossRef] [Green Version]
  41. Sharma, C.; Mitra, A. Corruption and Economic Growth: Some new empirical evidence from a global sample. J. Int. Dev. 2019, 31, 691–719. [Google Scholar] [CrossRef]
  42. Cieslik, A.; Goczek, L. Control of corruption, international investment, and economic growth: Evidence from panel data. World Dev. 2018, 103, 323–335. [Google Scholar] [CrossRef]
  43. Chapsa, X.; Tsanana, E.; Katrakilidis, C. Growth and convergence in the EU-15: More evidence from the cohesion countries. Procedia Econ. Financ. 2015, 33, 55–63. [Google Scholar] [CrossRef] [Green Version]
  44. Masanipour, A.; Thompson, M. Is globalization linked to low corruption in OECD countries? Crime Law Soc. Chang. 2020, 73, 443–455. [Google Scholar] [CrossRef]
  45. Gujarati, D. Basic Econometrics, 4th ed.; McGraw-Hill: New York, NY, USA, 2002. [Google Scholar]
  46. Granger, C. Some properties of times series data and their use in econometric model specification. J. Econ. 1981, 28, 121–130. [Google Scholar] [CrossRef]
  47. Engle, R.; Granger, C. Co-integration and error correction: Representation, estimation and testing. Econometrica 1987, 55, 251–276. [Google Scholar] [CrossRef]
  48. Pesaran, M.; Shin, Y. Generalized impulse response analysis in linear multivariate models. Econo. Lett. 1998, 58, 17–29. [Google Scholar] [CrossRef]
  49. Pesaran, M.; Shin, Y.; Smith, R. Bounds testing approaches to the analysis of level relationship. J. Appl. Econ. 2001, 16, 289–326. [Google Scholar] [CrossRef]
  50. Jali, A.; Ma, Y. Financial development and economic growth: Times series evidence from Pakistan and China. J. Econ. Coop. 2008, 29, 29–68. [Google Scholar]
  51. Samagardi, N.; Fidrmuc, J.; Ghosh, S. Financial development and economic growth in an oil-rich economy: The case of Saudi Arabia. Econ. Model. 2014, 43, 267–278. [Google Scholar] [CrossRef] [Green Version]
  52. Nkoro, E.; Uko, A. Autoregressive Distributed Lag (ARDL) cointegration technique: Application and interpretation. J. Stat. Econ. Methods 2016, 5, 63–91. [Google Scholar]
  53. Shahbaz, M.; Hye, Q.; Tiwari, A.; Leitão, N. Economic Growth, energy consumption, and co2 emissions: Trends and policy implications. Asia Pac. J. Energy Environ. 2013, 2, 220–227. [Google Scholar]
  54. Akaike, H. A new look at the statistical model identification. IEEE Trans. Autom. Control. 1974, 19, 716–723. [Google Scholar] [CrossRef]
  55. Pesaran, M.; Pesaran, A. Working with Microsoft 4.0: Interactive Econometric Analysis; Oxford University Press: Oxford, UK, 1997. [Google Scholar]
  56. Granger, C. Investigating causal relations by econometric models and cross-spectral methods. Econometrica 1969, 37, 424–438. [Google Scholar] [CrossRef]
  57. Toda, H.; Yamamoto, Y. Statistical Inferences in Vector autoregression possibly integrated process. J. Econ. 1995, 66, 225–250. [Google Scholar] [CrossRef]
  58. World Economic Forum, Global Competitiveness Report; World Economic Forum: Geneva, Switzerland, 2016.
  59. World Bank, Doing Business 2019; A World Bank Group: Washington, DC, USA, 2019.
  60. Ahl, H.; Berglund, K.; Pettersson, K.; Tilmar, M. From feminism to FemInc.ism: On the uneasy relationship between feminism, entrepreneurship and the Nordic welfare state. Int. Entrep. Manag. J. 2016, 12, 369–392. [Google Scholar] [CrossRef] [Green Version]
  61. Baghirzade, N. Can the welfare state be the future of the global economy? Netw. Int. Stud. 2020, 15, 45–55. [Google Scholar]
  62. Witoszek, N.; Midtturn, A. Sustainable Modernity the Nordic Model and Beyond; Routledge: New York, NY, USA, 2018. [Google Scholar]
  63. Kuckertz, A.; Berger, E.; Allmendinzer, M. A Configurations Analysis of the Determinants of Entrepreneurship in Innovation-Driven Economies. Bus. Adm. Rev. 2015, 75, 273–288. [Google Scholar]
  64. Prasetyo, P.; Kistanti, N. Human Capital, Institutional Economics and Entrepreneurship as a Driver for Quality & Sustainable Economic Growth. Entrep. Sustain. Issues 2020, 7, 2575–2589. [Google Scholar] [CrossRef]
  65. Du, K.; O’Connor, A. Entrepreneurship and advancing national level economic efficiency. Small Bus. Econ. 2018, 50, 91–111. [Google Scholar] [CrossRef]
  66. Fernandes, C.; Veiga, P.; Ferreira, J.; Teixeira, S.; Rammal, H. The Impact of Innovation and Entrepreneurship on competitiveness. In Technological Innovation and International Competitiveness for Business Growth, Palgrave Studies in Democracy, Innovation, and Entrepreneurship for Growth; Palgrave Macmillan: Cham, Switzerland, 2021; pp. 97–117. [Google Scholar]
  67. Nogueira, M.; Madaleno, M. Are International Indices Good Predictors of Economic Growth? Panel Data and Cluster Analysis for European Union Countries. Sustainability 2021, 13, 6003. [Google Scholar] [CrossRef]
  68. Jones, G. A History Of The Vikings; Oxford University Press: New York, NY, USA, 2001. [Google Scholar]
  69. Schumpeter, J. The Theory of Economic Development—An Inquiry into Profits, Capital, Credit, Interest and Business Cycle; Harvard University Press: Cambridge, MA, USA, 1934. [Google Scholar]
  70. Ács, Z.; Szerb, L. The Global Entrepreneurship Index (GEINDEX). Found. Trends Entrep. 2009, 5, 341–435. [Google Scholar] [CrossRef]
  71. Coulibaly, S.; Erbao, C.; Mekongcho, M. Economic globalization, entrepreneurship and development. Technol. Forecast. Soc. Chang. 2018, 127, 271–280. [Google Scholar] [CrossRef]
  72. Farooq, A.; Shahbaz, M.; Arouri, M.; Teulon, F. Does corruption impede economic growth in Pakistan? Econ. Model. 2013, 35, 622–633. [Google Scholar] [CrossRef]
  73. Comolli, C.; Neyer, G.; Andersson, G.; Dommermuth, L.; Fallesen, P.; Jalovaara, M.; Jósson, A.; Lappegard, T. Beyond the Economic Gaze: Childbearing during and after Recessions in the Nordic Countries. Eur. J. Popul. 2021, 37, 473–520. [Google Scholar] [CrossRef]
Figure 1. European (white) and Nordic (blue) countries. Source: Authors’ elaboration.
Sustainability 13 09961 g001
Figure 2. CUSUM square. Source: Authors’ elaboration.
Sustainability 13 09961 g002
Table 1. Variable definitions and data sources.
VariableDefinitionUnitSource
GDPpctGross domestic product on purchasing power parity per capita in year tUSDWorld Bank
EFWtEconomic freedom of the world in year tIndexFraser Institute
EDBtEase of doing business in year tIndexWorld Bank
KOFtGlobalization Economic Index in year tIndexKOF Swiss Economic Institute
GEItGlobal Entrepreneurship Index in year tIndexGedi Institute
CPItCorruption Perceptions Index in year tIndexTransparency International
Source: Authors’ elaboration.
Table 2. Averages of the variables for each Nordic country (2004–2018).
CountryGDPpcEFWEDBKOFGEICPI
Denmark44,5097.9782.8783.0950.9892.20
Finland40,2617.8480.2686.4241.9291.00
Norway59,3757.6580.9784.8957.1286.20
Sweden44,1177.7281.1888.7352.7989.93
Iceland44,3697.4177.4770.0074.8884.87
Source: Authors’ calculation.
Table 3. Main descriptive statistics.
Observ.MaximumMinimumAverageSt. DeviationSkewnessKurtosisJarque–Bera
GDPpc1559,24535,20846,6786233−0.1453−0.11016.0978
EFW1578.5576.6278.000.6616−0.7789−0.744310.277
EDB1580.0277.2479.380.8001−1.02810.15187.7126
KOF1582.0877.5181.041.5283−0.6520−0.822910.196
GEI1571.5660.1467.522.8470−0.88681.07564.2808
CPI1594.2083.6088.843.42190.1262−1.091110.500
Source: Authors’ calculation. Variables described in Table 1.
Table 4. Pearson’s correlation coefficients.
GDPpcEFWEDBKOFGEICPI
GDPpc1.000−0.0150.7630.107−0.227−0.712
EFW 1.000−0.0630.2980.2480.255
EDB 1.0000.0140.350−0.595
KOF 1.0000.041−0.127
GEI 1.0000.206
CPI 1.000
Source: Authors’ calculation. Variables described in Table 1.
Table 5. Unit root tests.
ADF TestKPSS Test
VariablesLevel I(0)First Diff. I(1)Level I(0)First Diff. I(1)
GDPpc0.6470.1081.3030.134 ***
(0.515)(0.012) **
EFW0.026 ***-0.115 ***-
(0.04)
EDB0.508 **-0.7710.158 ***
(0.015)
KOF0.160−0.0230.273 ***-
(0.144)(0.006) ***
GEI0.009 ***-0.333 ***-
(0.013)
CPI0.1190.037 ***1.3440.041 ***
(0.428)(0.004)
** and *** indicate the 5% and 1% significance levels, respectively. Source: Authors’ calculation. See the meanings of the variable symbols in Table 1.
Table 6. Cointegration tests.
Akaike Criteria (AIC)
VariablesLag 0Lag 1Lag 2Lag 3
GDPpc−8.495−8.891 *−8.728−8.652
EFW−9.954−10.37 *−10.21−9.681
EDB−7.693−8.029 *−7.923−7.817
KOF−5.940 *−5.794−5.616−5.548
GEI−9.545 *−9.364−9.322−9.124
CPI−8.325 *−8.212−7.825−7.674
* The choice lies where the value of the AIC criterion is minimal. Source: Authors’ calculation. Variables described in Table 1.
Table 7. Results of the long term ARDL estimates.
Model 1 ARDL (1 1 1 0 0 0)Model 2 ARDL (1 1 0 0 0)
VariablesCoefficientsp-ValueCoefficientsp-Value
EFW0.31420.517--
EDB3.8741 ***<0.0013.9781 ***<0.001
KOF1.8471 ***0.0011.9541 ***0.001
GEI0.0204 *0.0840.0341 *0.077
CPI−0.0352 **0.032−0.0417 **0.045
*, **, and *** indicate the 10%, 5% and 1% significance levels, respectively. Source: Authors’ calculation. Variables described in Table 1.
Table 8. Results of the short term dynamics.
Model 1 ARDL (1 1 0 0 0)Model 2 ARDL (1 1 0 1 0)
VariablesCoefficientsp-ValueCoefficientsp-Value
EDB−0.64570.414−0.63540.342
KOF−0.81840.124−0.61470.264
GEI−0.01010.304−0.20470.287
CPI−0.07440.547−0.08410.517
Ec (−1)−0.7557 **0.018−0.7954 **0.025
** indicate 5% significance level. Source: Authors’ calculation. Variables described in Table 1.
Table 9. ARDL diagnostic tests.
Model 1Model 2
TestsValuep-ValueValuep-Value
Durbin–Watson2.0541 2.0140
LM test Breusch–Godfrey1.5250.21421.73190.2628
White test of
heterocedasticity
130.3690130.3690
Source: Authors’ calculation.
Table 10. Granger Causality Wald tests.
Granger Causality Test in Pairs p-ValueGranger Causality Test in Pairs p-Value
LnGDPPPP-LnEFW36.9880.000 *LnKOF-LnGDPPPP17.9480.000 *
LnGDPPPP-LnEDB10.0690.007 *LnKOF-LnEFW22.9870.000 *
LnGDPPPP-LnKOF46.1650.000 *LnKOF-LnEDB14.5480.001 *
LnGDPPPP-LnGEI1.77560.412LnKOF-LnGEI37.6190.000 *
LnGDPPPP-LnCPI9.72760.007 *LnKOF-LnCPI17.5620.000 *
All variables-LnGDPPPP134.810.000 *All variables-LnKOF207.240.000 *
LnEFW-LnGDPPPP1.34110.531 *LnGEI-LnGDPPPP1.2450.534
LnEFW-LnEDB21.7140.000 *LnGEI-LnEFW11.5010.003 *
LnEFW-LnKOF9.42230.000 *LnGEI-LnEDB16.1610.000 *
LnEFW-LnGEI32.7860.000 *LnGEI-LnKOF2.0410.360
LnEFW-LnCPI39.4840.000 *LnGEI-LnCPI4.6050.095 *
All variables-LnEFW54.3830.000 *All variables-LnGEI48.9460.000 *
LnEBD-LnGDPPPP38.3410.000 *LnCPI-LnGDPPPP105.210.000 *
LnEDB-LnEFW14.5490.001 *LnCPI-LnEFW48.8410.000 *
LnEDB-LnKOF5.39670.067LnCPI-LnEDB57.1500.000 *
LnEDB-LnGEI5.69080.058LnCPI-LnKOF39.9540.000 *
LnEDB-LnCPI22.5470.000 *LnCPI-LnGEI29.7860.000 *
All variables-LnEDB54.3830.000 *All variables-LnCPI283.320.000 *
* Indicates the rejection of the null hypothesis with significance levels greater than 5% [54]. Source: Authors’ calculation.
Publisher’s Note: MDPI stays neutral with regard to jurisdictional claims in published maps and institutional affiliations.

