Article

Development and Utilization of Renewable Energy Based on Carbon Emission Reduction—Evaluation of Multiple MCDM Methods

1
School of Economics and Management, North China Electric Power University, Beijing 102206, China
2
Economics & Management School, Beijing University of Agriculture, Beijing 100096, China
*
Author to whom correspondence should be addressed.
Sustainability 2021, 13(17), 9822; https://doi.org/10.3390/su13179822
Submission received: 6 August 2021 / Revised: 24 August 2021 / Accepted: 30 August 2021 / Published: 1 September 2021

Abstract

:
With the proposed target of carbon peak and carbon neutralization, the development and utilization of renewable energy with the goal of carbon emission reduction is becoming increasingly important in China. We used the analytic hierarchy process (ANP) and a variety of MCDM methods to quantitatively evaluate renewable energy indicators. This study measured the sequence and differences of the development and utilization of renewable energy in different regions from the point of view of carbon emission reduction, which provides a new analytical perspective for the utilization and distribution of renewable energy in China and a solution based on renewable energy for achieving the goal of carbon emission reduction as soon as possible. The reliability of the evaluation system was further enhanced by confirmation through a variety of methods. The results show that the environment and carbon dimensions are the primary criteria to evaluate the priority of renewable energy under carbon emission reduction. In the overall choice of renewable energy, photovoltaic energy is the best solution. After dividing regions according to carbon emission intensity and resource endowment, areas with serious carbon emissions are suitable for the development of hydropower; areas with sub-serious carbon emissions should give priority to the development of photovoltaic or wind power; high-carbon intensity area I should vigorously develop wind power; high-carbon intensity area II should focus on developing photovoltaic power; second high-carbon intensity areas I and II are suitable for the development of wind power and photovoltaic power; and second high-carbon intensity areas III and IV are the most suitable for hydropower.

1. Introduction

The imbalance between fossil energy and renewable energy in the energy structure not only causes countries to face difficult problems in dealing with the relationship among energy, the economy, and the environment, but, more importantly, a large number of carbon emissions aggravate the climate problem. Carbon dioxide emissions caused by coal consumption have exceeded 10 billion tons per year. In order to reduce a large amount of carbon emissions caused by fossil energy and to meet the energy needs of economic development, it is a general trend to vigorously promote the green and low-carbon development of renewable energy. Due to the heavy use of fossil energy and high carbon emission intensity in developing countries, the development of renewable energy is an effective way to alleviate carbon emissions [1]. In the face of the strong pressure to reduce carbon emissions, the Chinese government attaches importance to energy conservation and emission reduction, promising to reduce carbon emissions per unit of GDP by 60–65% by 2030 compared with 2005 [2] and proposing to achieve a carbon peak by 2030 and carbon neutralization by 2060. In order to alleviate the pressure of carbon emissions and meet the green and sustainable development of the economy, all countries are exploring the effective combination of different energy systems to make their energy systems continue to change to the direction of green and low carbon [3].
Due to the regional differences in resource endowment, economic development level, energy technology, and energy consumption structure, there are great differences in the development and utilization of renewable energy in different regions. In order to improve the utilization efficiency of renewable energy, it is necessary to evaluate the performance of renewable energy utilization from the perspectives of the economy, energy, technology, the environment, society, etc. In addition, due to the great differences in economic development and industrial layout in different regions, there are great regional differences in carbon emissions, so the characteristics of different regions need to be taken into account when formulating carbon emission reduction policies. In particular, when using carbon emission reduction as the standard to evaluate the performance of the development and utilization of renewable energy, it should be considered comprehensively according to the characteristics of regional renewable resources and carbon emissions.
The purpose of this study was to provide a comprehensive evaluation and decision-making framework for evaluating the current situation of renewable energy development planning in China. First, a renewable energy evaluation system with the goal of carbon emission reduction was established from the five dimensions of energy, economy, technology, environment and carbon, and society. Then, the carbon reduction performance of each renewable energy was calculated by the MCDM method, and the best renewable energy scheme was ranked. The rest of this article is structured as follows: the relevant literature is reviewed and summarized in Section 2; the method description and data sources are provided in Section 3; the results are discussed in Section 4; and the conclusions and recommendations are discussed in Section 5.

2. Literature Review

The practice of evaluating the comprehensive utilization of energy originated in the late 20th century and initially focused on a single goal [4]. With the improvement of the complexity of the energy system, the evaluation dimension is no longer limited to a single aspect. For different research focuses, scholars have evaluated the utilization of renewable energy from many dimensions. These dimensions include the energy dimension [5], the technical dimension [6], the economic dimension [7], the environmental dimension [8], and the cost–benefit and risk dimensions [1]. Matsumoto et al. (2017) evaluated the development and utilization efficiency of renewable energy in Japan from the point of view of energy, the economy, technology, etc. [9]. Atmaca and Basar (2012) evaluated the power plants of different energy types in Turkey from the technical, economic, and social points of view and found that renewable energy is the best choice [10]. Al-Sharafi et al. (2017) evaluated the overall sustainable performance of photovoltaic arrays, wind turbines, battery packs, and diesel engines in Saudi Arabia from economic, energy, and environmental perspectives [11].
The existing research on the evaluation of renewable energy is mostly based on the principle of the sustainable use of energy to establish an index system, but there are few studies on the establishment of an index system based on the principle of reducing carbon emissions. The importance of carbon emission reduction has become increasingly prominent. Through the synergistic mechanism of renewable energy and carbon emission reduction, we can further accelerate the speed of carbon emission reduction, improve the efficiency of carbon emission reduction, and help achieve carbon neutralization as soon as possible. Zhang et al. (2021) found that investment in renewable energy can reduce carbon emissions, and the effect varies with different stages of investment [12]. In the early stage of investment, renewable energy investment will increase carbon emissions; in the middle stage of investment, the emission reduction effect of renewable energy appears; in the later stage of investment, the carbon reduction effect of renewable energy investment may be weakened. Wang et al. (2021) also found that the higher the use of renewable energy, the better the carbon reduction achieved through renewable energy [13]. In the study of the mechanism of action, He et al. (2021) found that renewable energy technology innovation is an important method to reduce carbon emissions and achieve sustainable development [14]. Existing studies have found that renewable energy can reduce carbon emissions. Therefore, the construction of a set of evaluation systems for the development and utilization of renewable energy based on carbon emission reduction is an important step in the pursuit of low-carbon goals. Adams and Acheampong (2019) believe that, when considering the assessment of renewable energy for carbon reduction, the level of economic development and investment in renewable energy should be given priority on Africa’s agenda to improve climate change [15]. Hanif et al. (2019) highlighted that the depletion of natural resources and increasing population pressure are important factors in evaluating renewable energy in developing countries in terms of carbon emission reduction [16]. Duan et al. (2020) and Zhao et al. (2020) show that when evaluating regional renewable energy based on reducing carbon emissions, the environment and carbon emission dimensions are the basic criteria, and economic and technological impacts need to be taken into account [17,18].
In the selection of evaluation methods, the multi-criteria decision-making (MCDM) method is the most widely used method in many fields, such as energy planning, resource allocation and policy making, and it is also the most suitable method in the rapidly developing energy field [19]. MCDM methods include the weighted product model (WPM), the weighted sum model (WSM), the analytic hierarchy process (AHP), the technique for order of preference by similarity to ideal solution (TOPSIS), the preference ranking organization method for enrichment evaluation (PROMETHEE), and elimination and choice translating reality (ELECTRE and visekriterijumsko kompromisno rangiranje (VIKOR). These methods have a common goal in solving the problem, but due to the differences in their implementation processes, the final results of different methods will not be identical [20]. Existing studies generally use AHP or ANP alone to carry out evaluation or combine it with an MCDM method to implement evaluation, but there are few research methods combined with a variety of MCDM methods. Li et al. (2020) combine a variety of MCDM methods to achieve the mutual verification and comparison of the evaluation results and enhance their reliability and adaptability [21]. The combination of a variety of MCDM methods is not repetitive work but gives full play to the different characteristics of different methods in the evaluation of renewable energy, so that the evaluation method of the target is more comprehensive, and the evaluation results of each method support and corroborate each other, making them more convincing. The research framework of this article is shown in Figure 1.

3. Methods and Data

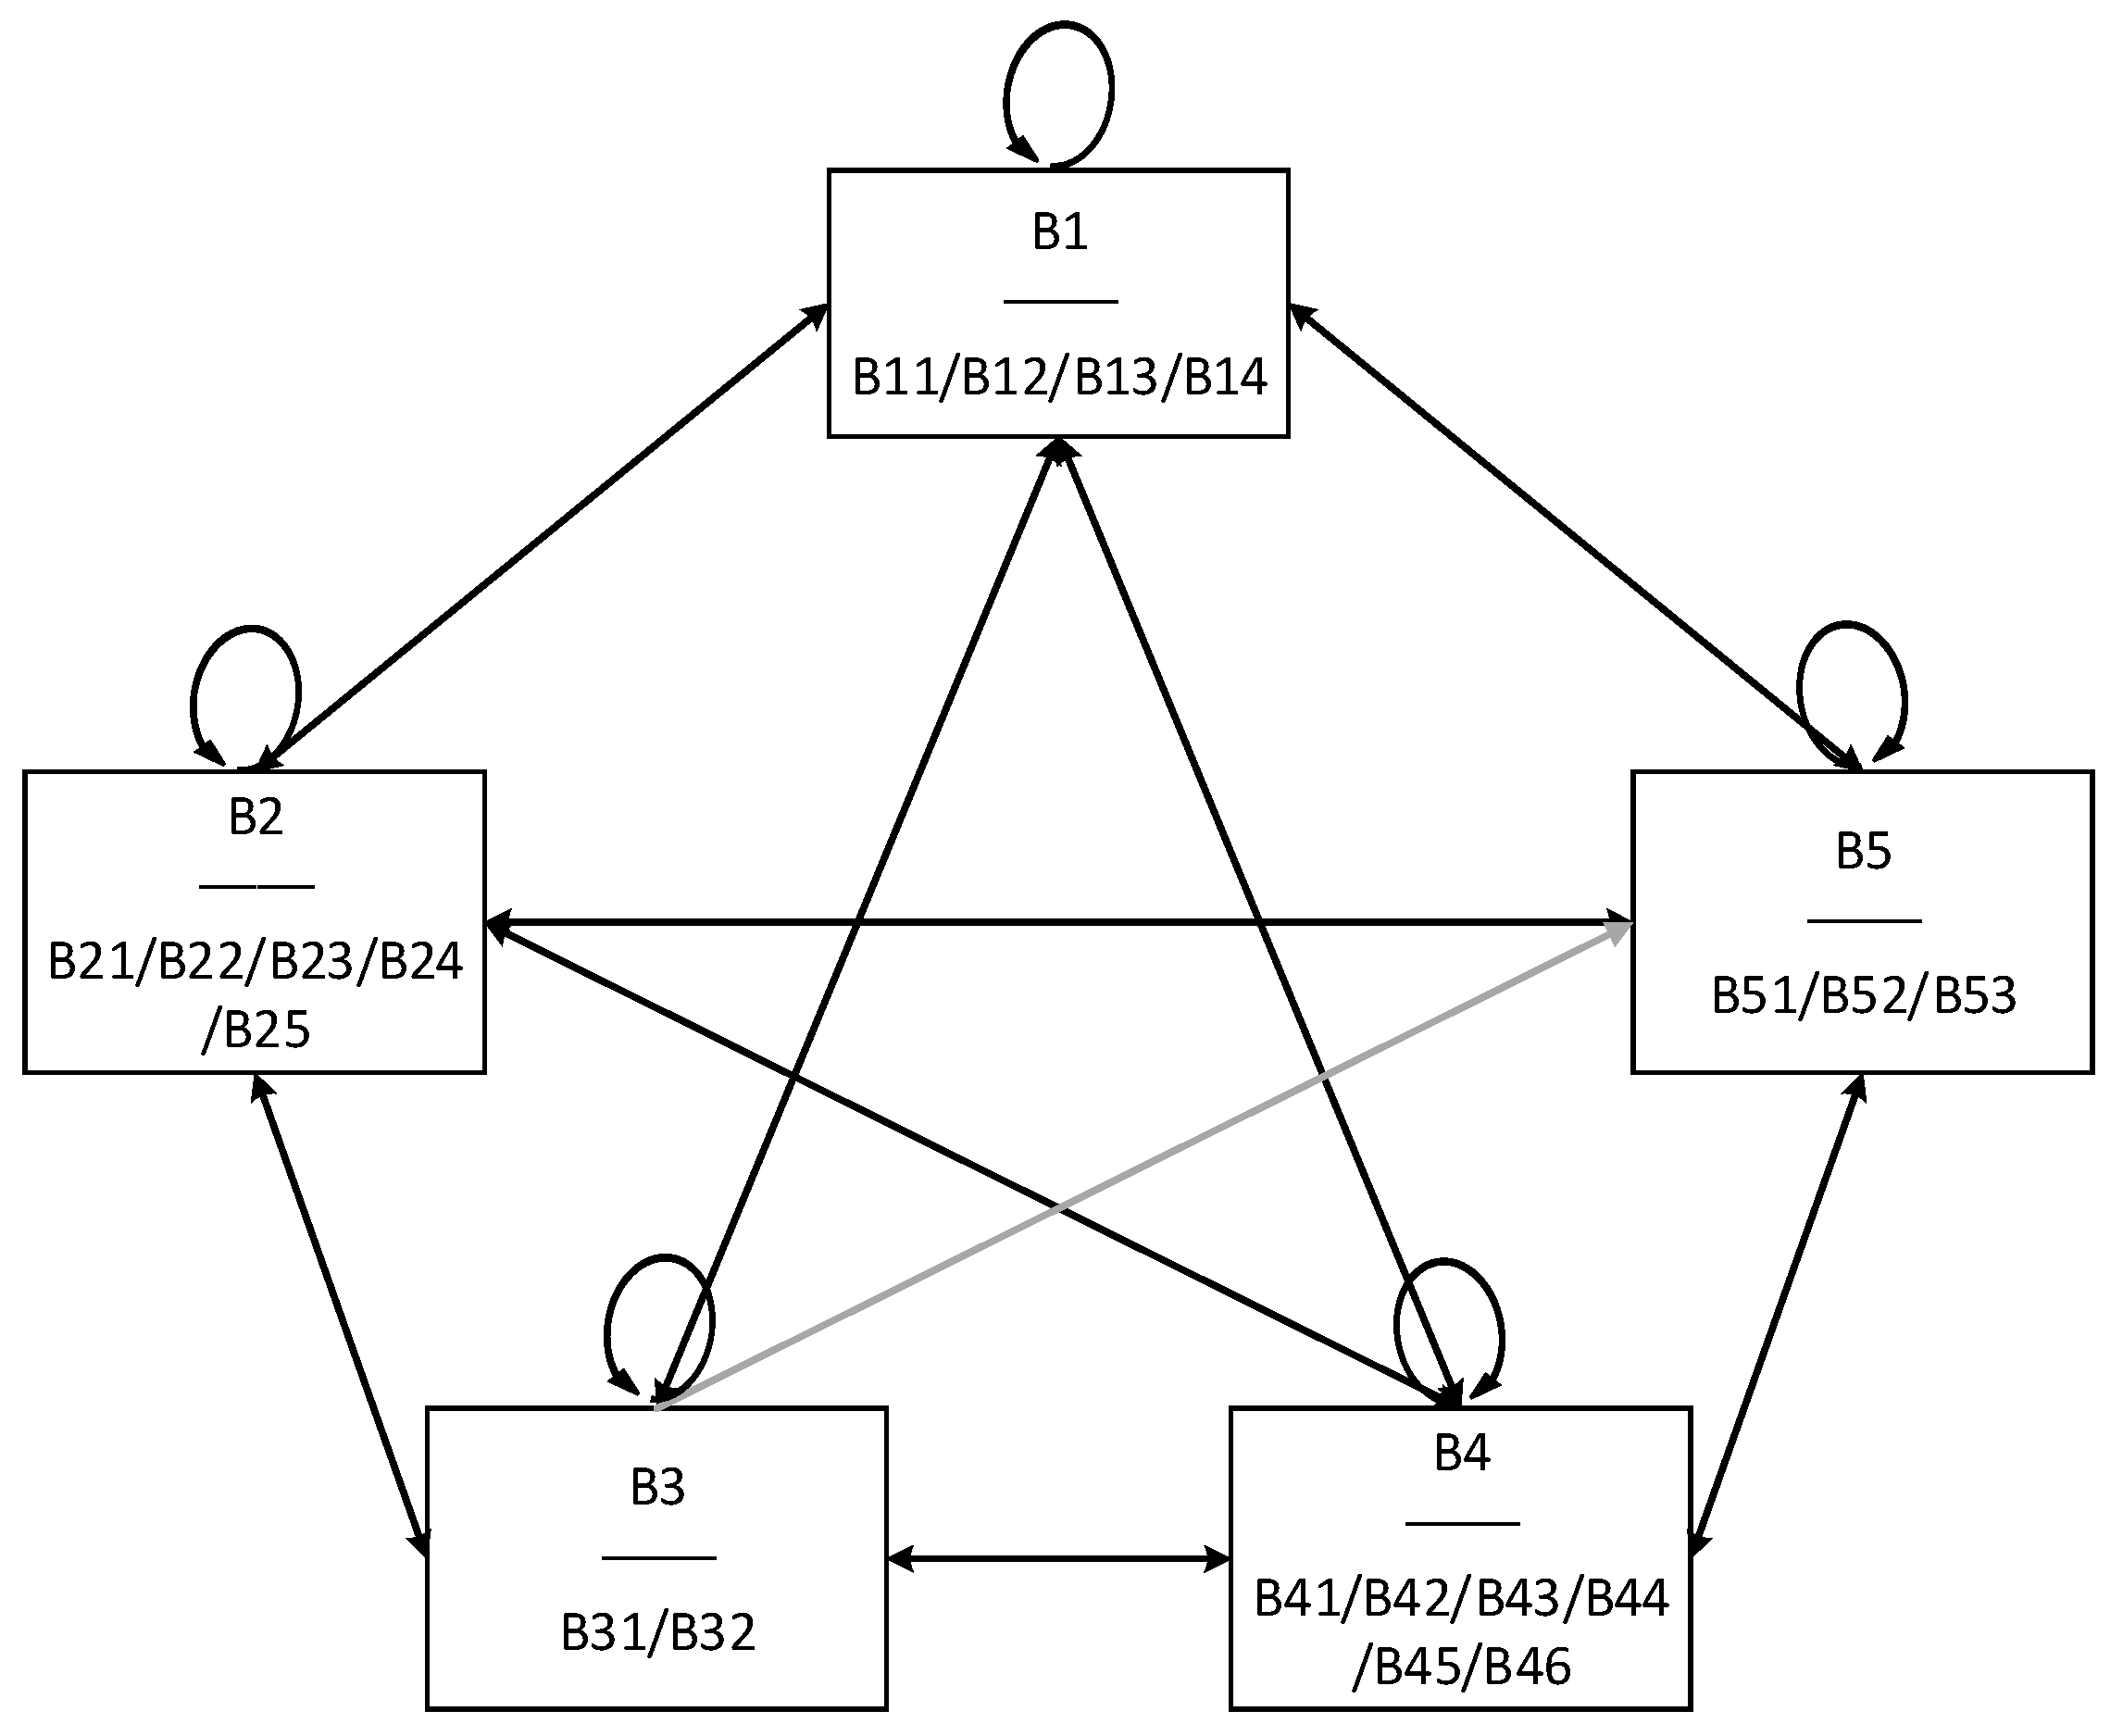
3.1. Determine the Evaluation Index System

In order to establish an appropriate index system, this study collected expert opinions on carbon emissions and renewable energy, combined with existing research and the related literature. Twenty indicators related to carbon emission reduction and renewable energy were selected from the five dimensions of energy, the economy, technology, environment and carbon, and society, and the comprehensive performance of carbon emission reduction of renewable energy in China was evaluated.

3.1.1. Energy Dimension

Green energy utilization efficiency (B11) is the proportion of renewable energy generation capacity to the total installed capacity in the region. The core of the environmental problem is to improve energy efficiency to reduce carbon emissions. The improvement of green energy efficiency can produce less carbon emissions with the same input, which in turn promotes a reduction in carbon emissions. This indicator can reflect the development benefits of renewable energy.
The growth rate of green power (B12) is a future-oriented benefit index to measure the future development potential and scale of renewable energy, which reflects the development rate of renewable energy in the past, which is continuous; that is, renewable energy will continue to grow at this rate or faster in the future. The increase in the growth rate of green power means that the utilization rate of fossil energy has been or is about to enter a downward trend, which plays an important role in alleviating carbon emissions.
Green energy reserves (B13) reflect the amount of renewable energy that is expected to be developed in the future if natural and technological conditions permit, measuring the development potential of renewable energy. It can also reflect whether this energy can continuously replace fossil fuels and reduce carbon emissions.
The grid connection rate of renewable energy (B14) reflects the utilization benefits of renewable energy and is an important aspect of whether renewable energy can effectively replace regional fossil energy and reduce carbon emissions; it can also reflect the quality of renewable energy utilization in this region.

3.1.2. Economic Dimension

Green investment allocation (B21) refers to the proportion of investment in the renewable energy industry to regional GDP. The investment in the renewable energy industry involves the upstream and downstream enterprises of the renewable energy industry, including the total investment of the industry chain. This index reflects the efficiency of different renewable energy investment allocations in a country or region and is the economic basis for reducing carbon emissions.
The power generation cost (B22) consists of operating expenses and maintenance costs; the operating expenses include the capital costs of energy, products and services, and related personnel costs for the operation of the energy system, and the maintenance costs include the daily maintenance costs of the power generation equipment. The cost of power generation affects the popularity and efficiency of renewable energy. Lower power generation costs can attract more renewable energy distribution, thus reducing regional carbon emissions. The cost of power generation is a reverse indicator.
The investment cost (B23) consists of the cost of purchasing equipment and technology. Investors must consider cost and income when investing in renewable energy. The investment efficiency of renewable energy depends on the investment cost, and it also has a profound impact on the possible future power generation and carbon emission reduction of renewable energy. Investment cost is an economic index that is commonly used to evaluate the energy system, and it is a reverse index.
The carbon emission cost (B24) refers to the outflow of various economic benefits measured by the available currency in order to prevent and control carbon emissions in order to achieve the expected environmental effects and environmental benefits during the product life cycle. The use of renewable energy will reduce the cost of carbon emissions, which in turn will cause less to be spent on maintaining environmental benefits.
The installed scale and investment quota of the low-carbon equipment (B25) index consists of the investment of a supercritical unit, a circulating fluidized bed unit, an integrated gasification combined cycle (IGCC), and other equipment. As the grid connection of renewable energy will have a certain impact on the stability of the power grid, coal power is still an indispensable power generation mode to support the stable and effective operation of large power grids. Low-carbon investment in the existing coal power system is not only conducive to the realization of carbon emission reduction targets but also lays the foundation for the absorption of renewable energy. Therefore, the low-carbon equipment investment of coal-fired power generation enterprises is conducive to promoting the construction and development of renewable energy in China.

3.1.3. Technical Dimension

Technology maturity (B31) reflects the application of renewable energy power generation technology. The higher the technology maturity, the easier the renewable energy is to use on a large scale, the lower the difficulty of operation and maintenance, and the lower the difficulty to reduce carbon emissions. At present, the technological maturity of wind and photovoltaic power is high, while the development of hydropower and biomass energy technology is also more mature, and the application scale of these renewable energies is large; the power generation technology of geothermal energy is not fully mature, and the application scale is small. We used the 10-digit scale method to evaluate technology maturity, ranging from 1 with very low maturity (that is, the technology is only tested in the laboratory) to 10 with high maturity (that is, commercially mature technologies with a strong market position).
Energy processing and conversion efficiency (B32) reflect the efficiency of renewable energy power generation, and the efficiency of different renewable energy is different due to the different level of equipment and technology.

3.1.4. Environment and Carbon Dimensions

Pollutant emission reduction (B41) is the use of renewable energy to replace traditional fossil energy for power generation, which can reduce the emission of CO2, SO2, NOx, and other pollutants. It is the most direct contribution indicator in terms of improving environmental benefits and reducing carbon emissions.
The impact on the ecosystem (B42): although the construction and operation process of renewable energy will reduce the emission of pollutants, it still has certain impacts on the ecosystem, such as noise pollution, visual pollution, land occupation, and water pollution.
Carbon emission intensity (B43) refers to the carbon dioxide emitted per kilowatt-hour of electricity generated by renewable energy. This index reflects the environmental impact of renewable energy in the process of power generation. Although this carbon emission is relatively small compared with traditional energy, it will still offset the reduced carbon emissions caused by renewable energy as an alternative to fossil energy to some extent. Therefore, it should be measured. For example, carbon dioxide emissions from photovoltaic power generation are 33–50 g per kilowatt-hour, while coal-fired power generation is 796.7 g per kilowatt-hour. Carbon dioxide emissions from photovoltaic power generation are only 1/10 to 1/20 of those from fossil fuels.
Indirect carbon emissions (B44) reflect the carbon emissions caused by renewable energy in the whole life cycle, including carbon emissions in the production process. In the life cycle of more than 20 years, most of the energy consumption and carbon emissions of renewable energy occur in the production of components and fans at the time of deployment.
Direct carbon emission reduction (B45) reflects the direct reduction in carbon emissions due to the installation of renewable energy instead of traditional fossil fuels. Renewable energy can replace the demand for traditional fossil energy, so as to reduce the supply of traditional fossil energy, and can play a direct role in carbon emission reduction.
Climatic condition (B46): renewable energy uses environmental resources to generate electricity, but it emits less pollution, and due to the substitute effect of renewable energy on thermal power, it can indirectly reduce the emissions of all kinds of pollutants, thus greatly alleviating environmental pollution and improving climate conditions and indirectly reducing carbon emissions.

3.1.5. Social Dimension

Employment post (B51): the increase in jobs is the main embodiment of the social effectiveness of renewable energy. Having more people employed in the field of renewable energy can indirectly reduce the carbon emissions caused by people engaged in other occupations and can raise the awareness of social carbon emission reduction.
Green management (B52) refers to the investment in environmental protection training and the promotion of carbon emission management systems, which can improve the carbon reduction potential of enterprises and human resources.
Environmental regulation (B53) refers to the promotion of the application of renewable energy to the formulation of local environmental regulation policies, which can improve the intensity of carbon emission reduction at the policy level.
The performance evaluation index system of renewable energy based on carbon emission reduction is shown in Table 1.

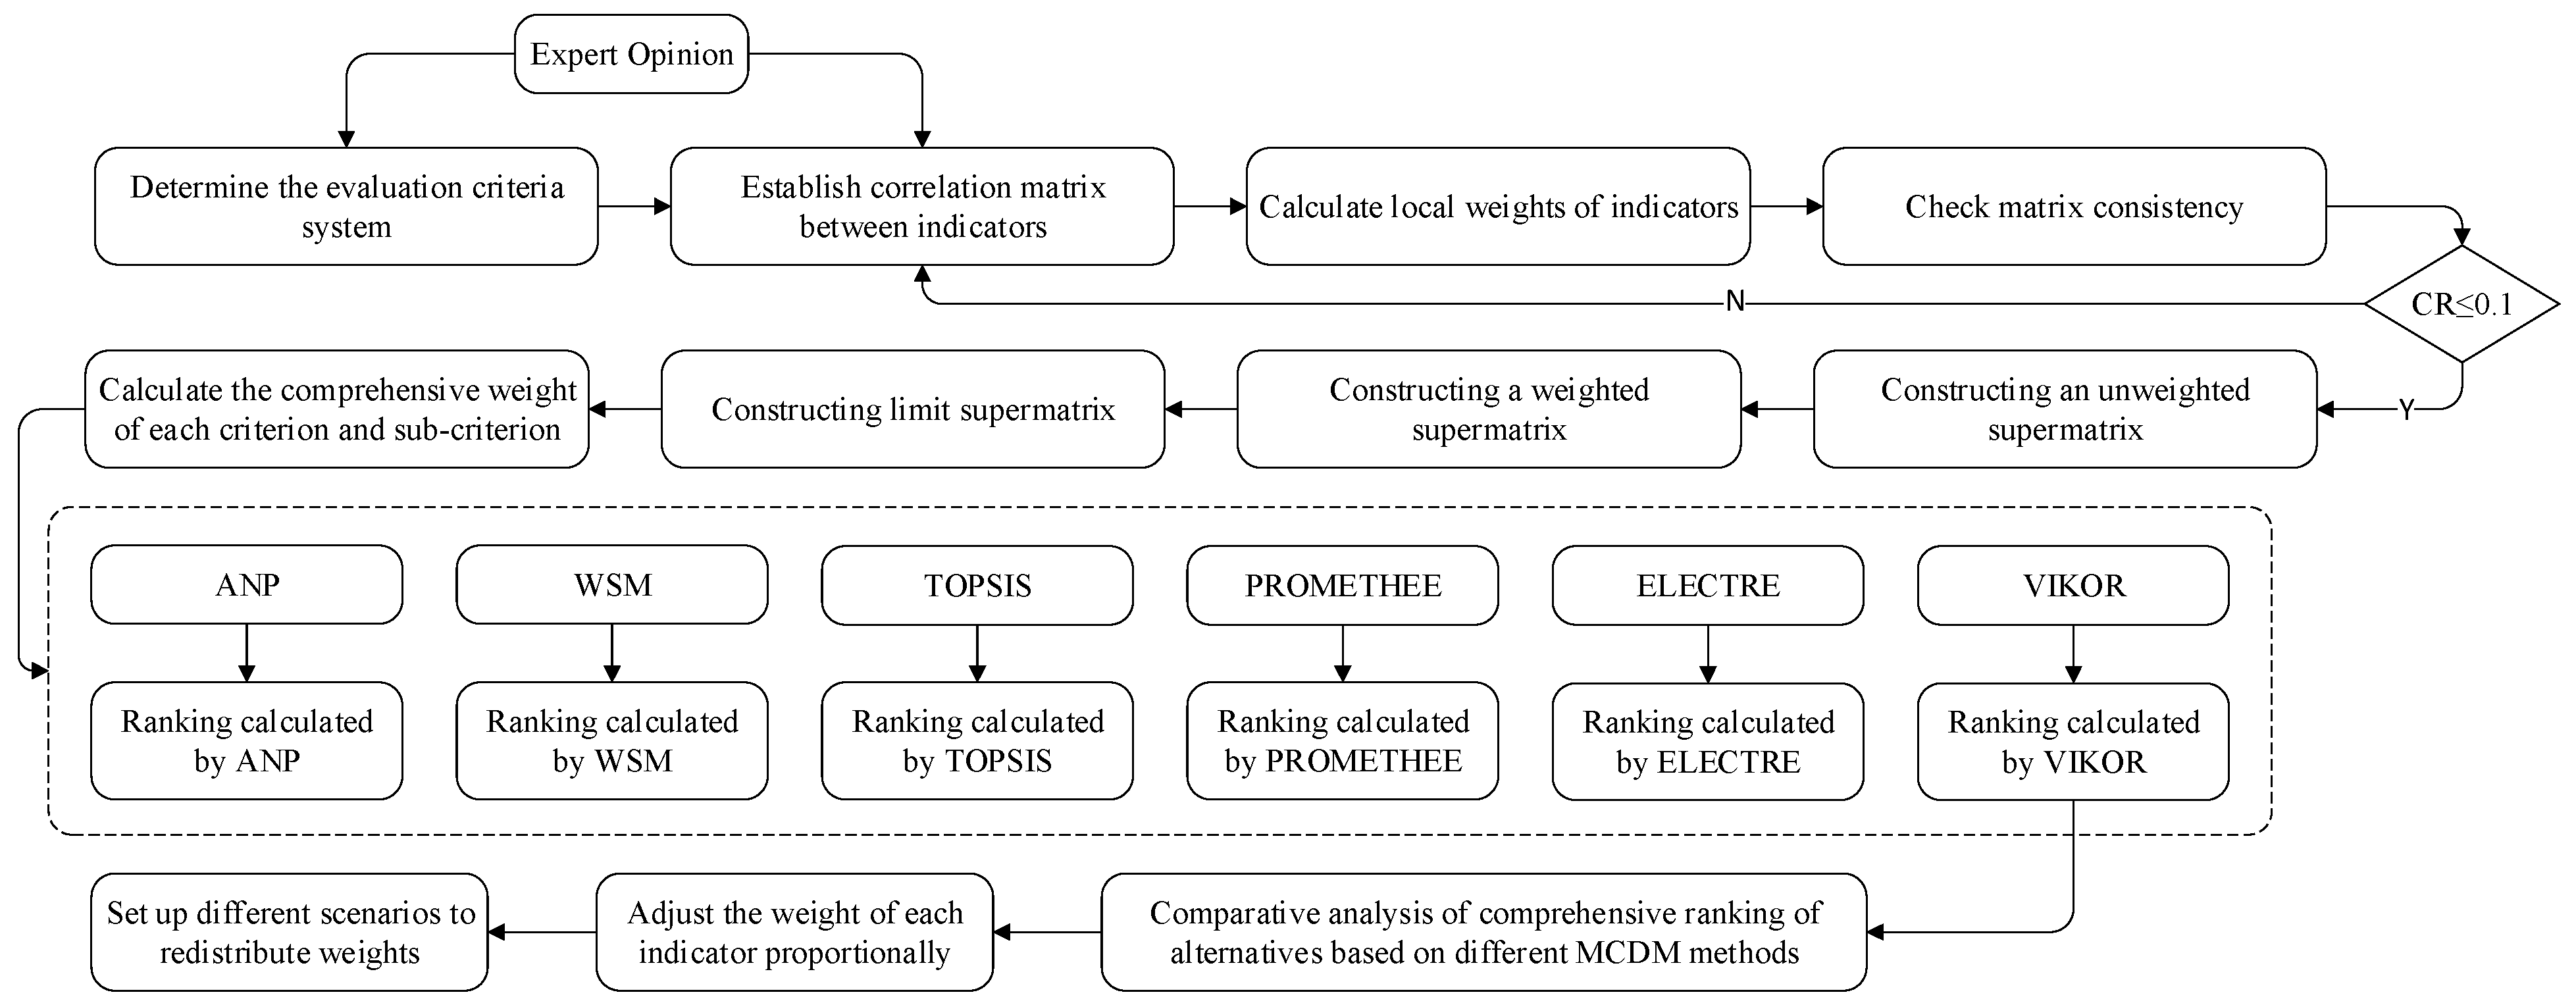
3.2. Performance Evaluation Method Based on ANP and MCDM

After determining the renewable energy index system and alternative schemes with the goal of carbon emission reduction, the renewable energy in China was comprehensively evaluated and prioritized by means of network analysis and MCDM. First, the weight of each criterion was calculated by ANP, and the alternatives were sorted. Then, the weights of the criteria, except the alternatives, were calculated by ANP, and the renewable energy options were ranked by five MCDM methods; finally, the results were compared with those of ANP ranking, so as to make suggestions for the planning and development of renewable energy in China.

3.2.1. Calculation of Criterion Weight Based on ANP

In the selection of renewable energy with the goal of carbon emission reduction, there are often associations or conflicts among the criteria, which do not meet the requirements of the independence of decision-making criteria of the analytic hierarchy process (AHP). However, the network analysis method (ANP) has the characteristic of building a network among the indicators, which can make up for the defects in this aspect and provide weights when the indicators are related to each other. The main idea of ANP is to obtain the comprehensive influence of all decision-making criteria [22]. Additionally, as the network is used instead of the layers in AHP, ANP can deal with complex problems within and between clusters [23]. The calculation process of ANP is as follows:
Step 1: After constructing the index system, the correlation between indicators is obtained by expert investigation, the correlation among indicators is assigned by a 9-bit scaling method, and a pairwise comparison matrix is constructed.
Step 2: An unweighted supermatrix is constructed.
Step 3: A weighted supermatrix is constructed.
Step 4: A limit supermatrix is constructed.
Step 5: Comprehensive weights are generated.
In this study, YAANP (https://www.metadecsn.com/, accessed on 1 August 2021) was used to calculate the comprehensive weight of ANP. On this basis, the index correlation constructed in this study is shown in Figure 2.
In this study, two operations were carried out using ANP. First, the alternative schemes and the indicators were entered into the same system for operation, so that the comprehensive weights of the alternatives were obtained while the indicators were weighted; that is, the alternatives were sorted directly by ANP. Second, the weight of the index without alternatives was calculated, the weight of each index was substituted into the MCDM method, and the alternatives were sorted accordingly. In this way, we could make a more accurate judgment on the performance of the comprehensive utilization of renewable energy with the goal of reducing carbon emissions.

3.2.2. Ranking of Alternatives Based on the MCDM Method

The five MCDM methods that were used in this study are described below: WSM, TOPSIS, PROMETHEE, ELECTRE, and VIKOR.

WSM

The weighted sum method (WSM) is one of the most basic multi-attribute decision-making methods. In the process of WSM calculation, all indicators need to be transformed into benefit indicators, and each index is divided by the sum of all indicators to obtain a standardized matrix. Then, the indicators in each alternative are multiplied by their weights, and the product is the final score of each scheme.

TOPSIS

The TOPSIS method first finds the ideal solution and the negative ideal solution of each alternative and then compares them with the alternative. When a scheme is closest to the ideal solution and farthest from the negative ideal solution, the priority of this alternative is the highest [21]. The calculation process of TOPSIS is as follows:
Step 1: Establish a standardized decision matrix.
r i j = x i j k = 1 m x k j 2 , i = 1 , , m ; j = 1 , , n
Step 2: Calculate the weighted standardized decision matrix. Wj is the weight of index j.
v i j = w j r i j , j = 1 n w j = 1
Step 3: Determine the ideal solution A+ and the negative ideal solution A.
A + = { v 1 + , , v n + } A = { v 1 , , v n }
When index j is the benefit index:
v j + = max { v i j , i = 1 , , m } , v j = min ( v i j , i = 1 , , m )
When index j is a cost indicator:
v j = max { v i j , i = 1 , , m } , v j + = min ( v i j , i = 1 , , m )
Step 4: The distance Di+ of each alternative to the ideal solution and the distance Di of the negative ideal solution are calculated.
D i + = j = 1 n ( v i j v j + ) 2 , i = 1 , , m D i = j = 1 n ( v i j v j ) 2 , i = 1 , , m
Step 5: Calculate the scheme that is closest to the ideal solution.
C i = D i D i + + D i

PROMETHEE

PROMETHEE determines the priority of the scheme by building a function based on the preference of the decision maker, formulating the criteria and their weights, and then using the priority relationship. PROMETHEE’s calculation process is as follows:
Step 1: Place n schemes into A (a1, a2, …, an), which is evaluated by m criteria Ck, and the decision matrix X = (xik) (i = 1, 2, …, n; k = 1, 2, …, m) is obtained. The priority order strength Gk(dij) of scheme ai and aj under the criterion Ck is the priority function value of the criterion value difference. When Gk(dij) = 0, there is no difference between scheme ai and scheme aj. When Gk(dij) = 1, scheme ai has strict priority over scheme aj.
G k ( d i j ) = P k ( a i , a j ) [ 0 , 1 ]
Step 2: According to the weight W, the multi-criteria preference priority index H is obtained.
H ( a i , a j ) = k = 1 m W k P k ( a i , a j )
Step 3: ai’s preference for positive direction Φ+(ai) and negative direction Φ(ai) indicates the degree to which the scheme ai is better or worse than other schemes. The comprehensive priority level value Φ(ai) determines the priority between alternatives.
Φ + ( a i ) = j = 1 n H ( a i , a j ) Φ ( a i ) = j = 1 n H ( a j , a i )
Φ ( a i ) = Φ + ( a i ) Φ ( a i )
Step 4: The final complete sort is obtained according to the comprehensive priority level value Φ(ai).

ELECTRE

The ELECTRE method eliminates the inferior scheme by constructing several weak dominant relations, so as to gradually reduce the size of the scheme set and gradually select the optimal scheme. The calculation process of ELECTRE is as follows:
Step 1: Construct a standardized decision matrix.
r i j = x i j i = 1 m x i j 2
Step 2: The weighted canonical matrix is constructed.
V = [ v i j ] = [ ω j r i j ]
Step 3: Construct a consistent set Ckl and an inconsistent set Dkl. The consistency set is composed of indicators that Ak is not inferior to Al, and the inconsistency set is composed of indicators that Ak is worse than Al.
C k l = { j | x k j x i j } ; D k l = { j | x k j < x i j } = J C k l
Step 4: Construct the consistency matrix C. The consistency index Ckl represents the relative importance between schemes. The range of values is between 0 and 1. The larger the Ckl, the greater the degree to which Ak is superior to Al. Weight normalization, when
j = 1 n ω j = 1 ,   c k l = j C k j ω j . C = [ c k l ] , k l
c k l = j c k l ω j j = 1 n ω j
Step 5: Construct the inconsistency matrix D. The inconsistent index dki indicates the relative unimportance between schemes. The range of values is between 0 and 1. The larger the dki is, the worse the Ak is compared to the Al.
D = [ d k l ] , k l
d k l = max j D k i | v k j v i j | max j J | v k j v i j |
Step 6: Construct the consistent domination matrix F = fkl. α is the threshold of the consistency index, and when Cklα, scheme Ak may dominate Al.
α = k = 1 k l n l = 1 l k n c k l n ( n 1 )
f k l = { 1 c k l α 0 c k l < α
Step 7: Construct the non-consistent dominating matrix G = gkl and the threshold β of the consistency index.
β = k = 1 k l n l = 1 l k n d k l n ( n 1 )
g k l = { 1 d k l β 0 d k l > β
Step 8: The comprehensive domination matrix E is constructed.
e k l = f k l g k l
Step 9: Remove the bad plan. The comprehensive domination matrix E represents the partial order relationship between schemes, and ekl = 1 indicates that from the point of view of consistency or inconsistency scheme Ak is ranked before Al. However, the scheme Ak may be exceeded by other alternatives, so if the alternative is to be optimal, there is at least one scheme Al, so that ekl = 1 and all other schemes Ai have eik = 0, kli.

VIKOR

VIKOR is the optimal compromise solution. By building a compromise scheme, individual regrets can be minimized while meeting the interests of the group [24]. The calculation process is as follows:
Step 1: Calculate the positive ideal solution fi* and the negative ideal solution fi of the index. I1 is the benefit index, and I2 is the cost index.
f i * = [ ( max j f i j | i I 1 ) , ( min j f i j | i I 2 ) ] , i f i = [ ( min j f i j | i I 1 ) , ( max j f i j | i I 2 ) ] , i
Step 2: Calculate the Sj and Rj values of the scheme. Wi is the weight of index i.
S j = i n w i ( f i * f i j ) / ( f i * f i ) , j
R j = max i [ w i ( f i * f i j ) / ( f i * f i ) ] , j
Step 3: Calculate the Q value of each scheme.
Q j = v ( S j S * ) / ( S S * ) + ( 1 v ) ( R j R * ) / ( R R * ) , j
S * = min j S j ; S = max j S j ; R * = min j R j ; R = max j R j
S* represents the solution when the group utility is the maximum, and R* represents the solution when the personal regret is minimized. In order to maximize the coefficient of the group utility decision-making mechanism, the larger v is, the higher the attention to group interests is, and the less attention is paid to individual interests. We set v to 0.5 to maximize the balance between group utility and individual regret.
Step 4: The Q value of the descending arrangement scheme is finally sorted.

3.3. Data

The source of energy index data in this study was the China Energy Statistical Yearbook and the 2020 China Renewable Energy Development report. The data of economic indicators were derived from the China Renewable Energy Development report, the 13th Five-Year Plan for Renewable Energy Development, the Energy Technology Roadmap—China Wind Power Development Roadmap 2050, and the 2020 Renewable Energy Generation cost report released by the International Renewable Energy Agency (IREA). The technical index data were derived from the research results of “China’s Energy Science and Technology Development Roadmap to 2050”, the China Energy Statistical Yearbook, and the research results of Kara et al. (2021) [25] compiled by the Energy Strategy Research Group of the Chinese Academy of Sciences. The environmental data and carbon indicators were derived from the China Environmental Statistical Yearbook and the China Energy Statistical Yearbook and combined the practices of Li et al. (2020), Osmani et al. (2013), Shen et al. (2010), and Troldborg et al. (2014) [21,26,27,28]. The data of social indicators were derived from the China Statistical Yearbook and other provincial statistical yearbooks.

4. Results and Discussion

4.1. MCDM Results

4.1.1. ANP Weight Calculation Result

Table 2 shows the weights of the dimensions and indicators calculated by the ANP. When using a carbon emission reduction index system to evaluate renewable energy, the weight of environment and carbon dimensions was the highest, followed by economic and energy dimensions, and the weight of technology and social dimensions was the lowest. After calculating the weight of the index, direct carbon emission reduction is the most important, followed by the carbon emission cost, technology maturity, green investment allocation, and pollutant reduction, which was followed by green energy reserve, indirect carbon emissions, carbon emission intensity, the installed scale and investment quota of low-carbon equipment, and the power generation cost.

4.1.2. Calculation Results of MCDM

The weights and ranking of each alternative calculated by ANP are listed in Table 3. The results show that after comprehensively considering carbon emission reduction as the index of the evaluation system, photovoltaic ranks first, with a weight of 0.337, followed by wind power and hydropower, with weights of 0.267 and 0.191, respectively, and geothermal and biomass ranked fourth and fifth, with weights of 0.104 and 0.100, respectively.
Table 4 shows the results of ranking the development and utilization of renewable energy in China according to the standard of carbon reduction under different MCDM methods. The overall results are highly consistent, and there are only slight differences in individual methods. Among the six MCDM methods, photovoltaic ranks first, indicating that photovoltaic is the most potential and effective renewable energy for carbon reduction in China after comprehensive evaluation from the perspectives of energy, the economy, environment and carbon, technology, and society. In second place, except for the ELECTRE method, which focuses on hydropower, all the other methods showed a preference for wind power. In third place, except for the ELECTRE method, all the other methods focused on hydropower. This shows that, when evaluating renewable energy through ELECTRE, there may be different results from other methods, and a more accurate ranking can be obtained after comprehensive consideration with other methods. The order of the fourth and fifth places was reversed except for PROMETHEE and VIKOR, and other methods showed that geothermal energy is better than biomass energy. The results generally show that there are three echelons of renewable energy in China with the goal of reducing carbon emissions: the first echelon is photovoltaic energy, the second echelon is wind power and hydropower, and the third echelon is geothermal and biomass energy.

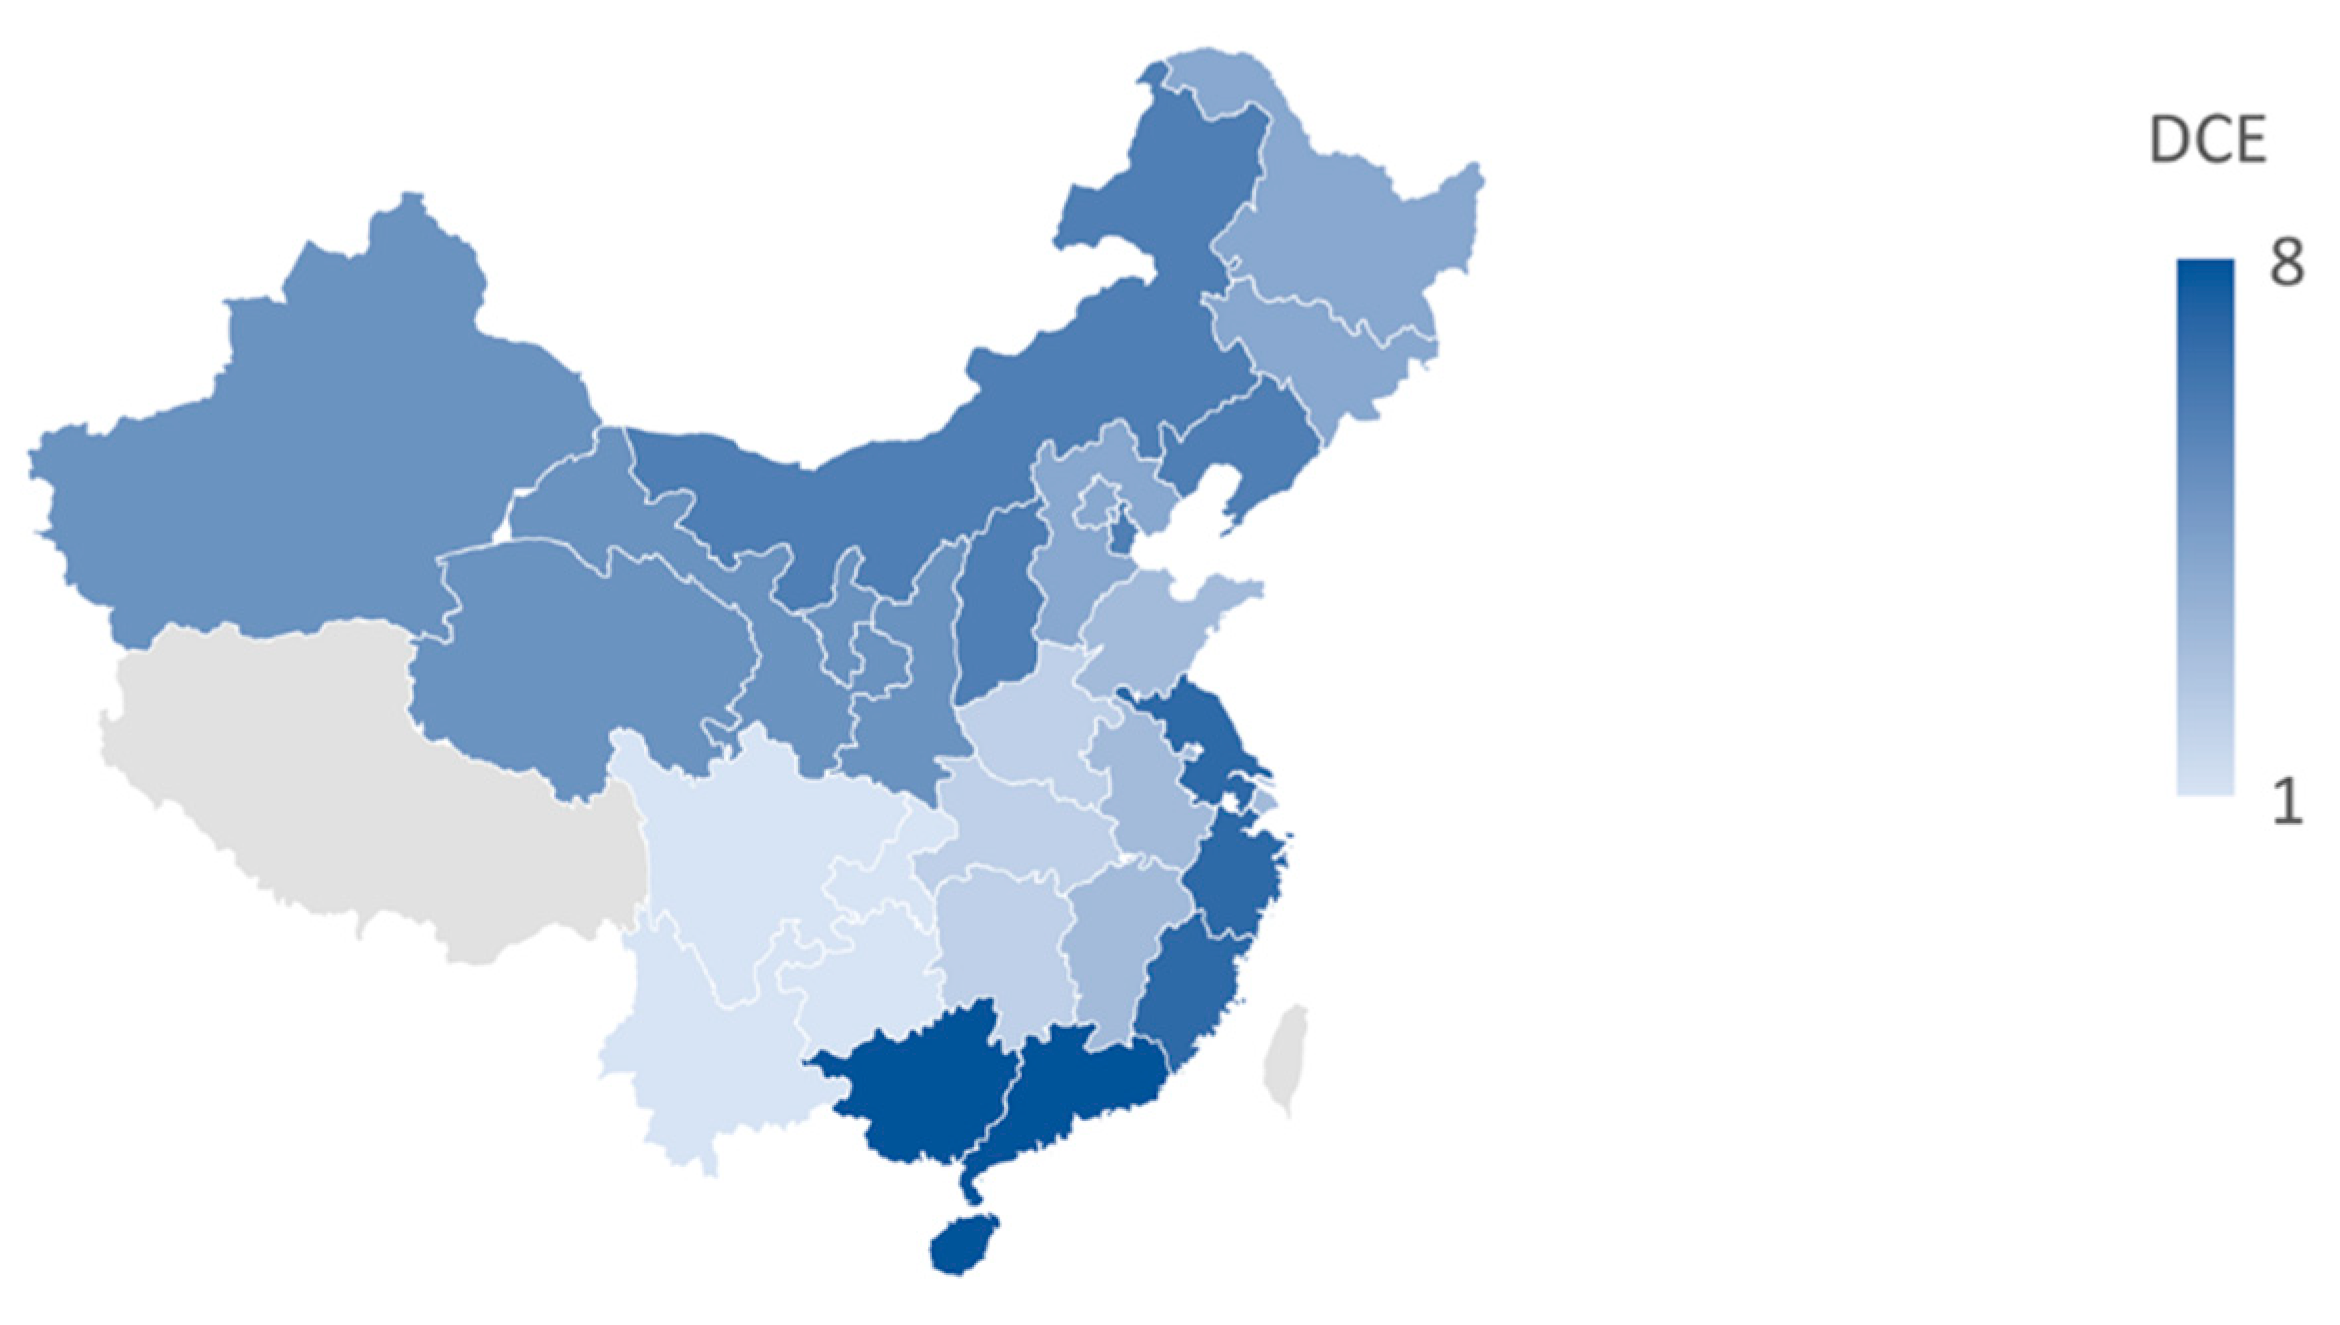
4.1.3. Regional Calculation Results

In the following, we divide the options according to the region, so that we can analyze the utilization sequence of renewable energy more deeply. At present, there are three main types of carbon emission regions in China. First, they are divided according to the eastern, central, and western regions. Second, the eight economic regions are divided according to the Strategy and Policy of Regional-coordinated Development proposed by the Development Research Center of the State Council. Through this method, the region is divided into the northeast comprehensive economic zone, the northern coastal comprehensive economic zone, the eastern coastal comprehensive economic zone, the southern coastal economic zone, middle reaches of the Yellow River comprehensive economic zone, middle reaches of the Yangtze River comprehensive economic zone, the southwest comprehensive economic zone, and the northwest comprehensive economic zone. Third, according to the eight major economic regions in the Interregional Input–Output Table of China, they are divided into the northeast region, the Beijing–Tianjin area, the northern coastal area, the eastern coastal area, the southern coastal region, the central region, the northwest region, and the southwest region. Tu and Chen (2012) found that the above three classification methods are not scientifically reasonable for the analysis of regional carbon emission reduction [29]. Therefore, we divided the carbon emission regions of our country through two steps. First, we refer to the research conclusion of Tu and Chen (2012) [29]. According to energy intensity, carbon emission regions in China are divided into heavy-energy areas (Zhejiang, Guangdong, and Guangxi), relatively heavy-energy areas (Jiangsu, Fujian, and Hainan), and high-energy intensity areas (Tianjin, Shanxi, Inner Mongolia, Liaoning, Gansu, Qinghai, and Ningxia). Areas with relatively higher energy intensity are Beijing, Hebei, Jilin, Heilongjiang, Shanghai, Anhui, Jiangxi, Shandong, Henan, Hubei, Hunan, Chongqing, Sichuan, Guizhou, Yunnan, Shaanxi, and Xinjiang. Second, due to the great differences in the conditions of renewable energy in different regions, we subdivided them again according to the energy potential of different regions on the basis of the above divisions. Finally, the carbon emission regions in China were divided into areas with serious carbon emissions (Guangdong, Guangxi, and Hainan), areas with sub-serious carbon emissions (Zhejiang, Jiangsu, and Fujian), high-carbon intensity areas I (Tianjin, Shanxi, Inner Mongolia, and Liaoning), high-carbon intensity areas II (Gansu, Qinghai, Ningxia, Shaanxi, and Xinjiang), second high-carbon intensity areas I (Beijing, Hebei, Jilin, and Heilongjiang), second high-carbon intensity areas II (Shanghai, Anhui, Jiangxi, and Shandong), second high-carbon intensity areas III (Henan, Hubei, and Hunan) and second high-carbon intensity areas IV (Chongqing, Sichuan, Guizhou, and Yunnan). The regional division map of China’s carbon emissions is shown in Figure 3. The darker the color is, the higher the carbon emissions are, and the data of Taiwan Province and the Tibet Autonomous Region are not listed due to lack of data.
The sequence of renewable energy use in eight carbon emission regions according to energy intensity and resource characteristics is shown in Table 5. Generally speaking, the areas with serious carbon emissions and with sub-serious carbon emissions are located in the eastern and southern coastal areas of China, and the high-intensity areas of carbon emissions are located in the north, northeast, and northwest of China. The sub-high-intensity areas of carbon emissions are located in the central, south-central, and southwest of China. In areas with serious carbon emissions, other MCDM methods, except PROMETHEE, showed that hydropower is the best choice to alleviate carbon emissions, and there is a relatively chaotic sequence from the second to the fifth, indicating that the role of other renewable energy in carbon emission reduction is limited due to the characteristics of resources and carbon emissions in this region. In the areas with the second most serious carbon emissions, the top two are photovoltaic and wind power, of which photovoltaic is better, which mainly depends on the promotion of local excellent photovoltaic resources and policies. In high-carbon emission area I, except for ELECTRE, which places photovoltaic energy in first place, the other methods place wind power in first place, followed by photovoltaic power, which is mainly due to the rich wind resources in North China. In high-carbon emission area II, all the methods place photovoltaic in first place, and wind power is mainly in second place, which is due to the fact that the provinces in this region are located in the northwest of China and are rich in solar energy resources. The second highest carbon emission area I shows a preference for wind power in all four methods, except PROMETHEE, followed by biomass energy. Carbon emission sub-high-intensity area II tends to favor photovoltaic and wind power; carbon emission sub-high-intensity area III takes hydropower as the main carbon reduction renewable energy; carbon emission sub-high-intensity area IV is located in the southwest, where there are many mountains and rivers, but is also dominated by hydropower.

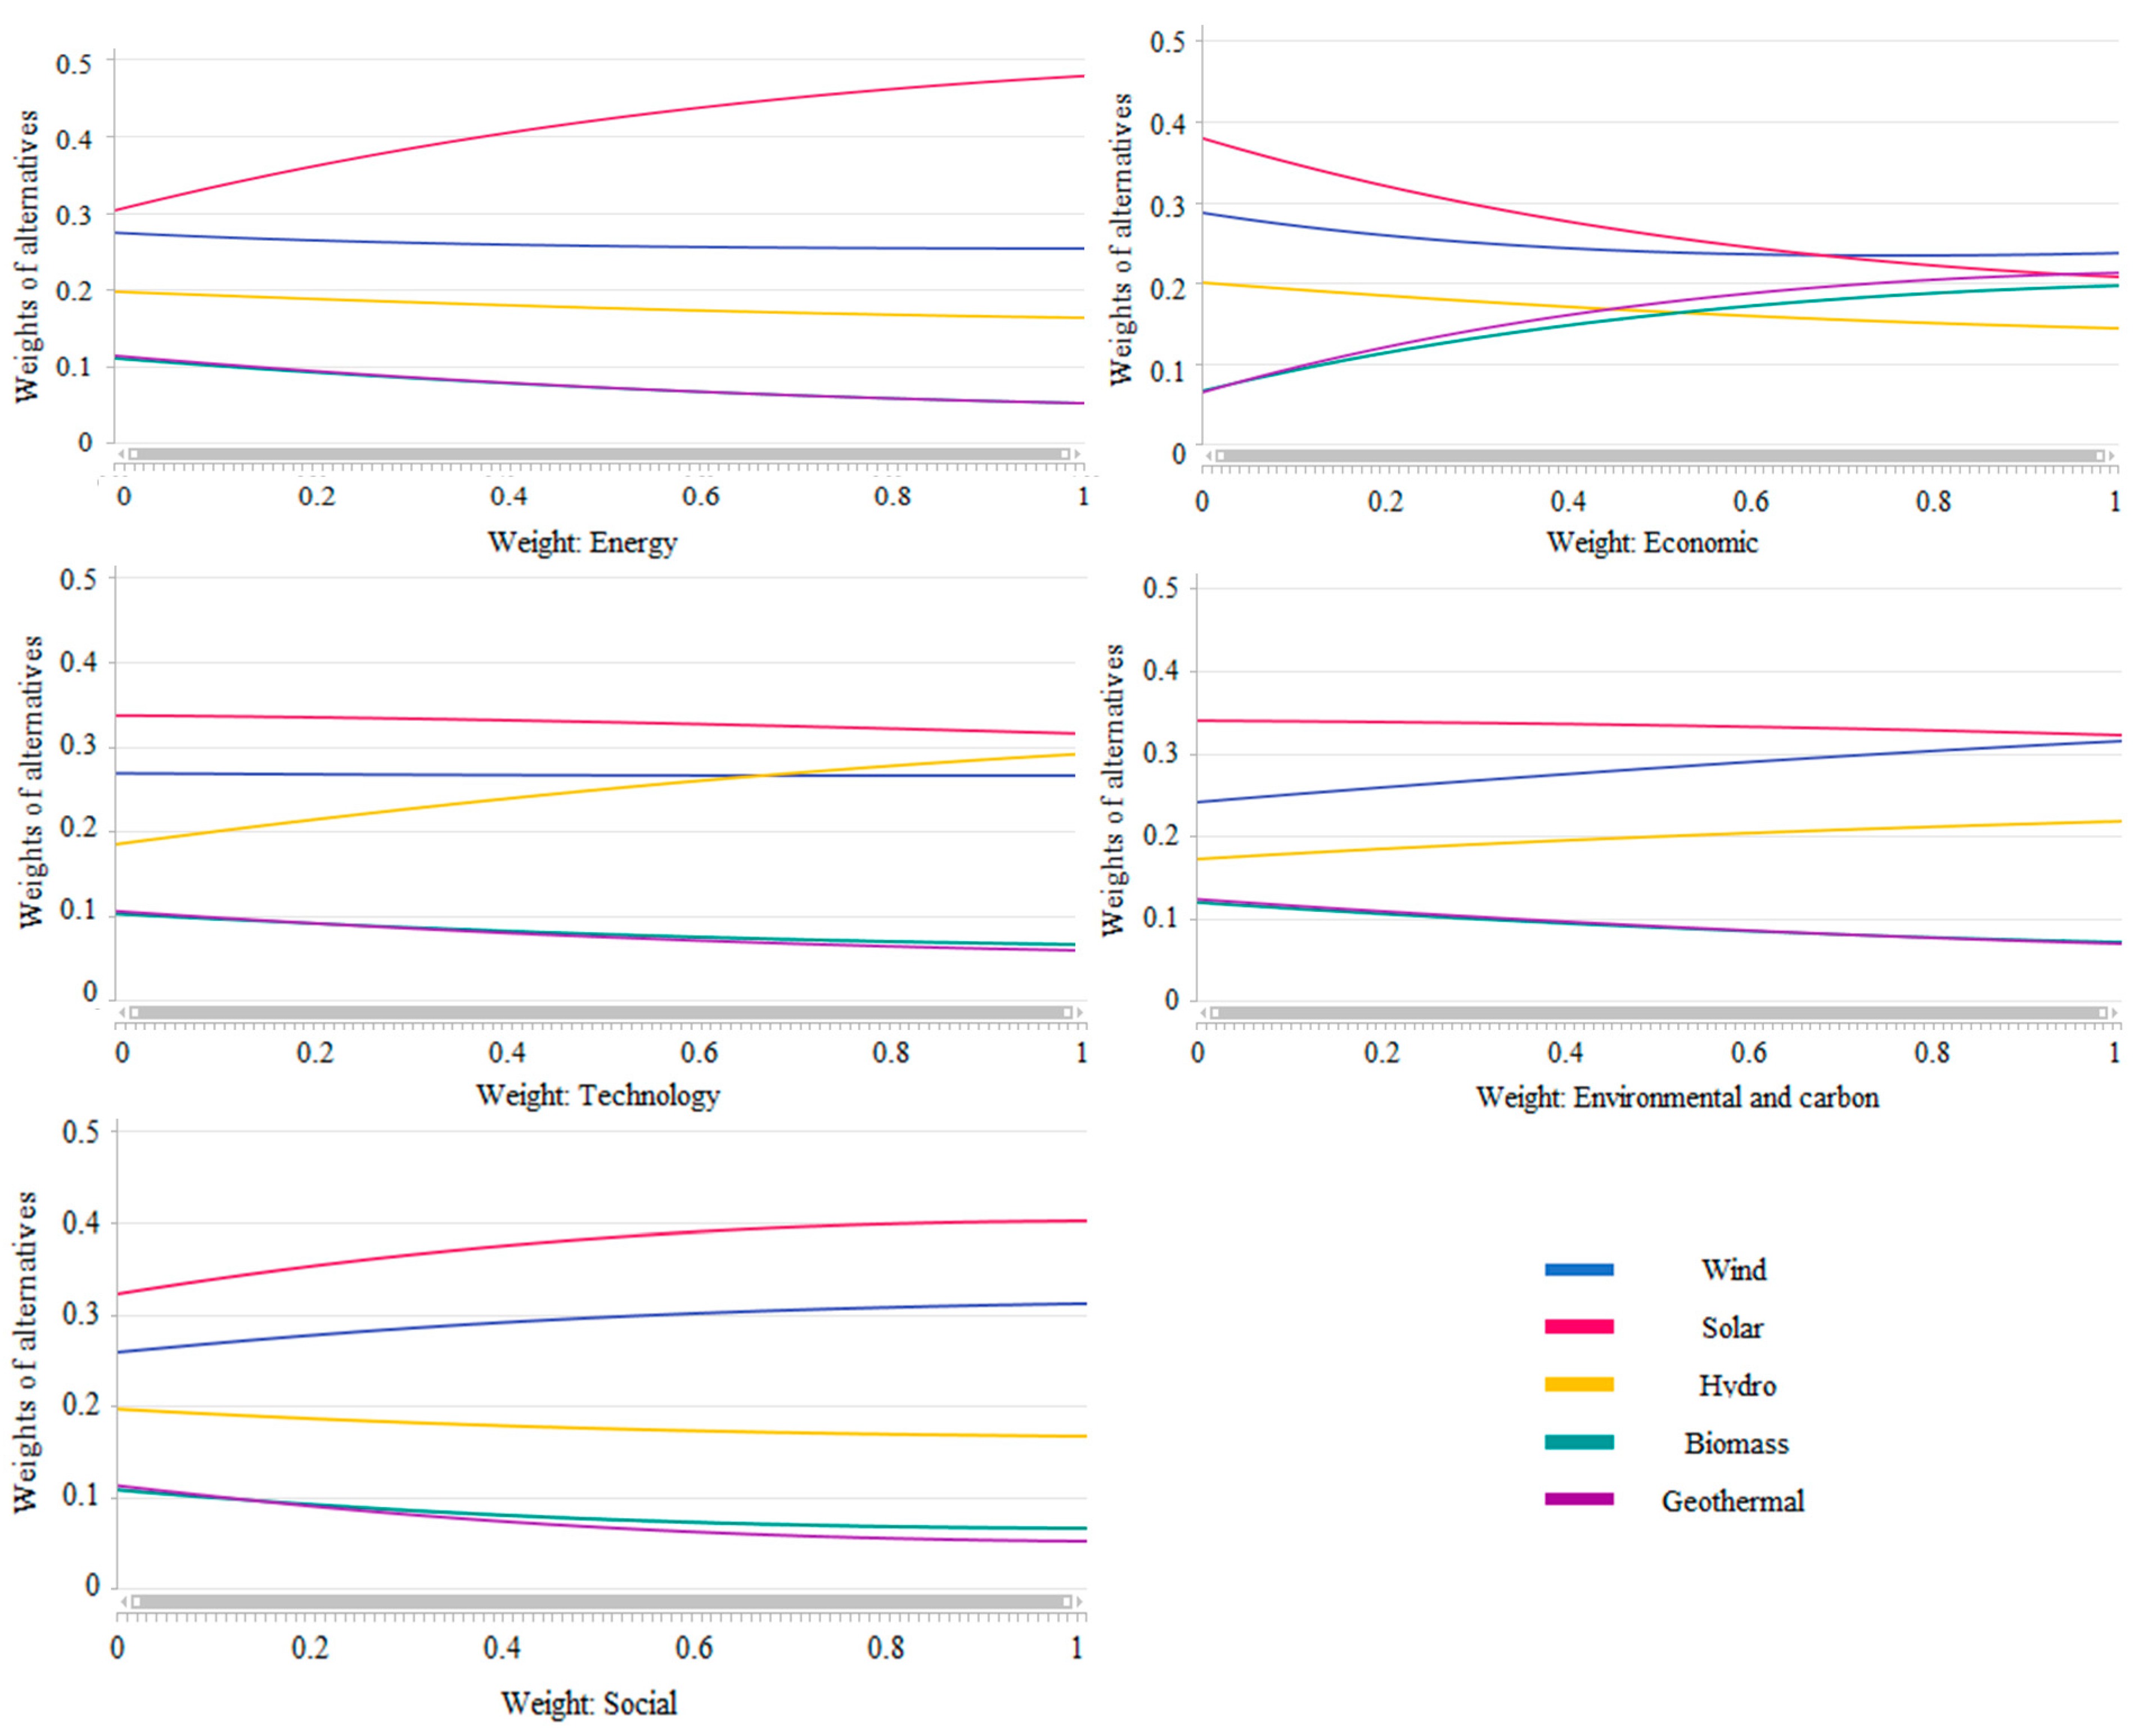
4.2. Sensitivity Analysis

When sorting the alternatives, we found that there is a strong correlation between the weights and the order of the alternatives, so the change in weights may have a profound impact on the ranking of renewable energy. This study conducted a sensitivity analysis of the weight in order to find out the influence of the change in the weight on the order of the alternatives.
In the sensitivity analysis of the weight by dimension, we set up five situations to adjust the weight according to the five dimensions of energy, the economy, technology, environment, carbon, and society, and analyzed the changes in the priority of renewable energy in various situations. Figure 4 shows the results of the sensitivity analysis of weights in five situations. In the change in the weight of the energy dimension from 0 to 1, the proportion of photovoltaic gradually increased from 0.3 to close to 0.5, and the proportion of the other four renewable energy sources in this process showed a downward trend. Each alternative showed a divergent trend with the increase in the weight of the energy dimension. In the process of changing the weight of the economic dimension from 0 to 1, the weight of photovoltaic energy gradually decreased, and when the weight of the economic dimension increased to 0.7, it was exceeded by wind power. The weights of photovoltaic energy, wind power, and hydropower all decreased with an increase in the weight of the economic dimension, while the weights of biomass and geothermal energy increased with an increase in the weight of the economic dimension. Although the weight of the current economic dimension was 0.278, which is small, it can still be seen that photovoltaic energy and wind power are more sensitive to the economic dimension. Each alternative showed a trend of convergence with the increase in the weight of the economic dimension. In the process of the change in the weight of the technology dimension from 0 to 1, the change in each alternative was relatively smooth; photovoltaic energy always ranked first, but the weight decreased slightly; and the weight of wind power was almost parallel to that of photovoltaic power. The weight of hydropower increased obviously with the increase in the weight of the technology dimension and surpassed the wind power in second place when the weight of the technology dimension increased to 0.67. The weight of biomass and geothermal energy decreased slightly in this process. In the process of changing the weight of the environment and carbon dimensions from 0 to 1, the weight of photovoltaic power decreased slightly, while the weight of wind power and hydropower increased approximately, and with the increase in the weight of environment and carbon dimensions, the gap between photovoltaic and wind power and hydropower narrowed, and photovoltaic power and hydropower showed a convergence trend. The changing trend of the weight of biomass and geothermal energy with the change in the weight of the environment and carbon dimensions was highly similar to that of the weight of the energy and technology dimensions. In the process of changing the weight of the social dimension from 0 to 1, the weight of photovoltaic energy and wind power showed an upward trend, while the weight of hydropower, geothermal, and biomass energy showed a downward trend. The difference between the options increased with the increase in the weight of the social dimension. When taking the weight calculated above as the starting point, the weight gap between the options increased, but the order did not change.
In general, the weight of photovoltaic energy increases when the weights of the energy and social dimensions change and decreases when the weights of economic, technological, and environmental and carbon dimensions change. The weight of wind power decreases when the weights of the energy, economic, and technological dimensions change and increases when the weights of the environmental and carbon and social dimensions change. The weight of hydropower decreases when the weights of the energy, economic, and social dimensions change and increases when the weights of the technology, environment, and carbon dimensions change. Biomass and geothermal energy decrease when the weights of the energy, technology, environment and carbon, and social dimensions change and increase when the weight of the economic dimension changes.
In the process of the change in the weight of each dimension, the change in the weight of the energy and the environment and carbon dimensions did not change the order of the alternatives, and the change in the weight of the social dimension changed the order of the alternatives once. The change in the weight of the technical dimension changed the order of the options twice, and the change in the weight of the economic dimension changed the order of the options four times.

5. Conclusions and Policy Recommendations

This study measured the sequence and differences of the development and utilization of renewable energy in different regions from the perspective of carbon emission reduction and provided a new analytical perspective for the utilization and distribution of renewable energy in China. It provided a solution based on renewable energy for achieving the carbon emission reduction target as soon as possible, confirmed by a variety of methods, further enhancing the reliability of the evaluation system. Through the integration of network analysis and a variety of MCDM methods, the system can deal with complex evaluation indicators with interactions between indicators, and each MCDM evaluation method selects alternatives from different angles based on their respective preferences for indicators; the results can support and verify each other, making the comprehensive results more comprehensive and reliable.
The results show that the environment and carbon dimensions are the most important criteria to evaluate the priority of renewable energy under carbon emission reduction, followed by the economic, energy, technological, and social dimensions. The weight order of each index included direct carbon emission reduction, the carbon emission cost, technological maturity, green investment allocation, pollutant reduction, energy processing and conversion efficiency, green energy utilization efficiency, the renewable energy grid connection rate, the investment cost, employment, the green power growth rate, environmental regulation, green management, the impact on the ecosystem, climate status, the power generation cost, the installed scale and investment quota of low-carbon equipment, the carbon emission intensity, indirect carbon emissions, and the green energy reserves. Environment and carbon dimensions are the most important part of renewable energy assessment dominated by carbon emission reduction, which should focus on direct carbon emission reduction and pollutant emission reduction. The economic dimension is the second important part of the renewable energy evaluation dominated by carbon emission reduction, and the carbon emission cost and green investment allocation need to be considered in the renewable energy evaluation. In the energy dimension, we need to pay attention to the green energy efficiency and grid connection rate, in order to promote carbon emission reduction from the energy aspect. In the technology dimension, technological maturity and energy processing and conversion efficiency play an important role in whether renewable energy can promote carbon emission reduction. Although the social dimension has the lowest weight among all dimensions, employment, green management, and environmental regulation still play an important role in the renewable energy evaluation system based on carbon emission reduction, and the social dimension is the foundation, which must be further considered.
When evaluating the priority of renewable energy aiming to reduce carbon emissions as a whole, all methods showed that photovoltaic energy is the best choice. In the top three, the choices of ANP, WSM, TOPSIS, PROMETHEE, and VIKOR were the same; the second and third places were held by wind power and hydropower, respectively. ELECTRE ranked hydropower in second place and wind power in third place. After dividing regions according to carbon emission intensity, it was found that areas with serious carbon emissions are suitable for the development of hydropower; areas with sub-serious carbon emissions should give priority to photovoltaic or wind power; areas with high carbon emissions should vigorously develop wind power; areas with high carbon emissions intensity (II) should focus on photovoltaic power; areas with sub-high carbon emissions are suitable for the development of wind and photovoltaic power; and areas III and IV with sub-high carbon emissions are the most suitable for hydropower. After the sensitivity analysis of the weight, the importance of photovoltaic energy increased with the increase in the weight of the energy and social dimensions, and the importance of wind power increased with the increase in the weight of the environmental and carbon and social dimensions. The importance of hydropower increases with the increase in the weight of the technology and environment and carbon dimensions. The importance of biomass and geothermal energy improved with the increase in the weight of the economic dimension. In the sensitivity analysis, photovoltaic power was still the best choice, followed by wind power and hydropower, and finally geothermal and biomass energy, which is basically consistent with the results of the MCDM calculation.
From the point of view of carbon emission reduction, this study further confirms the effectiveness of the MCDM method in renewable energy evaluation on the basis of existing research, and through the sensitivity analysis of the impact of index weight changes on the priority of alternatives, it provides a basis for the selection of the MCDM method in the evaluation of renewable energy under different weight distribution and application scenarios. There are differences in carbon emission intensity in different regions, so it is difficult to generalize when choosing renewable energy based on carbon emission reduction. By considering the different preferences of the energy, economy, technology, environment and carbon, and social dimensions in different regions, choosing more targeted evaluation methods can further improve the efficiency of renewable energy development and utilization.
Based on the above analysis, we propose the following relevant policy recommendations for renewable energy with the goal of carbon emission reduction:
(1) Increase investment in renewable energy: we will increase support for new energy enterprises with strong innovation ability and great potential for carbon emission reduction and improve the coverage of renewable energy subsidy policies in line with local conditions and increase the R & D funding of private renewable energy companies, so that they can maximize the replacement of coal energy consumption, effectively improve the proportion of energy consumption, and achieve the double carbon goal as soon as possible in the process of continuously improving a clean, efficient, and safe energy system.
(2) Improve the utilization efficiency of renewable energy: China is rich in renewable resources, so it is necessary to continuously develop advanced technology, increase the utilization efficiency of renewable energy, and, at the same time, maintain a reasonable range of installed scale and investment quota of low-carbon equipment, in order to ensure the stable development of renewable energy. Thus, while the installed scale of renewable energy continues to expand, its utilization efficiency can also be continuously improved.
(3) Adjust measures to local conditions and produce a rational layout: combined with the differences in renewable resources conditions and carbon emission intensity in different regions, the development plan of renewable energy in different regions should be formulated reasonably. In addition, the development of renewable energy needs low-carbon, clean, and efficient coal in the foreseeable future. For a relatively long time, the absorption of clean power into the grid and the stable operation of the power grid require the peak regulation matching of thermal power generation, so it is necessary to distribute coal and renewable energy as a whole and allocate them reasonably.

Author Contributions

T.L. and A.L. designed the research; A.L. completed the calculations and analyzed the data; A.L. wrote the original draft; A.L. and Y.S. reviewed and edited the paper. All authors have read and agreed to the published version of the manuscript.

Funding

This research was funded by the Fundamental Research Funds for the Central Universities (no. 003-JB2019138).

Institutional Review Board Statement

Not applicable.

Informed Consent Statement

Not applicable.

Data Availability Statement

Data available on request due to restrictions eg privacy or ethical. The data presented in this study are available on request from the corresponding author. The data are not publicly available due to [The data come from many sources.].

Acknowledgments

The authors wish to acknowledge the anonymous reviewers for their suggestions that have improved our paper.

Conflicts of Interest

The authors declare no conflict of interest.

References

  1. Sadeghi, A.; Larimian, T. Sustainable electricity generation mix for Iran: A fuzzy analytic network process approach. Sustain. Energy Technol. Assess. 2018, 28, 30–42. [Google Scholar] [CrossRef]
  2. Fan, J.-L.; Da, Y.-B.; Wan, S.-L.; Zhang, M.; Cao, Z.; Wang, Y.; Zhang, X. Determinants of carbon emissions in ‘Belt and Road initiative’ countries: A production technology perspective. Appl. Energy 2019, 239, 268–279. [Google Scholar] [CrossRef]
  3. Dogan, E.; Seker, F. The influence of real output, renewable and non-renewable energy, trade and financial development on carbon emissions in the top renewable energy countries. Renew. Sustain. Energy Rev. 2016, 60, 1074–1085. [Google Scholar] [CrossRef]
  4. Short, W.; Packey, D.J.; Holt, T. A Manual for the Economic Evaluation of Energy Efficiency and Renewable Energy Technologies; National Renewable Energy Lab.: Golden, CO, USA, 1995.
  5. Raugei, M.; Leccisi, E. A comprehensive assessment of the energy performance of the full range of electricity generation technologies deployed in the United Kingdom. Energy Policy 2016, 90, 46–59. [Google Scholar] [CrossRef] [Green Version]
  6. Ahmad, S.; Tahar, R.M. Selection of renewable energy sources for sustainable development of electricity generation system using analytic hierarchy process: A case of Malaysia. Renew. Energy 2014, 63, 458–466. [Google Scholar] [CrossRef]
  7. Büyüközkan, G.; Güleryüz, S. An integrated DEMATEL-ANP approach for renewable energy resources selection in Turkey. Int. J. Prod. Econ. 2016, 182, 435–448. [Google Scholar] [CrossRef]
  8. Haddad, B.; Liazid, A.; Ferreira, P. A multi-criteria approach to rank renewables for the Algerian electricity system. Renew. Energy 2017, 107, 462–472. [Google Scholar] [CrossRef]
  9. Matsumoto, K.I.; Morita, K.; Mavrakis, D.; Konidari, P. Evaluating Japanese policy instruments for the promotion of renewable energy sources. Int. J. Green Energy 2017, 14, 724–736. [Google Scholar] [CrossRef]
  10. Atmaca, E.; Basar, H.B. Evaluation of power plants in Turkey using Analytic Network Process (ANP). Energy 2012, 44, 555–563. [Google Scholar] [CrossRef]
  11. Al-Sharafi, A.; Yilbas, B.S.; Sahin, A.Z.; Ayar, T. Performance assessment of hybrid power generation systems: Economic and environmental impacts. Energy Convers. Manag. 2017, 132, 418–431. [Google Scholar] [CrossRef]
  12. Zhang, M.; Yang, Z.; Liu, L.; Zhou, D. Impact of renewable energy investment on carbon emissions in China—An empirical study using a nonparametric additive regression model. Sci. Total Environ. 2021, 785, 147109. [Google Scholar] [CrossRef] [PubMed]
  13. Wang, Z.; Ben Jebli, M.; Madaleno, M.; Doğan, B.; Shahzad, U. Does export product quality and renewable energy induce carbon dioxide emissions: Evidence from leading complex and renewable energy economies. Renew. Energy 2021, 171, 360–370. [Google Scholar] [CrossRef]
  14. He, A.; Xue, Q.; Zhao, R.; Wang, D. Renewable energy technological innovation, market forces, and carbon emission efficiency. Sci. Total Environ. 2021, 796, 148908. [Google Scholar] [CrossRef] [PubMed]
  15. Adams, S.; Acheampong, A.O. Reducing carbon emissions: The role of renewable energy and democracy. J. Clean. Prod. 2019, 240, 118245. [Google Scholar] [CrossRef]
  16. Hanif, I.; Aziz, B.; Chaudhry, I.S. Carbon emissions across the spectrum of renewable and nonrenewable energy use in developing economies of Asia. Renew. Energy 2019, 143, 586–595. [Google Scholar] [CrossRef]
  17. Zhao, F.; Liu, F.; Hao, H.; Liu, Z. Carbon Emission Reduction Strategy for Energy Users in China. Sustainability 2020, 12, 6498. [Google Scholar] [CrossRef]
  18. Duan, Z.; Wang, X.E.; Dong, X.; Duan, H.; Song, J. Peaking Industrial Energy-Related CO2 Emissions in Typical Transformation Region: Paths and Mechanism. Sustainability 2020, 12, 791. [Google Scholar] [CrossRef] [Green Version]
  19. Pohekar, S.D.; Ramachandran, M. Application of multi-criteria decision making to sustainable energy planning—A review. Renew. Sustain. Energy Rev. 2004, 8, 365–381. [Google Scholar] [CrossRef]
  20. Mulliner, E.; Malys, N.; Maliene, V. Comparative analysis of MCDM methods for the assessment of sustainable housing affordability. Omega-Int. J. Manag. Sci. 2016, 59, 146–156. [Google Scholar] [CrossRef]
  21. Li, T.; Li, A.; Guo, X. The sustainable development-oriented development and utilization of renewable energy industry—A comprehensive analysis of MCDM methods. Energy 2020, 212, 118694. [Google Scholar] [CrossRef]
  22. Saaty, T.L. Fundamentals of the analytic network process—Multiple networks with benefits, costs, opportunities and risks. Syst. Sci. Syst. Eng. 2004, 13, 348–379. [Google Scholar] [CrossRef]
  23. Meade, L.M.; Sarkis, J. Analyzing organizational project alternatives for agile manufacturing processes: An analytical network approach. Int. J. Prod. Res. 1999, 37, 241–261. [Google Scholar] [CrossRef]
  24. Opricovic, S.; Tzeng, G.H. Compromise solution by MCDM methods: A comparative analysis of VIKOR and TOPSIS. Eur. J. Oper. Res. 2004, 156, 445–455. [Google Scholar] [CrossRef]
  25. Kara, S.E.; Ibrahim, M.D.; Daneshvar, S. Dual Efficiency and Productivity Analysis of Renewable Energy Alternatives of OECD Countries. Sustainability 2021, 13, 7401. [Google Scholar] [CrossRef]
  26. Osmani, A.; Zhang, J.; Gonela, V.; Awudu, I. Electricity generation from renewables in the United States: Resource potential, current usage, technical status, challenges, strategies, policies, and future directions. Renew. Sustain. Energy Rev. 2013, 24, 454–472. [Google Scholar] [CrossRef]
  27. Shen, Y.-C.; Lin, G.T.R.; Li, K.-P.; Yuan, B.J.C. An assessment of exploiting renewable energy sources with concerns of policy and technology. Energy Policy 2010, 38, 4604–4616. [Google Scholar] [CrossRef]
  28. Troldborg, M.; Heslop, S.; Hough, R.L. Assessing the sustainability of renewable energy technologies using multi-criteria analysis: Suitability of approach for national-scale assessments and associated uncertainties. Renew. Sustain. Energy Rev. 2014, 39, 1173–1184. [Google Scholar] [CrossRef]
  29. Tu, Z.; Chen, R. Carbon Emission regionalization and Emission reduction path in China—Cluster Analysis based on Multi-index Panel data. J. China Univ. Geosci. (Soc. Sci. Ed.) 2012, 12, 7–13. [Google Scholar]
Figure 1. Research framework.
Sustainability 13 09822 g001
Figure 2. Correlation of evaluation indicators.
Sustainability 13 09822 g002
Figure 3. Regionalization of carbon emissions in China.
Sustainability 13 09822 g003
Figure 4. Sensitivity analysis in different situations.
Sustainability 13 09822 g004
Table 1. Renewable energy performance evaluation index system based on carbon emission reduction.
DimensionCriteriaDescription
Energy
B1
Green energy utilization efficiency (B11)The proportion of renewable energy generation capacity to the total installed capacity.
Growth rate of green power (B12)Growth rate of renewable energy generation capacity.
Green energy reserve (B13)The amount of renewable energy that can be developed by technology.
Grid connection rate of renewable energy (B14)Renewable power is connected to the power grid to reflect the efficiency of energy utilization.
Economics
B2
Green investment allocation (B21)The ratio of green investment allocation of renewable energy; that is, the proportion of investment in renewable energy industry to GDP.
Power generation cost (B22)Operating expenses and maintenance costs.
Investment cost (B23)The cost of purchasing equipment, technology, etc.
Carbon emission cost (B24)The degree to which different renewable energy sources reduce the cost of carbon emissions.
Installed scale and investment quota of low-carbon equipment (B25)The grid connection of renewable energy will have a certain impact on the stability of the power grid, so coal power is still an indispensable power generation mode to support the effective operation of large power grids.
Technical
B3
Technology maturity (B31)The reliability and availability of the technology.
Energy processing and conversion efficiency (B32)The technical level and power generation efficiency of energy technology.
Environment and carbon
B4
Pollutant emission reduction (B41)Reduction in CO2, SO2, and NOx emissions.
Impact on ecosystem (B42)Ecosystem problems such as land occupation, sound pollution, and light pollution.
Carbon emission intensity (B43)Carbon dioxide emissions per kilowatt-hour of electricity generated by renewable energy.
Indirect carbon emission (B44)Carbon emissions in the whole life cycle of renewable energy.
Direct carbon emission reduction (B45)The installation of renewable energy directly alleviates carbon emissions, produces clean and renewable energy, allows large-scale replacement of traditional fossil energy, and produces thermal power to reduce carbon emissions.
Climatic condition (B46)The installation of renewable energy has greatly alleviated environmental pollution, improved climate conditions, and indirectly reduced carbon emissions.
Social
B5
Employment post (B51)The social effects and social welfare produced by the application of energy.
Green management (B52)Investment in environmental protection training and carbon emission management systems.
Environmental regulation (B53)The promoting effect of the application of renewable energy on local environmental regulation.
Table 2. Weights calculated by ANP.
DimensionWeightRankCriteriaWeightRank
Energy (B1)0.1653Green energy utilization efficiency (B11)0.0597
Growth rate of green power (B12)0.04011
Green energy reserve (B13)0.00820
Grid connection rate of renewable energy (B14)0.0588
Economics (B2)0.2782Green investment allocation (B21)0.0834
Power generation cost (B22)0.02816
Investment cost (B23)0.0439
Carbon emission cost (B24)0.0962
Installed scale and investment quota of low-carbon equipment (B25)0.02817
Technical (B3)0.1554Technology maturity (B31)0.0843
Energy processing and conversion efficiency (B32)0.0706
Environment and carbon (B4)0.2901Pollutant emission reduction (B41)0.0735
Impact on ecosystem (B42)0.03114
Carbon emission intensity (B43)0.02318
Indirect carbon emission (B44)0.02019
Direct carbon emission reduction (B45)0.1141
Climatic condition (B46)0.02915
Social (B5)0.1125Employment post (B51)0.04210
Green management (B52)0.03313
Environmental regulation (B53)0.03712
Table 3. Comprehensive weight ranking of ANP.
RankNameWeight
1Solar0.337
2Wind0.267
3Hydro0.191
4Geothermal0.104
5Biomass0.100
Table 4. Sorting results under different methods.
RankANPWSMTOPSISPROMETHEEELECTREVIKOR
1SolarSolarSolarSolarSolarSolar
2WindWindWindWindHydroWind
3HydroHydroHydroHydroWindHydro
4GeothermalGeothermalGeothermalBiomassGeothermalBiomass
5BiomassBiomassBiomassGeothermalBiomassGeothermal
Table 5. Subregional renewable energy priority.
Areas with Serious Carbon EmissionsAreas with Sub-Serious Carbon EmissionsHigh Carbon Intensity Area IHigh Carbon Intensity Area IISecond High Carbon Intensity Area ISecond High Carbon Intensity Area IISecond High Carbon Intensity Area IIISecond High Carbon Intensity Area IV
1WSMHydroSolarWindSolarWindSolarHydroHydro
TOPSISHydroSolarWindSolarWindSolarHydroHydro
PROMETHEESolarSolarWindSolarBioSolarHydroHydro
ELECTREHydroWindSolarSolarWindSolarHydroHydro
VIKORHydroWindWindSolarWindWindSolarHydro
2WSMBioWindSolarWindBioWindBioGoe
TOPSISGoeWindSolarHydroBioWindGoeGoe
PROMETHEEHydroWindSolarWindWindWindSolarSolar
ELECTREWindSolarWindWindBioWindWindWind
VIKORWindSolarSolarWindBioSolarHydroWind
3WSMGoeBioBioHydroGoeBioGoeWind
TOPSISBioHydroGoeWindGoeHydroBioWind
PROMETHEEBioBioGoeHydroGoeHydroBioBio
ELECTRESolarBioGoeHydroGoeBioSolarSolar
VIKORSolarHydroGoeHydroHydroHydroWindGoe
4WSMWindHydroHydroBioHydroHydroSolarSolar
TOPSISWindBioBioBioHydroBioWindSolar
PROMETHEEWindHydroBioGoeSolarBioWindWind
ELECTREGoeGoeBioBioSolarGoeBioGoe
VIKORBioBioBioBioSolarBioBioSolar
5WSMSolarGoeGoeGoeSolarGoeWindBio
TOPSISSolarGoeHydroGoeSolarGoeSolarBio
PROMETHEEGoeGoeHydroBioHydroGoeGoeGoe
ELECTREBioHydroHydroGoeHydroHydroGoeBio
VIKORGoeGoeHydroGoeGoeGoeGoeBio
Publisher’s Note: MDPI stays neutral with regard to jurisdictional claims in published maps and institutional affiliations.

