1. Introduction
Cycling is trending in research and in practice. The dynamically growing literature on cycling demonstrates how integral the establishment of safe and convenient cycling facilities is for increasing cycling levels [
1], besides socio-demographic/-economic/-psychological variables, land-use and external factors such as climate and topography [
2,
3]. Cycling infrastructures need to be seamless and perceived as safe as well as provide appropriate levels of objective safety, e.g., in terms of crashes or conflicts. Literature also consistently shows that cycling is associated with various positive effects on the efficiency and environmental performance of transport systems as well as on the health and well-being of individuals [
3].
Cyclist volumes are increasing in many cities and countries all over the world [
4,
5,
6]. Many stakeholders agree that cycling, along with other active modes such as walking, should be regarded as a vital feature of transport systems to create attractive, comfortable, safe and healthy communities. They are working hard to promote cycling as a mode of transport and to improve cycling conditions; ambitious goals are being established in strategic urban and transport planning—for example the Sustainable Urban Mobility Plans (SUMPs)—which target cycling either as a sole means of transport or in combination with walking and public transport. Examples for the latter are the cities of London and Vienna which aim for modal split proportions of 80 to 20 percent (walking/cycling/public transport vs. car) [
7,
8]. Lobby groups, such as national cycling associations or the European Cyclists’ Federation (ECF) have increased their activities and influence substantially in the last decades and are today stronger in terms of membership and political influence for cycling than ever before. In summary, there is a pressure on planners to pay particular attention to cycling, both from the demand side (as a result of increasing cycling volumes) and from the policy side (resulting from the positive image of cycling).
These developing and multifaceted incentives toward an increase in the use and awareness of cycling have led to a variety in cycling facilities between countries and cities, and also to a dynamic collection of guidance material for cycling provision [
9]. The aim of this study is to provide an in-depth international overview of this guidance material for cycling facilities and to develop on this basis recommendations for advancing provisions for cyclists. To our best knowledge, such a systematic overview is missing so far, only few and often non-scientific collations could be identified [
10,
11,
12,
13]. These are not very detailed and fragmented, and thus do not allow for systematic comparisons of standards for cycling facilities.
International guidance materials are therefore collated in this study, systemised and compared to each other and also with findings on infrastructure-based determinants of cycling safety from the scientific literature. The findings provide background information for researchers to better understand cycling behaviour and safety; they should support policy makers and planners in their efforts to support cycling and to advance and apply guidance material in a way that actually improves cycling conditions in terms of comfort, perceived and actual safety.
This paper focusses on the design of cycle facilities on sections in urban areas. It first describes the methodology used for researching the various materials including the development of a scheme for classifying cycling facilities in
Section 2. Results are presented in
Section 3 for the widths of cycling facilities and in
Section 4 for the criteria used for selecting specific types of cycling facilities in the different countries. The summarised information in
Section 5 and the comparison with the literature on determinants of cycling behaviour and safety in
Section 6 lead to recommendations in providing for cycling in future guidelines on urban street design in
Section 7. The paper ends with a summary in
Section 8.
2. Methodology and Classification of Cycling Infrastructure
The basis of this study is a comprehensive research of guidance material on urban street design in European countries with a focus on the partner countries and cities in the MORE project (Multi-Modal Optimisation of Road-Space in Europe,
https://www.roadspace.eu/ accessed on 13 July 2021). A questionnaire was sent to the MORE partner cities Budapest, Lisbon, London and Malmö and further technical partners (ECF, International Federation of Pedestrians (IFP), International Road Union (IRU), POLIS, PTV Group, International Association of Public Transport (UITP)) asking for material and information with relevance for urban street design in their city or from their specific perspective (technical partners). Partners were highly engaged in providing insights and references including their partial translation if necessary. Various feedback loops with discussions in teleconferences and personal meetings followed, gave background information and helped to better understand the material provided in local languages. As a result, the scope of this paper focuses on the MORE partner cities and countries. Material on other countries, for which there were no local partners in place, was added if information could be identified via desk research only. The guides published by the National Association of City Transportation Officials (NACTO) have been included as it is widely used [
14,
15,
16].
In summary, recommendations for cycling infrastructure from Budapest, Lisbon, London, Malmö, Germany and the Netherlands are included in this study. Recommendations are valid on national level for Budapest (Hungary), Germany and the Netherlands. Information given in Lisbon, London and Malmö is valid on the municipal level.
Researched guidance material on cycling is, in most cases, more recently updated than for other street user groups (e.g., for motorised traffic or pedestrians) and it is more often in the active process of being updated (e.g., in Budapest, Germany, London, Malmö). This shows the high dynamics in cycling provision that is currently ongoing in all the researched countries across Europe. In addition, heterogeneity in types and range of application of cycling infrastructures are much greater compared to other user groups. One possible reason for this might be the relatively recent developments and changes in this area as described above. Another reason might be that cycling is (besides the other micro modes such as scooters) the only transport mode that can share the same space with other street users in the carriageway or on the sidewalks or that can be accommodated in dedicated cycling facilities, again either in the carriageway or on the sidewalks.
Terminology and also types of cycling facilities differ greatly between the researched references. To compare standards and their range of application, a consistent classification of cycling infrastructures is developed for this study as shown in
Table 1.
The different types of cycling facilities are classified along their horizontal and vertical location relative to the carriageway and to the sidewalk: The horizontal location describes whether the cycling facility is on or off the carriageway, whereas the vertical location describes whether or not there is a difference in height between the carriageway/sidewalk and the cycling facility. In addition, information is given about whether or not the cycling facility can be used by other street users and whether or not (and how) it is separated from motorised traffic and pedestrians.
The degree of separation from pedestrians on off-carriageway cycling facilities on sidewalk level can differ. There might be a marking or a physical barrier (e.g., change in pavement or greenspace) separating cyclists and pedestrians or both might use the same space.
Mixed traffic does not require any provision for cyclists, but can be complemented by sharrows. Sharrows (also called pictograms) are defined in this context as non-contiguous lane markings and aim to make clear that cyclists are allowed and welcome in the carriageway. They also give direction about where to cycle in the carriageway, support cyclists in maintaining safe distances from parked cars and discourage overtaking by cars in narrow sections. Sharrows are mainly used where space is too narrow to provide a dedicated cycling facility [
17,
18] and should only be used if all conditions for mixing cyclists and motorised traffic on the carriageway are guaranteed (see
Section 4).
Bicycle streets are a cycle-friendly design option for mixed traffic and are frequently used in the Netherlands [
19]. These are residential streets with low link function for motorised traffic but with high link function for bicycle traffic. Bicycle traffic should be dominant in bicycle streets and should have higher volumes than car traffic. Bicycle streets might be also planned if current volumes of bicycles are lower than volumes of motorised traffic but an increase is expected or should be supported by providing a high-quality facility for cyclists. Service roads are small lower speed streets parallel to main streets with high speed or volumes of motorised traffic. Cyclists and local motorised traffic share the space in the service road. Cycling is often prohibited in the main street in these cases. Service roads often come in combination with sharrows or the dedication as a bicycle street.
Shared bus and cycle lanes where buses and cyclists are allowed to use the same lane and service roads are other design options in the category of mixed traffic.
Advisory cycle lanes are defined in the above
Table 1 as one type of cycling infrastructure but, technically, they are a sub-type of mixed traffic because the advisory cycle lane is not exclusively dedicated to cyclists. It might also be used by general traffic. In contrast, mandatory cycle lanes are on-carriageway facilities and exclusively dedicated to cyclists. They can be separated by a striped or solid line or even have light segregation to motorised traffic.
The greatest variety in design is found for cycle lanes and cycle tracks. The standard design option for cycle lanes is a dedicated lane for cyclists on carriageway level. Cycle tracks are usually on sidewalk level. Additionally, separated cycle lanes as well as stepped cycle tracks are recommended in the researched guidance material [
17,
18,
20]. Those cycling facilities provide higher comfort and safety for cyclists compared to mandatory cycle lanes. Transport for London [
20] recommends cycle lanes with either light or full segregation from motorised traffic. Light separation is designed with discontinuous pre-formed separators such as planters or flexible posts along the cycle lane and has buffer markings in some cases. Fully separated cycle lanes have a raised curb, separating strips, islands, grass verges or lines of planting which all create a continuous physical barrier between motorised traffic and cyclists. Stepped cycle tracks are located on an intermediate level between the carriageway and the sidewalk.
Cycle paths are always on sidewalk level as they are shared with pedestrians. Cycle ways are away from motorised traffic, e.g., in parks and may be dedicated to cyclists or shared with pedestrians.
3. Width of Cycling Infrastructure
Recommendations on the width of specific types of cycling infrastructure are based on assumptions or measurements for the space needed by individual cyclists, the number of cyclists that is supposed to use the infrastructure, the allowed movements (passing, meeting) and the adjacent infrastructures. The basis for determining the space for cycling facilities is in most cases the definition of the space requirements of a standard cyclist in combination with buffer zones. All these aspects were therefore included in the analysis of the guidance material.
Table 2 presents the space requirement of a standard cyclist and the recommended widths of buffer zones in the researched guidance material.
Table 3 gives an overview of the recommended widths of cycle facilities.
The space requirement of a standard cyclist is either 0.75 m (Lisbon, Malmö, the Netherlands) or 1.00 m (Budapest, London, Germany). The 1.00 m-value appears to already include a certain buffer zone, while the 0.75 m does not. For example, in Germany and Budapest
Table 3 shows that there is no buffer zone needed between two cyclists in contrast to most other countries.
In addition to the various possible types and locations of cycling infrastructures as introduced in
Section 2, there is also a wide variety of possible adjacent users and usages. Providing sufficient space between cyclists and these adjacent usages is of highest relevance for both the objective and perceived safety of cyclists. These buffer zones between two cyclists, or cyclists and other users describe the required space for safe overtaking or passing events. The recommended widths of the different buffer zones in the researched guidance material are presented in
Table 2.
Buffer zones between two cyclists range from 0.00 m to 0.50 m and are, together with the cyclist’ space requirements, highest in London with 2.50 m for two cyclists and a buffer zone in between.
Buffer zones for the general traffic are given as approximate values which are to be applied in all cases or are dependent on speed. These buffer zones vary between 0.00 m for on-carriageway cycling facilities in Germany and 2.50 m for streets with speed limits above 50 km/h in Lisbon. Having no buffer zones particularly between cycling facilities on the carriageway and motorised traffic might lead to low distances between cyclists and the car overtaking the cyclist with negative impacts on objective and perceived safety.
Buffer zones to static obstacles describe the space required to manoeuvre along high kerbstones or other objects and are recommended in most researched guidance material; their size differs with the type and height of these obstacles. The minimum as well as the maximum value is given in Lisbon with 0.20 m to obstacles of low height and up to 1.20 m to built elements. Medium buffer zones to static elements seem to be 0.25 m to 0.50 m.
Buffer zones to parking/loading facilities are recommended in order to avoid dooring crashes with cars opening their doors while being passed by a bicycle. These vary between 0.25 m and 1.00 m with medium values of around 0.75 m which are applied most frequently.
Space requirements for the different street users taken together with the buffer zones result in the recommendations for the width of cycling facilities. In general, dedicated cycling facilities need to fit to the space requirements of minimum one cyclist and buffer zones to adjacent traffic or objects and must ensure sufficient space to allow passing events (one-way) or meeting events (two-way).
Carriageway widths for bicycles in mixed traffic should be kept either low so as to cause cars to remain behind a bicycle when faced with oncoming traffic or kept wide so that cars can safely overtake cyclists even in the face of oncoming traffic. Intermediate carriageway widths that might lead to situations of doubt for car drivers on whether or not to overtake a bicycle should be avoided. This principle of either narrow or wide lanes (technically called profiles) for mixed traffic is recommended in references from London, the Netherlands and Germany. Transport for London [
20] recommends avoiding carriageway width of 6.40 m to 8.00 m (doubled lane width) and FGSV in Germany [
21,
22,
23] does not recommend values of around 6.00 m to 7.00 m. The differences in width result from different space requirements of standard cyclists, motorised vehicles and buffer zones. For example, and as mentioned above, in London the buffer zone between cyclists and general traffic is 0.50 m whilst there is no buffer zone in Germany (both countries consider 1.00 m as space requirement for one cyclist). CROW [
19] recommends a narrow profile of 4.80 m and a wide profile of 5.80 m, which both are narrower than the recommendations in Germany and London; Budapest only recommends the wide profile. Lisbon recommends different carriageway widths for cycling in mixed traffic depending on the height of the adjacent buildings. Narrow profiles only work with low volumes of motorised traffic; higher volumes cause irritation and might eventually result in risky overtaking manoeuvres.
A similar approach is used for shared bus and cycle lanes in London and Germany as described in
Table 3. London recommends the profile dependent on the number of buses or buses plus taxis per hour. In Germany, the width of bus/cycle lanes depends on the volume of cyclists. Budapest and Lisbon recommend general width of shared bus and cycle lanes.
The variety of recommended widths for dedicated cycling facilities is quite low in the researched guidance material. Widths range from 1.25 m to 2.25 m for one-way cycling facilities and are ≥2.00 m (London) or ≥2.50 m for two-way-facilities (Budapest, Lisbon, Malmö, The Netherlands, Germany).
Advisory cycle lanes are usually narrower than mandatory cycle lanes or cycle tracks/paths, because they are used if space is too narrow to provide a dedicated cycling facility, and in addition, cyclists are allowed to leave the advisory lane and to cycle in the carriageway, e.g., when overtaking other cyclists. Recommendations are given for the remaining carriageway width between two advisory cycle lanes because enough space has to be provided for motorised traffic to pass vehicles in meeting events.
Shared paths for cyclists and pedestrians are wider than dedicated cycling facilities because they have to accommodate the two user groups with substantial differences in their velocity.
4. Operational Criteria for Selecting Suitable Types of Cycling Infrastructure
Similarities were identified in recommended types and widths of cycling infrastructure in
Section 2 and
Section 3. However, the criteria for their application differ greatly; specific criteria and thresholds are provided to select the type of cycling infrastructure for each application with substantial differences particularly in the used thresholds. In what follows, the approaches of each city/country are presented individually. At the end of this Section,
Table 4 gives and overview of the selection criteria for all the researched guidance material.
Malmö only verbally explains the operational criteria for selecting suitable types of cycling infrastructure and gives the general recommendation for main streets to provide separated cycling infrastructure (cycle tracks/paths; usually two-way). Outside the main street network, cyclists cycle in mixed traffic. This distinction of main/lower level streets mainly refers to volumes of motorised traffic (max. 3000 vehicles/24 h), the speed of motorised traffic is not considered because speed limits in Malmö are generally low (max. 40 km/h).
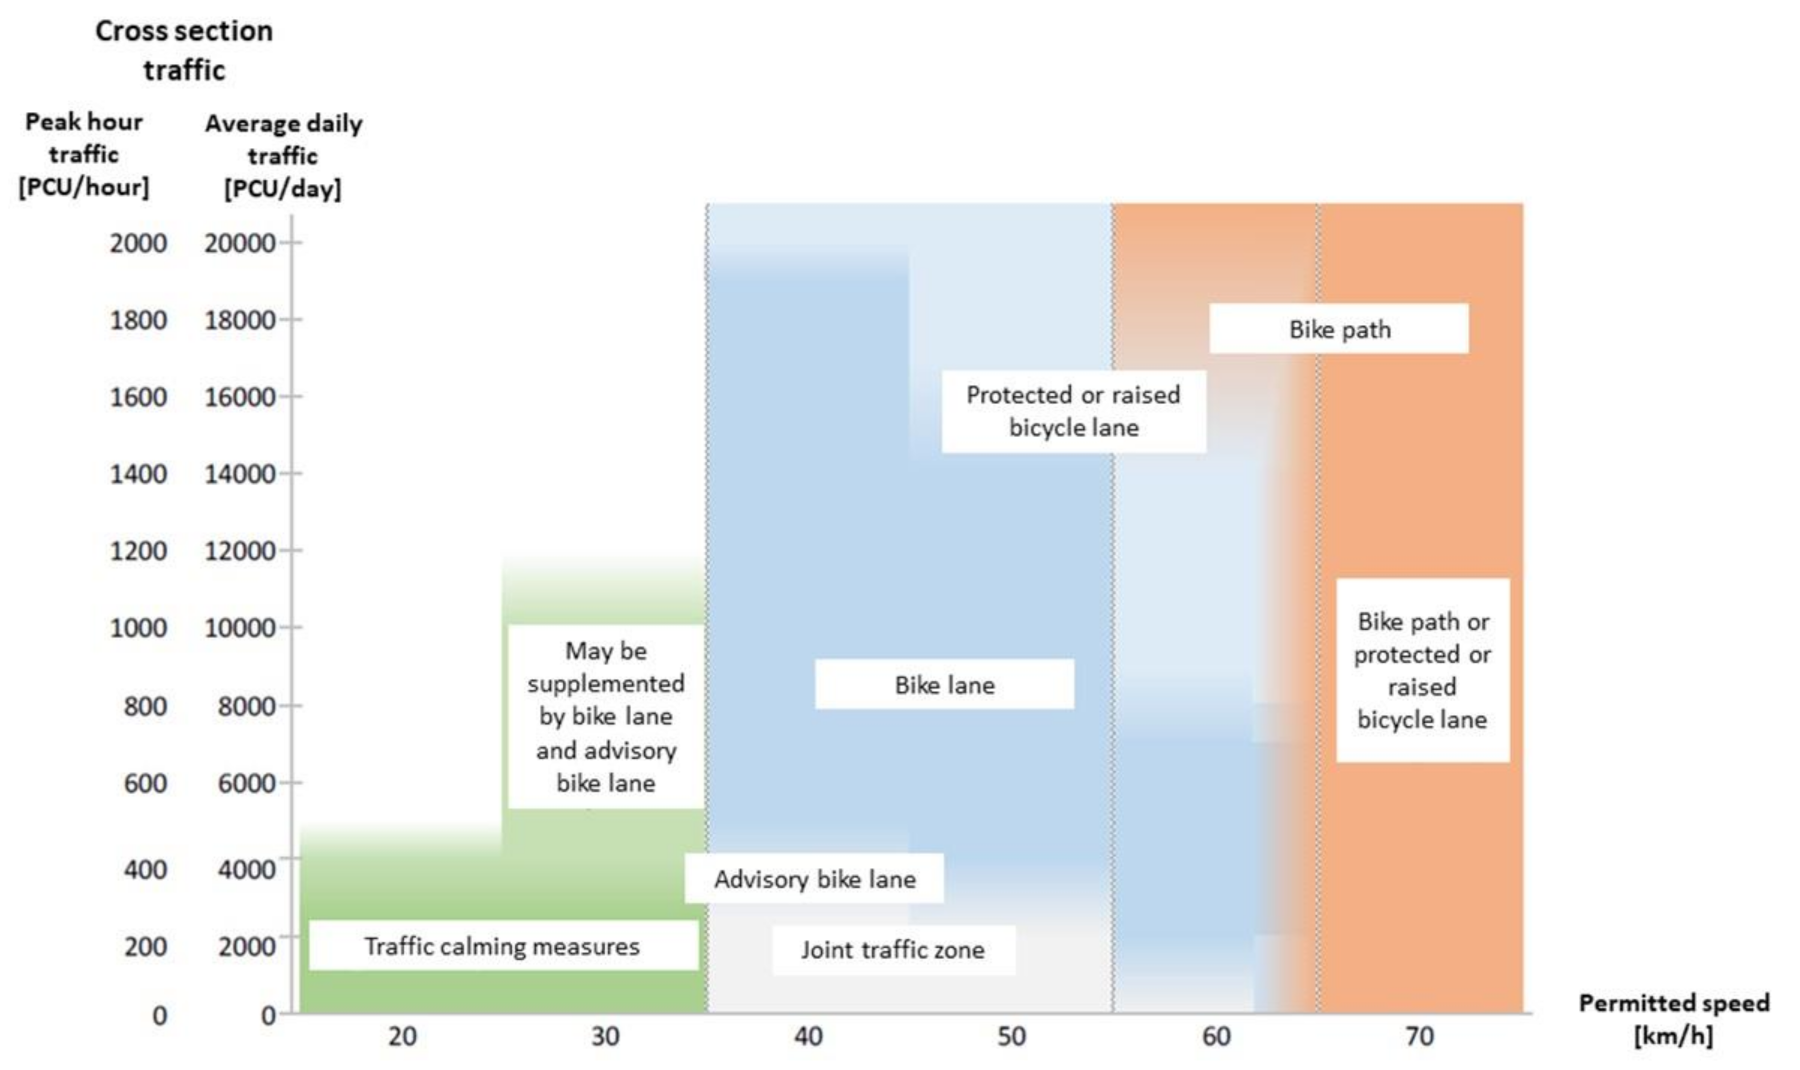
Volume and speed of motorised traffic are used as operational criteria for selecting a suitable provision for cyclists in all cities/countries using operational criteria. For example, Hungary and Germany use these two criteria and give recommendations for mixed traffic, advisory cycle lanes, mandatory cycle lanes and cycle lanes/tracks depending on volumes and speed of motorised traffic as shown below in
Figure 1;
Figure 2 show the approach for selecting cycle facilities in Hungary and Germany. The green box in
Figure 1 describes situations with low speeds (≤30 km/h) and low volumes (≤10,000 vehicles/day) of motorised traffic where cyclists are guided in mixed traffic. The white area (described as joint traffic zone) is a sub-type of mixed traffic and is recommended up to speeds of 50 km/h.
The blue section describes provisions for cyclists on the carriageway with speed limits between 40 km/h and 60 km/h. Mandatory cycle lanes are recommended with volumes <15,000 vehicles/day and speed limits of 50 km/h. With higher volumes, a vertical or horizontal segregation is recommended (protected or raised cycle lane).
Separation (orange section) is clearly required with speed limits of 70 km/h. The standard solution for separation is bike paths—protected or raised cycle lanes are possible with low or medium volumes and high speeds.
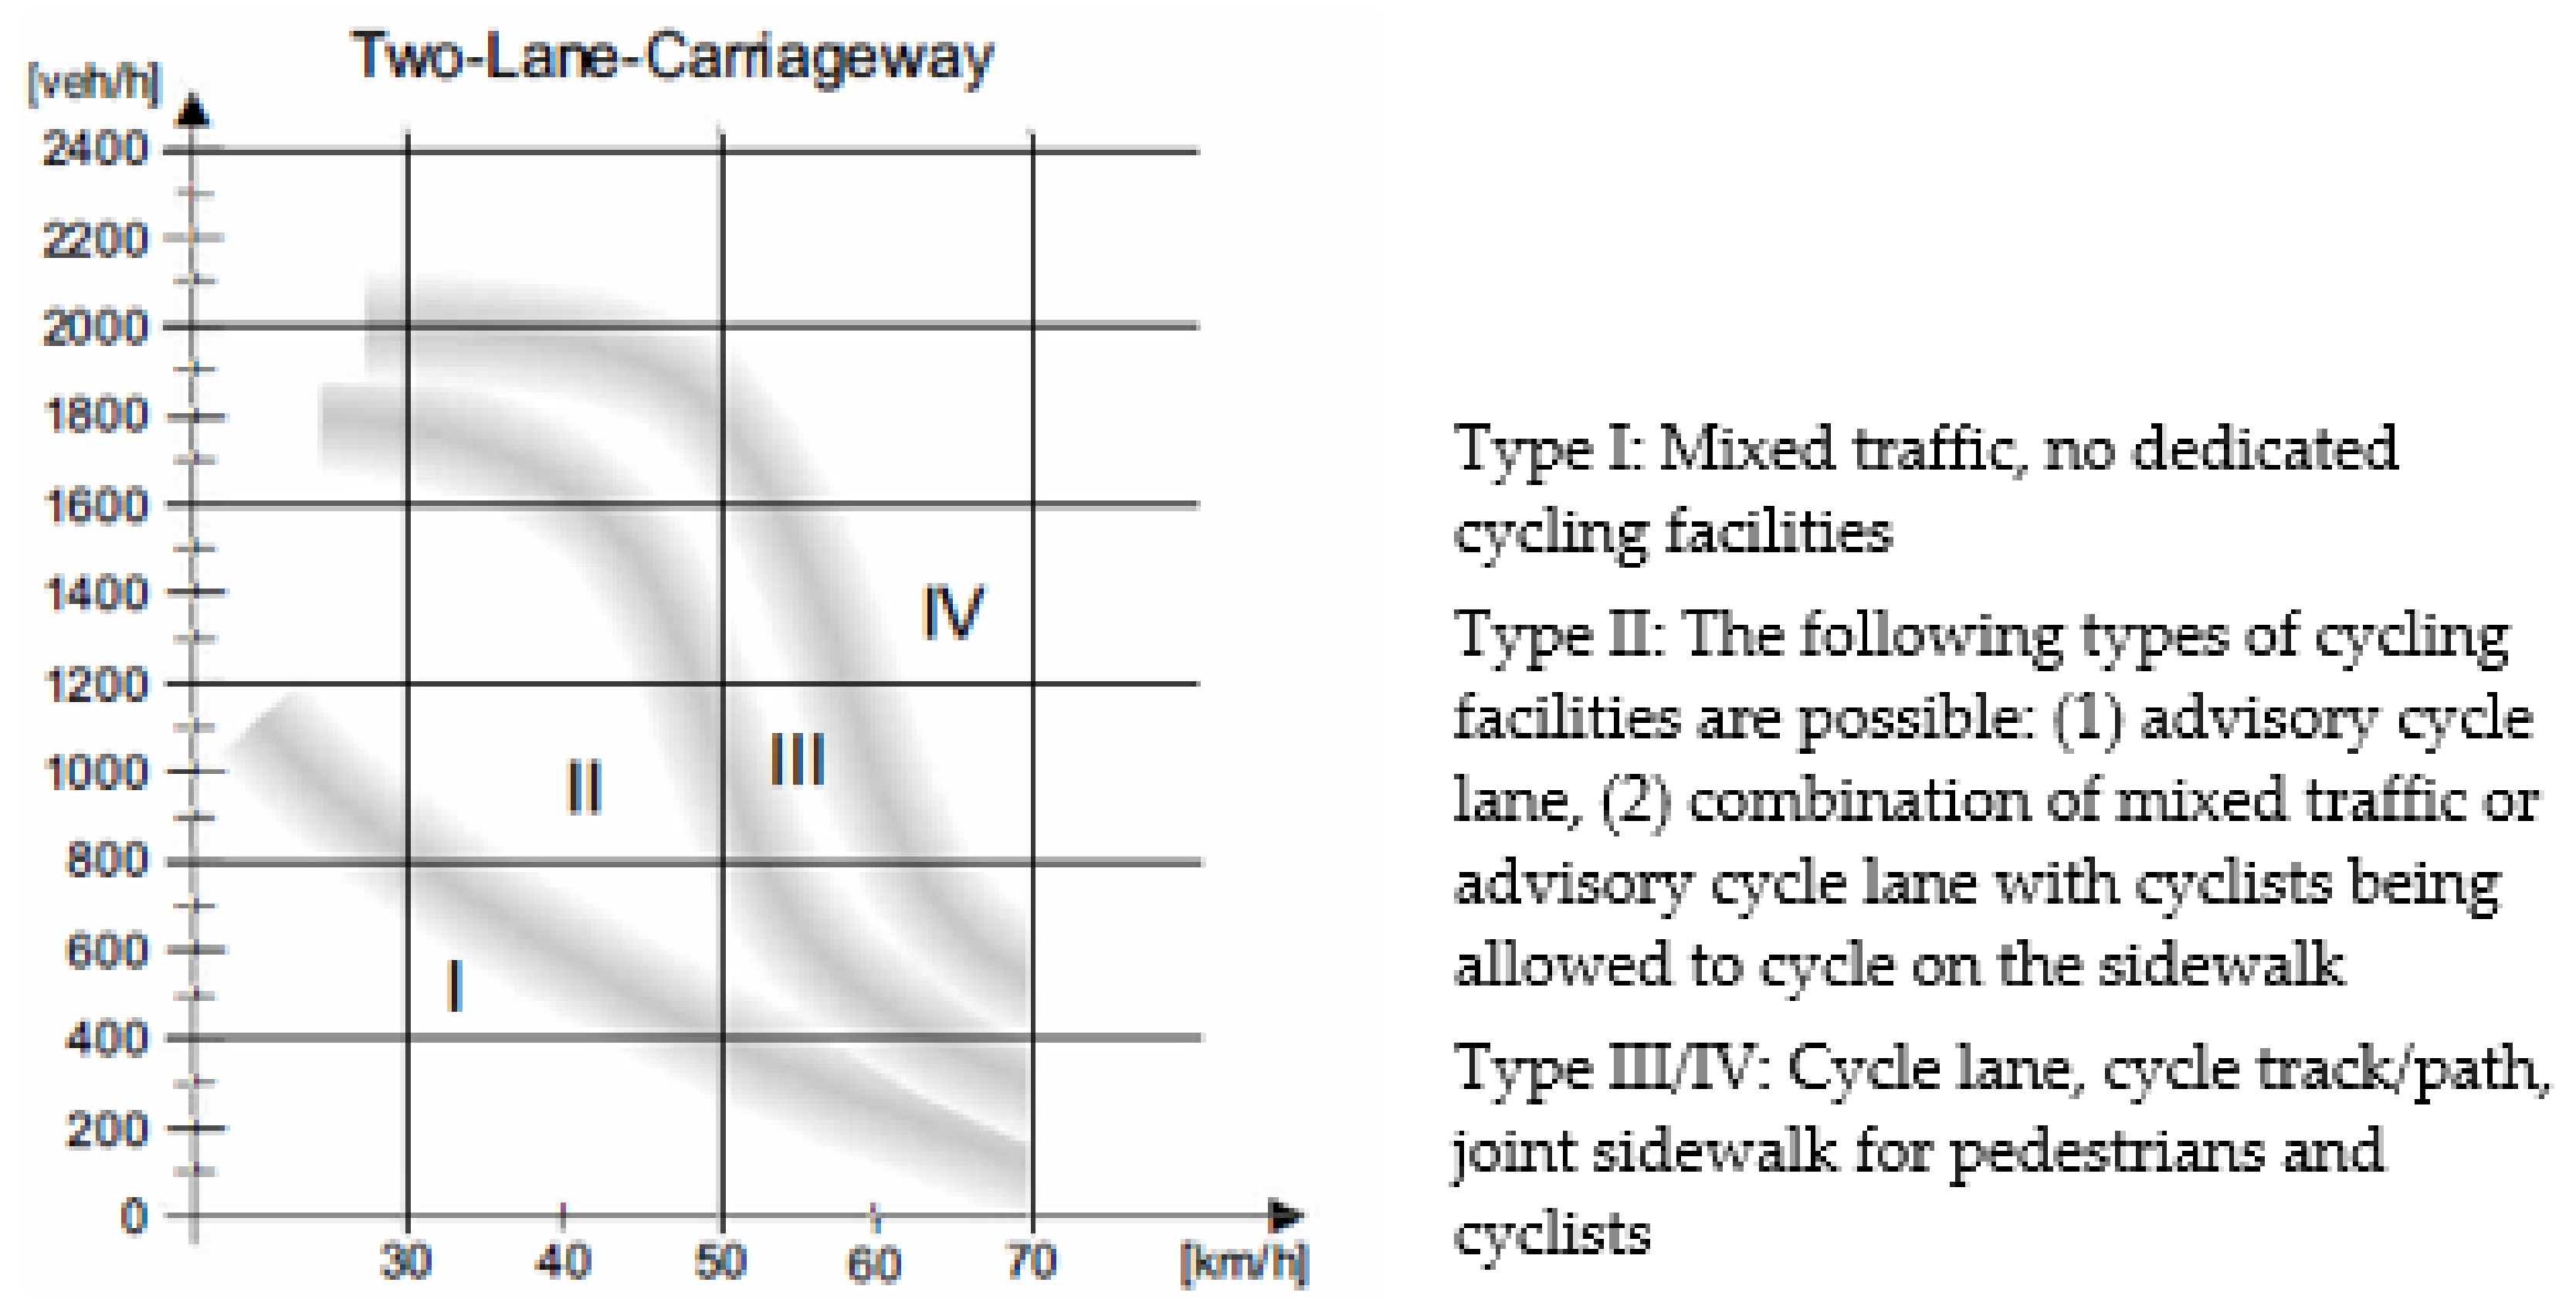
The German guidelines use a similar approach (see
Figure 2). Mixed traffic (denoted as Area I) is possible with a speed limit of 30 km/h and with maximum 8000 vehicles/24 h or with a speed limit of 50 km/h and with maximum 4000 vehicles/24 h without any additional measures.
Area II denotes the combinations of traffic volumes and speed that are suitable for advisory lanes or solutions where cyclists are allowed to cycle either on the carriageway or the sidewalk. These still shared cycling facilities are recommended up to 18,000 vehicles/24 h combined with speed limits of 30 km/h or 8000 vehicles/24 h combined with speed limits of 50 km/h. The allowed volumes of motorised traffic at specific speed limits are almost twice as high as the allowed volumes in Hungary.
A clear recommendation to physically separate cyclists from motorised traffic does not exist in Germany as both, cycle lanes and cycle tracks/paths, are recommended in Area III and Area IV.
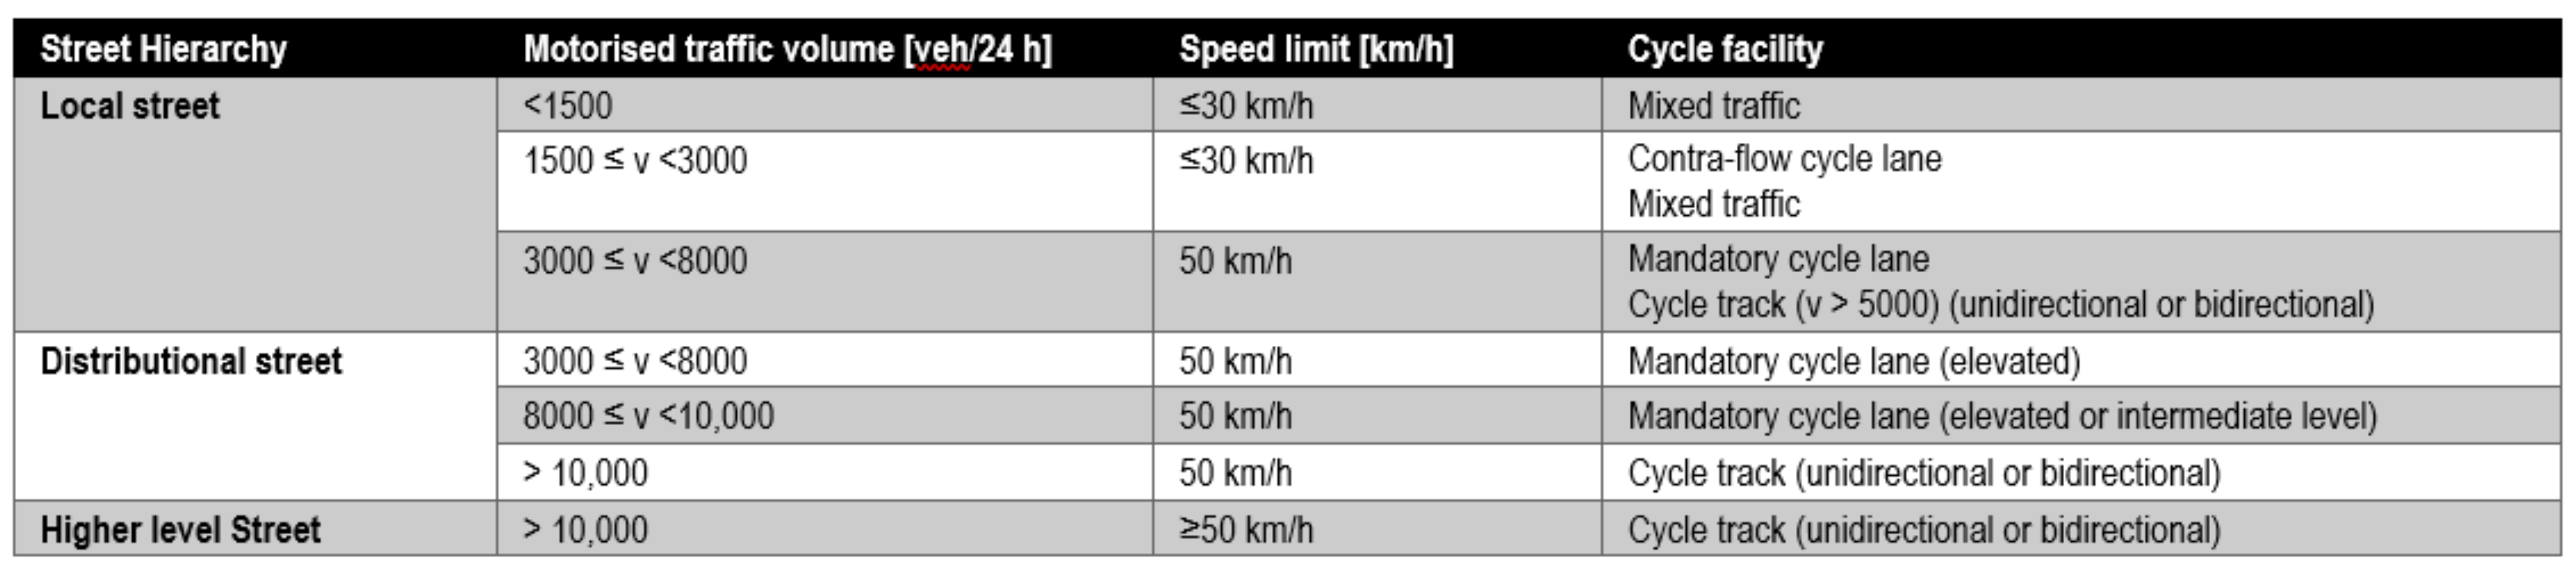
The Lisbon guidelines also consider volumes and speed limits of motorised traffic but add the street category as third criterion as shown in
Figure 3. Lisbon gives the strictest recommendation on guiding cyclists in mixed traffic with maximum speed limits of 30 km/h and volumes up to 3000 vehicles/24 h on local streets. Alternatively, contra-flow cycle lanes in one-way streets may be implemented. Mandatory cycle lanes are recommended on local streets with 50 km/h speed limit. If the volumes exceed 5000 vehicles/24 h, cycle tracks are required.
On distributional streets, elevated lanes (optionally on intermediate level between carriageway and sidewalk) are recommended with speed limits of 50 km/h and volumes up to 10,000 vehicles/24 h. Higher volumes require the implementation of cycle tracks.
At higher level streets (with speed limits ≥50 km/h), cycle tracks are generally recommended.
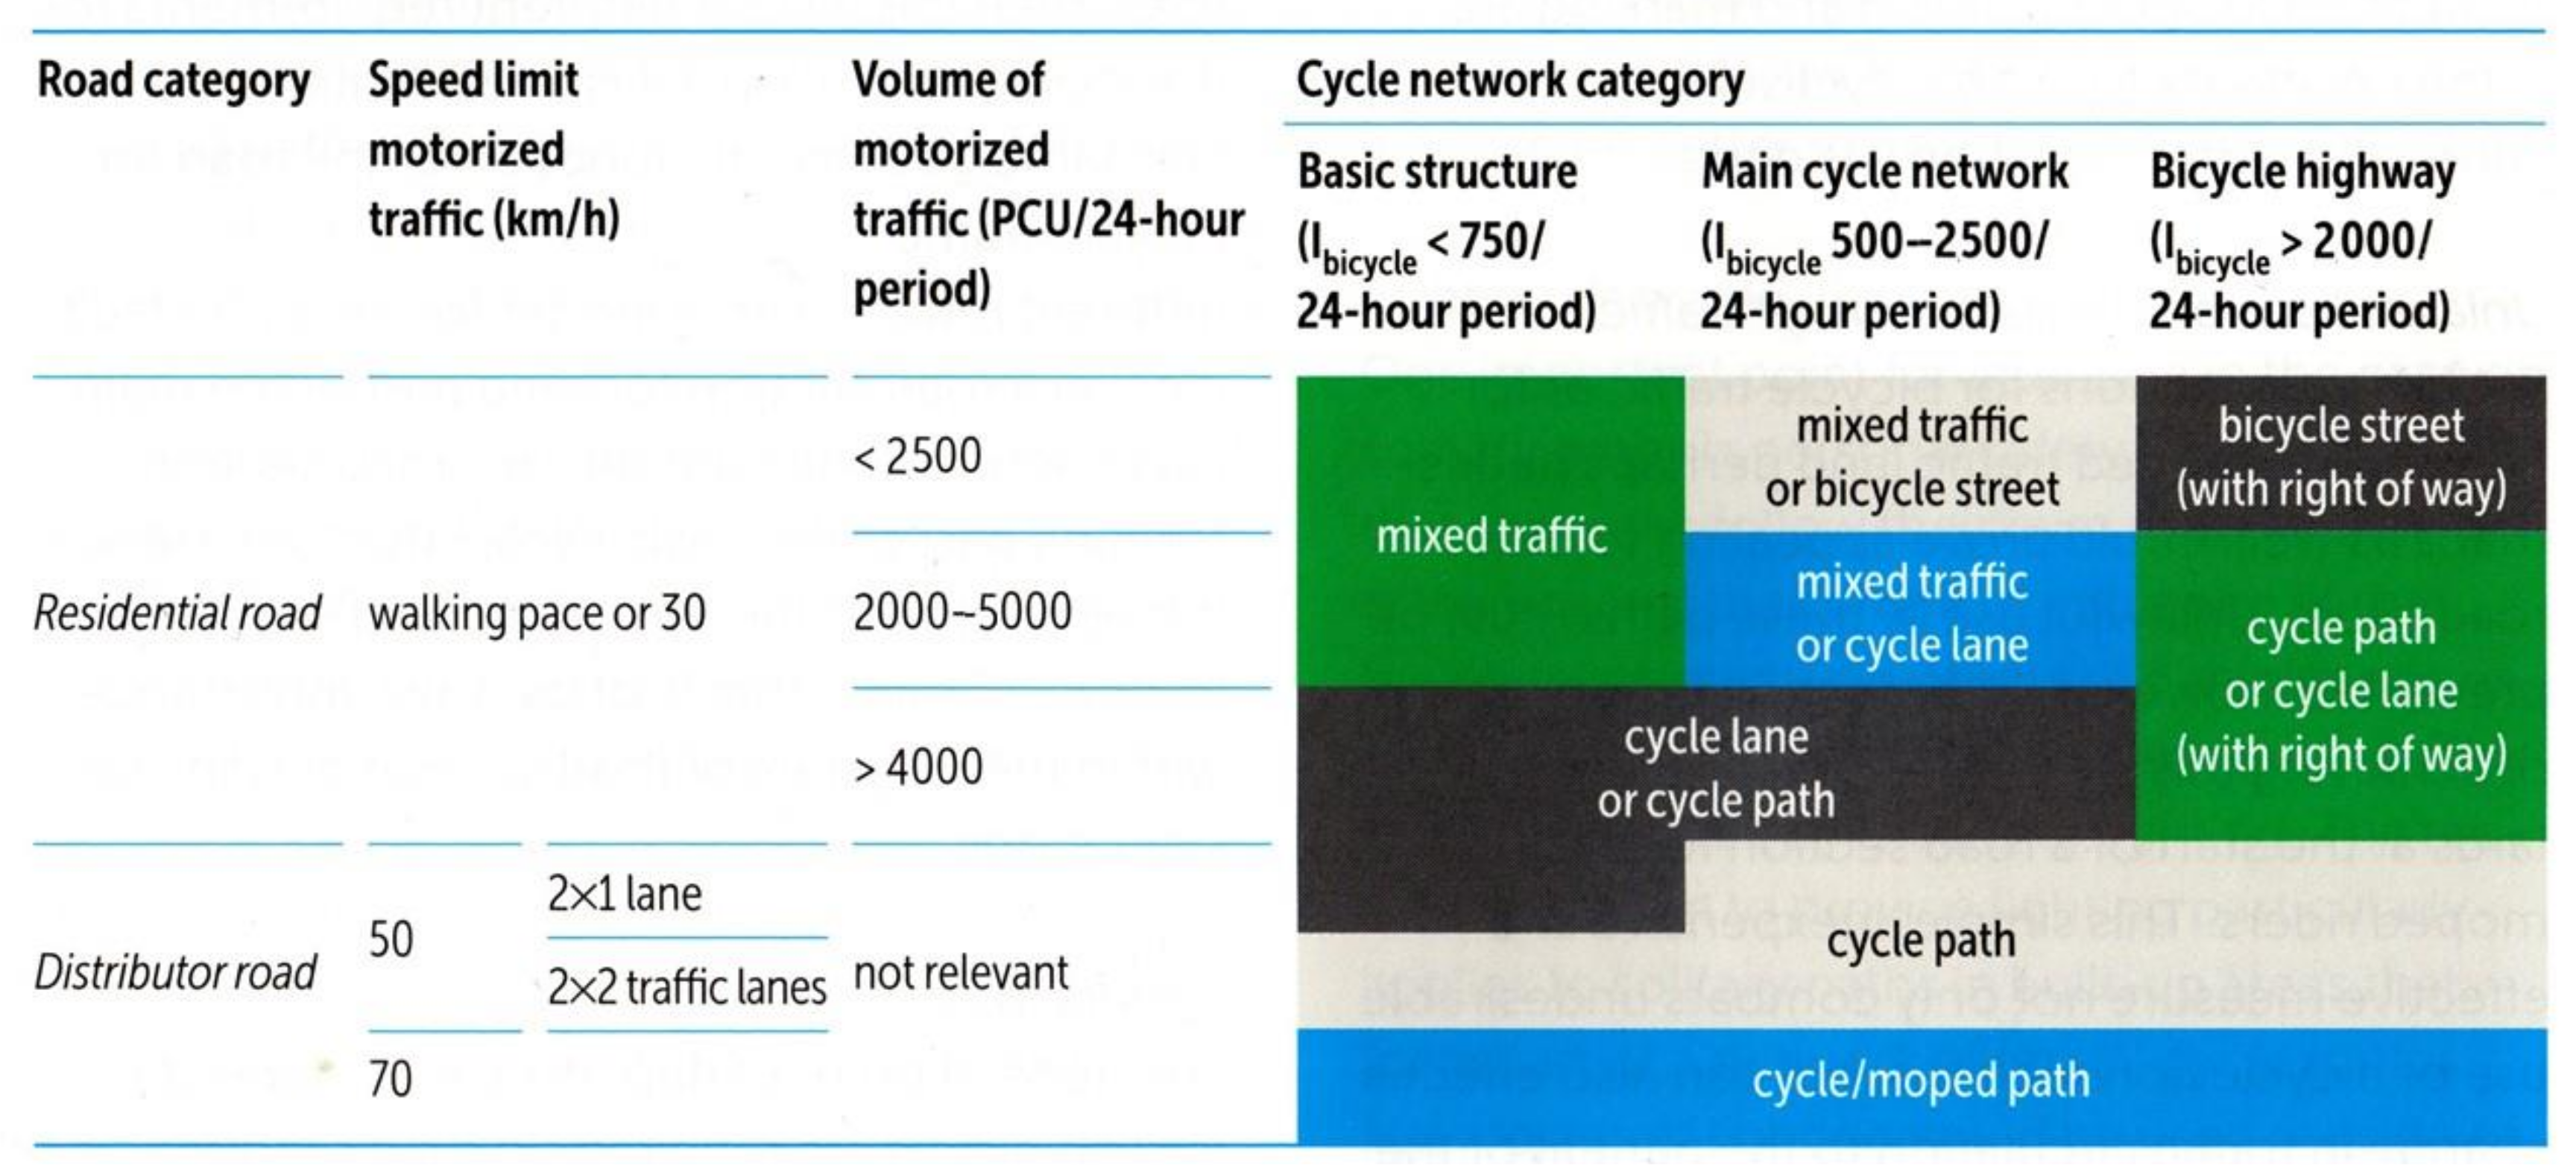
CROW [
19] recommends cycling facilities according to the volume and speed of motorised traffic, the road category and the cycle network category which represents the volumes of cyclists (see
Figure 4). Recommendations for mixed traffic in the Netherlands are with maximum 30 km/h and 5000 vehicles/24 h almost as strict as in Lisbon. With high volumes of cyclists (>2000 cyclists/24 h) and low volumes of motorised traffic, a cycle street is preferred over standard mixed traffic solutions to emphasise the dominance of cyclists. Cycle paths as separated facilities are recommended for speed limits of 50 km/h onwards (independent of volumes of motorised traffic) or with lower speed limits and high volumes of motorised traffic or high volumes of cyclists.
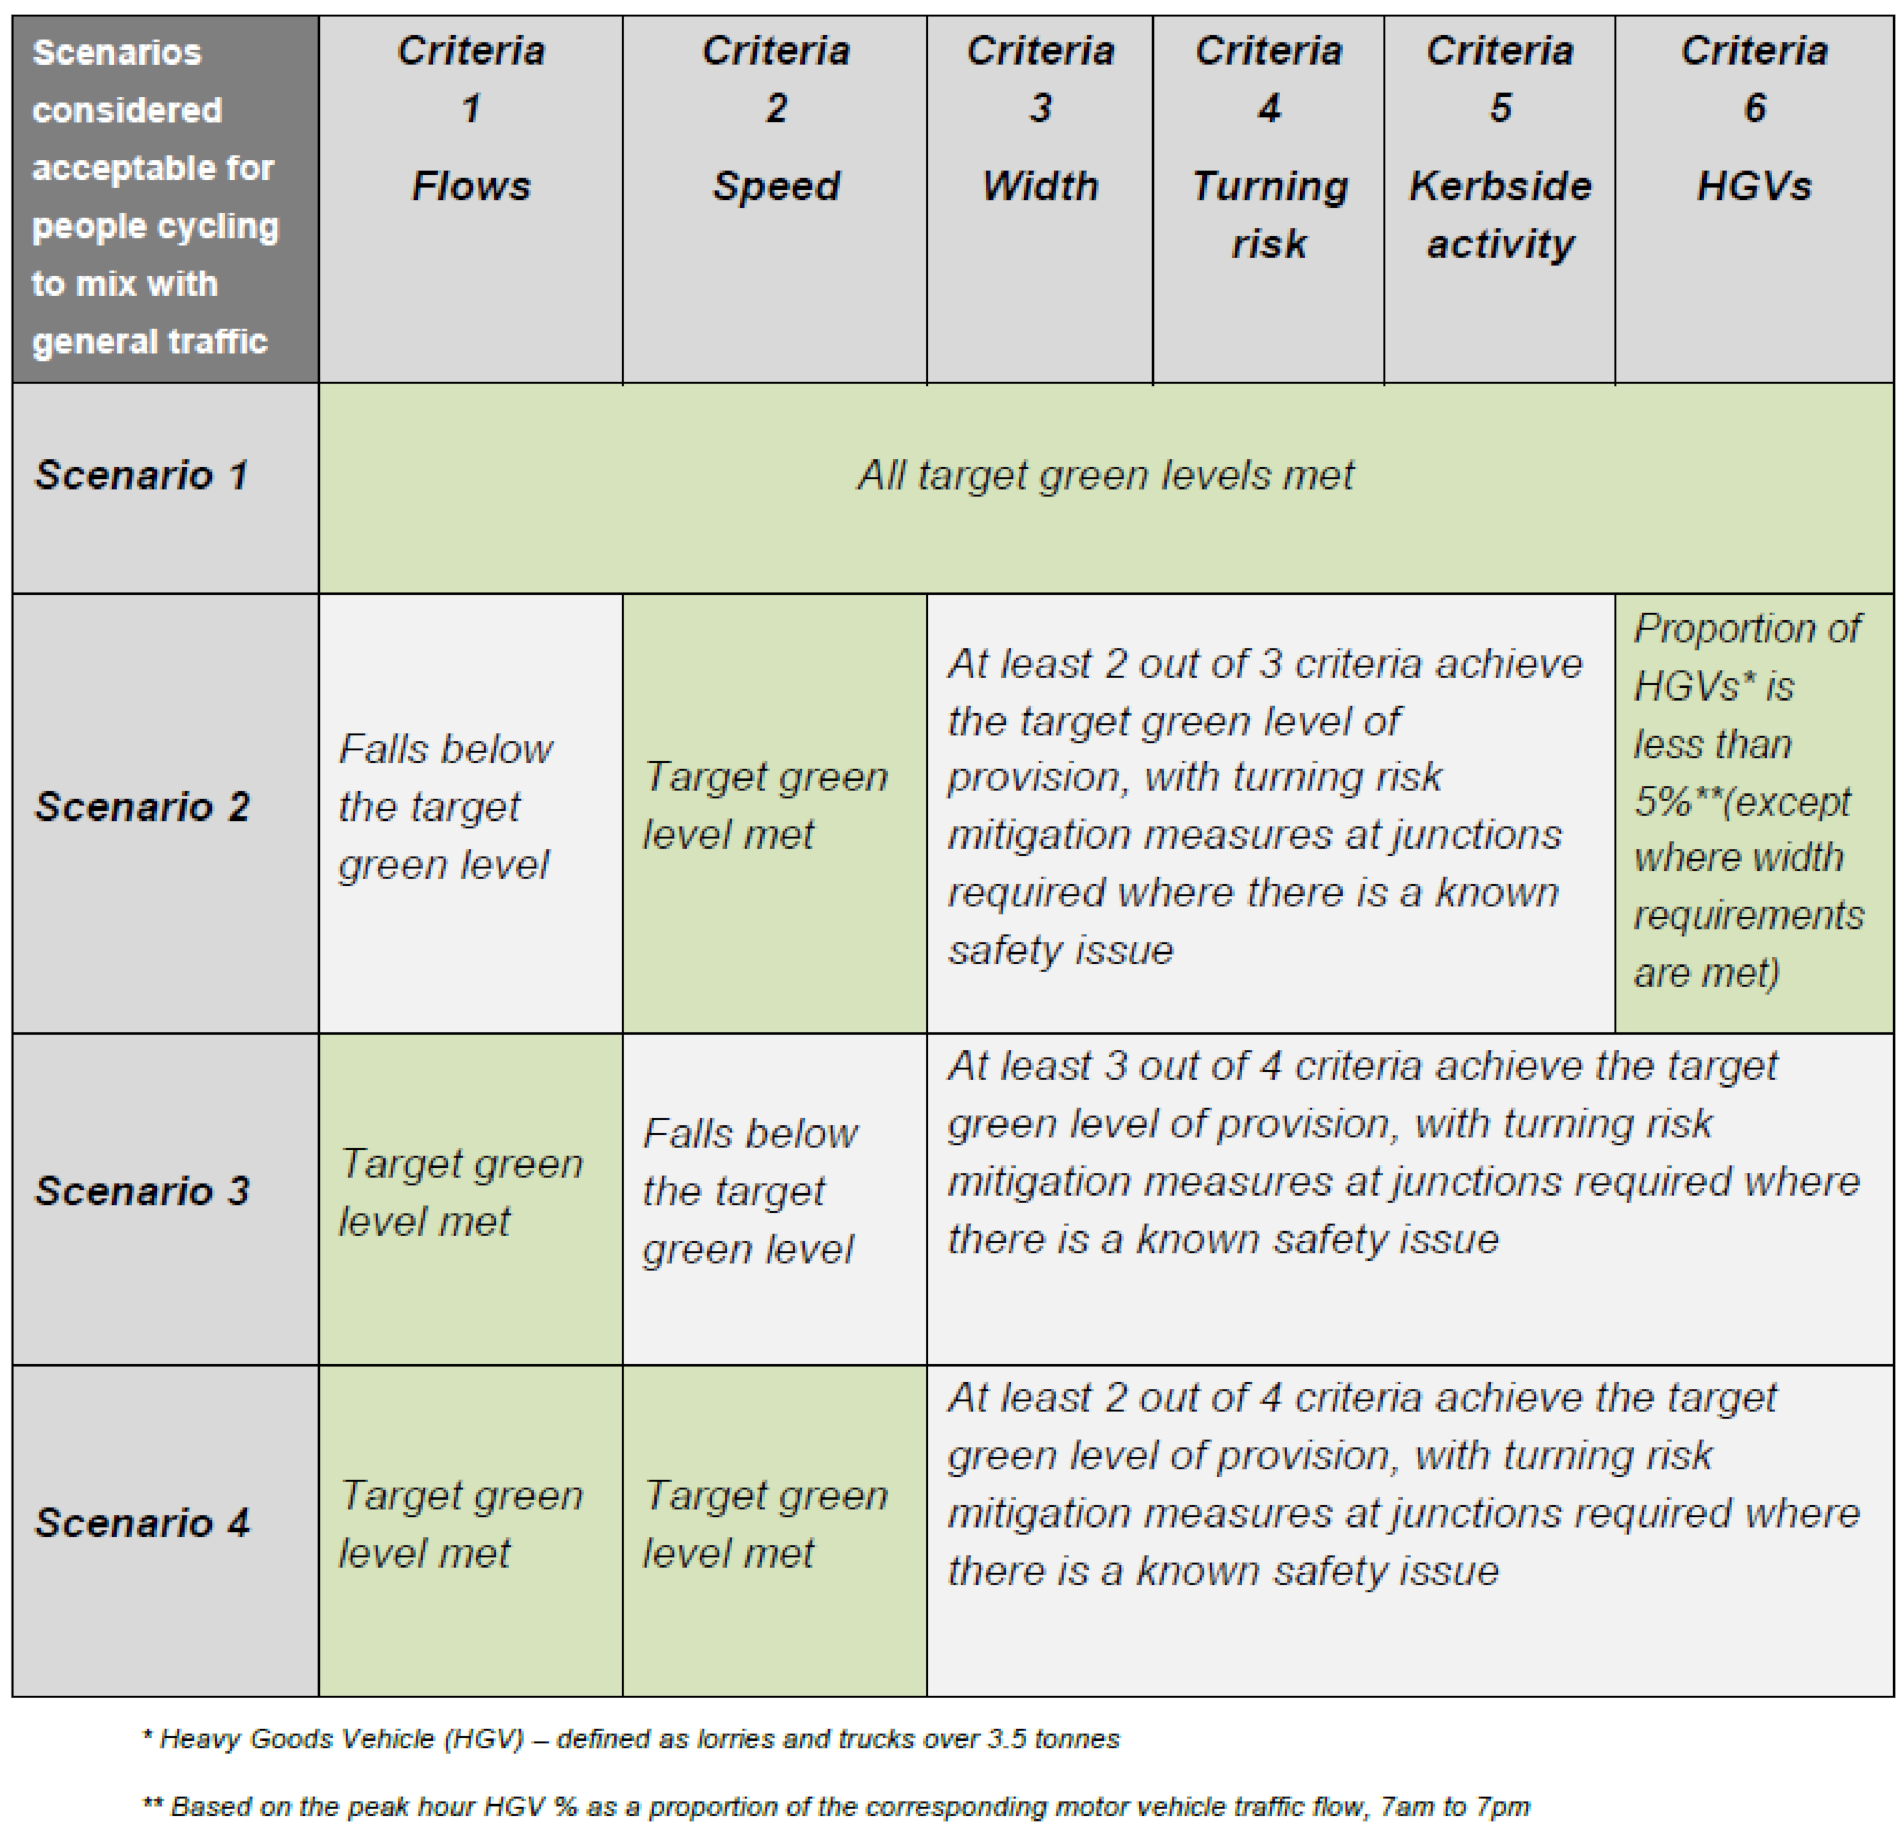
Transport for London (TfL) developed recently a new approach to decide whether or not cyclists can be mixed with motorised traffic [
24]. TfL defines target green levels and minimal requirements for six criteria and a scheme to decide which level has to be met for each of these criteria in different combinations, these are summarised in 4 scenarios.
Target green levels are defined as:
Volume of motorised traffic: 5000 veh/24 h
85th percentile speed of motorised traffic: 25 mph (40 km/h)
Width of traffic lanes: ≤3.20 m with 85th percentile speeds ≤ 40 km/h and the proportion of Heavy Goods Vehicles (HGV) ≤ 5%; ≥4.50 m otherwise
Minimisation of collision risk at junctions: infrastructure measures at all priority junctions’ volume of motorised traffic ≥ 2000 veh/24 h
Minimisation of the impact of kerbside activities and
Proportion of HGV (≤5% with volume of motorised traffic ≤ 5000 veh/24 h; ≤10% with volume of motorised traffic ≤ 2000 veh/24 h)
The scheme in
Figure 5 illustrates scenarios that are suitable for guiding cyclists in mixed traffic. Scenario 1 is the preferred one when all target green levels are met. Higher volumes of motorised traffic or higher speed can both be compensated by defined combinations of criteria for which the target green levels have to be met as the minimum. In Scenario 2, too high volumes of motorised traffic are compensated by sufficiently low speed and proportions of HGV combined with at least two out of three of the remaining criteria meeting target green levels. Scenario 3 describes how too high speed can be compensated. When volumes and speed of motorised traffic meet target green levels, two out of four of the other criteria have to meet the target green level. Safety at junction has to be ensured in in all cases (turning risk): Measures for mitigating turning risks are required if safety issues exist.
Table 4 summarises the identified operational criteria and target values for deciding on suitable types of cycling facilities in the form of a table the crosses the two criteria that are consistently applied in all references, this is volumes and speed of motorised traffic. Volume of cyclists is also included in the table as this is a speed limit concerned criterion (even though is just applies in the Netherlands). Further criteria are only used in some of the references and are not included in the table; these are explained in the descriptions and figures above. NACTO [
15] does only give one operational criterion on the suitability of mixed traffic solutions, this is maximum 3000 vehicles/24 h and 30 km/h and is therefore not included in the table.
5. Summary of Practices in Providing for Cyclists
The researched material shows a high variety in cycling facilities and criteria for their operation. Infrastructure for cyclists ranges from integrated solutions with cyclists in mixed traffic or on cycle streets to fully separated cycling facilities off the carriageway, e.g., on cycle paths. Overall, more than 10 variations of infrastructure for cyclists were identified within the seven countries/cities.
As mixed traffic and cycle tracks/paths are defined in all cities and mandatory cycle lanes are recommended in all guidance material besides Malmö, these three provisions can be summarised as standard cycling infrastructure types within the researched countries and cities. Within these types the application of mixed traffic is typically used for streets with low volumes and speed of motorised traffic, cycle lanes and tracks/paths are more likely on streets with higher volumes and speed of motorised traffic.
Recommendations for accommodating cyclists in mixed traffic together with motorised vehicles in the carriageway are the most stringent in the Netherlands and Lisbon who only allow mixed traffic with speed limits below 30 km/h [
18,
19]. In Budapest and Germany, mixed traffic (including advisory cycle lanes) is possible up to speed limits of 50 km/h [
17] or 70 km/h [
23].
Bicycle streets are a special type of mixed traffic and recommended in the Netherlands for streets with high cycling volumes to emphasise the dominance of cyclists [
19]. Carriageways with cyclists riding in mixed traffic should either be narrow so as to force cars to remain behind a bicycle when faced with oncoming traffic, or kept wide so that cars can safely overtake cyclists even in the face of oncoming traffic.
Dedicated cycling facilities are recommended for high volumes of motorised traffic and high speed limits. Cycle tracks/paths and cycle lanes bring vertical and/or horizontal separation. Budapest and Lisbon recommend mandatory cycle lanes with intermediate volumes/speed of motorised traffic and cycle tracks/paths with higher volumes/speed of motorised traffic [
17,
18]. The Netherlands and Malmö generally recommend off-carriageway cycle tracks/paths for main streets [
19,
21]. The German recommendations equally recommend cycle lanes and cycle tracks/paths for streets with high volumes of motorised traffic and speed limits [
23].
The recommended widths for dedicated cycling facilities range from 1.25 m to 2.25 m for one-way cycling facilities and are ≥2.00 m for two-way-facilities. It tends to be higher in countries with a well-established cycling culture such as the Netherlands and Sweden compared to starter countries such as Lisbon/Portugal.
6. Comparison of Guidance on Cycling Facilities with Literature on Determinants of Cyclist Safety and Comfort
The assessment of this diversity in recommendations for types of cycling infrastructures and criteria for their selection against the relevant criteria of (objective and perceived) safety and comfort proves to be difficult for at least two reasons: (1) The cause-effect chain from the characteristics of cycling facilities in individual street sections to travel behaviour and cycling choices is complex. Decisions about travel behaviour are shaped by various influences and the characteristics of single street sections is only one of them (see, e.g., [
24] for the relevance of seamless cycling networks and safe intersections for successfully providing for cyclists). (2) The literature on the influence of the type of cycling infrastructure at street sections on safety is fragmented and hardly allows to draw general conclusions.
Mueller et al. [
1] demonstrate the relationship between the length of cycling facilities in a city and the modal share of cycling without any consideration of the type of cycling facilities. Le et al. [
25] report similar findings and Buehler and Pucher [
26] find comparably high influences of cycle lanes and cycle paths on bicycle commuting in American cities. The TEMS tool (
http://tems.epomm.eu/ accessed on 13 July 2021) shows that cycling shares are highest in Dutch and Swedish cities—two countries that favour separating cyclists from motorised traffic. At the same time, the TEMS tool shows substantial differences in modal shares of cycling within countries even when these have guidelines that are valid at national level such as Germany or Hungary.
Literature on infrastructural determinants of cycling safety consistently shows that higher speed (allowed or driven) leads to higher severity of crashes and in some studies also to higher crash numbers [
27,
28,
29,
30] and presence of parking increases crash risk [
30,
31,
32].
Crash numbers are higher for streets with cycling facilities [
33]. The main reason for this is higher car and cycle traffic volumes and speed in such streets. Differences in crash risks per car volumes are less consistent in the researched references. Lusk et al. ([
34] see also [
35]) find higher risks for on-carriageway cycling facilities compared to cycle tracks. Teschke et al. [
31] find higher risks for sections without any cycling facility compared to sections with cycle lanes. Harris et al. [
29] find lower risks for sections with cycle tracks compared to advisory lanes and mixed traffic. Canadian studies find higher risks for cycle tracks compared to cycle lanes [
36,
37].
The literature review on perceived safety supplements the findings of the risk analysis. User surveys show that perceived safety is very low when cyclists are guided in mixed traffic [
38,
39,
40,
41]. The safety perception is even lower with high speed limits [
38,
41], the presence of parking [
38,
39,
40], high volumes of motorists or a high proportion of heavy vehicles or presence of buses [
38,
41].
On streets with cycling infrastructure, users generally prefer facilities off-carriageway over on carriageway facilities [
38,
39,
41]. However, well-designed and protected cycle lanes (with coloured surface, buffer elements and sufficient width) can achieve a similarly high level of perceived safety as cycle tracks [
38]. In a mental mapping study in Ireland, separation of cyclists was found to have the greatest impact on perceived safety (compared to motorists’ volumes, width of infrastructure, number of junctions and parking) [
42].
Some general conclusions can be drawn besides the fragmented character of the literature. Slow speed increases safety and also the willingness of people to cycle in the streets. Study design, specific location and infrastructure design matter when comparing the safety of on- and off-carriageway facilities. Cycling facilities are safer and perceived safer than no cycling facilities and there is the tendency of better safety for separated cycling facilities compared to unprotected on-carriageway facilities such as cycle lanes. The number of cars and also cyclists consistently matters [
43]. Higher car volumes increase crash risk for cyclists, the safety-in-numbers effect leads to relatively lower risks for cyclists with increasing cycling volumes.
7. Recommendations on Providing for Cyclists in Future Guidelines on Urban Street Design
Based on the insights gained from summarising the various guidance materials on cycling provision, the following recommendations were developed:
Keep it simple: “Starter countries” in terms of cycling tend to offer many more types of cycling facilities in their guidance materials than countries with a longer history in cycling provision. A variety of solutions might be necessary in starter countries because the optimal solutions might not have enough political support (e.g., would require taking too much space from cars). This is a critical point because (potential) cyclists are not familiar with participating in traffic as cyclists nor are car drivers and other street users used to cycling infrastructure or expect cyclists in the streets. With this in mind, the first recommendation is to keep cycling provision simple, wherever possible. The three basic options for accommodating cyclists in the streets are a solid basis and, in most cases, sufficient; these are (1) mixed traffic, (2) on-carriageway mandatory cycle lanes and (3) off-carriageway cycle tracks/paths. Too many types of cycling infrastructure might cause confusion for users. Even though there are many different types of cycling infrastructure available, this disadvantage might outweigh the advantage of having the opportunity to provide tailor-made solutions for each design task.
Mixed traffic or dedicated cycling facilities: The decision between accommodating cyclists in mixed traffic with motorised vehicles on the one hand and dedicated cycling facilities on the other is of special importance. Speed of motorised cars of maximum 30 km/h and low volumes of motorised vehicles appear to be the two key deciding factors. Dedicated cycling facilities should be provided if either of these two is exceeded. Bicycle volumes should also be considered if these reach relevant levels. Lane widths (profiles) for cycling in mixed traffic should be either narrow or wide in order to clearly indicate whether or not the overtaking of bicycles is safely possible for cars. Narrow lane widths seem to be more suitable as these support low speed for all street users. Bicycles should be prioritised over motorised traffic, particularly if their current or expected number exceeds car volumes, e.g., by providing bicycle streets.
Dedicated cycling facilities on or off the carriageway: Once the decision for a dedicated cycling facility has been made, these might be placed on the carriageway as cycle lanes or off the carriageway as cycle tracks/paths. Both of these options have pros and cons which can be evaluated on a case-by-case basis or addressed in a general manner as is carried out in Malmö and the Netherlands for off-carriageway cycle tracks/paths. Both options are good choices for objectively safe and convenient cycling networks if these are sufficiently wide and well designed. Cyclists feel safer on off-carriageway or at least protected facilities and although the scientific literature does not indicate a clear risk reduction for cycle tracks, elevated or protected design solutions are recommended when traffic volumes or speed limits are high. Solutions for street sections always need to fit with the solutions at the adjacent junctions as these are very important for cyclists’ safety and comfort.
Mixing pedestrians and cyclists: This is a popular solution for limited space and high volumes (and speed) of motorised traffic but might lead to conflicts between pedestrian movement and place activities and cyclists. Dedicated and separated facilities for cyclists and pedestrians should therefore be implemented whenever possible, even if that requires taking space from motorised traffic.
Width of cycle lanes and tracks/paths: With high cycle volumes, it is desirable to offer a width of minimum 2.00 m in one direction to allow passing events without leaving the cycle lane/track. Narrower facilities should only be provided where a low number of cyclists is expected (e.g., due to alternative attractive routes in the network). Wide facilities might demand physical separation to discourage other road users from driving or parking within the cycle infrastructure. Buffer zones to adjacent usages particularly for parking are paramount for safe cycling.
Future needs: In general, cycling infrastructure should cover current and future needs. Due to an increasing number of cargo bicycles (higher space requirements) and electric bicycles (higher speeds) and the fast developments in Personal Light Electric Vehicles (PLEV), cycling infrastructure should provide enough space for non-standard and standard users. One such example would be the provision of lane widths which make is easy for faster cyclists to pass slower cyclists even though the slower bike has extended dimensions. Cycle Highways are another example as a new trend in cycling practice in planning [
44].
8. Summary and Conclusions
This study provides a comprehensive international overview of guidance material for cycling facilities. It shows similarities and differences in the practice of cycling provision. Some general trends could be identified. “Cycling countries” such as the Netherlands and Malmö/Sweden use fewer types of cycling facilities, are strict in mixing cyclists and motorised traffic only in streets with low speed and volumes of motorised traffic and recommend greater widths for dedicated cycling facilities. At the same time, also substantial differences emerged. For example, Germany treats mandatory cycle lanes in the carriageway equally in terms of operational criteria as separated cycle tracks/paths. Malmö uses mainly two-way cycle tracks/paths on their main roads, these cycling facilities should be avoided following the recommendations in German guidelines for cycling facilities. More empirical evidence on the effects of the different types of cycling facilities would help to advance guidance material towards safe and comfortable solutions in each specific case study. These investigations should include both street sections and junctions as the latter are even more decisive for cyclists’ safety compared to street sections.


 ,
, 


 ([16], ch. 4, p. 43)


