Article

Sportive Fashion Trend Reports: A Hybrid Style Analysis Based on Deep Learning Techniques

1
Department of Fashion Industry, Ewha Womans University, Seoul 03760, Korea
2
Department of Data Science, Seoul Women’s University, Seoul 01797, Korea
3
AI.M Inc., Seoul 06241, Korea
*
Author to whom correspondence should be addressed.
Sustainability 2021, 13(17), 9530; https://doi.org/10.3390/su13179530
Submission received: 10 July 2021 / Revised: 16 August 2021 / Accepted: 21 August 2021 / Published: 24 August 2021
(This article belongs to the Special Issue Sportwear in the Next Normal: Product Development and Marketing)

Abstract

:
This study aimed to use quantitative methods and deep learning techniques to report sportive fashion trends. We collected sportive fashion images from fashion collections of the past decades and utilized the multi-label graph convolutional network (ML-GCN) model to detect and explore hybrid styles. Based on the literature review, we proposed a theoretical framework to investigate sportive fashion trends. The ML-GCN was designed to classify five style categories, “street,” “retro,” “sexy,” “modern,” and “sporty,” and the predictive probabilities of the five styles of fashion images were extracted. We statistically validated the hybrid style results derived from the ML-GCN model and suggested an application method of deep learning-based trend reports in the fashion industry. This study reported sportive fashion by hybrid style dependency, forecasting, and brand clustering. We visualized the predicted probability for a hybrid style to a three-dimensional scale expected to help designers and researchers in the field of fashion to achieve digital design innovation cooperating with deep learning techniques.

1. Introduction

Fashion trend analysis is of utmost importance in the fashion industry as it can identify and report design information to improve the product. In general, style trends spread to the public from the top down, starting with high-end fashion collections [1]. Style trend analysis of fashion collection images strongly depends on accurate classification of the hybrid styles defined by the fashion experts. Notably, many studies have conducted style trend analyses on sportive fashion since the 19th century given their significant influence of fashion [2]. Unlike sportswear, sportive fashion can be worn both as daily wear, as well as for sporting activities. It is a popular style among the masses, due to the influence of factors such as social change, urban adaptation, random cultural moments, and the development of synthetic materials [3]. While previous studies have gathered fashion collection images and analyzed them based on insights from researchers via focus group interview (FGI) methods to identify sportive fashion trends, the evaluation of fashion collection images remains challenging: firstly, such methods cannot be objective as the style criteria determined by researchers for classifying images are ambiguous and subjective [4,5]. Secondly, experienced fashion experts, time, and funding are needed to accomplish such quantitative data analysis.
In this context, a new interdisciplinary field known as “fashion informatics” has emerged, which refers to the use of computer vision technology for data mining in fashion research [6,7]. It applies a new analysis method based on deep learning, which has produced astonishing results in terms of image classification in various fields [8]. Deep learning-based AI models have enabled automated image classification by capturing features that are unrecognizable to humans [9,10]; this has led to the development of AI models that can automatically classify fashion images. Deep learning classification for items, colors, materials, and styles from fashion images is often performed visually applied Convolution Neural Networks(CNN) models [11,12,13]. However, unlike design attributes, style recognition via fashion images has been challenging since style is a higher-level concept that comprehensively combines design attributes representing fashion trends. Early studies used the ResNet-50-based model to classify fashion images that performed well at the ImageNet image recognition competition [14]. However, the ResNet-50 model that attempted to classify a single style label showed limitations because one outfit can contain multiple styles simultaneously [15]. In fashion style classifications, two or more styles need to be identified from one outfit. With this in mind, a multi-label recognition model based on a Graph Convolution Network(ML-GCN) was recently proposed to detect dependencies between fashion styles [16]. Previous studies used an engineering approach that focused only on technical aspects for fashion style classification without considering fashion trend reports and applications for designers in the fashion industry. In this study, we use the ML-GCN models to perform trend analysis of the hybrid styles prevalent in sportive fashion.
The research questions were as follows: First, what are the representative styles that constitute sportive fashion? Second, how can AI be applied for detecting and reporting hybrid style trends in sportive fashion? Third, how can AI-based trend reports serve as applicable design guidelines in the fashion industry? To answer these research questions, we theoretically considered the style features of sportive fashion. We also applied automatic image classification methods based on deep learning techniques. Specifically, we collected various sportive fashion images from fashion collections over the past decades. Next, we trained and evaluated Kim et al.’s [16] ML-GCN model to extract the predictive probabilities for hybrid styles of each fashion image. Finally, we validated the statistically significant difference in each mean of the five style categories between the ML-GCN model and fashion experts. We discussed how to utilize deep learning-based trend reports for the fashion industry.
This work extends the scope of fashion informatics research to AI applications for hybrid style trend reports. This research is significant because it designs deep learning-based technology to report hybrid style dependency, provide forecasting and brand positioning, and present a three-dimensional scale as a quantitative trend indicator. Furthermore, the proposed ML-GCN model was verified by a dataset collected from Social Network Services (SNS) as well as by statistically comparing its data with those of selected fashion experts. In the future, this could enable the fashion industry to develop designs while collaborating with fashion trend forecasting mechanisms and AI.

2. Literature Review

2.1. Sportive Styles among High-End Fashion Brands

Sports-related fashion is largely categorized into “active wear” (functional and active clothing suitable for sports activities) and “spectator sportswear” (comfortable sportswear worn when watching games) [17]. Spectator sportswear emerged within European high society mostly with formal attire. It has become more popular since the 1920s, including as separates and town wear, clothing items, such as pants, shorts, tops, sweaters, skirts, jackets, casual dresses, and jumpsuits. As the influence of sports increased, the concept of sports fashion expanded, becoming the starting point for casual wear in everyday life since the 1960s. During this period, the term “sportive” began to be used for describing simplified sportswear designs as well as the active, modern, and upper-class fashion styles [18]. The fading frontiers between sports and town wear and the increase in the number of luxury and high-end ready-to-wear brands have led to the development of several sports-oriented sources for novel fashion designs. Interest from high-fashion and designer sportive-fashion labels is modifying consumer expectations and drawing renewed attention to sportive fashion design in general and aesthetics in particular [19]. In 1963, the Paris collection used the term “sportive look” to refer to a style of arctic clothes, and in the mid-1970s, the designer Castelbajac presented the term “sports look” to describe clothing for sports activities. In the 1980s, the Wimbledon final between Björn Borg and John McEnroe helped move tracksuits from the gymnastics arena to high fashion. Since the mid-1990s, postmodernism began to influence the diversity of fashion of high-end fashion brands, and designers presented mixed features in sportive fashion [20].
Consequently, since the 2000s, sportive fashion has become a sustainable fashion trend that changes every season, as opposed to featuring a single fashion style. Sportive fashion is influenced by customer lifestyle, new materials, functional details, and accessories based on the relevant brand’s heritage. High-end brands target younger millennials, communicate with consumers through sportive street wear-oriented fashion (based on popularity), and uniquely implement sportive fashion based on brand identity [21].

2.2. Sportive Fashion Trend Analysis

Previous research into sportive fashion trends covered various periods, including the first half of the 20th century, the early 21st century, and the post-2010 period. Fashion studies often used fashion collection images and classified style trends based on the judgments of fashion experts about design attributes, such as silhouettes, colors, materials, details, and items that captured the aesthetic and formative characteristics of sportive fashion. Ha [22] classified style inspired by sportswear into three categories along with fashion brands: functional sports style (e.g., Chanel, Calvin Klein), street sports style (e.g., Tommy Hilfiger, Tom Ford), and futuristic sports style (e.g., Prada, Paco Rabanne). Kim and Han [23] considered style convergence in sportive fashion style trends by gathering fashion images from fashion collections and brand catalogs, and classifying images into four categories, “urban street,” “romantic,” “retro,” and “urban utility” through in-depth interviews with fashion experts. Lee [24] applied Multi-Dimensional Scaling (MDS) for positioning map, which has two axis: sexuality and activeness to classify 450 athleisure fashion images. With the aid of a group of fashion experts, they analyzed design attributes and classified styles into five categories, “luxury,” “feminine,” “modern,” “retro,” and “mannish.” Each style category was positioned into a positioning map. MDS statistical techniques are widely used to display perceptions of existing products or brands in fashion research—in design [24,25] and marketing [26,27,28,29]. Positioning maps are used for determining the underlying structure of two-dimensional data.
Based on this literature review, we propose a theoretical framework for the investigation of sportive fashion. We applied two axes to the style categories of sportive fashion: a horizontal axis representing sexuality (including masculine and feminine)—the purported foundation of form in fashion (e.g., silhouette, color, pattern, and detail) [30]—and a vertical axis representing activeness design features—from comfort to aesthetics. We categorized the styles from preceding studies into four groups: masculine/comfort, masculine/aesthetic, feminine/comfort, and feminine/aesthetic; further, we selected four styles representing each group: street, modern, retro, and sexy. Finally, sporty styles most relevant to sportswear are placed in the middle of the × and Y axes. Through this, we identified five style categories as the criteria for hybrid style classification in sportive fashion (Figure 1).

2.3. Fashion Image Data: The Deep Learning Approach

The existing fashion image analysis methods, which are conducted by fashion experts, had the following limitations. First, due to the shortening of fashion trend cycles and simultaneous flooding of digital data, conducting expert analysis processes from time to time has become more challenging. Second, such processes are time-consuming and require extensive funding because they often involve participation from several experts. Third, the classification of fashion images is often dependent on ambiguous and challenging researcher criteria. Although multiple experts may evaluate standard design features, each professional may select a different set of styles based on their personal experiences and ideas of what is essential; thus, such analysis may not produce consistent results. Therefore, objectively and quantitatively evaluating fashion trends observed in fashion images could become challenging [4,5]. We thus require new methods for explaining fashion trends quickly and more objectively in a digital era where different styles change dynamically.
Computer vision researchers, specialized in deep learning techniques, have shown a growing interest in processing fashion image data. Specifically, the development of fashion image recognition technologies that use deep learning has attracted considerable attention, as such technologies’ performance has improved considerably. This technology may be helpful because it can reduce any risks arising from experts’ reliance on personal experiences and quickly categorizes vast amounts of data [31,32]. Deep learning technology can extract various image features, which are unrecognizable to humans, through convolution operations, thus enabling highly accurate classifications [12,33]. This technology has promoted new fashion trend analysis methods by automatically classifying items, colors, shapes, and styles in fashion images collected from fashion collections or SNS [11,12,34]. However, even though deep learning classification for items, colors, and materials from fashion images are often performed by visually applying CNN models [11,12,33,35], style recognition from fashion images has been challenging since it can be determined through various design attributes. In addition, ResNet50 model that attempted to classify a single style label showed limitations because a single outfit can contain multiple styles simultaneously [15]. In fashion style classifications, two or more styles need to be identified from one outfit. Therefore, in this study, we adopted a deep learning algorithm called graph convolution network (GCN), suggested by Kipf and welling [36]. GCN is one of the deep learning algorithms designed to consider the relationship between given labels in topology optimization. Using ML-GCN, an ensemble of GCN and CNN-based models was used to capture label correlations and to learn the features of an image effectively. Kim et al. [16] improved the recognition performances of multi-label fashion styles, which allowed detection and exploration of hybrid styles dependent on one outfit. The research team evaluated hybrid style dependency from 16,685 fashion image datasets collected from SNS and verified the outperforming baselines. Based on what we learned from the ML-GCN model, we could analyze our fashion image datasets using pre-trained models to produce meaningful trend reports. The ML-GCN model provides quantitative predictive probabilities of styles, which are given as output style categories, for each input fashion image data.

3. Proposed Methods

3.1. Pre-Training and Evaluation

We choose a multi-label classification ML-GCN model developed by Kim et al. [16] for sportive fashion trend forecasting. Based on the theoretical framework of the hybrid style of sportive fashion, we trained the ML-GCN model using a fashion image dataset collected from SNS and five style categories (street, retro, sexy, modern, and sporty). We utilized datasets with 10,734 images labeled with “street,” “retro,” “sexy,” “modern,” and “sporty” style from Kwon et al.’s study [11] and fine-tuned the pretested ML-GCN model using the dataset. Algorithm 1 describes the procedures to generate the embeddings of propagation graphs and images. The input was a graph, and nodes’ features were a set of direct neighbors of node v. Given K aggregating iterations, in each iteration, we have aggregator functions and weight matrices for GCN. The input image was 448 × 448 resolution, and we have convolution layer, global max-pooling, and weight matrices for CNN. The ML-GCN propagation algorithm was performed as follows. In each iteration k and for each node v, the aggregator function aggregates embedding vectors of the neighboring nodes into a single vector. The next step was concatenating the node’s current representation with the aggregated vector. This concatenated vector was then transformed by the weight matrix and the activation function. After k iterations, we could obtain a graph representation of embedding vectors. On the other hand, we could obtain feature maps from the convolution layer. Then, we could employ global max-pooling to obtain the image feature representation. Finally, the final feature representation vector was obtained by the dot product of the feature vectors from the image representation and the graph representation.
Algorithm 1. MLGCN forward propagation algorithm.
Input: Graph G V , E ; node feature ϕ v , v V ; number of iteration K, aggregator function Δ k ; weight matrices for GCN W k ,   k   k = 1 , 2 , 3 , , K ; concatenation operator ; activation function σ ; neighbor set N; image I; global max-pooling layer f gmp ; convolution layer f cnn ; weight matrices for CNN θ
Output: Vector representation Y for Image and graph
1: h v 0   ϕ v ,   v V v ;
2:For k = 1 , 2 , 3 , , K do
3:For v V do
4:   h N v k Δ k     h u k 1 ,   u N v ;
5:   h v k σ W k h v k 1 h N v k ;
6:End
7:End
8: H h v k ,   v V ;
9: X f GMP f cnn I ,   θ ;
10: Y H X ;
11:Return Y
We validated the performances of the ML-GCN model with 1184 random sample image data sets. The image data sets are labeled in five style items with SNS images collected by web crawlers from 1 July to 31 August 2019. The output vector dimensions of image representation learning and graph representation learning consist of 2048 dimensions, learning a graph representation learning model via Adam optimizer with a learning rate of 0.001, and fine-tuning the weighting of the image representation learning model via Adam optimizer with a learning rate of 00001. Early stopping was used to stop learning if validation loss increased compared to the previous epoch. We used Top-k accuracy, which is the ratio for data in which at least one of the main-labels and sub-labels in the overall data is included in the top k prediction values.
We compared the proposed ML-GCN model performance with the CNN model, the most fundamental structural image recognition model, and the ResNet-50 model, which is one of the structures recently used for single fashion style recognition. The CNN model learned training data with convolution layer, max-pooling layer, and fully connected layer structures, while the ResNet-50 model transferred pre-trained weights from the ImageNet image recognition competition dataset and fine-tuned weights with training data. We conducted ANOVA test three times for 10-fold cross-validation in our comparison of the examined methods. We divide data into training datasets and verification datasets for modeling and evaluating them 30 times. Furthermore, the distribution of labels in styles is disproportionate, so the model is trained with 90% of the data maintaining the ratio of different style labels. The remaining 10% of the data were applied as input variables to the learned model and verified by comparing the extracted and actual values.

3.2. Data Collection

This study selected ten high-end fashion brands reported to lead fashion trends based on online consumers’ searches, views, wish list storage, and surveys [37,38]. We selected ready-to-wear fashion collection images from Vogue.com (http://www.vogue.com, accessed on 23 August 2021); these encompassed 20 seasons for the period between 2011 spring/summer and 2020 fall/winter seasons. We thus collected 10,093 fashion images. Then, We extracted sportive fashion images from the collected images based on FGI. The group of fashion experts who participated in the study consisted of five university instructors and fashion industry practitioners who majored in fashion design and had experience in fashion trend analysis. The group of fashion experts reviewed the collected images one by one through the FGI method and extracted images that are discussed to have at least one functional and aesthetic element related to sports (not sportswear outfits). We analyzes images agreed by five fashion experts as sportive fashion images, with 1122 images (Table 1). Among the images collected based on fashion brands, Vetements and Off-White (launched in 2015), showed the most frequent inclusion of sportive fashion. Other high-end brands often had at least one season without sportive fashion. Sometimes 1–2 outfits were included, depending on their seasonal fashion concept.

3.3. Sportive Fashion Trend Analysis

Our sportive fashion trend analysis process is shown in Figure 2. Here, we use the trained ML-GCN model to analyze hybrid styles that appear in sportive fashion images. We input each sportive fashion images to detect the style predictive probabilities and applied time-series analysis. Then, we statistically validate the hybrid style clustering results derived from the ML-GCN model and the results derived by fashion experts and confirm the correlation between the two results. Applying the same evaluation dataset was crucial for accurately comparing the differences between the ML-GCN models and the fashion experts’ judgment results. Unlike ML-GCN models, which automatically derive large amounts of results in a time, a group of fashion experts could evaluate only a limited number of images. Accordingly, we performed a fashion expert FGI to select a representative one image per season from each brand, and 139 images were selected for evaluation. We provide evaluation images to the ML-GCN model and fashion experts. ML-GCN model automatically derives predictive probabilities of five styles for each image, confirming the proportions for each style. The fashion experts evaluated each image by using a blind test with a five-point Likert scale (1 as “not at all representative” and 5 as “very representative”) for five styles. We then applied a statistical analysis using IBM SPSS version 19 to compare the two data, evaluated by the ML-GCN model and fashion experts. We conducted Pearson’s correction analysis to confirm the correlation between the two results. We also conducted an independent sample t-test to verify that the two results showed significant differences regarding style variables. MDS was applied to these data and translated the fashion brands’ into positioning maps using PROXSCAL. Finally, we visualized the predictive probabilities of the hybrid styles using the three-dimensional scale.

4. Results

4.1. ML-GCN Model Performance

The results of comparing the ML-GCN model to the CNN model and the ResNet-50 model are shown in Table 2. The proposed model performed better than the comparison model. The ML-GCN model shown 73.23% in Top 1 accuracy, 3% performance over the CNN model. In addition, the ML-GCN model shown 93.19% in Top 2 accuracy, 10% higher than CNN models and about 3% higher than ResNet-50 models, and about 6% higher than CNN models and 2% higher than ResNet-50 models in Top 3 accuracy. These results indicate that styles that appear in fashion images affect each other and reflect hybrid style characteristics in the deep learning model positively impact performance.
One-way ANOVA was performed to verify that the mean of the major variables showed significant differences depending on the model. As a result, all models showed significant differences with Top 1 accuracy (F = 3.60720, p < 0.05), Top 2 accuracy (F = 412.80810, p < 0.001), and Top 3 accuracy (F = 160.93132, p < 0.001) (Table 3). We proceed with Tukey’s HSD(honestly significant difference), multiple comparisons to determine where the differences occurred between models. As a result, no mean difference between any groups was significant in Top 1 accuracy. In contrast, there were significant mean differences between all models in Top 2 and Top 3 accuracy (Table 4).

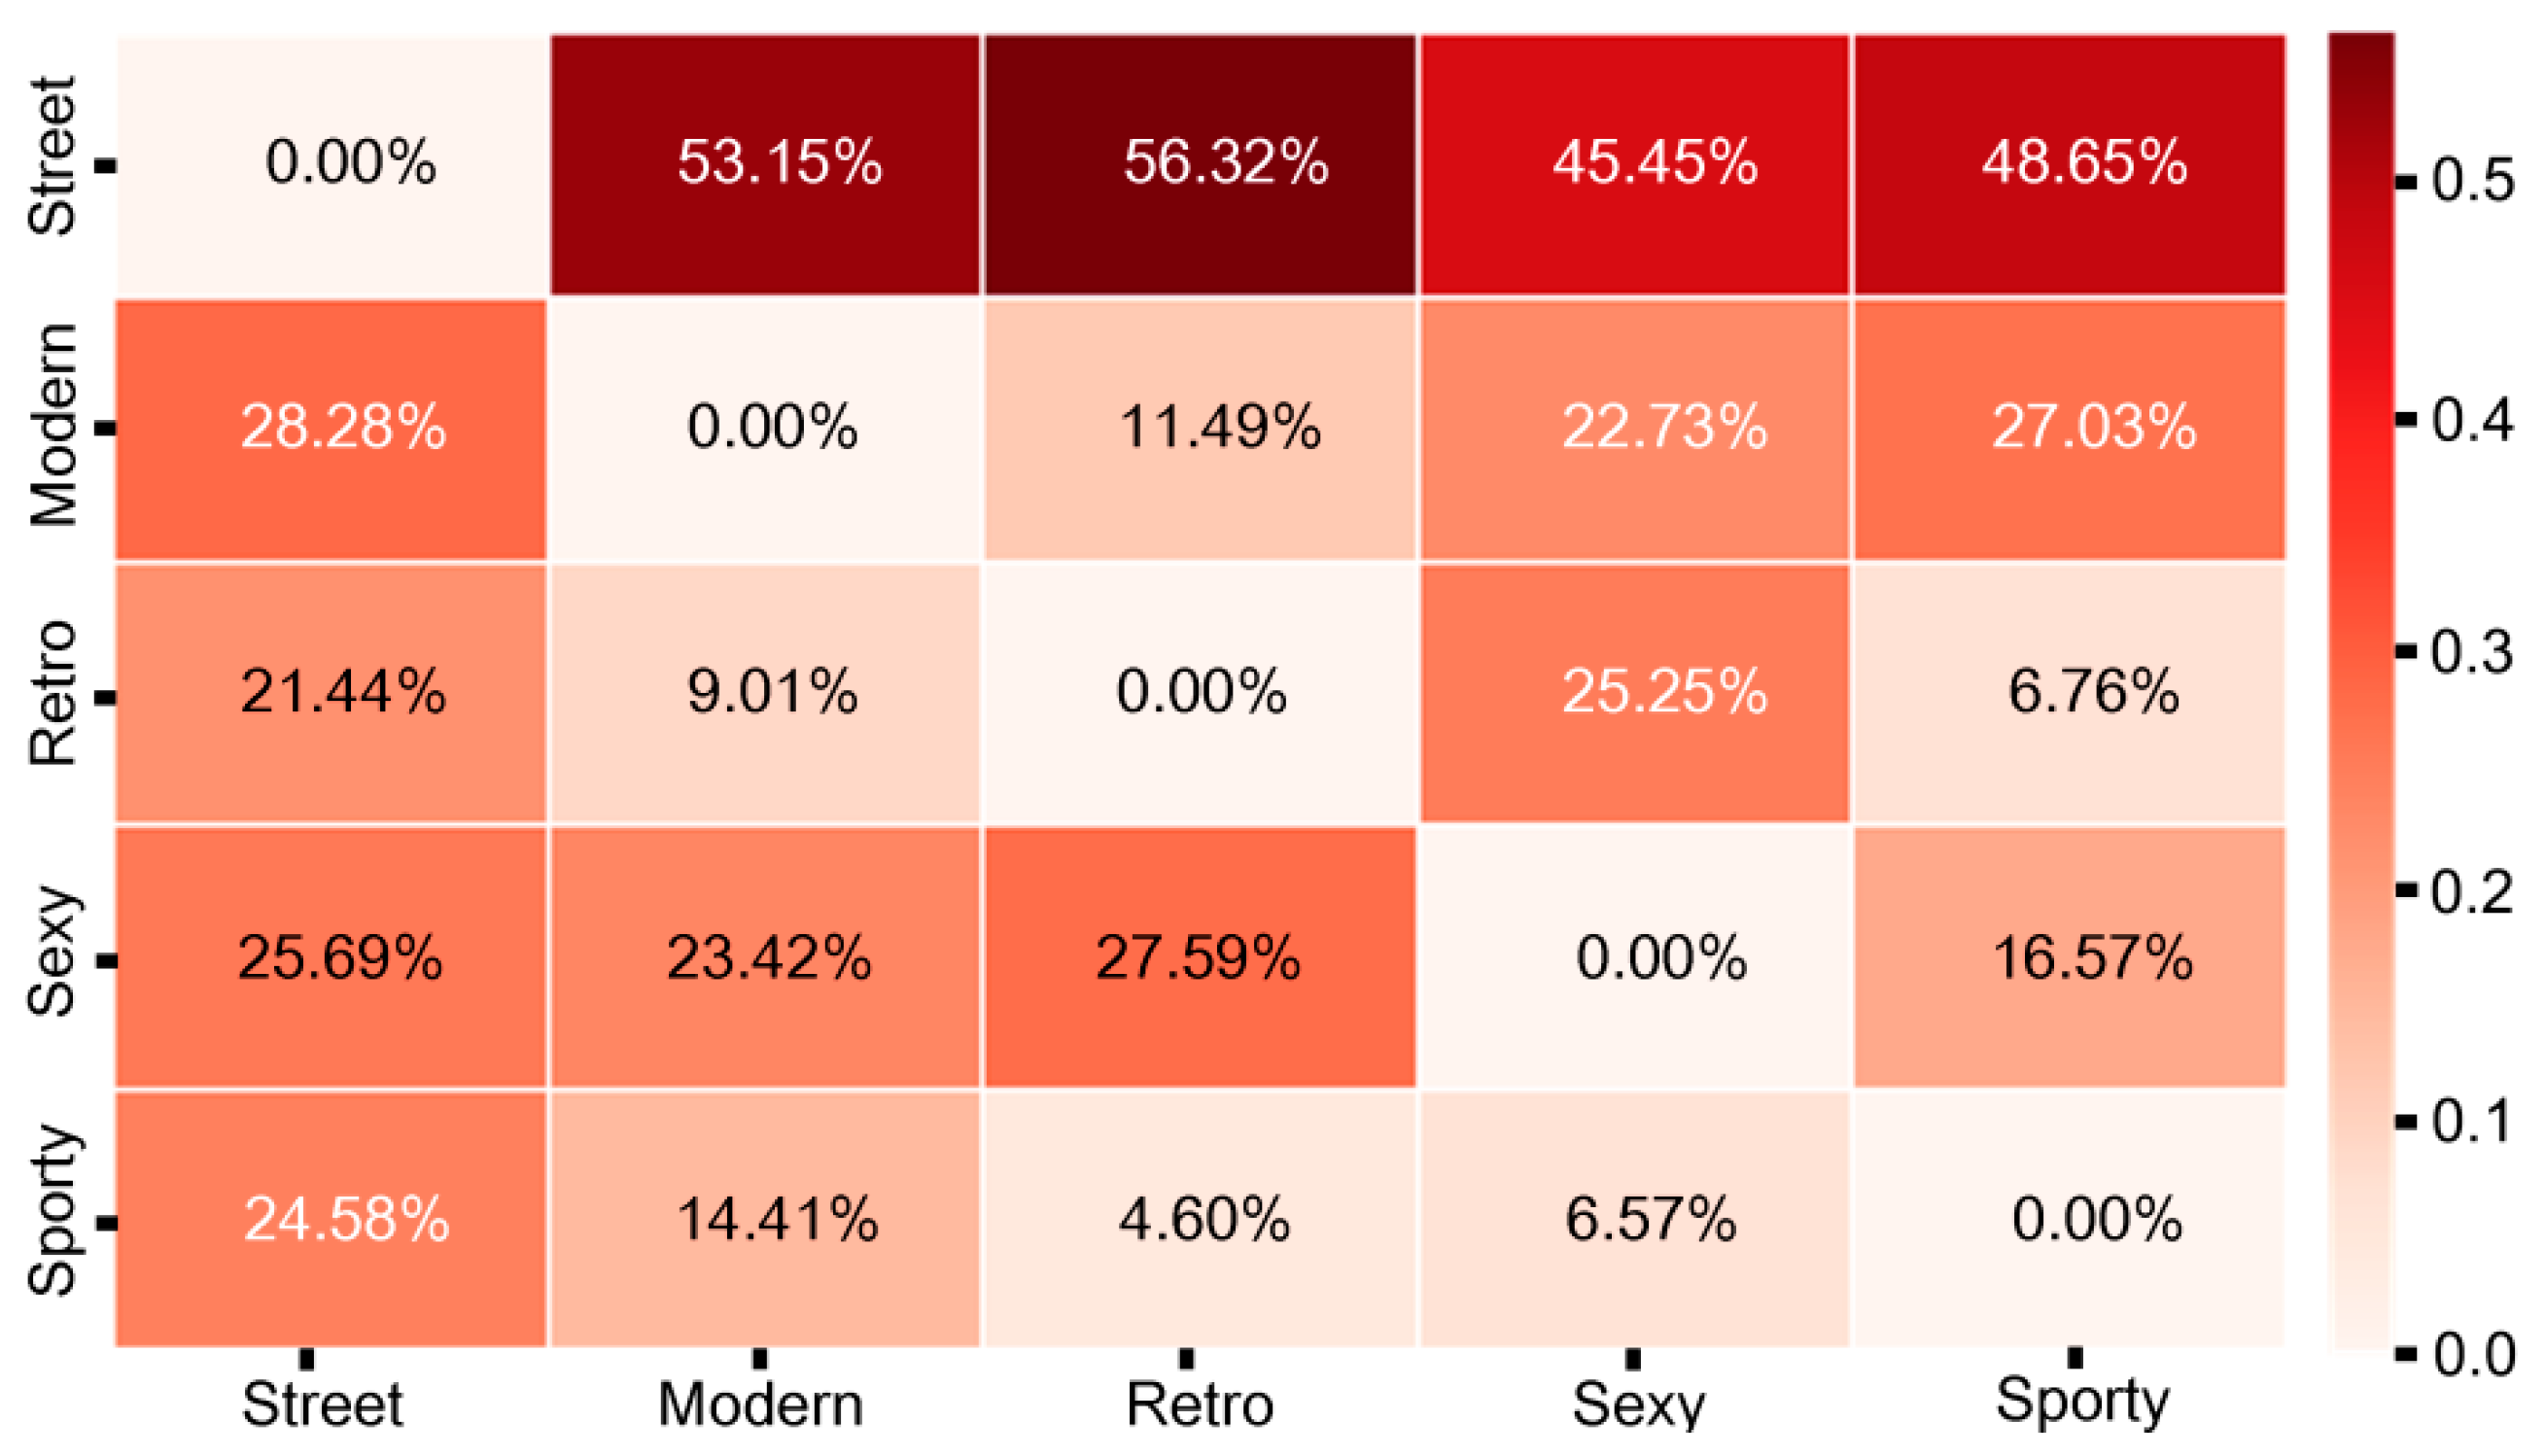
4.2. Hybrid Style Dependency and Forecasting

1122 sportive fashion images were applied to the ML-GCN model. The ML-GCN model identified the Top 1 and Top 2 styles’ predicted probabilities from each image. Figure 3 is a heat map visualization of the correlation matrix between styles derived from 1122 fashion images. Street style was most likely to be predicted with modern, while the rest were more likely to be predicted with the street. Sporty style in sportive fashion images are likely to be predicted together in the order of street (48.65%), modern (27.03%), sexy (16.57%), and retro (6.76%).
Time-series clustering was applied to 20 fashion seasons that occurred during the analysis periods of 2011 spring/summer to 2020 fall/winter seasons to classify hybrid style trends for each season (Figure 4). The style with the highest percentage of predictive probabilities over decades was street style, with a consistent result of above 30%. ML-GCN model found sporty and retro styles to have below 20% of predictive probabilities. Regarding the rankings, modern and sexy styles were showed the most changed proportions of predictive probabilities every year, found to have between 4% and 50% of predictive probabilities.

4.3. Comparison between ML-GCN Model and Fashion Experts

We conducted Pearson’s correlation analysis to determine the correlation between the ML-GCN model and fashion experts’ results for the five styles of “street,” “modern,” “retro,” “sexy,” and “sporty.” Correlation analysis of five style variables shows that both “casual” (r = 0.735, p < 0.05), “modern” (r = 0.692, p < 0.05), and “sexy” (r = 0.911, p < 0.001) styles showed significant and positive correlations. In contrast, “sporty” and “retro” showed no significant correlations (Table 5). Next, we validated the statistically significant difference in each mean of five styles between the ML-GCN model and fashion expert with an independent t-test. The t-test provides the basis for determining whether there is a difference in distribution between the ML-GCN model and the fashion experts. Current results shows that there is a statistically significant difference for “sporty” (t = 12.357, p < 0.001) and “retro” (t = −3.738, p < 0.01) style. However, “street,” “modern,” and “sexy,” which are shown as p > 0.05, have no distribution differences between the ML-GCN model and fashion experts (Table 6).
Next, we applied MDS to perceive the style similarities between the brands recognized by fashion experts and the ML-GCN model. Each positioning map represents a style similarity for ten brands. It shows that brands with high similarity are placed close to each other, and those with low similarity are placed relatively far. Tucker’s coefficient of congruence measure showed results of 0.948 (ML-GCN model) and 0.950 (fashion experts), while the stress values were 0.099 (ML-GCN model) and 0.095 (fashion experts), respectively. Thus, both results can potentially indicate the factor identities with “good” fitness of estimated distance [39]. Ten brands were clustered statistically and positioned into two dimensions. The proximity between these clusters was examined based on the horizontal axis (i.e., sexuality) and the vertical axis (i.e., activeness). The overall judgments regarding brand similarity from the ML-GCN model and the fashion experts were distinctively clustered under as follows: (1) Vetements, Off-White, and Balenciaga were located on the left, which indicated a masculine style; (2) Chanel, Fendi, and Givenchy were located at the bottom, which indicated aesthetics; (3) Gucci, Versace, and Dolce & Gabbana were located on the upper right, which indicated feminine and comfort, and (4) Prada was located in the middle.
Figure 5 shows the clustering for the sportive fashion styles from brands (based on the ML-GCN model and the data collected by fashion experts). We estimate that the designs between closely located brands are similar and that there would be fierce competition.

4.4. Three-Dimensional Construction of Hybrid Styles

We applied the predicted probability for a hybrid style derived from the ML-GCN model to a three-dimensional scale using GeoGebra (International GeoGebra Institute, Austria). The three-dimensional scale instantly interprets complex styles through three axes: x, y, and z. Figure 6 illustrates “street” and “sexy” on the x-axis, “retro” and “modern” on the y-axis, and “sporty” style on the z-axis. The fashion image data was derived in a unique form that reflected the trending proportion of styles. There are four representative hybrid styles, including street-dominant (Figure 6a), sexy/retro-dominant (Figure 6b), modern-dominant (Figure 6c), neutral-dominant (Figure 6d), visualized through bar-graph and three-dimensional scale.

5. Discussion

We applied five style categories to the ML-GCN model and reported the predictive probabilities of hybrid style from fashion image data. Besides reporting hybrid style dependency, providing forecasting and brand clustering based on deep learning techniques, the study statistically verified the results by comparing fashion expert data with the ML-GCN model data.
The chief theoretical contribution of this study is the presentation of a new framework for research on hybrid style trends. Regarding fashion research, our study contributes to existing fashion style trend analysis methods objectively by using deep learning techniques. Traditional fashion trend reports were judged by fashion experts, making it challenging to extract an objective ratio of styles. Therefore, the sportive fashion trend has been defined as a comprehensive conceptual style, which was challenging to utilize as a vivid design guideline for the fashion industry. The predicted probability of hybrid style derived from the ML-GCN model is expected to become a cornerstone for developing data-driven fashion design. This study visualized hybrid styles with three-dimensional construction that can indicate design variations that occur when one distinctive style proportion is increased or decreased while designers were planning for a new design. In Figure 6, we positioned the sporty style, a fundamental style of sportive fashion, on the z-axis. Designers can obtain visual ideas by focusing on the core z-axis or expanding their ideas around the sub-axis. We expect the three-dimensional scale would function like an accessible digital library that continuously accumulates open-source fashion image data (e.g., deep fashion) [40,41]. Designers can attempt design variations by navigating fashion images by manipulating axes on a three-dimensional scale, adjusting style proportions. The three-dimensional scale can also be utilized as an objective indicator within a customized design process to identify and change quantitative style ratios. Our research, which uses quantitative trend indicators and design guidelines, could thus, aid the fashion design process.
Regarding computer science research, we validated the ML-GCN model by statistically comparing its data with those of selected fashion experts. In hybrid style classification, the ML-GCN model was highly consistent with the judgments of fashion experts in “street,” “modern,” and “sexy” styles. These results indicate that in complex hybrid style classifications, the ML-GCN model can be fully considered a more efficient replacement to investigate and organize all opinions of fashion experts. It also suggests that fashion style trends can be identified via the quantitative analysis of large amounts of fashion image data, at a scale that humans cannot currently handle. However, in the case of “retro” and “sporty,” the fashion experts’ results showed a difference. This has been determined to be due to differences in detail recognition of fashion images. It has been found that the CNN model has difficulties capturing detailed information from image data [42,43]. Accordingly, for detail-dependent fashion styles, such as “sporty” or “retro” the performance of the ML-GCN model needs to be verified by comparing fashion expert data. In addition, additional design attributes and aesthetic features-related image learning processes will be necessary. This work presents a model performance enhancement approach for framing categories in model learning; furthermore, rather than focusing on the speed and volume of data processing and technical performance, it assesses how similarly the learned model classifies styles compared to human sensibilities.

6. Conclusions

This study has attempted to establish quantitative methods of analyzing sportive fashion trends. We applied deep learning techniques to automatically define hybrid styles from sportive fashion image data and discussed how to utilize deep learning-based trend reports for the fashion industry. Its main research contributions are as follows:
First, the deep learning-based image classifications approach quickly processes large numbers of sportive fashion images. Moreover, it quantitatively and objectively derives hybrid style ratios mixed in sportive fashion. Therefore, fashion style trend reports based on deep learning would help the fashion industry deal with dynamic fashion trends that change rapidly from season to season. Second, comparing the results of ML-GCN models and analysis of the hybrid style clustering by fashion experts, we find that the performance of ML-GCN models corresponds to the fashion expert level. ML-GCN models produce results faster and more consistently because they do not involve evaluating images one by one using a Likert scale. Accordingly, brand clustering results presented through the positioning map will be an objective indicator of relationships with other brands when planning new season style concepts in the highly competitive fashion industry. Third, the study suggests a three-dimensional construction of hybrid styles. We demonstrate how proportions for each style can be structured in three-dimensional form in sportive fashion trends. Furthermore, these visualizations can become a digital design tool for future fashion design development processes. Designers can type in style proportions, move to any surface, and walk around the digital fashion image library. We suggest this could provide creative design inspiration and insight for fashion designers. The results show that deep learning-based fashion trend reports can be used as a communication tool when fashion designers and deep learning models collaborate to plan new fashion brands or designs.
However, there were technical limitations in this study. Regarding ML-GCN models utilized in this study, model training was conducted using Instagram images. In the case of SNS image data, street fashion is the mainstream, so there was an uneven number of learned image data by styles. As a result, sporty and retro styles, which used fewer image datasets in the training process, showed low similarity to fashion expert results. Thus, future work should aim to further improve the performance of ML-GCN models by addressing the unbalanced data issue. To do this, we would like to apply a loss function considering the model’s unbalanced data or utilize various modalities for image processing as per Schonfeld et al. [44] to ensure that the probability distribution contains more information. In the future, increased collaboration between fashion experts and computer experts will be needed. We hope that this research serves as the cornerstone of various collaborative studies in fashion informatics research.

Author Contributions

Conceptualization, H.A. and Y.C.; methodology, H.A.; software, S.K.; validation, S.K.; writing—original draft preparation, H.A.; writing—review and editing, Y.C.; funding acquisition, H.A. and Y.C. All authors have read and agreed to the published version of the manuscript.

Funding

This work was supported by the Ministry of Education of the Republic of Korea and the National Research Foundation of Korea (NRF-2019S1A5A8038262).

Institutional Review Board Statement

Not applicable.

Informed Consent Statement

Not applicable.

Data Availability Statement

The data used in this study are not publicly available; however, the data may be made available from the corresponding author on request.

Acknowledgments

The authors are grateful to JY for their help with technical support in applying to the journal.

Conflicts of Interest

The authors declare no conflict of interest.

References

  1. Jackson, T. The process of trend development leading to a fashion season. In Fashion Marketing; Anonymous, Ed.; Routledge: London, UK, 2007; pp. 192–211. [Google Scholar]
  2. Horn, M.J.; Gurel, L.M. The Second Skin: An Interdisciplinary Study of Clothing; Houghton Mifflin School: Boston, MA, USA, 1981. [Google Scholar]
  3. Arnold, R. Modern Fashions for Modern Women: The Evolution of New York Sportswear in the 1930s; Costume: Edinburgh, UK, 2007; Volume 41, pp. 111–125. [Google Scholar]
  4. Kindred, L. Fashioning Data: A 2015 Update: Data Innovations from the Fashion Industry; O’Reilly Media: Sebastopol, CA, USA, 2015. [Google Scholar]
  5. An, H.; Park, M. Approaching Fashion Design Trend Applications using Text Mining and Semantic Network Analysis. Fash. Text. 2020, 7, 34. [Google Scholar] [CrossRef]
  6. Copeland, L.; Ciampaglia, G.L.; Zhao, L. Fashion Informatics and the Network of Fashion Knockoffs. First Monday 2019, 24, 24. [Google Scholar] [CrossRef]
  7. Zhao, L.; Min, C. The Rise of Fashion Informatics: A Case of Data-Mining-Based Social Network Analysis in Fashion. Cloth. Text. Res. J. 2019, 37, 87–102. [Google Scholar] [CrossRef]
  8. Tanzi, L.; Vezzetti, E.; Moreno, R.; Aprato, A.; Audisio, A.; Massè, A. Hierarchical Fracture Classification of Proximal Femur X-Ray Images using a Multistage Deep Learning Approach. Eur. J. Radiol. 2020, 133, 109373. [Google Scholar] [CrossRef] [PubMed]
  9. Chung, S.W.; Han, S.S.; Lee, J.W.; Oh, K.; Kim, N.R.; Yoon, J.P.; Kim, J.Y.; Moon, S.H.; Kwon, J.; Lee, H. Automated Detection and Classification of the Proximal Humerus Fracture by using Deep Learning Algorithm. Acta Orthop. 2018, 89, 468–473. [Google Scholar] [CrossRef] [Green Version]
  10. Jerez, D.; Stuart, E.; Schmitt, K.; Guerrero-Given, D.; Christie, J.M.; Kamasawa, N.; Smirnov, M.S. A Deep Learning Approach to Identifying Immunogold Particles in Electron Microscopy Images. Sci. Rep. 2021, 11, 7771. [Google Scholar] [CrossRef]
  11. Kwon, S.; Choi, Y.; Kim, S.; An, H. Fashion Style Classification of Sns Images using Convolutional Neural Networks. In Proceedings of the 2020 International Conference on Clothing and Textiles (ICCT), Busan, Korea, 29 May 2020; p. 9. [Google Scholar]
  12. Seo, Y.; Shin, K. Hierarchical Convolutional Neural Networks for Fashion Image Classification. Expert Syst. Appl. 2019, 116, 328–339. [Google Scholar] [CrossRef]
  13. Han, A.; Kim, J.; Ahn, J. Color Trend Analysis using Machine Learning with Fashion Collection Images. Cloth. Text. Res. J. 2021, 0887302X21995948. [Google Scholar] [CrossRef]
  14. Deng, J.; Dong, W.; Socher, R.; Li, L.; Li, K.; Fei-Fei, L. Imagenet: A Large-Scale Hierarchical Image Database. In Proceedings of the 2009 IEEE Conference on Computer Vision and Pattern Recognition, Miami, FL, USA, 20–25 June 2009; pp. 248–255. [Google Scholar]
  15. Takagi, M.; Simo-Serra, E.; Iizuka, S.; Ishikawa, H. What Makes a Style: Experimental Analysis of Fashion Prediction. In Proceedings of the IEEE International Conference on Computer Vision Workshops, Venice, Italy, 22–29 October 2017; pp. 2247–2253. [Google Scholar]
  16. Kim, S.; Choi, Y.; Park, J. Recognition of Multi Label Fashion Styles Based on Transfer Learning and Graph Convolution Network. J. Soc. e-Bus. Stud. 2021, 26, 29–41. [Google Scholar]
  17. Stone, E.; Farnan, S.A. The Dynamics of Fashion; Bloomsbury Publishing USA: New York, NY, USA, 2018. [Google Scholar]
  18. Pyper, J. Style Sportive: Fashion, Sport and Modernity in France, 1923–1930. Apparence(s) 2017, 7. [Google Scholar] [CrossRef]
  19. Bramel, S. Key trends in sportswear design. In Textiles in Sport; Anonymous, Ed.; Elsevier: Amsterdam, The Netherlands, 2005; pp. 25–43. [Google Scholar]
  20. Park, J.H. Sportism in Fashion Generated from Hybrid. Res. J. Costume Cult. 2004, 12, 792–804. [Google Scholar]
  21. Pedeliento, G.; Mangiò, F.; Littlewood, A.V.; Murtas, G.; Manfrini, G.N. A New Paradigm in the Luxury Fashion Industry: Off-White and the Rise of Luxury Streetwear; SAGE Business Cases Originals; SAGE Publications: New York, NY, USA, 2021. [Google Scholar]
  22. Ha, J. Sports Look Expressed in 20th Century Fashion. J. Korean Soc. Costume 2000, 50, 15–28. [Google Scholar]
  23. Kim, M.Y.; Han, M.S. A Study on the Sportism in Domestic Fashion. Res. J. Costume Cult. 2003, 11, 778–792. [Google Scholar]
  24. Lee, K.Y. A Study on Athleisure Look in Current Fashion. J. Korean Soc. Des. Cult. 2018, 24, 443–453. [Google Scholar] [CrossRef]
  25. Kwon, Y.J.; Lee, Y. Traditional Aesthetic Characteristics Traced in South Korean Contemporary Fashion Practice. Fash. Pract. 2015, 7, 153–174. [Google Scholar] [CrossRef]
  26. De Chernatony, L. Categorizing Brands: Evolutionary Processes Underpinned by Two Key Dimensions. J. Mark. Manag. 1993, 9, 173–188. [Google Scholar] [CrossRef]
  27. Truong, Y.; McColl, R.; Kitchen, P.J. New Luxury Brand Positioning and the Emergence of Masstige Brands. J. Brand Manag. 2009, 16, 375–382. [Google Scholar] [CrossRef]
  28. Ordun, G. Millennial (Gen Y) Consumer Behavior their Shopping Preferences and Perceptual Maps Associated with Brand Loyalty. Can. Soc. Sci. 2015, 11, 40–55. [Google Scholar]
  29. Lee, J.L.; Kim, Y.; Won, J. Sports Brand Positioning: Positioning Congruence and Consumer Perceptions Toward Brands. Int. J. Sports Mark. Spons. 2018, 19, 450–471. [Google Scholar] [CrossRef]
  30. Hollander, A. Sex and Suits: The Evolution of Modern Dress; Bloomsbury Publishing: London, UK, 2016. [Google Scholar]
  31. Liu, Z.; Yan, S.; Luo, P.; Wang, X.; Tang, X. Fashion Landmark Detection in the Wild. In Proceedings of the European Conference on Computer Vision, Amsterdam, The Netherlands, 8 October 2016; pp. 229–245. [Google Scholar]
  32. Ge, Y.; Zhang, R.; Wang, X.; Tang, X.; Luo, P. Deepfashion2: A Versatile Benchmark for Detection, Pose Estimation, Segmentation and Re-Identification of Clothing Images. In Proceedings of the IEEE/CVF Conference on Computer Vision and Pattern Recognition, Long Beach, CA, USA, 15 June 2019; pp. 5337–5345. [Google Scholar]
  33. Lao, B.; Jagadeesh, K. Convolutional Neural Networks for Fashion Classification and Object Detection. CCCV 2015: Computer Vision. 2015, pp. 120–129. Available online: http://vision.stanford.edu/teaching/cs231n/reports/2015/pdfs/BLAO_KJAG_CS231N_FinalPaperFashionClassification.pdf (accessed on 23 August 2021).
  34. Bossard, L.; Dantone, M.; Leistner, C.; Wengert, C.; Quack, T.; Van Gool, L. Apparel Classification with Style. In Proceedings of the Asian Conference on Computer Vision, Daejeon, Korea, 9 November 2012; pp. 321–335. [Google Scholar]
  35. Eshwar, S.G.; Rishikesh, A.V.; Charan, N.A.; Umadevi, V. Apparel Classification using Convolutional Neural Networks. In Proceedings of the 2016 International Conference on ICT in Business Industry & Government (ICTBIG), Indore, India, 18–19 November 2016; pp. 1–5. [Google Scholar]
  36. Kipf, T.N.; Welling, M. Semi-Supervised Classification with Graph Convolutional Networks. arXiv 2016, arXiv:1609.02907. [Google Scholar]
  37. Cerini, M. How Coco Chanel Changed the Course of Women’s Fashion. Available online: https://edition.cnn.com/style/article/coco-chanel-fashion-50-years/index.html (accessed on 23 August 2021).
  38. Crisell, H. According to the Lyst Index, These Are the World’s 10 Hottest Brands. Available online: https://www.vogue.co.uk/article/top-10-fashion-brands-2018 (accessed on 23 August 2021).
  39. Kruskal, J.B. Multidimensional Scaling by Optimizing Goodness of Fit to a Nonmetric Hypothesis. Psychometrika 1964, 29, 1–27. [Google Scholar] [CrossRef]
  40. Zheng, S.; Yang, F.; Kiapour, M.H.; Piramuthu, R. Modanet: A Large-Scale Street Fashion Dataset with Polygon Annotations. In Proceedings of the 26th ACM International Conference on Multimedia, Seoul, Korea, 15 October 2018; pp. 1670–1678. [Google Scholar]
  41. Liu, Z.; Luo, P.; Qiu, S.; Wang, X.; Tang, X. Deepfashion: Powering Robust Clothes Recognition and Retrieval with Rich Annotations. In Proceedings of the IEEE Conference on Computer Vision and Pattern Recognition, Las Vegas, NV, USA, 27–30 June 2016; pp. 1096–1104. [Google Scholar]
  42. Yue-Hei, N.J.; Yang, F.; Davis, L.S. Exploiting Local Features from Deep Networks for Image Retrieval. In Proceedings of the IEEE Conference on Computer Vision and Pattern Recognition Workshops, Boston, MA, USA, 12 June 2015; pp. 53–61. [Google Scholar]
  43. Liu, Y.; Qin, Z.; Anwar, S.; Caldwell, S.; Gedeon, T. Are Deep Neural Architectures Losing Information? Invertibility is Indispensable. In Proceedings of the International Conference on Neural Information Processing, Cham, Switzerlands, 19 November 2020; pp. 172–184. [Google Scholar]
  44. Schonfeld, E.; Ebrahimi, S.; Sinha, S.; Darrell, T.; Akata, Z. Generalized Zero-and Few-Shot Learning Via Aligned Variational Autoencoders. In Proceedings of the IEEE/CVF Conference on Computer Vision and Pattern Recognition, Long Beach, CA, USA, 15 June 2019; pp. 8247–8255. [Google Scholar]
Figure 1. Theoretical framework for the hybrid style in sportive fashion.
Sustainability 13 09530 g001
Figure 2. Flow diagram for sportive fashion trend analysis.
Sustainability 13 09530 g002
Figure 3. Hybrid style dependency in sportive fashion. The percentage is the predictive probability of a Top 1 and Top 2 style being together in 1122 images divided by the predictive probability of a Top 1 style in 1122 images.
Sustainability 13 09530 g003
Figure 4. Hybrid style forecasting in sportive fashion between 2011 and 2020. The numbers on the vertical axis indicate the average value of the probability of style prediction by the ML-GCN model.
Sustainability 13 09530 g004
Figure 5. Comparing brand clustering results on positioning maps. The distance between brands in positioning maps represents the estimated Euclidean distance. (a) result from ML-GCN model, (b) result from fashion experts.
Sustainability 13 09530 g005
Figure 6. Visualization of a hybrid style ratio through a bar graph and a three-dimensional scale. (a) street-dominant, (b) sexy/retro-dominant, (c) modern-dominant, (d) neutral-dominant. Each fashion image was adopted from the indicated fashion collection and modified according to the recognition method of the ML-GCN model.
Sustainability 13 09530 g006
Table 1. Number of fashion images collected between 2011 and 2020.
BrandFashion Images in CollectionSportive Fashion Images in Collection
SeasonsfSeasonsf%
Vetements103321011534.6
Off-White104081014034.3
Versace2010751718617.3
Balenciaga208531611513.4
Fendi209361612213.0
Prada20939139510.1
Gucci20106412888.2
Chanel201676181317.8
Givenchy20104611565.3
Dolce & Gabbana20176412744.1
Total-10,093-112214.8
Table 2. Comparing the proposed ML-GCN model with other models.
ModelTop 1 AccuracyTop 2 AccuracyTop 3 Accuracy
CNN70.3382.9591.43
ResNet-5073.3290.3395.85
ML-GCN73.2393.1997.70
Table 3. ANOVA test for comparing model performance.
SourceGroupdfSSMSFp-Value
Top 1 accuracyBetween Groups20.017360.0086830.607200.031
Within Groups870.209300.00241
Total89
Top 2 accuracyBetween Groups20.167350.083684120.808100.000 ***
Within Groups870.017640.00020
Total89
Top 3 accuracyBetween Groups20.062170.031091600.931320.000 ***
Within Groups870.016810.00019
Total89
*** p < 0.001.
Table 4. Tukey’s HSD test results in multiple comparisons.
SourceGroup 1Group 2MDAdjust p-ValueLowerUpper
Top 1 accuracyCNNML-GCN0.02900.062−0.00120.0592
CNNResNet-500.02990.053−0.00030.0601
ML-GCNResNet-500.00090.900−0.02930.0311
Top 2 accuracyCNNML-GCN0.10240.001 ***0.09360.1111
CNNResNet-500.07370.001 ***0.06500.0825
ML-GCNResNet-50−0.02860.001 ***−0.0374−0.0198
Top 3 accuracyCNNML-GCN0.006270.001 ***0.05410.0712
CNNResNet-500.04410.001 ***0.03560.0527
ML-GCNResNet-50−0.01850.001 ***−0.0271−0.0010
*** p < 0.001.
Table 5. Relationships between fashion experts’ and ML-GCN model results regarding the measurement proportions for each fashion style.
VariablesMG
Street
MG
Modern
MG
Retro
MG
Sexy
MG
Sporty
FE
Casual
FE
Modern
FE
Retro
FE
Sexy
FE
Sporty
MG Street1
MG Modern0.1471
MG Retro−0.240−0.2221
MG Sexy−0.871 **−0.3090.4891
MG Sporty−0.068−0.325−0.574−0.2921
FE Casual0.735 *−0.106−0.612−0.704 *0.3391
FE Modern0.3970.692 *−0.667 *−0.497−0.0440.4341
FE Retro−0.030−0.5310.4880.463−0.505−0.174−0.4871
FE Sexy−0.749 *−0.4540.3700.911 **−0.208−0.530−0.5710.6281
FE Sporty0.546−0.526−0.416−0.5160.5440.831 **−0.0690.043−0.2441
* p < 0.05, ** p < 0.01, MG: ML-GCN model, FE: fashion expert.
Table 6. Comparing and assessing the statistical significance of fashion experts’ and ML-GCN model results regarding the measurement proportions for each fashion style.
Style VariablesGroupNMeanS.D.tp-Value
StreetMG100.4213100.091024−0.42080.679
FE100.4465910.166779
ModernMG100.1666970.052651−10.4660.167
FE100.2235460.110743
RetroMG100.0936900.034900−30.738 **0.004
FE100.2704970.145452
SexyMG100.1437130.094641−0.77830.447
FE100.1905620.165157
SportyMG100.1350120.043655−120.357 ***0.000
FE100.5889620.107655
** p < 0.01, *** p < 0.001, MG: ML-GCN model, FE: fashion expert.
Publisher’s Note: MDPI stays neutral with regard to jurisdictional claims in published maps and institutional affiliations.

