Article

Trade-Offs and Synergies of Ecosystem Services in the Pearl River Delta Urban Agglomeration

1
School of Geographical Sciences, South China Normal University, Guangzhou 510631, China
2
School of Soil and Water Conservation, Beijing Forestry University, Beijing 100083, China
*
Author to whom correspondence should be addressed.
Sustainability 2021, 13(16), 9155; https://doi.org/10.3390/su13169155
Submission received: 13 July 2021 / Revised: 8 August 2021 / Accepted: 11 August 2021 / Published: 16 August 2021

Abstract

:
Since ecosystem services (ESs) have become effective tools for urban planning, spatiotemporal analysis of regional ESs and a deep understanding of the trade-offs among ESs are of great significance to regional governance. In this study, the spatial and temporal changes of four basic ESs were analyzed by combining statistical data with the InVEST model across the Pearl River Delta (PRD) urban agglomeration, China. The trade-offs among the related ESs were analyzed at the urban agglomeration scale and the city scale by correlation analysis. The results showed that: (1) Construction land increased by 6.78% from 2000 to 2018, while cultivated land and forest decreased. (2) Water yield showed an increasing trend, while carbon storage, food production, and habitat quality showed a downward trend from 2000 to 2018. (3) The four ecosystem services were significantly correlated, with synergies existing between water yield and food production, and between habitat quality and carbon storage, while other relationships are trade-offs. What is more, the scale has little influence on the direction of ES trade-off or synergy but influences the degree of the relationship. This empirical evidence on ES relationships in urban agglomerations can provide a reference for the sustainable development of ESs and efficient management of urban agglomerations.

1. Introduction

Ecosystem services (ESs) make an important contribution to human well-being, directly or indirectly [1]. The Millennium Ecosystem Services Assessment [2] divided ESs into four categories: supporting services, provision services, regulation services, and cultural services. This means that ecosystems can not only provide people with food and production materials and regulate the climate and carbon cycle, but can also provide landscape and entertainment services that meet the needs of human spiritual life [2,3]. Different types of ESs have complex interactions, and trade-offs and synergies are two primary relations among them [4]. Trade-offs in ESs mean that one goes up while the other goes down, whereas synergies occur when two ESs either increase or decrease at the same time [5,6]. Understanding the relationships between ESs can help improve the total benefits of ESs [4]. However, certain policies often alter land use simply to meet social and economic development, resulting in an imbalance in ecosystem services [7].
Trade-offs of ESs have attracted considerable attention in recent years because they can provide references for regional management. They can be classified into spatial scale trade-offs, temporal scale trade-offs, and reversibility trade-offs [6,8]. Some spatial management policies are decided by scholars and politicians based on the analysis of spatial trade-offs, such as the water resources spatial compensation project [9] and China’s ecological Redline policy [10]. Long-term observation of ESs and exploration of driving factors can often provide references for ES management [11]; for example, land use change [12], climate change, and human activities [13] are the main factors affecting the trade-offs and synergies of ESs. In addition, trade-offs not only occur across space and time but also occur at different scales; for example, trade-offs of ESs on a small scale can be transformed into synergies on a large scale [14]. Trade-offs in ESs have been studied at multiple scales, such as countries [15], watersheds [14], towns [16], cities, and counties [17]. However, to our knowledge, few studies have analyzed ES trade-offs at the scale of urban agglomerations, and the comparative study of trade-offs among ESs between urban agglomerations and cities is even rarer.
Urban agglomerations have become the main form of high-quality urbanization in China [18]. Urban agglomerations are composed of a series of neighboring cities, and they contain more components and processes related to the ecosystem, as well as different managers [8]. With rapid urbanization and unplanned human interference, urban areas have attracted much attention due to their ecological sensitivity [19] and will face many environmental problems [20], such as unstable biodiversity maintenance [21], habitat loss [22], water quality decline, and soil erosion [23,24]. In addition, urban agglomerations need to coordinate resources and environmental issues between cities [25]. Therefore, it is necessary to quantify, depict, and identify trade-offs among ESs in urban agglomerations. The Pearl River Delta (PRD) urban agglomeration is one of three major urban agglomerations in China, whose urbanization rate reached 71.4% in 2000, and it still maintained an average annual growth rate of 0.8% until 2016 [12]. This study focuses on the spatiotemporal trade-offs of ESs in the PRD urban agglomeration and compares the trade-offs between urban agglomerations and cities.
Previous studies on trade-offs of ESs in urban agglomerations have explored the relationships between items related to provisioning services and regulation services, such as water yield, soil conservation, carbon storage, and food production [8,26,27]. Supporting services are rarely included in trade-off studies because their contribution to human interaction is not obvious [28]. Supporting services are fundamental to the functioning of ecosystems and can support the effective conservation of biodiversity [29], which has been severely affected by urbanization [30]. Therefore in this study, biodiversity services and three other very important ecosystem services, namely, water production, food production, and carbon storage, were selected to analyze their trade-offs in the PRD.
Specifically, the present study endeavors to achieve the following objectives: (1) examine the land use changes in the PRD during 2000–2018; (2) evaluate the spatiotemporal changes of ESs in the PRD; (3) identify and compare trade-offs among related ESs between urban agglomerations and cities. The findings could provide important references and guidance for decision-making in the management of urban agglomerations and their constituent cities.

2. Study Area and Methods
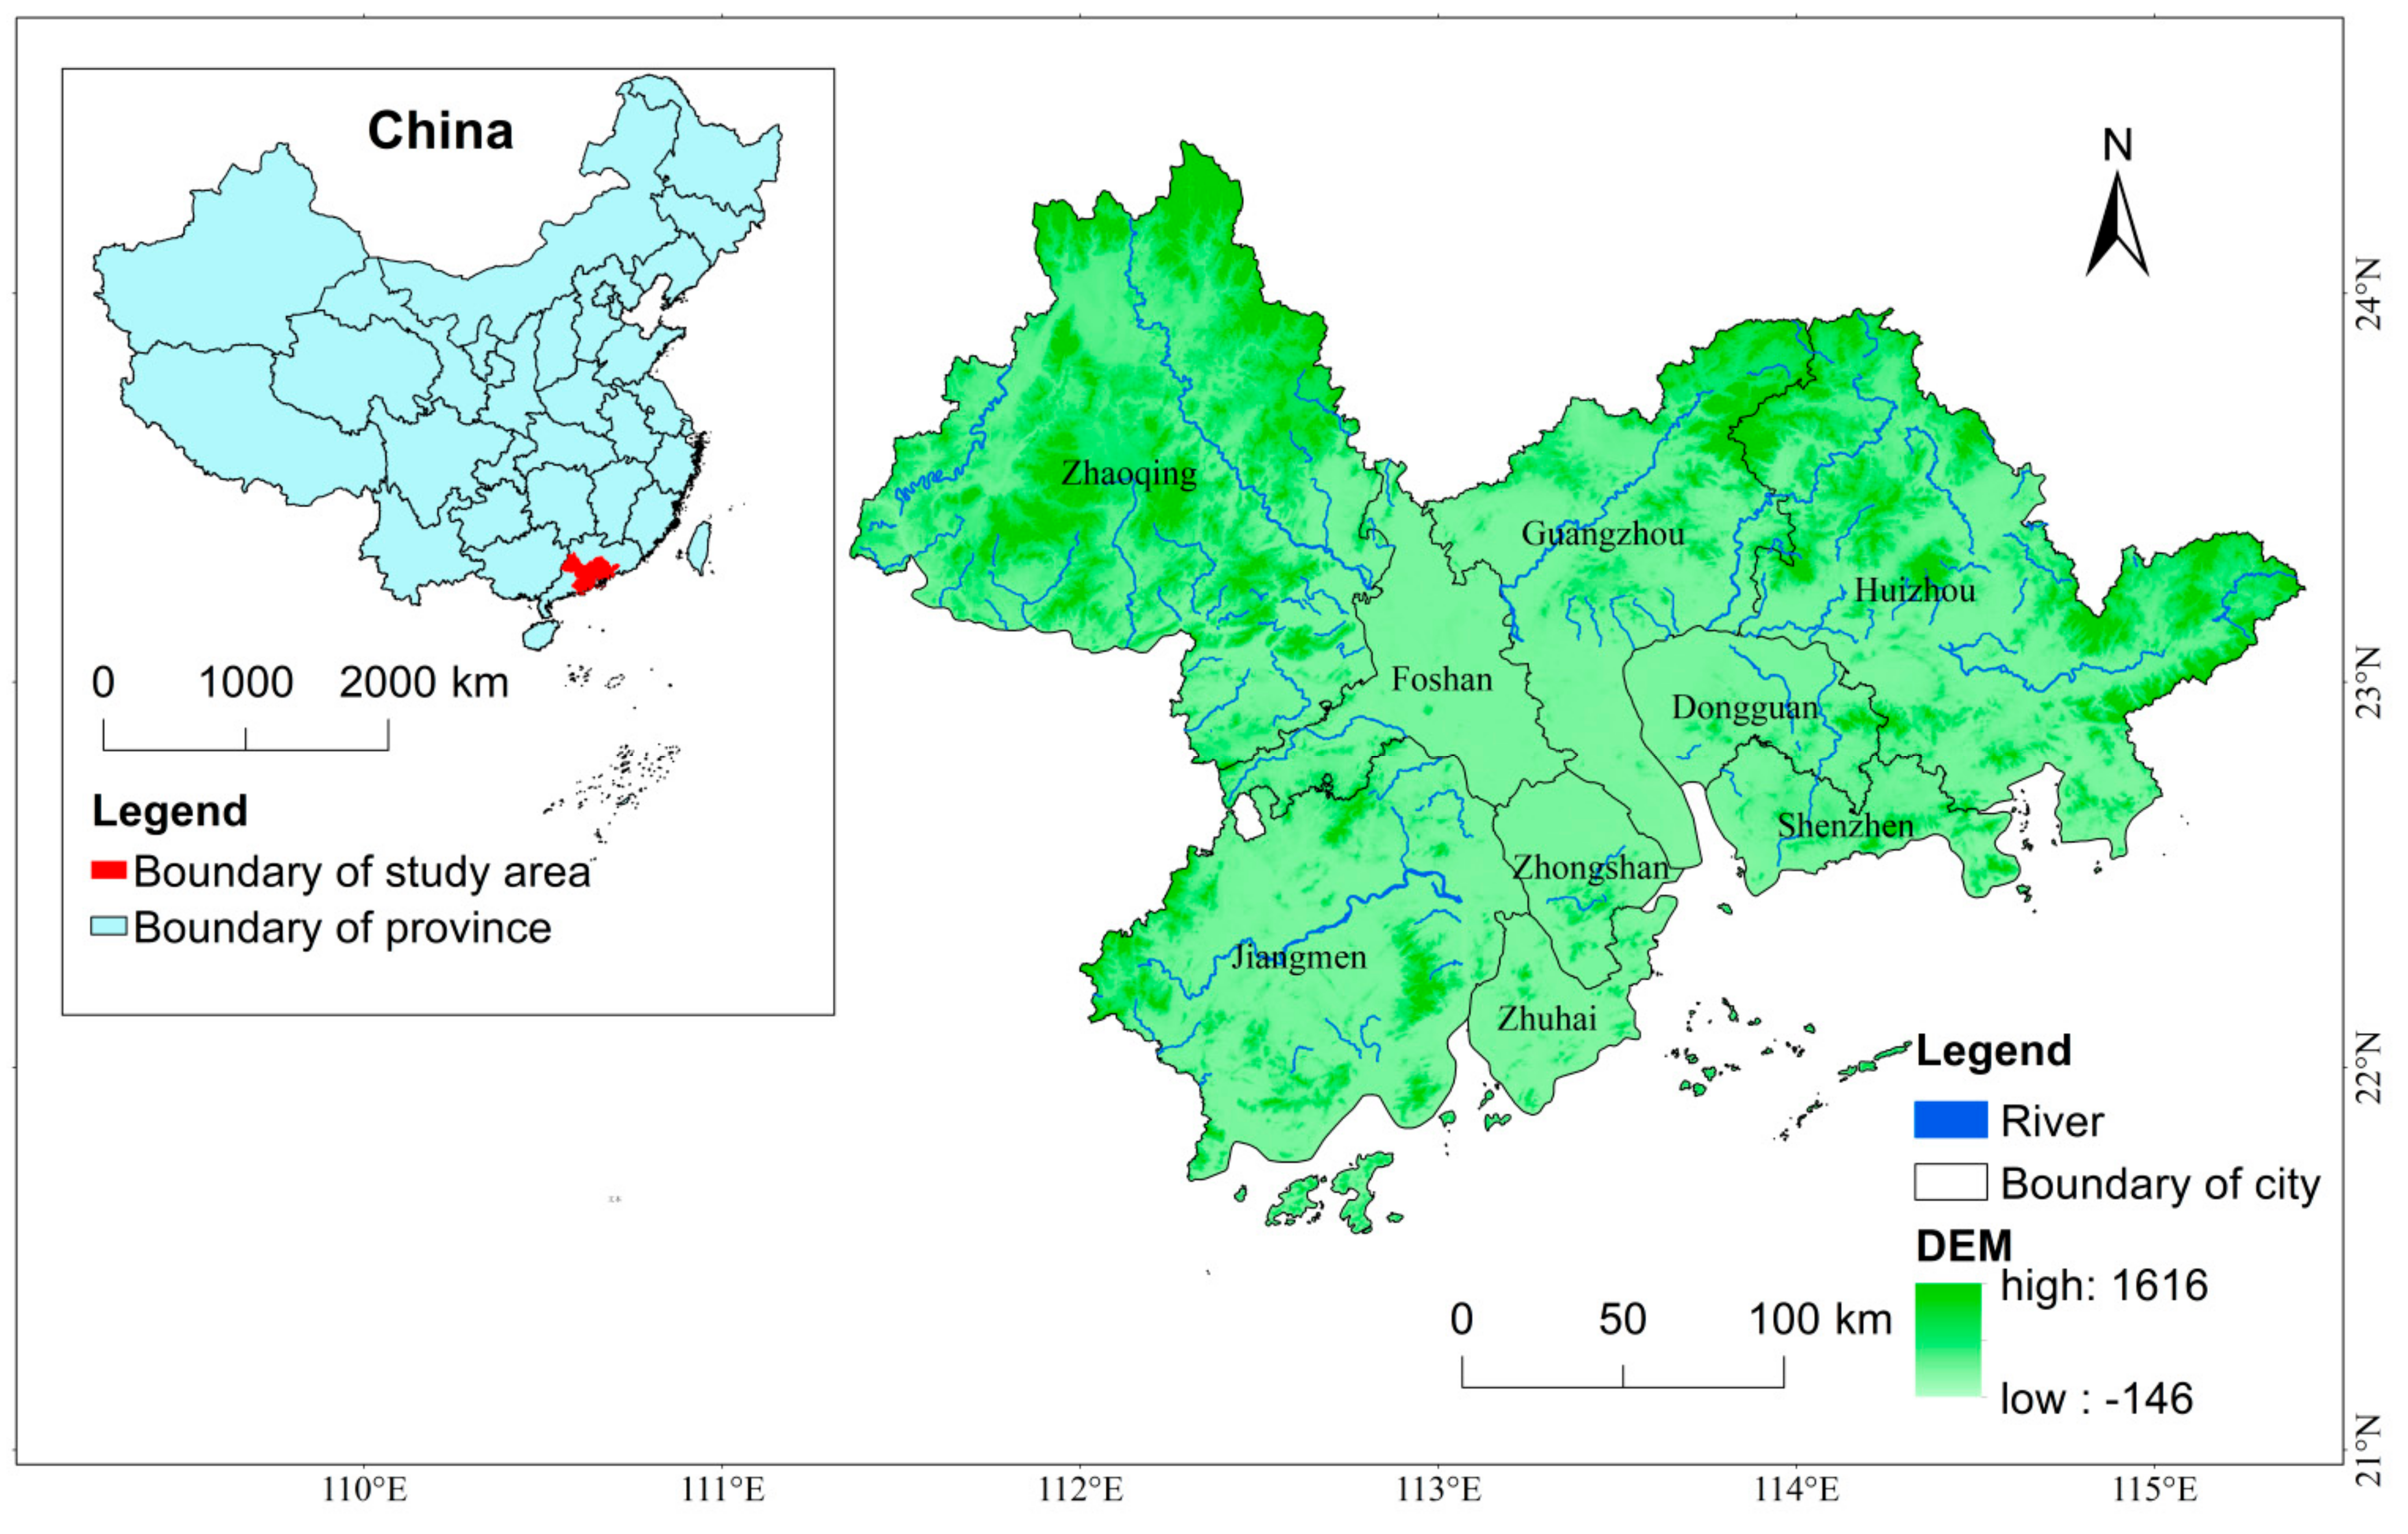
2.1. Study Area

The PRD urban agglomeration is situated in Guangdong Province, South China (21.17°–23.55° N, 111.59°–115.25° E), and it covers approximately 55,368.7 km2 [31]. The nine cities of the region (Guangzhou, Shenzhen, Zhuhai, Foshan, Huizhou, Dongguan, Zhongshan, Jiangmen, and Zhaoqing) are concentrated in the Pearl River Estuary in a “U” shape (Figure 1). The PRD has a subtropical monsoon climate [32], with an average temperature of 21.82 °C.
The PRD is one of the most developed and urbanized regions in China, with a gross domestic product (GDP) of 8044.07 billion CNY and a total permanent population of 63.01 million in 2018 [31]. In the past 20 years, its economic aggregate has expanded by 10 times, and the urbanization process has maintained a relatively rapid growth even after reaching 70% in 2000 (http://stats.gd.gov.cn/kycg/content/post_1425320.html, accessed on 26 January 2018). The PRD region started to build a national forest urban agglomeration in 2016 and formally completed the goal in 2021.

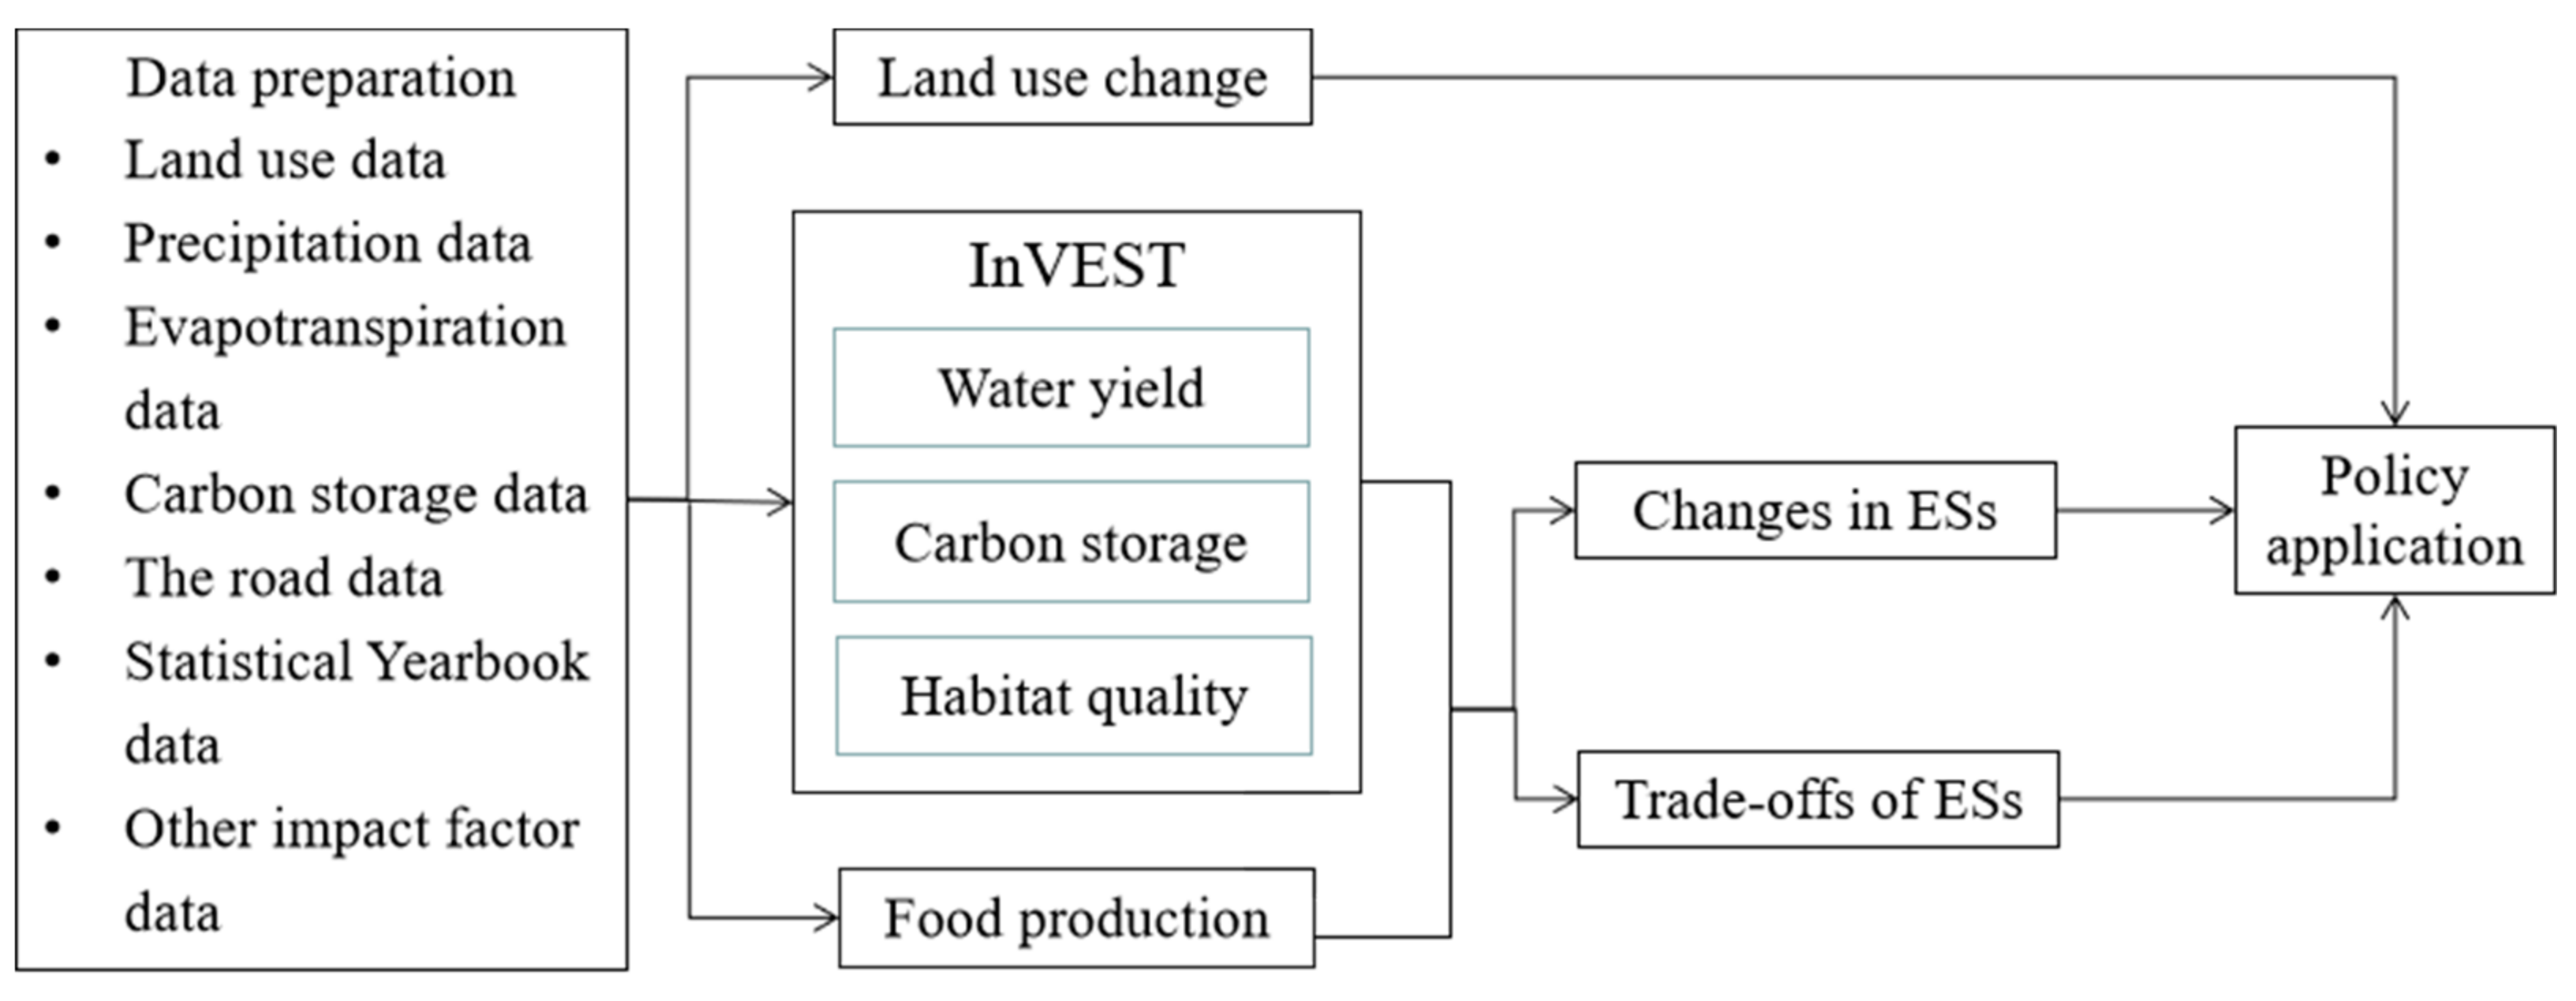
2.2. Data Collection

This study used the InVEST model to evaluate the water yield, carbon storage, and habitat quality, which requires multiple data to be inputted. The data source and processing method are summarized in Table 1. In order to ensure the reliability of the model, the calculated results in this study were compared with other related studies in the PRD [20,33,34].
Since the Millennium Ecosystem Assessment began in 2001, and also considering the urbanization process of the PRD and the availability of research data, the period of 2000–2018 was selected for analysis of land use change. Based on the Resource and Environment Science and Data Center, land use in the PRD was divided into eight types: cultivated land, forest, grassland, shrubland, wetland, waterbody, construction land, and bare land.

2.3. Quantification of Ecosystem Services

2.3.1. Water Yield

The water yield model in InVEST is based on the principle of water balance and relates to climate, vegetation, soil, and other effects [36]. The following equation was used to calculate the annual water yield in each grid:
Y i = 1 A E T i P i × P i
Yi is the water yield of pixel i (m3/hm); Pi and AETi represent the annual actual precipitation and evapotranspiration on pixel i (mm), respectively. In this study, average annual precipitation and average annual evapotranspiration over 20 years were used; there is no obvious change in rainfall during this period.

2.3.2. Carbon Storage

The carbon storage service is one of the key indicators of climate regulation and gas regulation [37]. In this paper, the carbon storage service is calculated by the carbon storage module method of the InVEST model, and the specific calculation formula is:
Ctot = Cabove + Cbelow + Csoil + Cdead
Ctot (t) is the total carbon storage, and Cabove (t) is the carbon reserve of vegetation on the ground; Cbelow (t) is the carbon reserve of underground vegetation; Csoil (t) is soil carbon reserve; Cdead (t) is carbon reserves of dead organic matter. The specific parameter of carbon pool setting referred to the relevant literature [30,34,38] and the InVEST user guide [36] (Table 2).

2.3.3. Biodiversity Conservation

Habitat quality is a key indicator of biodiversity services [39], and the habitat quality model in InVEST was used to calculate the biodiversity conservation service. The principle is to combine the information of land cover and biodiversity threat factors to generate a habitat quality figure [36]; the calculation formula is shown below:
Q x j = H j × [ 1 D x y z D x y z + k z ]
Hj is the habitat suitability of land use type j; D x y z represents the total threat level of grid element x on land cover type j; z is a normalized constant. k is the half-saturation, which is specified as 0.5 in this study. In this paper, we used construction land, cultivated land, bare land, railway, and highway as threat factors; the specific sensitivity and threat data are in reference to the related literature [40,41,42].

2.3.4. Food Production

In this paper, the yield of food crops was used to evaluate the food production. Paddy, potato, and soybean are the main food crops in the PRD. We used the methods of Liang [4] to assess the food production:
F P j = T E P j A j × a j
FPij represents the food production of grid i in city j (kg); TEPj is the total food production in city j; Aj is the area of cultivated land in city j (m2), and aj is the cultivated area for pixel i in city j, which equals 900 m2 in this study.

2.4. Trade-Off Analysis

Spearman correlation analysis was used to determine the pairwise relationships of ESs in this research, while significance tests were used to confirm the trade-offs. After passing the significance test (p < 0.05) between the two ecosystem services, when the correlation coefficient was positive, it was assumed that there was a synergy between them; otherwise, a trade-off relationship was assumed [24].
We used the sampling tool of ArcGIS to create 3000 random points in the whole PRD for correlation analysis in the urban agglomeration. Then, 300 random points were extracted in every city of the PRD for correlation analysis in cites. Finally, we compared the degree of trade-offs and synergies between the urban agglomeration and city scales. Considering that food production is evenly distributed among cultivated land in each city due to the method in this study, only the three other ESs’ relationships are analyzed at the city scale. In order to eliminate unit differences among ESs, the value of each ES was standardized by Z-score. SPSS 26 software was used to analyze the relationships among ESs.
The flowchart in Figure 2 summarizes the overall flow of the research.

3. Results

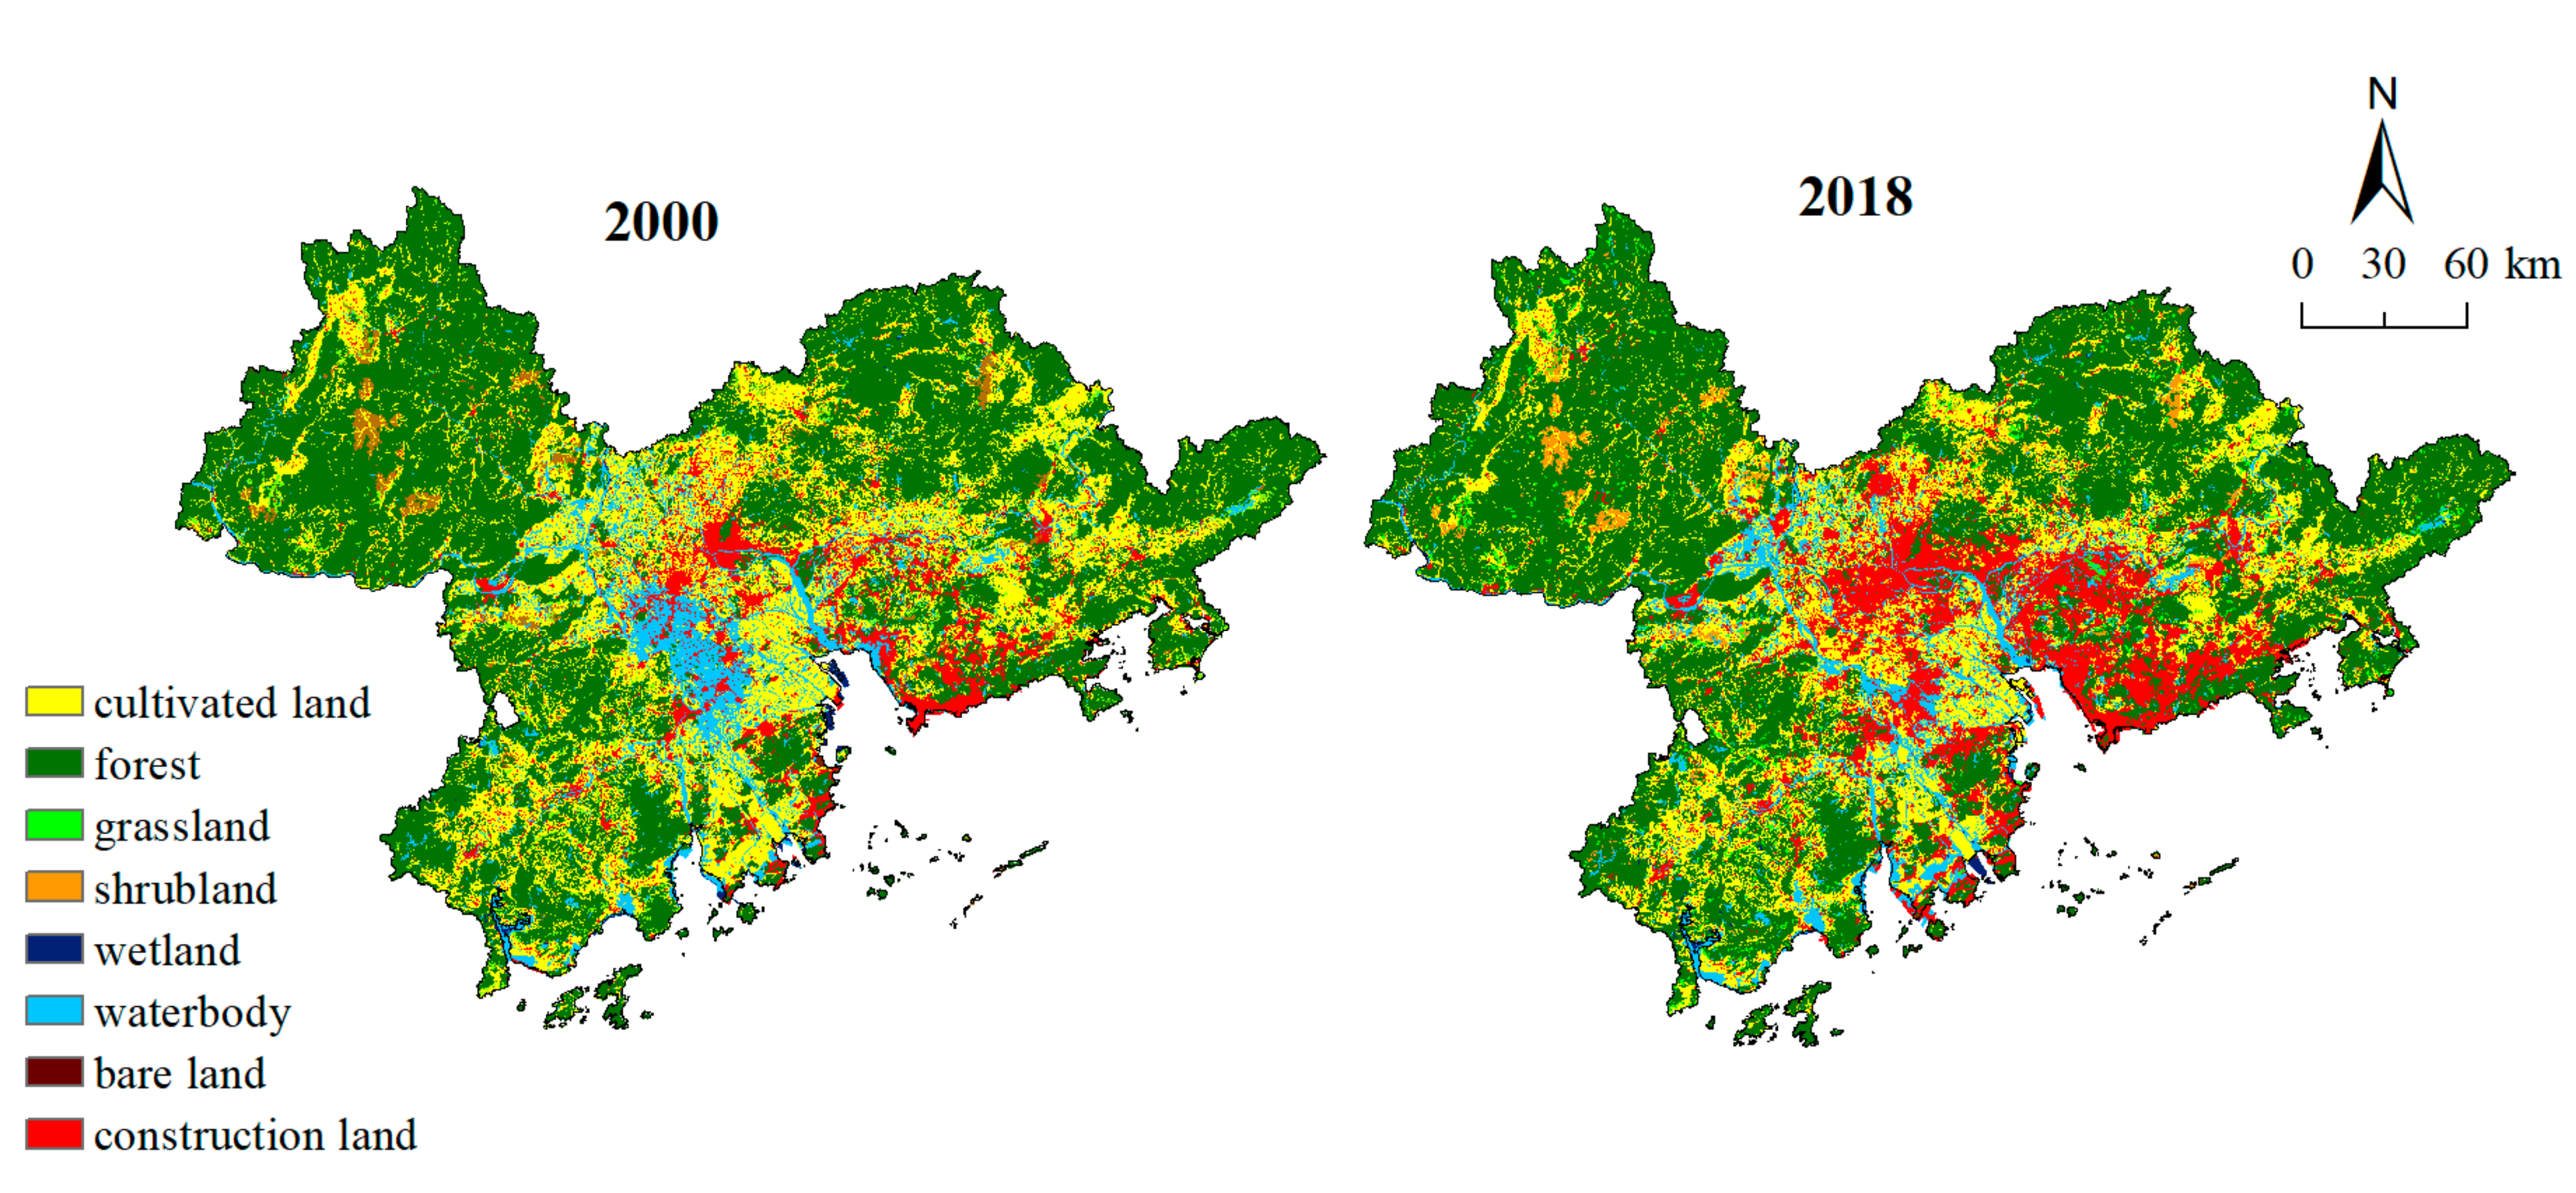
3.1. Land Use Change Pattern
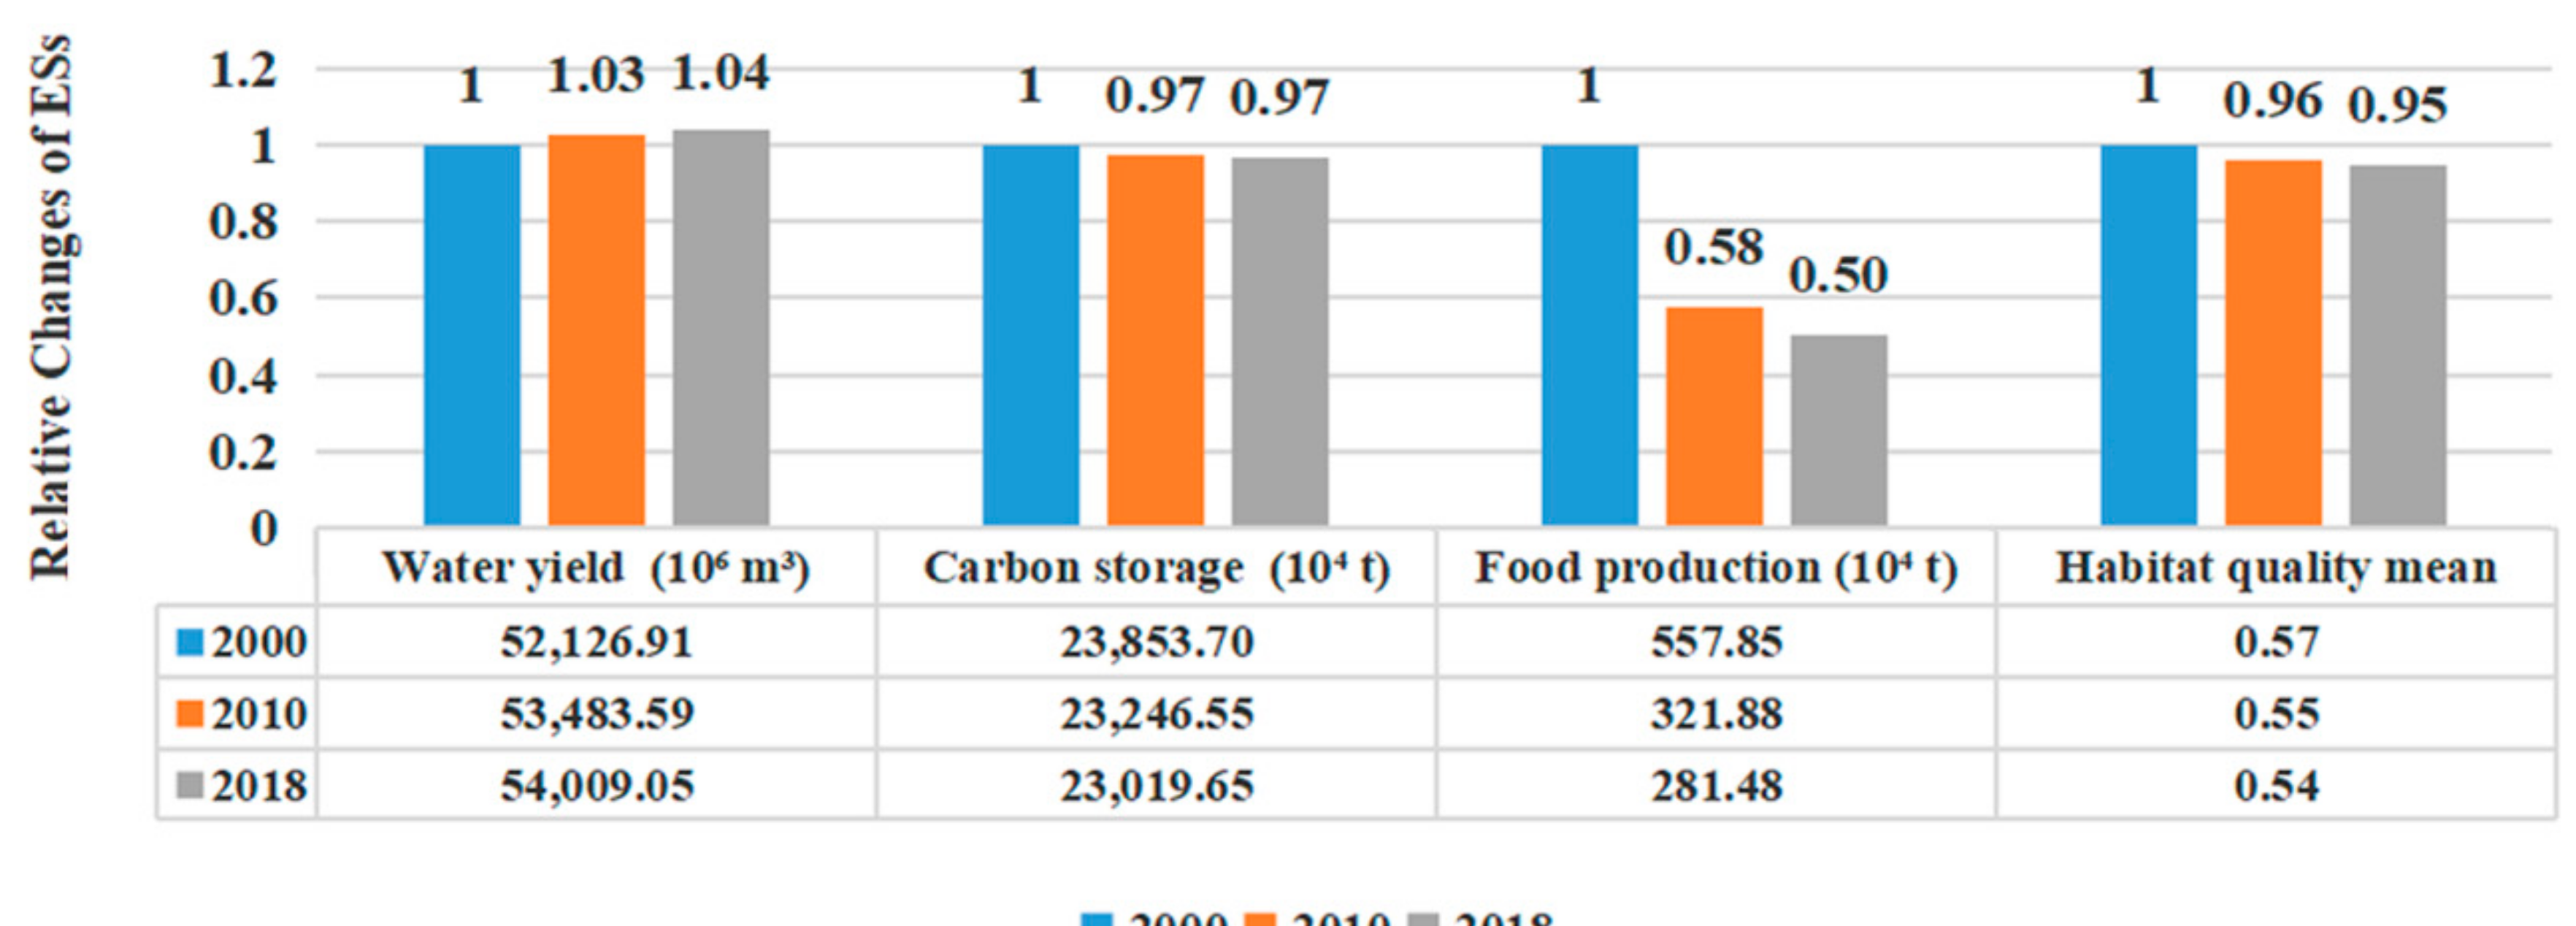
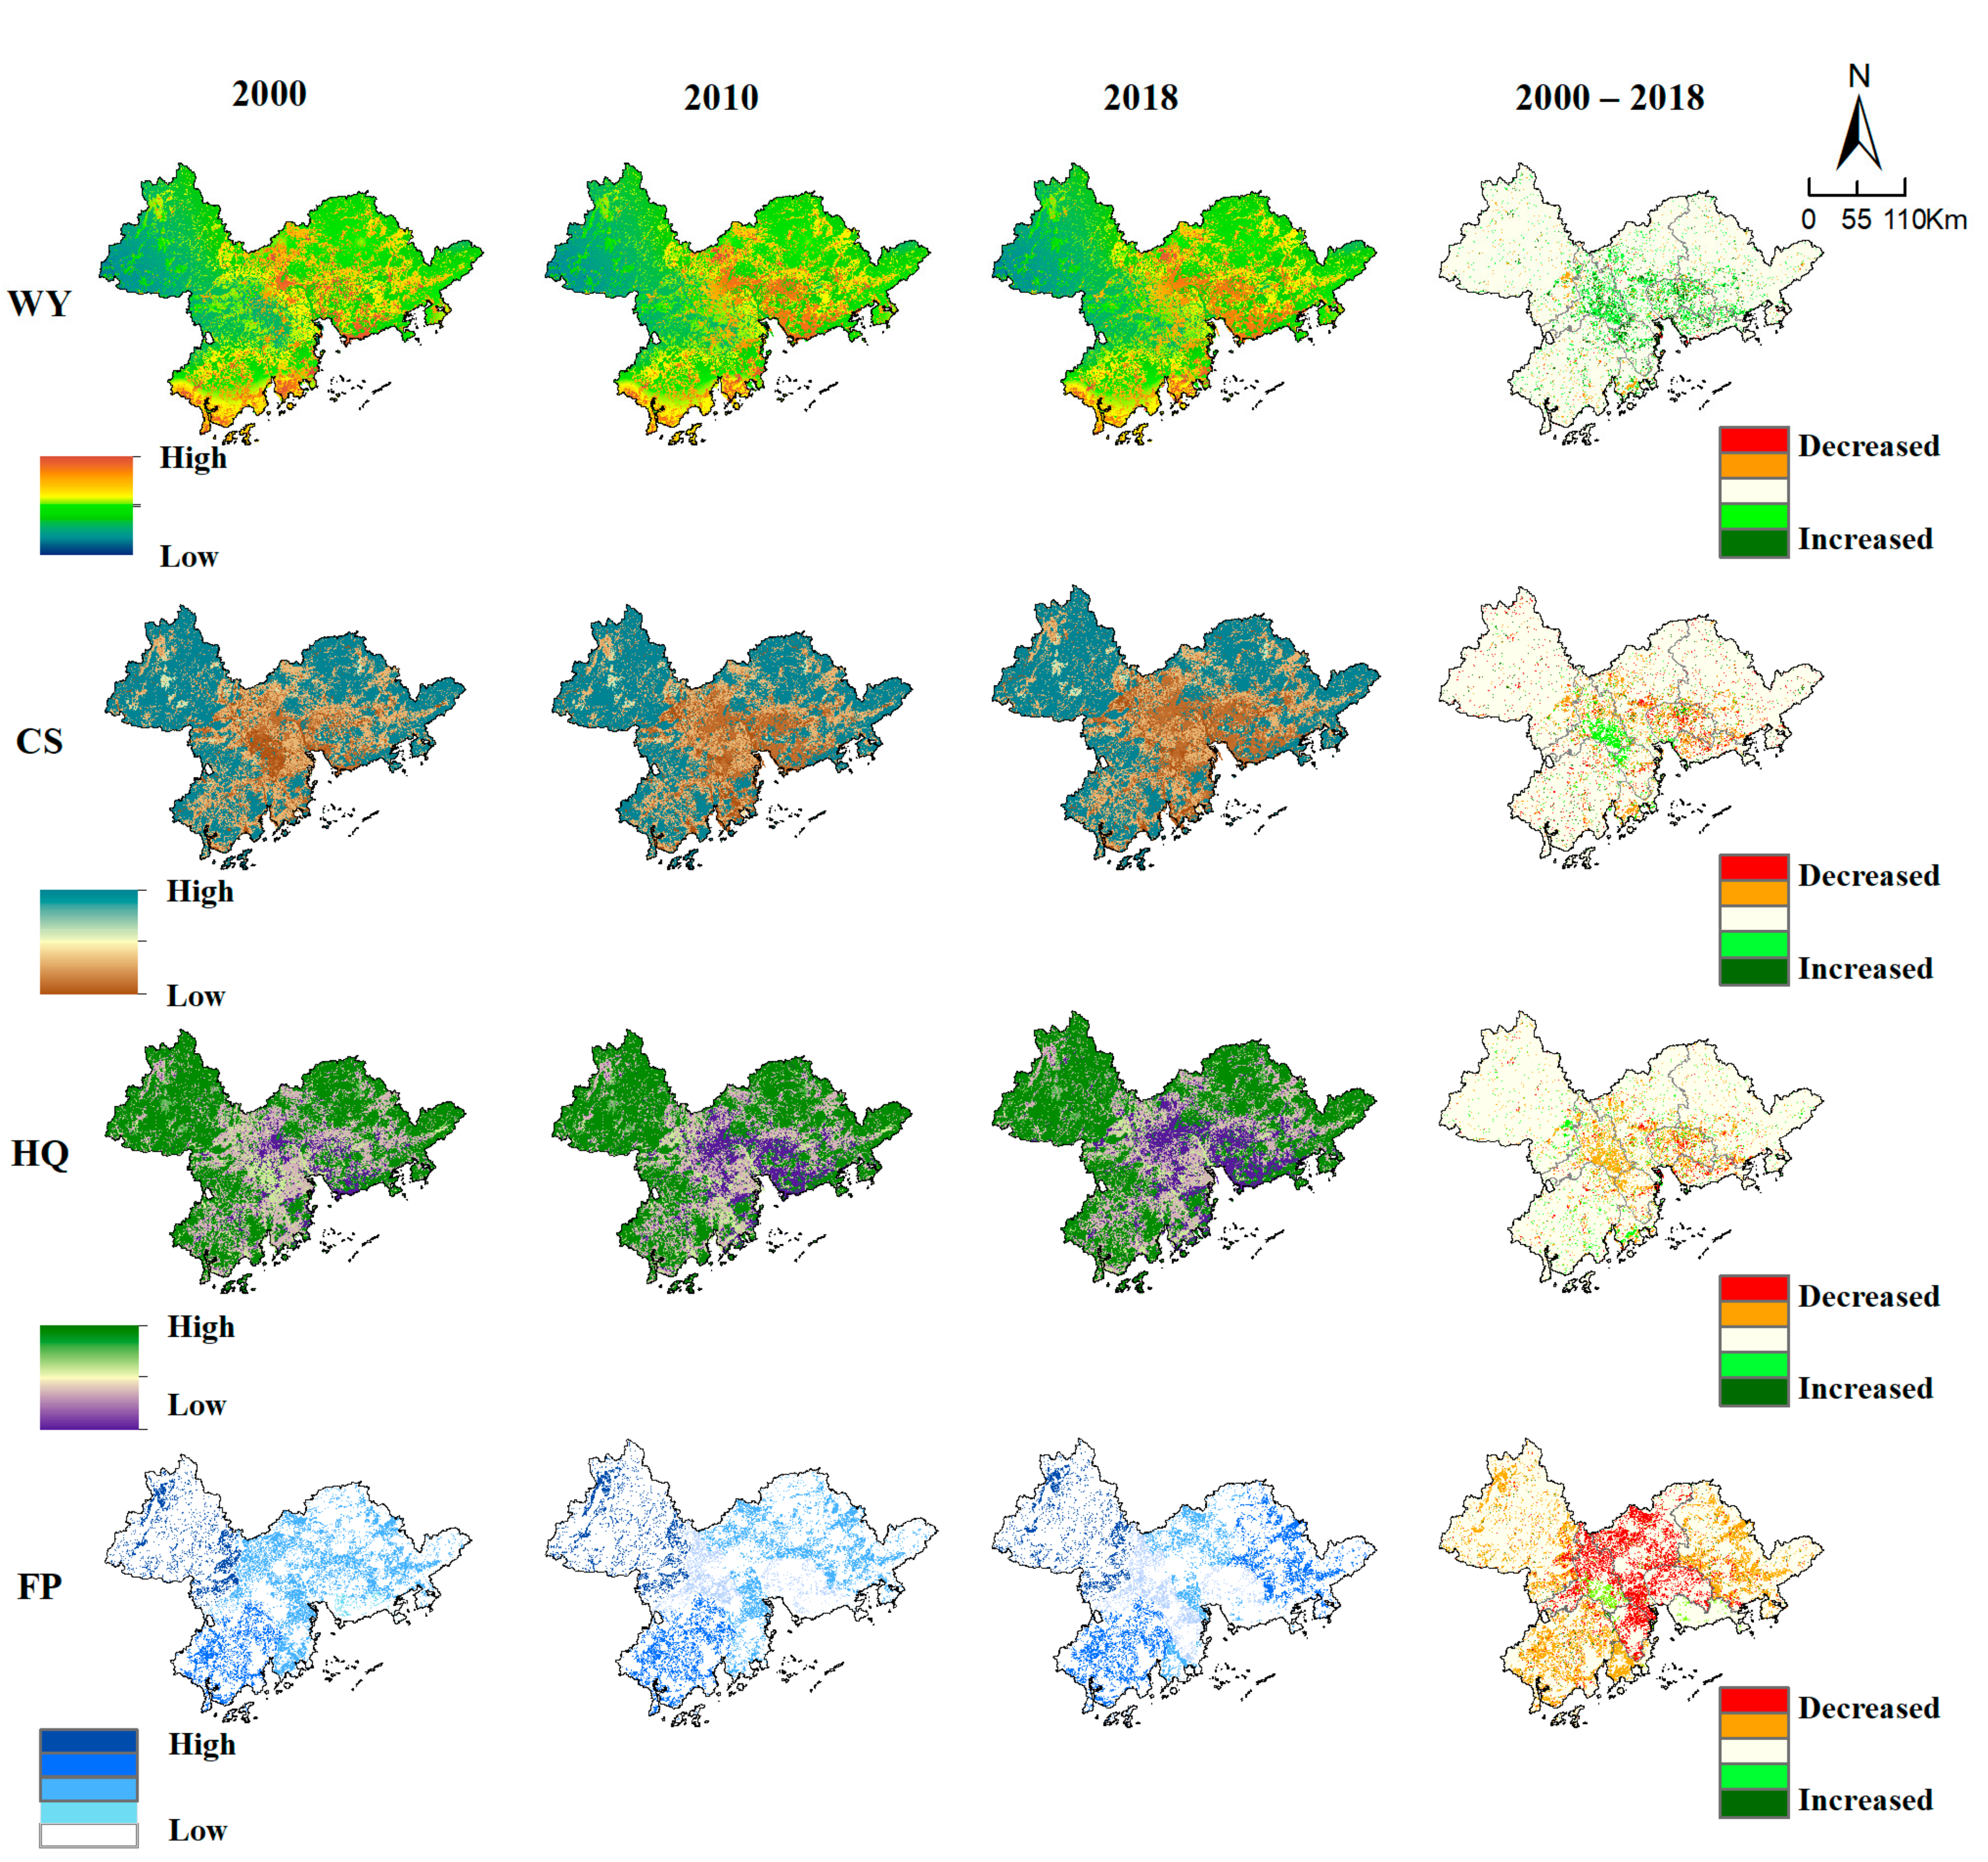
From 2000 to 2018, the two primary land use types in the PRD were forest and cultivated land (Figure 3), which together accounted for more than 70% of the total area, but both of them showed a downward trend in the study period (Table 3). Construction land continued to grow rapidly during this period, which is mainly in the central area of the PRD (Figure 3).
From 2000 to 2010, except for construction land, the proportion of other types of land decreased. The proportion of construction land showed a 5.15% increase (almost 2851.49 km2). The proportion of cultivated land and wetland decreased by 3.36% and 1.09% respectively. From 2010 to 2018, the cultivated land, forest, wetland, water body, and bare land all reduced, but the rate of decline slowed down. The proportion of grassland, shrubland, and construction land increased slightly. The bare land continued to decrease during the whole time.

3.2. Changes in ESs

3.2.1. Water Yield

The total water yield in the PRD showed an increasing trend during 2000–2018. The total water yield in the PRD in 2000, 2010, and 2018 was 52,126.91 billion m3, 53,483.59 billion m3, and 54,009.05 billion m3 respectively (Figure 4). The water yield in the central and coastal areas of the PRD is higher than in the east and west (Figure 5). From 2000 to 2018, water yield in most areas of the PRD showed little change; the increasing part of water yield is concentrated in the middle, while the decreasing part is scattered (Figure 5). The area of increasing water yield overlapped with the area of increasing construction land, and the evapotranspiration of urban construction land is less than that of other land types [43].

3.2.2. Carbon Storage

The total carbon storage in the PRD displayed a download trend during the study period. From 2000 to 2010, the amount of carbon storage decreased significantly, while the reduction rate of carbon storage decreased in the later period (Figure 4). The carbon storage in the northwest and east of the PRD is higher, while in the middle it is lower (Figure 5). From 2000 to 2018, the reduction in carbon storage is obvious in the central region of the PRD, while there was an increase in the central and southern parts of Foshan, and many increased areas experienced the process of changing waterbodies into farmland.

3.2.3. Food Production

The total food production in the PRD showed a significant downward trend, especially between 2000 and 2010. From 2000 to 2018, the total yield of grain crops in the PRD decreased from 5,578,459 tons to 2,814,791 tons, a decrease of about 50%. From the perspective of spatial distribution, the yield of food crops in Zhaoqing, Jiangmen, and Huizhou is relatively high, with a slight increase during the study period, while the food production of other cities in the Pearl River Delta decreased significantly (Figure 5).

3.2.4. Habitat Quality

The average habitat quality in the PRD decreased from 0.57 to 0.54 from 2000 to 2018 (Figure 4), and the standard deviation of habitat quality increased from 0.27 to 0.30, while a spatial differentiation gradually became obvious. The low-value area of habitat quality is concentrated in the center of the PRD, which mostly overlaps with the urban construction land (Figure 5). During the study period, the areas of decreasing quality were mainly distributed in Guangzhou, Foshan, Zhongshan, Dongguan, and Shenzhen, and there were some increased areas in Zhaoqing and Zhuhai.

3.3. Changes in Trade-Offs

3.3.1. Urban Agglomeration Scale

We found that all four ESs showed positive or negative correlations, significantly. Based on the correlation analysis (Table 4), trade-offs existed between water yield (WY) and habitat quality (HQ), WY and carbon storage (CS), food production (FP) and HQ, and FP and CS, among which the trade-off between WY and HQ is the strongest. There are synergistic relationships between HQ and CS, and WY and FP. From 2000 to 2018, the trade-offs between WY and HQ, and WY and CS increased; however, the trade-offs between FP and HQ, and between FP and CS decreased. Meanwhile, the synergy between FP and WY declined, but the synergy between WY and CS increased. The trade-offs and synergies between food production and the other three ecosystem services all declined from 2000 to 2018.

3.3.2. City Scale

The trade-offs and synergies between ESs changed when evaluated at the city scale (Table 5). Except for Zhongshan and Zhuhai, the trade-off between WY and CS continued to increase from 2000 to 2018 in the other cities. The trade-off in Guangzhou, Shenzhen, and Dongguan was greater than that in the entire PRD urban agglomeration, while the trade-off in other cities was smaller than that in the PRD urban agglomeration. In 2000, there was a weak synergy between WY and CS in Foshan and Zhongshan. After that, the correlation between WY and CS in Foshan changed to a trade-off, but the correlation was not significant in Zhongshan.
A trade-off between water yield and habitat quality also existed in the nine cities. The trade-off degree was lower in Huizhou, Jiangmen, and Zhaoqing than in the PRD urban agglomeration, but higher in the other cities. The relationship between CS and HQ in the nine cities was the same as that in the PRD urban agglomeration, which also increased slightly from 2000 to 2018, except Huizhou and Jiangmen. In Guangzhou and Shenzhen, the degree of synergy between CS and HQ was greater than that of the PRD urban agglomeration, while that of other cities was less than that of the PRD urban agglomeration.

4. Discussion

4.1. Driving Factors of Land Use Change

Human activities are one of the important driving factors of land use change [14]. The construction land grew rapidly from 2000 to 2010, resulting in a significant decrease in cultivated land and forest. Since the PRD is the core area of China’s reform and opening up pilot zone, with rapid economic growth and many preferential economic policies, which have attracted a lot of enterprises and a large number of people, more space for development was needed. Therefore, forest and cultivated land had to be sacrificed as their areas were relatively large and the economic cost of change is relatively low [12,44].
After 2010, with the promulgation of the “Outline of Reform and Development Plan for the Pearl River Delta Region”, and the implementation of actions such as saving land use and a new round of greening Guangdong, the growth rate of construction land decreased significantly. The increase in grassland and shrubland areas during this period may be due to the gradual recognition of the importance of green public space for human health [45].

4.2. Spatiotemporal Changes in ESs

Assessing the spatial differentiation of regional ecosystem services and monitoring their temporal variation can help to deeply understand how the quantity and quality have changed and to promote more effective local land use planning [11]. In this study, some loss in HQ, FP, and CS appeared, but some gain appeared in WY in the study period. Precipitation and evaporation are the main factors affecting water yield. With the average climate input data used in this study, the differences in land use will be the main factor to explain the differences in spatial distribution and temporal variation of water yield. Previous studies have confirmed that the evaporation of construction land is less than that of vegetation-covered land, and the reduction in forest land is the main factor for less evaporation [46,47].
Forests are important to a wide variety of ESs such as biodiversity conservation and carbon storage, and almost 80% of animals and plants can be found in forests [1,48]. The decline in HQ was similar to that found in previous studies using Google cloud computing in the same area [20]. The spatiotemporal variability of HQ in the PRD was also closely related to forest distribution. The spatial variability of CS in the PRD is similar to the findings of Chen’s [33] study on Pinus massoniana forest in the PRD, which is related to forests and urban construction land; the construction land surface is not conducive to the accumulation of soil organic carbon [49]. As for food production, change in the area of cultivated land is usually the main factor explaining the change in FP [50]. The decline in the area of cultivated land in the PRD is not enough to explain the precipitous decline of FP. Another important reason is the shift of agriculture in the PRD to leisure suburban farming, where profits are high, rather than large-scale cultivation of food crops [51]. Our diachronic study of ESs in the PRD confirms the impact of urbanization and land use changes on ESs found in previous studies [20,52,53] and provides a new explanation for the change in food production in developed regions.

4.3. Trade-Offs and Scale Effects

It has been shown that the trade-offs or synergies of ecosystem services may change with scale [6,14]. In this study, we evaluated and compared the trade-offs between the urban agglomeration scale and the city scale, and we found that the scale hardly changes the direction of the trade-off or synergy, but it does change the degree of significance. This was partly different from previous studies in the Taihu Lake basin [14], which may be due to the specific ecosystem services we selected. The results indicate that the evaluation of trade-offs among ESs in urban agglomerations can predict some relationships and trends of the ES trade-offs of its constituent cities. In order to reduce unwanted trade-offs, trade-offs among ESs should be considered in land use management [4].
In this study, trade-offs occurred between WY and HQ, FP and HQ, and FP and CS, which is consistent with previous studies [54,55,56]. The weakening of the trade-offs concerning FP is due to the continuous decrease in cultivated land. CS and HQ improved slightly with the decrease in fertilizer application [24,55], while the same relationship was found between WY and CS, which was similar to the findings of a previous study in the Ha-Chang urban agglomeration [27], but different from the study of Zhou [34] (this was since carbon storage in dead biomass was ignored in the research). Synergies occurred between WY and FP, and HQ and CS, which is similar to the findings of previous studies in other regions, even with other methods (SWAT) [24,56,57]. The weakening of the synergistic relationship between WY and FP is also related to the substantial decrease in FP.

4.4. Implications and Limitations

For appropriate regional management, planners and managers should not only consider the changes of ESs but also consider the trade-offs among ESs at different scales. Given the importance of the forest in ESs and the trade-off relationships, forest protection should be constantly emphasized. Although forestland protection in the PRD has been vigorously carried out, the gradual dredging of interconnections between cities in the urban agglomeration will continue to challenge the integrity of forests. The establishment of forest reserves and forest parks can protect the integrity of forest patches, and the construction of urban forest ecological corridors will enhance forest connectivity, improve HQ, and protect biodiversity, as well as enhance CS and promote and contribute to the carbon neutrality of urban areas [58,59].
The sharp decline in food production in the PRD cannot be ignored. The current self-sufficiency rate of grain is less than 30%. Therefore, the capacity of local people to produce food for themselves should be valued to protect against threats to food imports, such as COVID-19 and other natural disasters [24]. Targets for farmland protection must be set, and the construction of shelterbelts on farmland could be another effective way to combine production increase with habitat conservation goals [60].
This study only compares the trade-offs of the three kinds of services at the scale of cities and urban agglomerations, and only finds the differences in the degree of trade-offs or synergies. However, ESs consist of a variety of service evaluation indicators. Future studies will analyze more trade-offs of ESs at different scales, and the correlation directions at different scales may be different. Another limitation is that the InVEST model only takes into account precipitation and evaporation in the calculation of water yield, without considering topography and surface run-off. Ecosystem service trade-offs may differ when surface run-off is included, which is worth further exploration in future studies.

5. Conclusions

We analyzed the temporal and spatial variation of four ESs in the PRD and compared the trade-offs among ESs at the urban agglomeration scale and the city scale. We provided a floor diagram of the research; the InVEST model and correlation analysis were used. During the past 18 years, the land use changed faster during 2000–2010 but slower in the later period, the construction land increased by 6.78% (almost 3764.0 km2), while the amount of cultivated land and forest decreased by 3.79% and 1.80%, respectively. The water yield increased, while carbon storage, food production, and average habitat quality decreased in the PRD. The food production decreased most obviously, and land use change was the most direct factor affecting the changes in these ESs. In this study, the effect of scale on the trade-offs among ESs is only manifested in the degree of the relationships. In the PRD, the correlation analysis showed that trade-offs existed between WY and HQ, WY and CS, FP and HQ, and FP and CS, and synergies existed between WY and FP, and HQ and CS. We observed that the trade-offs or synergies associated with FP declined over the study period, which could be attributed to the significant decrease in food production in the PRD. All the results provide references for collaborative management in the PRD. Strategies such as intensive land use, forest protection, forest ecological corridors, and farmland shelterbelts can reduce the externalities of urban sprawl and maintain the sustainability of ecosystem services.

Author Contributions

Data curation, Q.Z.; Formal analysis, Q.Z.; Funding acquisition, S.X.; Investigation, Z.L.; Methodology, Q.Z.; Software, Q.Z.; Supervision, S.X.; Validation, X.S.; Visualization, X.S.; Writing—original draft, Q.Z.; Writing—review and editing, K.Z. All authors have read and agreed to the published version of the manuscript.

Funding

This research was funded by the National Natural Science Foundation of China, Grant No. 41877411.

Conflicts of Interest

The authors declare no conflict of interest.

References

  1. Costanza, R.; d’Arge, R.; De Groot, R.; Farberk, S.; Belt, M. The value of the world’s ecosystem services and natural capital. Nature 1997, 387, 253–260. [Google Scholar] [CrossRef]
  2. Hassan, R.; Scholes, R. Ecosystems and Human Well-Being: Current State and Trends. J. Bacteriol. 2005, 1, 1387–1404. [Google Scholar] [CrossRef]
  3. Filho, W.L.; Barbir, J.; Sima, M.; Kalbus, A.; Nagy, G.J.; Paletta, A.; Villamizar, A.; Martinez, R.; Azeiteiro, U.M.; Pereira, M.J.; et al. Reviewing the role of ecosystems services in the sustainability of the urban environment: A multi-country analysis. J. Clean. Prod. 2020, 262, 121338. [Google Scholar] [CrossRef]
  4. Liang, J.; Li, S.; Li, X.; Li, X.; Liu, Q.; Meng, Q.; Lin, A.; Li, J. Trade-off analyses and optimization of water-related ecosystem services (WRESs) based on land use change in a typical agricultural watershed, southern China. J. Clean. Prod. 2021, 279, 123851. [Google Scholar] [CrossRef]
  5. Haase, D.; Schwarz, N.; Strohbach, M.; Kroll, F.; Seppelt, R. Synergies, Trade-offs, and Losses of Ecosystem Services in Urban Regions an Integrated Multiscale Framework Applied to the Leipzig-Halle Region, Germany. Ecol. Soc. 2012, 17, 22. [Google Scholar] [CrossRef]
  6. Rodríguez, J.P.; Beard, T.D.; Bennett, E.M.; Cumming, G.S.; Cork, S.J.; Agard, J.; Dobson, A.P.; Peterson, G.D. Trade-offs across Space, Time, and Ecosystem Services. Ecol. Soc. 2006, 11, 28. [Google Scholar] [CrossRef] [Green Version]
  7. Fu, B. Ecosystem services: Climate change and policy impacts. Curr. Opin. Environ. Sustain. 2013, 5, 1–3. [Google Scholar] [CrossRef]
  8. Sun, J.; Li, Y.P.; Gao, P.P.; Xia, B.C. A Mamdani fuzzy inference approach for assessing ecological security in the Pearl River Delta urban agglomeration, China. Ecol. Indic. 2018, 94, 386–396. [Google Scholar] [CrossRef]
  9. Romulo, C.L.; Posner, S.; Cousins, S.; Hoyle Fair, J.; Bennett, D.E.; Huber-Stearns, H.; Richards, R.C.; Mcdonald, R.I. Global state and potential scope of investments in watershed services for large cities. Nat. Commun. 2018, 9, 4375. [Google Scholar] [CrossRef] [Green Version]
  10. Bai, Y.; Wong, C.P.; Jiang, B.; Hughes, A.C.; Wang, M.; Wang, Q. Developing China’s Ecological Redline Policy using ecosystem services assessments for land use planning. Nat. Commun. 2018, 9, 3034. [Google Scholar] [CrossRef] [Green Version]
  11. Rimal, B.; Sharma, R.; Kunwar, R.M.; Keshtkar, H.; Baral, H. Effects of land use and land cover change on ecosystem services in the Koshi River Basin, Eastern Nepal. Ecosyst. Serv. 2019, 38, 100963. [Google Scholar] [CrossRef]
  12. Liu, W.; Zhan, J.; Zhao, F.; Yan, H.; Zhang, F.; Wei, X. Impacts of urbanization-induced land-use changes on ecosystem services: A case study of the Pearl River Delta Metropolitan Region, China. Ecol. Indic. 2019, 98, 228–238. [Google Scholar] [CrossRef]
  13. Hao, H.; Li, Y.; Zhang, H.; Zhai, R.; Liu, H. Spatiotemporal variations of vegetation and its determinants in the National Key Ecological Function Area on Loess Plateau between 2000 and 2015. Ecol. Evol. 2019, 9, 5810–5820. [Google Scholar] [CrossRef] [PubMed]
  14. Bai, Y.; Chen, Y.; Alatalo, J.M.; Yang, Z.; Jiang, B. Scale effects on the relationships between land characteristics and ecosystem services—A case study in Taihu Lake Basin, China. Sci. Total Environ. 2020, 716, 137083. [Google Scholar] [CrossRef]
  15. Ruijs, A.; Wossink, A.; Kortelainen, M.; Alkemade, R.; Schulp, C. Trade-off analysis of ecosystem services in Eastern Europe. Ecosyst. Serv. 2014, 4, 82–94. [Google Scholar] [CrossRef]
  16. Karimi, J.D.; Corstanje, R.; Harris, J.A. Bundling ecosystem services at a high resolution in the UK: Trade-offs and synergies in urban landscapes. Landsc. Ecol. 2021, 36, 1817–1835. [Google Scholar] [CrossRef]
  17. Liu, C.F.; Wang, W.T.; Liu, L.C.; Li, P.J. Supply-demand matching of county ecosystem services in Northwest China: A case study of Gulang county. J. Nat. Resour. 2020, 35, 2177–2190. [Google Scholar] [CrossRef]
  18. Cao, G.Z.; Chen, S.C.; Liu, T. Changing spatial patterns of internal migration to five major urban agglomerations in China. Acta Geogr. Sin. 2021, 76, 1334–1349. [Google Scholar] [CrossRef]
  19. Peng, J.; Pan, Y.; Liu, Y.; Zhao, H.; Wang, Y. Linking ecological degradation risk to identify ecological security patterns in a rapidly urbanizing landscape. Habitat Int. 2018, 71, 110–124. [Google Scholar] [CrossRef]
  20. Wang, W.; Wu, T.; Li, Y.; Xie, S.; Han, B.; Zheng, H.; Ouyang, Z. Urbanization Impacts on Natural Habitat and Ecosystem Services in the Guangdong-Hong Kong-Macao “Megacity”. Sustainability 2020, 12, 6675. [Google Scholar] [CrossRef]
  21. Schuldt, A.; Assmann, T.; Brezzi, M.; Buscot, F.; Eichenberg, D.; Gutknecht, J.; Härdtle, H.; He, J.-S.; Klein, A.-M.; Kühn, P.; et al. Biodiversity across trophic levels drives multifunctionality in highly diverse forests. Nat. Commun. 2018, 9, 2989. [Google Scholar] [CrossRef] [Green Version]
  22. Auffret, A.G.; Adam, K.; Jan, P.; Emelie, W. Super-regional land-use change and effects on the grassland specialist flora. Nat. Commun. 2018, 9, 3464. [Google Scholar] [CrossRef]
  23. Camara, M.; Jamil, N.R.; Abdullah, A. Impact of land uses on water quality in Malaysia: A review. Ecol. Process. 2019, 8. [Google Scholar] [CrossRef]
  24. Yang, S.; Bai, Y.; Alatalo, J.M.; Wang, H.; Chen, J. Spatio-temporal changes in water-related ecosystem services provision and trade-offs with food production. J. Clean. Prod. 2021, 286, 12536. [Google Scholar] [CrossRef]
  25. Su, J.; Yin, H.; Kong, F. Ecological networks in response to climate change and the human footprint in the Yangtze River Delta urban agglomeration, China. Landsc. Ecol. 2020, 36, 2095–2112. [Google Scholar] [CrossRef]
  26. Chen, Y.; Lu, H.; Li, J.; Xia, J. Effects of land use cover change on carbon emissions and ecosystem services in Chengyu urban agglomeration, China. Stoch. Environ. Res. Risk Assess. 2020, 34, 1197–1215. [Google Scholar] [CrossRef]
  27. Yu, Y.; Han, L.; Li, M.Y.; Xiang, H.X.; Wang, Z.M.; Zhang, S.D.; Yang, G. Study on the spatial-temporal characteristics of ecosystem services and tradeoffs/synergies in Ha-Chang urban agglomeration. Res. Soil Water Conserv. 2021, 28, 293–300. [Google Scholar] [CrossRef]
  28. Guo, C.Q.; Xu, X.B.; Shu, Q. A review on the assessment methods of supply and demand of ecosystem services. Chin. J. Ecol. 2020, 39, 2086–2096. [Google Scholar] [CrossRef]
  29. Maes, J.; Paracchini, M.L.; Zulian, G.; Dunbar, M.B.; Alkemade, R. Synergies and trade-offs between ecosystem service supply, biodiversity, and habitat conservation status in Europe. Biol. Conserv. 2012, 155, 1–12. [Google Scholar] [CrossRef]
  30. Zhu, C.; Zhang, X.; Zhou, M.; He, S.; Wang, K. Impacts of urbanization and landscape pattern on habitat quality using OLS and GWR models in Hangzhou, China. Ecol. Indic. 2020, 117, 106654. [Google Scholar] [CrossRef]
  31. Statistics Bureau of Guangdong Province. Guangdong Statistical Yearbook; China Statistical Publishing House: Beijing, China, 2019. [Google Scholar]
  32. Li, Z.T.; Yuan, M.J.; Hu, M.M.; Wang, Y.F.; Xia, B.C. Evaluation of ecological security and influencing factors analysis based on robustness analysis and the BP-DEMALTE model: A case study of the Pearl River Delta urban agglomeration. Ecol. Indic. 2019, 101, 595–602. [Google Scholar] [CrossRef]
  33. Chen, H.; Zhang, W.; Gilliam, F.; Liu, L.; Huang, J.; Zhang, T.; Wang, W.; Mo, J. Changes in soil carbon sequestration in Pinus massoniana forests along an urban-to-rural gradient of southern China. Biogeosciences 2013, 10, 6609–6616. [Google Scholar] [CrossRef]
  34. Zhou, R.; Lin, M.; Gong, J.; Wu, Z. Spatiotemporal heterogeneity and influencing mechanism of ecosystem services in the Pearl River Delta from the perspective of LUCC. J. Geogr. Sci. 2019, 29, 831–845. [Google Scholar] [CrossRef] [Green Version]
  35. Xia, X.S.; Pan, Y.Z.; Zhu, X.F.; Zhang, J.S. Regression Correction of Hargreaves-Samani Equation by Monthly under Framework of China’s Agricultural Comprehensive Zoning. Trans. Chin. Soc. Agric. Mach. 2020, 51, 265–274. [Google Scholar] [CrossRef]
  36. Sharp, R.; Douglass, J.; Wolny, S.; Arkema, K.; Bernhardt, J.; Bierbower, W.; Chaumont, N.; Denu, D.; Fisher, D.; Glowinski, K.; et al. InVEST 3.9.0.post195+ug.gbc51afe User’s Guide. The Natural Capital Project, Stanford University, University of Minnesota, The Nature Conservancy, and World Wildlife Fund. 2020. Available online: Https://storage.googleapis.com/releases.naturalcapitalproject.org/invest-userguide/latest/index.html (accessed on 1 August 2021).
  37. Wang, Y.; Pan, J. Building ecological security patterns based on ecosystem services value reconstruction in an arid inland basin: A case study in Ganzhou District, NW China. J. Clean. Prod. 2019, 241, 118337. [Google Scholar] [CrossRef]
  38. Wu, X.Y.; Zhang, Y.L.; Jiang, W.K. Spatio-Temporal Evolution of Ecosystem Carbon Storage in Guangdong-Hong Kong-Macao Greater Bay Area. Landsc. Archit. 2020, 57–63. [Google Scholar] [CrossRef]
  39. Dominik, P.; Gregor, S.; Franz, L.; Thomas, F. Patch occupancy of grassland specialists: Habitat quality matters more than habitat connectivity. Biol. Conserv. 2018, 225, 237–244. [Google Scholar] [CrossRef]
  40. Pan, F.; Ji, C.D. Spatial and Temporal Variation of Service Quality of Habitat Quality Ecosystem in Quanzhou Based on InVEST Model. Geomat. Spat. Inf. Technol. 2019, 42, 151–154. [Google Scholar]
  41. Wang, X.Q.; Wu, C.Z. Habitat Quality Evaluation and Ecotourism Planning Application Based on InVEST Model. J. Chin. Urban For. 2020, 18, 73–82. [Google Scholar] [CrossRef]
  42. Zhou, D.; Tian, Y.; Jiang, G. Spatio-temporal investigation of the interactive relationship between urbanization and ecosystem services: Case study of the Jingjinji urban agglomeration, China. Ecol. Indic. 2018, 95, 152–164. [Google Scholar] [CrossRef]
  43. Han, J.; Zhao, Y.; Wang, J.; Zhang, B.; Zhu, Y.; Jiang, S.; Wang, L. Effects of different land use types on potential evapotranspiration in the Beijing-Tianjin-Hebei region, North China. J. Geogr. Sci. 2019, 29, 922–934. [Google Scholar] [CrossRef] [Green Version]
  44. Arowolo, A.O.; Deng, X.; Olatunji, O.A.; Obayelu, A.E. Assessing changes in the value of ecosystem services in response to land-use/land-cover dynamics in Nigeria. Sci. Total Environ. 2018, 636, 597–609. [Google Scholar] [CrossRef]
  45. Chen, J.; Jiang, B.; Bai, Y.; Xu, X.; Alatalo, J.M. Quantifying ecosystem services supply and demand shortfalls and mismatches for management optimisation. Sci. Total Environ. 2019, 650, 1426–1439. [Google Scholar] [CrossRef]
  46. Li, G.; Zhang, F.; Jing, Y.; Liu, Y.; Sun, G. Response of evapotranspiration to changes in land use and land cover and climate in China during 2001–2013. Sci. Total Environ. 2017, 596–597, 256–265. [Google Scholar] [CrossRef] [PubMed]
  47. Zhang, Y.; Kong, D.; Zhang, X.; Tian, J.; Li, C.C. Impacts of vegetation changes on global evapotranspiration in the period 2003–2017. Acta Geogr. Sin. 2021, 76, 584–594. [Google Scholar] [CrossRef]
  48. UNEP. In Forest-based solutions for accelerating achieve ment of the SDGs. In Proceedings of the Thirteenth Session of the United Nations Forum on the Forest (UNFF13), New York, NY, USA, 7–11 May 2018. [Google Scholar]
  49. Zhang, X.Y.; Chen, X.M.; Wei, H.; Lin, M.Z. Effect to urbanization on soil organic carbon fractions and carbon pool management index in remnant evergreen broad-leave forests of the Pearl River Delta. J. Soil Water Conserv. 2017, 31, 184–190. [Google Scholar] [CrossRef]
  50. Yang, H.L.X. Cultivated land and food supply in China. Land Use Policy 2000, 17, 73–88. [Google Scholar] [CrossRef]
  51. Gaglio, M.; Boschetti, M.; Gissi, E. Bioenergy and ecosystem services trade-offs and synergies in marginal agricultural lands: A remote-sensing-based assessment method. J. Clean. Prod. 2019, 237, 117672. [Google Scholar] [CrossRef]
  52. Hu, S.; Chen, L.; Long, L.I.; Wang, B.; Zhang, T. Spatiotemporal Dynamics of Ecosystem Service Value Determined by Land-Use Changes in the Urbanization of Anhui Province, China. Int. J. Environ. Res. Public Healh 2019, 16, 5104. [Google Scholar] [CrossRef] [Green Version]
  53. Song, X.P.; Hansen, M.C.; Stehman, S.V.; Potapov, P.V.; Alexandra, T.; Vermote, E.; Townshend, J.R. Global land change from 1982 to 2016. Nature 2018, 560, 639–643. [Google Scholar] [CrossRef]
  54. Sun, W.; Li, D.; Wang, X.; Li, R.; Li, K.; Xie, Y. Exploring the scale effects, trade-offs and driving forces of the mismatch of ecosystem services. Ecol. Indic. 2019, 103, 617–629. [Google Scholar] [CrossRef]
  55. Williams, D.R. Optimising the Trade-Offs between Food Production, Biodiversity and Ecosystem Services in the Neotropics. Ph.D. Thesis, University of Cambridge, Cambridge, UK, 4 October 2016. [Google Scholar] [CrossRef]
  56. Wang, B.; Zhao, J.; Hu, X.F. Analysis on trade-offs and synergistic relationships among multiple ecosystem services in the Shiyang River Basin. Acta Ecol. Sin. 2018, 38, 7582–7595. [Google Scholar] [CrossRef]
  57. Volk, M.; Lautenbach, S.; Strauch, M.; Whittaker, G.W. Quantifying tradeoffs between water availability, water quality, food production and bioenergy production in a Central German Catchment. EGU Gen. Assem. Conf. Abstr. 2012, 14, 3364. [Google Scholar]
  58. Speak, A.; Russo, A.; Zerbe, S.; Escobedo, F.J. Total urban tree carbon storage and waste management emissions estimated using a combination of LiDAR, field measurements and an end-of-life wood approach. J. Clean. Prod. 2020, 256, 120420. [Google Scholar] [CrossRef]
  59. Wang, Y.C.; Lin, J.C. Air quality enhancement zones in Taiwan: A carbon reduction benefit assessment. For. Policy Econ. 2012, 23, 40–45. [Google Scholar] [CrossRef]
  60. Shi, X.; Li, Y.; Deng, R. Evaluation method for effect of farmland shelterbelts on crop yield based on RS and GIS. Trans. Chin. Soc. Agric. Eng. 2016, 32, 175–181. [Google Scholar] [CrossRef]
Figure 1. Location of the study area in China.
Sustainability 13 09155 g001
Figure 2. Analytical framework applied in the present study.
Sustainability 13 09155 g002
Figure 3. Land use types in the PRD in 2000 and 2018.
Sustainability 13 09155 g003
Figure 4. Values and relative changes (compared with 2000) of ESs from 2000 to 2018.
Sustainability 13 09155 g004
Figure 5. Changes in four ESs from 2000 to 2018. WY: water yield; HQ: habitat quality; CS: carbon storage; FP: food production.
Sustainability 13 09155 g005
Table 1. Data source and preparation process.
DataData SourceNote
Land use dataGeographic Data Sharing Infrastructure, Resource and Environment Science and Data Center (http://www.resdc.cn)Resolution is 30 m × 30 m
Digital Elevation Model (DEM)Geospatial Data Cloud (http://www.gscloud.cn)Resolution is 30 m × 30 m
Annual average precipitationChina Meteorological Data Center (http://data.cma.cn)Interpolated based on annual data, the grid resolution is 30 m × 30 m
Reference evapotranspirationChina Meteorological Data Center (http://data.cma.cn)Calculated by modified Hargreaves formula in China [35], the grid data are interpolated to 30 m × 30 m
Depth to root restricting layerNational Tibetan Plateau Data Center (http://data.tpdc.ac.cn)Derived from the Harmonized World Soil Database, 1 km × 1 km
Railway and roadsOpen Street Map (https://www.openstreetmap.org/)The vector data are converted to data with a resolution of 15 m × 15 m
Food productionGuangdong Statistical Yearbook (http://stats.gd.gov.cn/)
Table 2. Carbon density for different land use types.
Land Use TypeCaboveCbelowCsoilCdead
Cultivated land61.510.82.2
Forest215.222.5720
Grassland2.19.59.992
Shrubland20.745.199.45.1
Wetland30.75204
Waterbody0000
Construction land10.150
Bare land0150
Table 3. Land use types in the PRD urban agglomeration during 2000–2018.
TypeCultivated LandForestGrasslandShrublandWetlandWaterbodyConstruction LandBare Land
200026.52%53.67%1.97%1.73%0.40%7.76%7.90%0.04%
201023.17%52.58%1.75%1.61%0.31%7.42%13.15%0.02%
201822.74%51.87%2.01%1.64%0.30%6.75%14.68%0.01%
Table 4. Spearman’s correlations between ESs in the PRD.
200020102018
WY–HQ−0.728 **−0.768 **−0.784 **
WY–FP0.533 **0.404 **0.377 **
WY–CS−0.557 **−0.629 **−0.657 **
CS–HQ0.836 **0.849 **0.856 **
HQ–FP−0.612 **−0.486 **−0.448 **
CS–FP−0.503 **−0.398 **−0.372 **
** p < 0.01; WY: water yield; HQ: habitat quality; CS: carbon storage; FP: food production.
Table 5. Spearman’s correlations between ESs in the nine cities.
CityWY–CSWY–HQCS–HQ
200020102018200020102018200020102018
Guangzhou−0.670 **−0.685 **−0.684 **−0.842 **−0.874 **−0.878 **0.840 **0.850 **0.859 **
Shenzhen−0.603 **−0.737 **−0.794 **−0.743 **−0.804 **−0.812 **0.854 **0.893 **0.911 **
Foshan0.240 **−0.267 **−0.315 **−0.744 **−0.875 **−0.889 **0.259 **0.507 **0.538 **
Dongguan−0.304 **−0.344 **−0.339 **−0.879 **−0.886 **−0.882 **0.643 **0.620 **0.610 **
Huizhou−0.713 **−0.689 **−0.716 **−0.673 **−0.664 **−0.681 **0.843 **0.839 **0.842 **
Zhongshan0.210 **0.01-0.069−0.732 **−0.820 **−0.843 **0.358 **0.389 **0.441 **
Zhuhai−0.585 **−0.225 **−0.534 **−0.819 **−0.810 **−0.876 **0.747 **0.568 **0.666 **
Jiangmen−0.427 **−0.482 **−0.505 **−0.457 **−0.481 **−0.505 **0.844 **0.850 **0.848 **
Zhaoqing−0.427 **−0.588 **−0.622 **−0.517 **−0.506 **−0.527 **0.772 **0.767 **0.765 **
** p < 0.01; WY: water yield; HQ: habitat quality; CS: carbon storage. Orange shading indicates that the absolute value is greater than that of the whole PRD, whereas blue shading indicates that the absolute value is less than that of the entire PRD.
Publisher’s Note: MDPI stays neutral with regard to jurisdictional claims in published maps and institutional affiliations.

