
Household Resilience to Food and Nutrition Insecurity in Central America and the Caribbean

 ,
,
Abstract
:1. Introduction
2. Data and Methods
2.1. Data
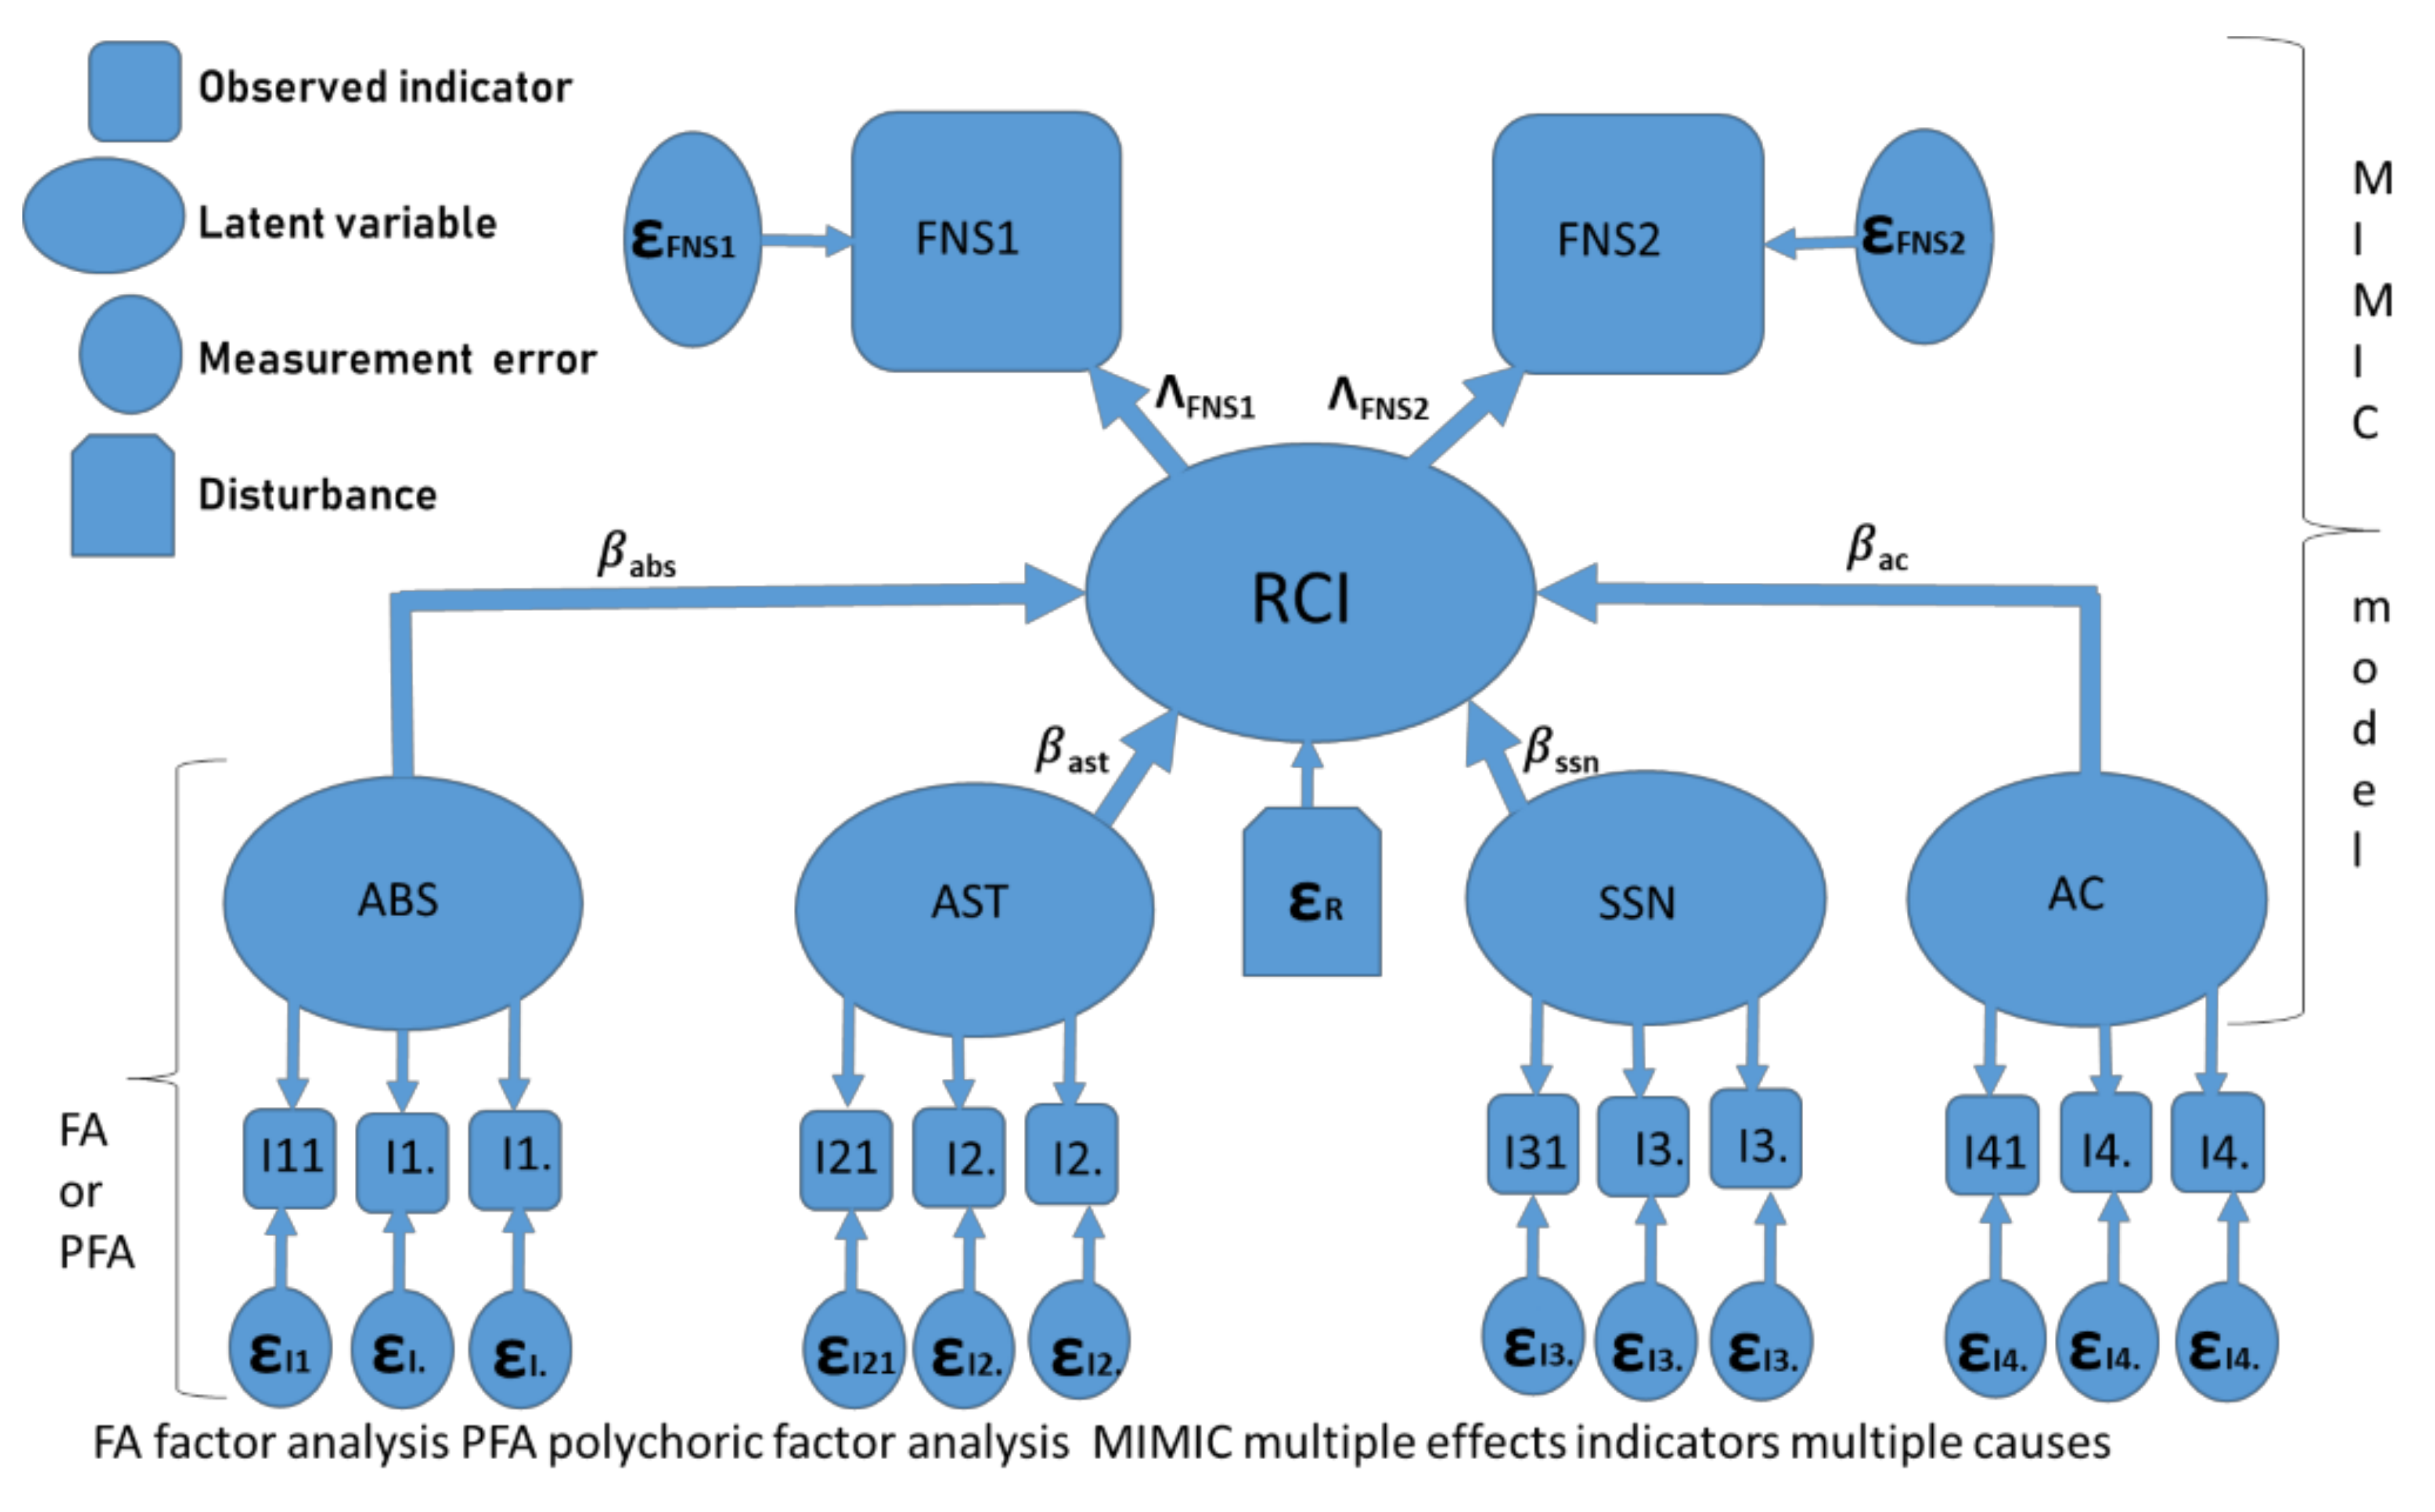
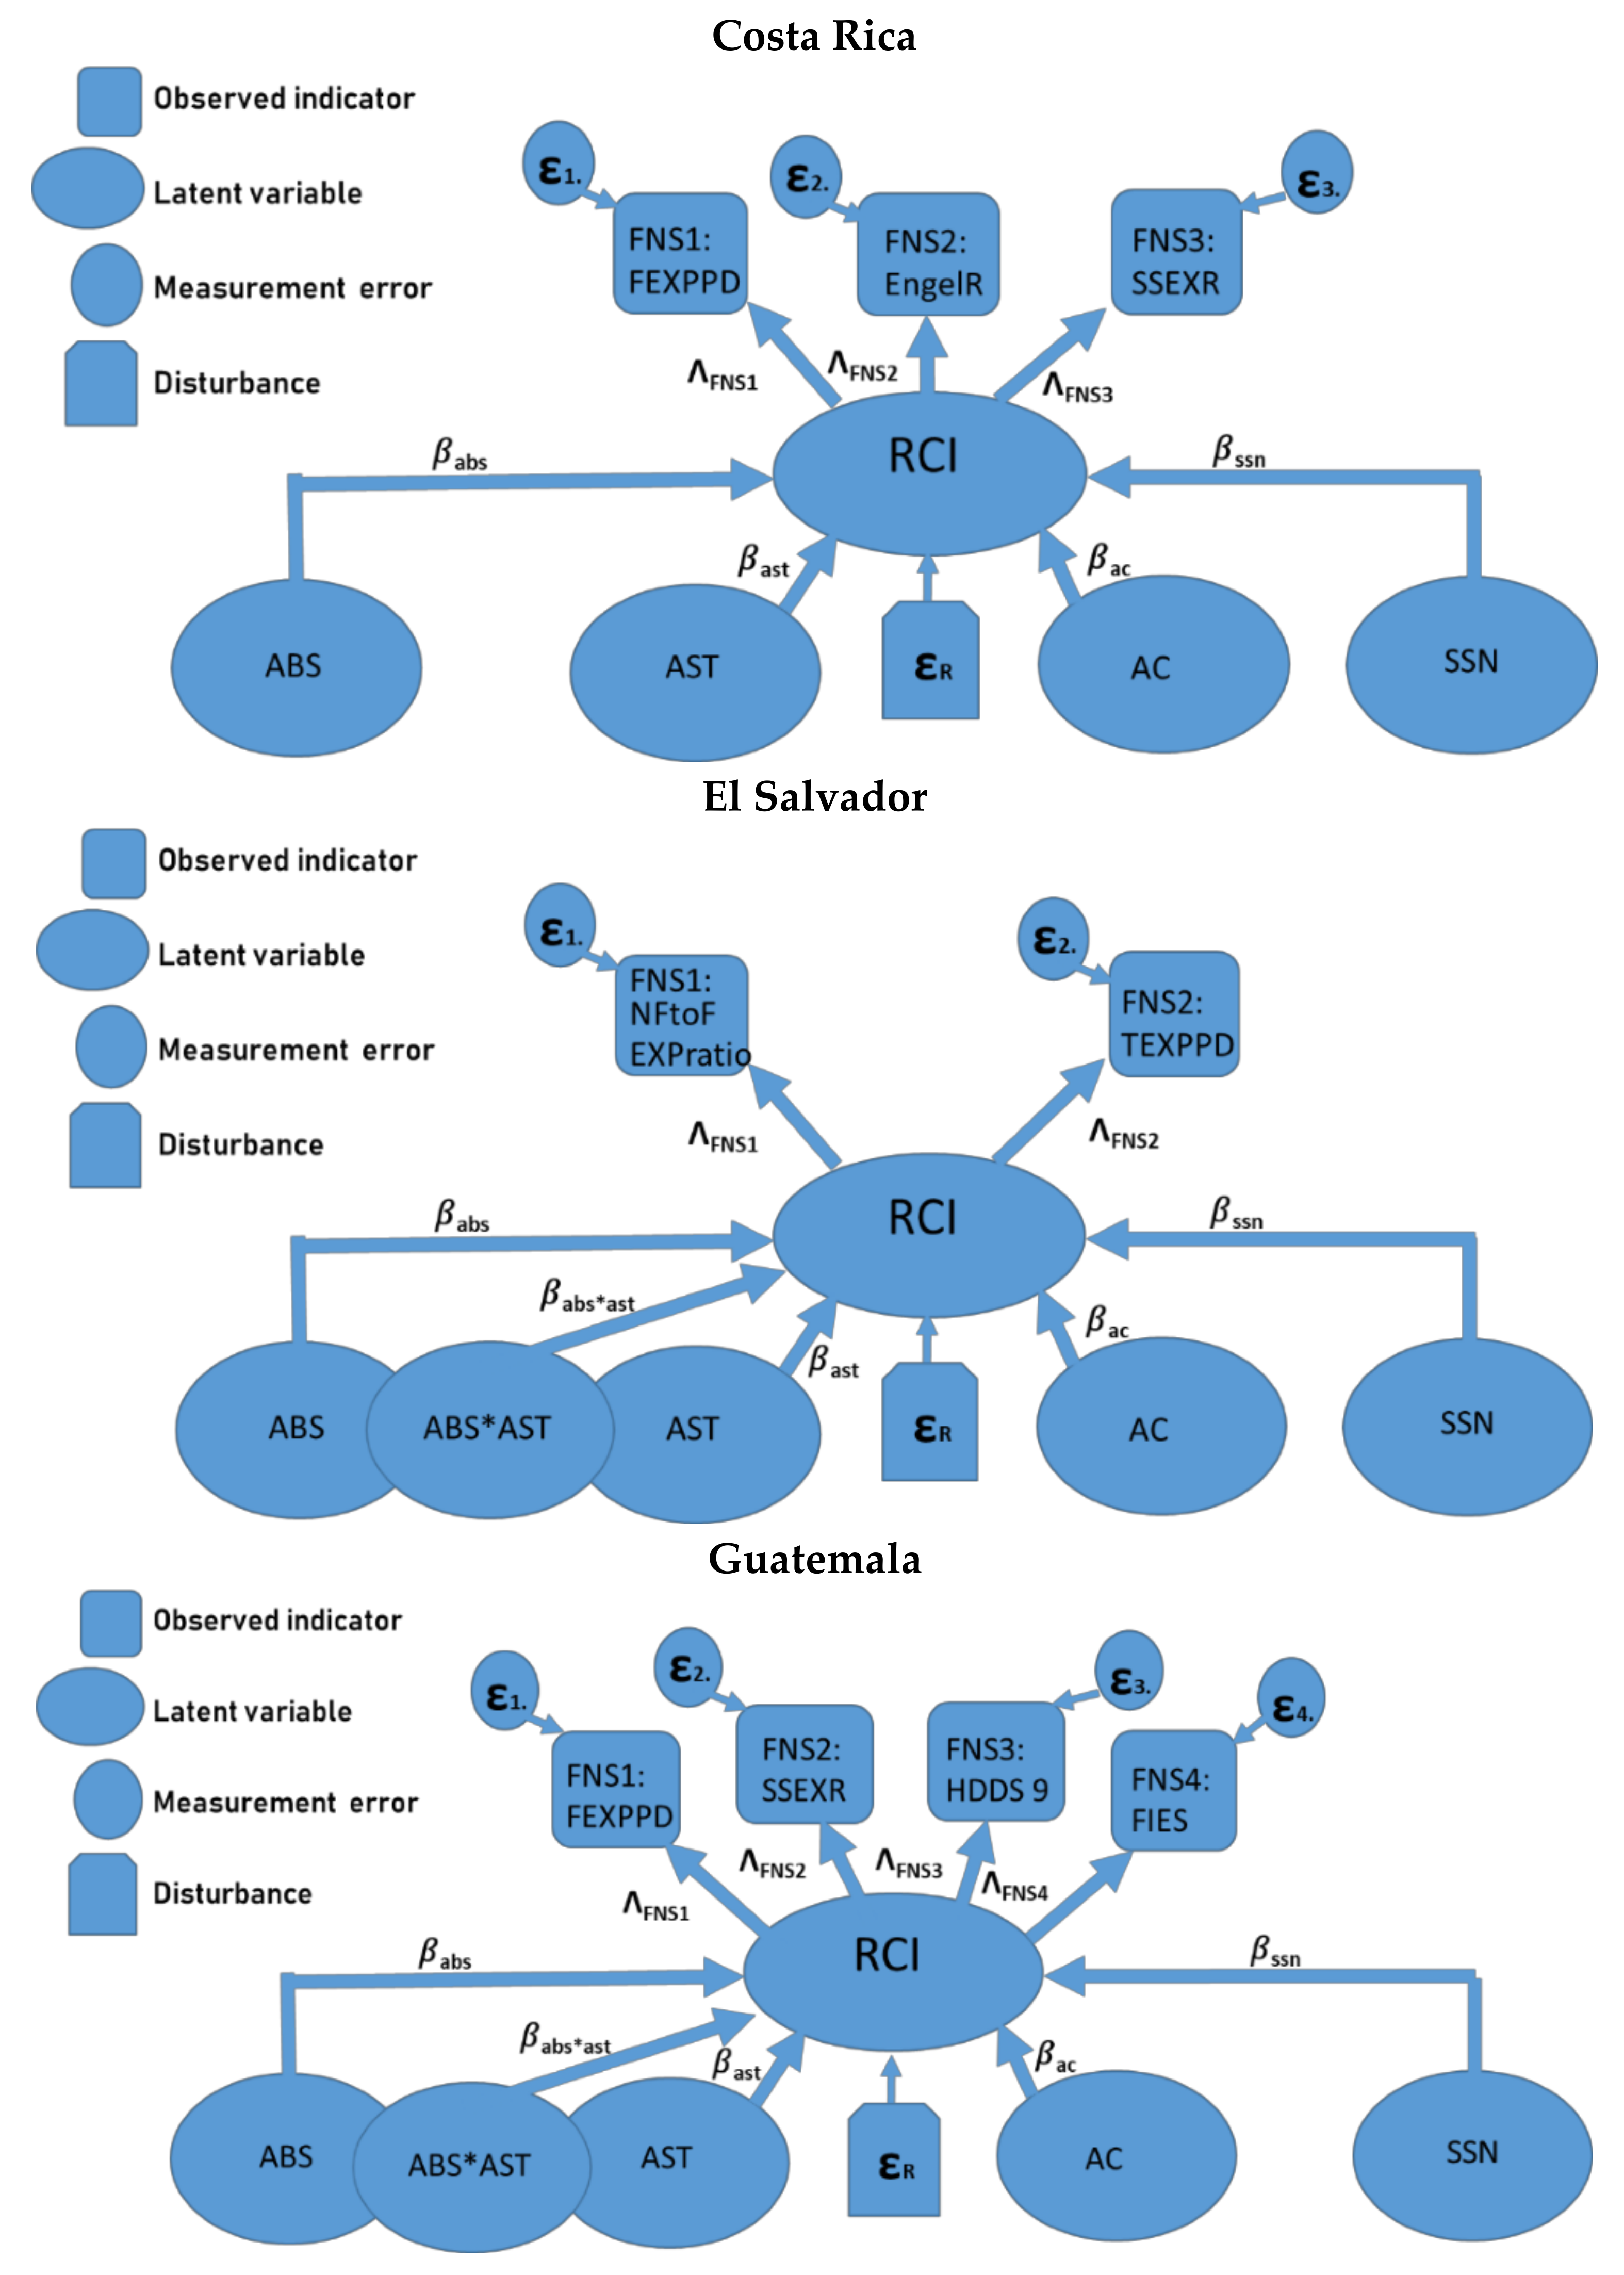
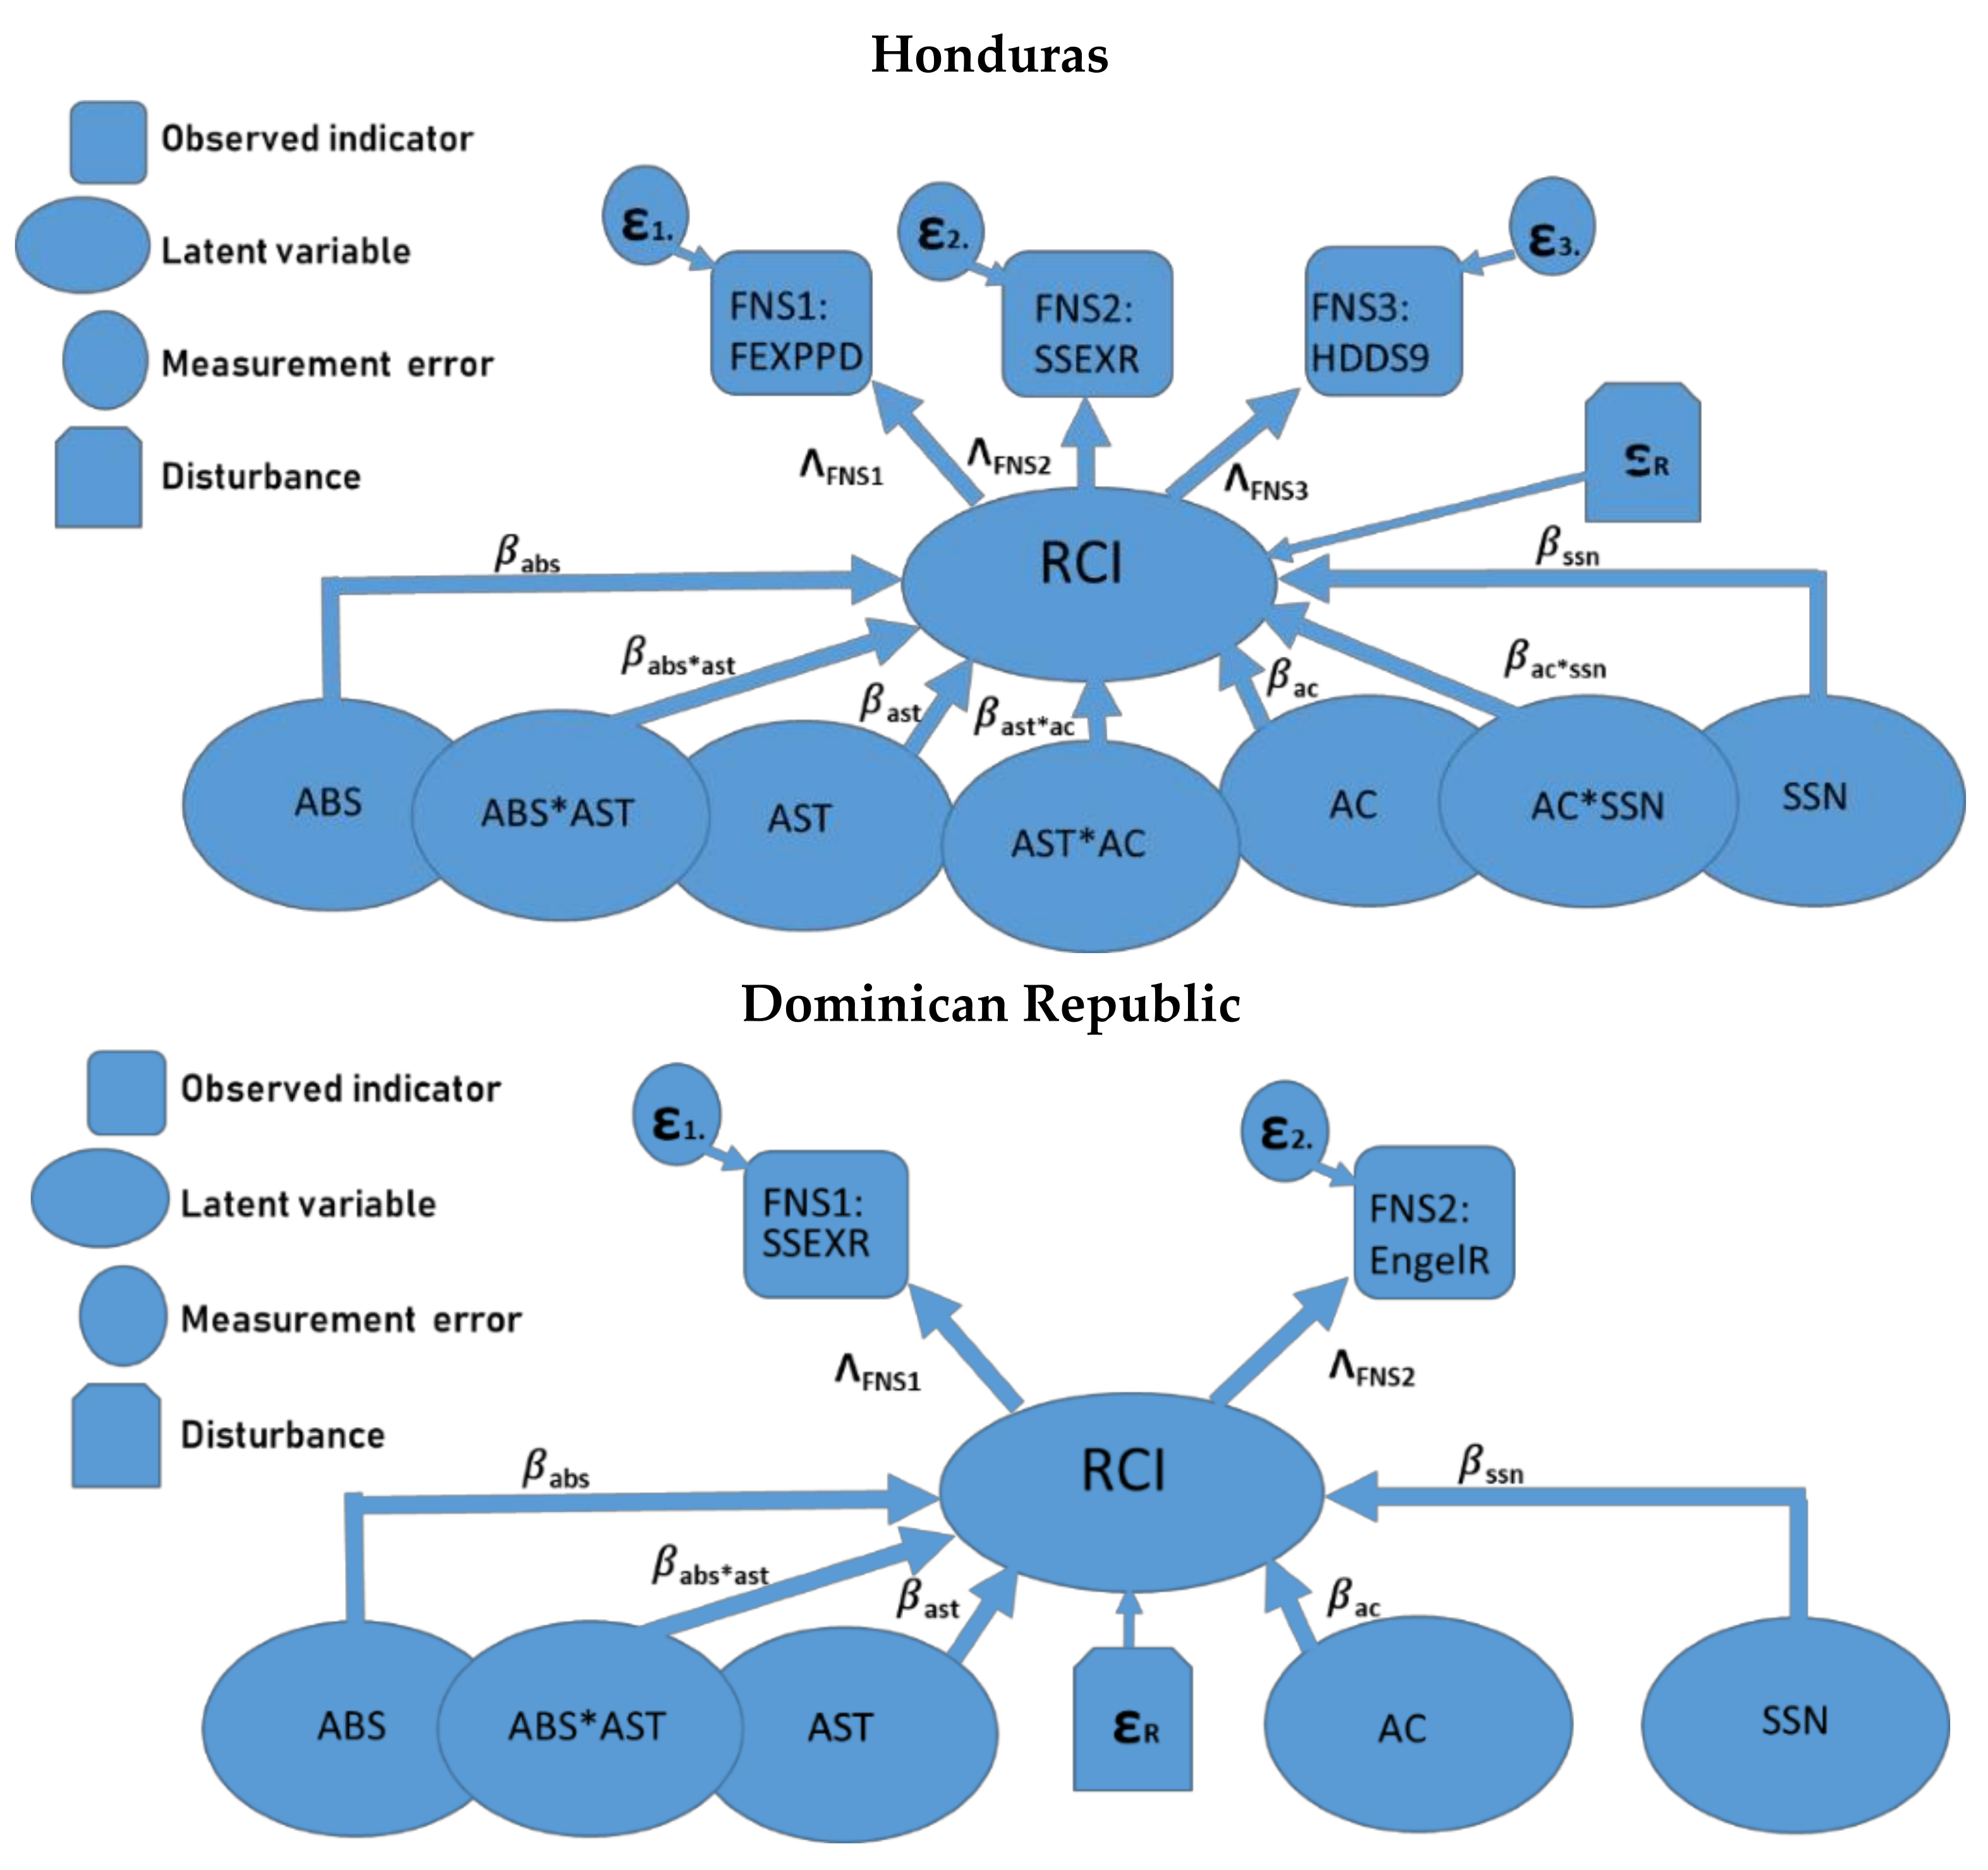
2.2. Methods
3. Results and Discussion
3.1. Description of Results
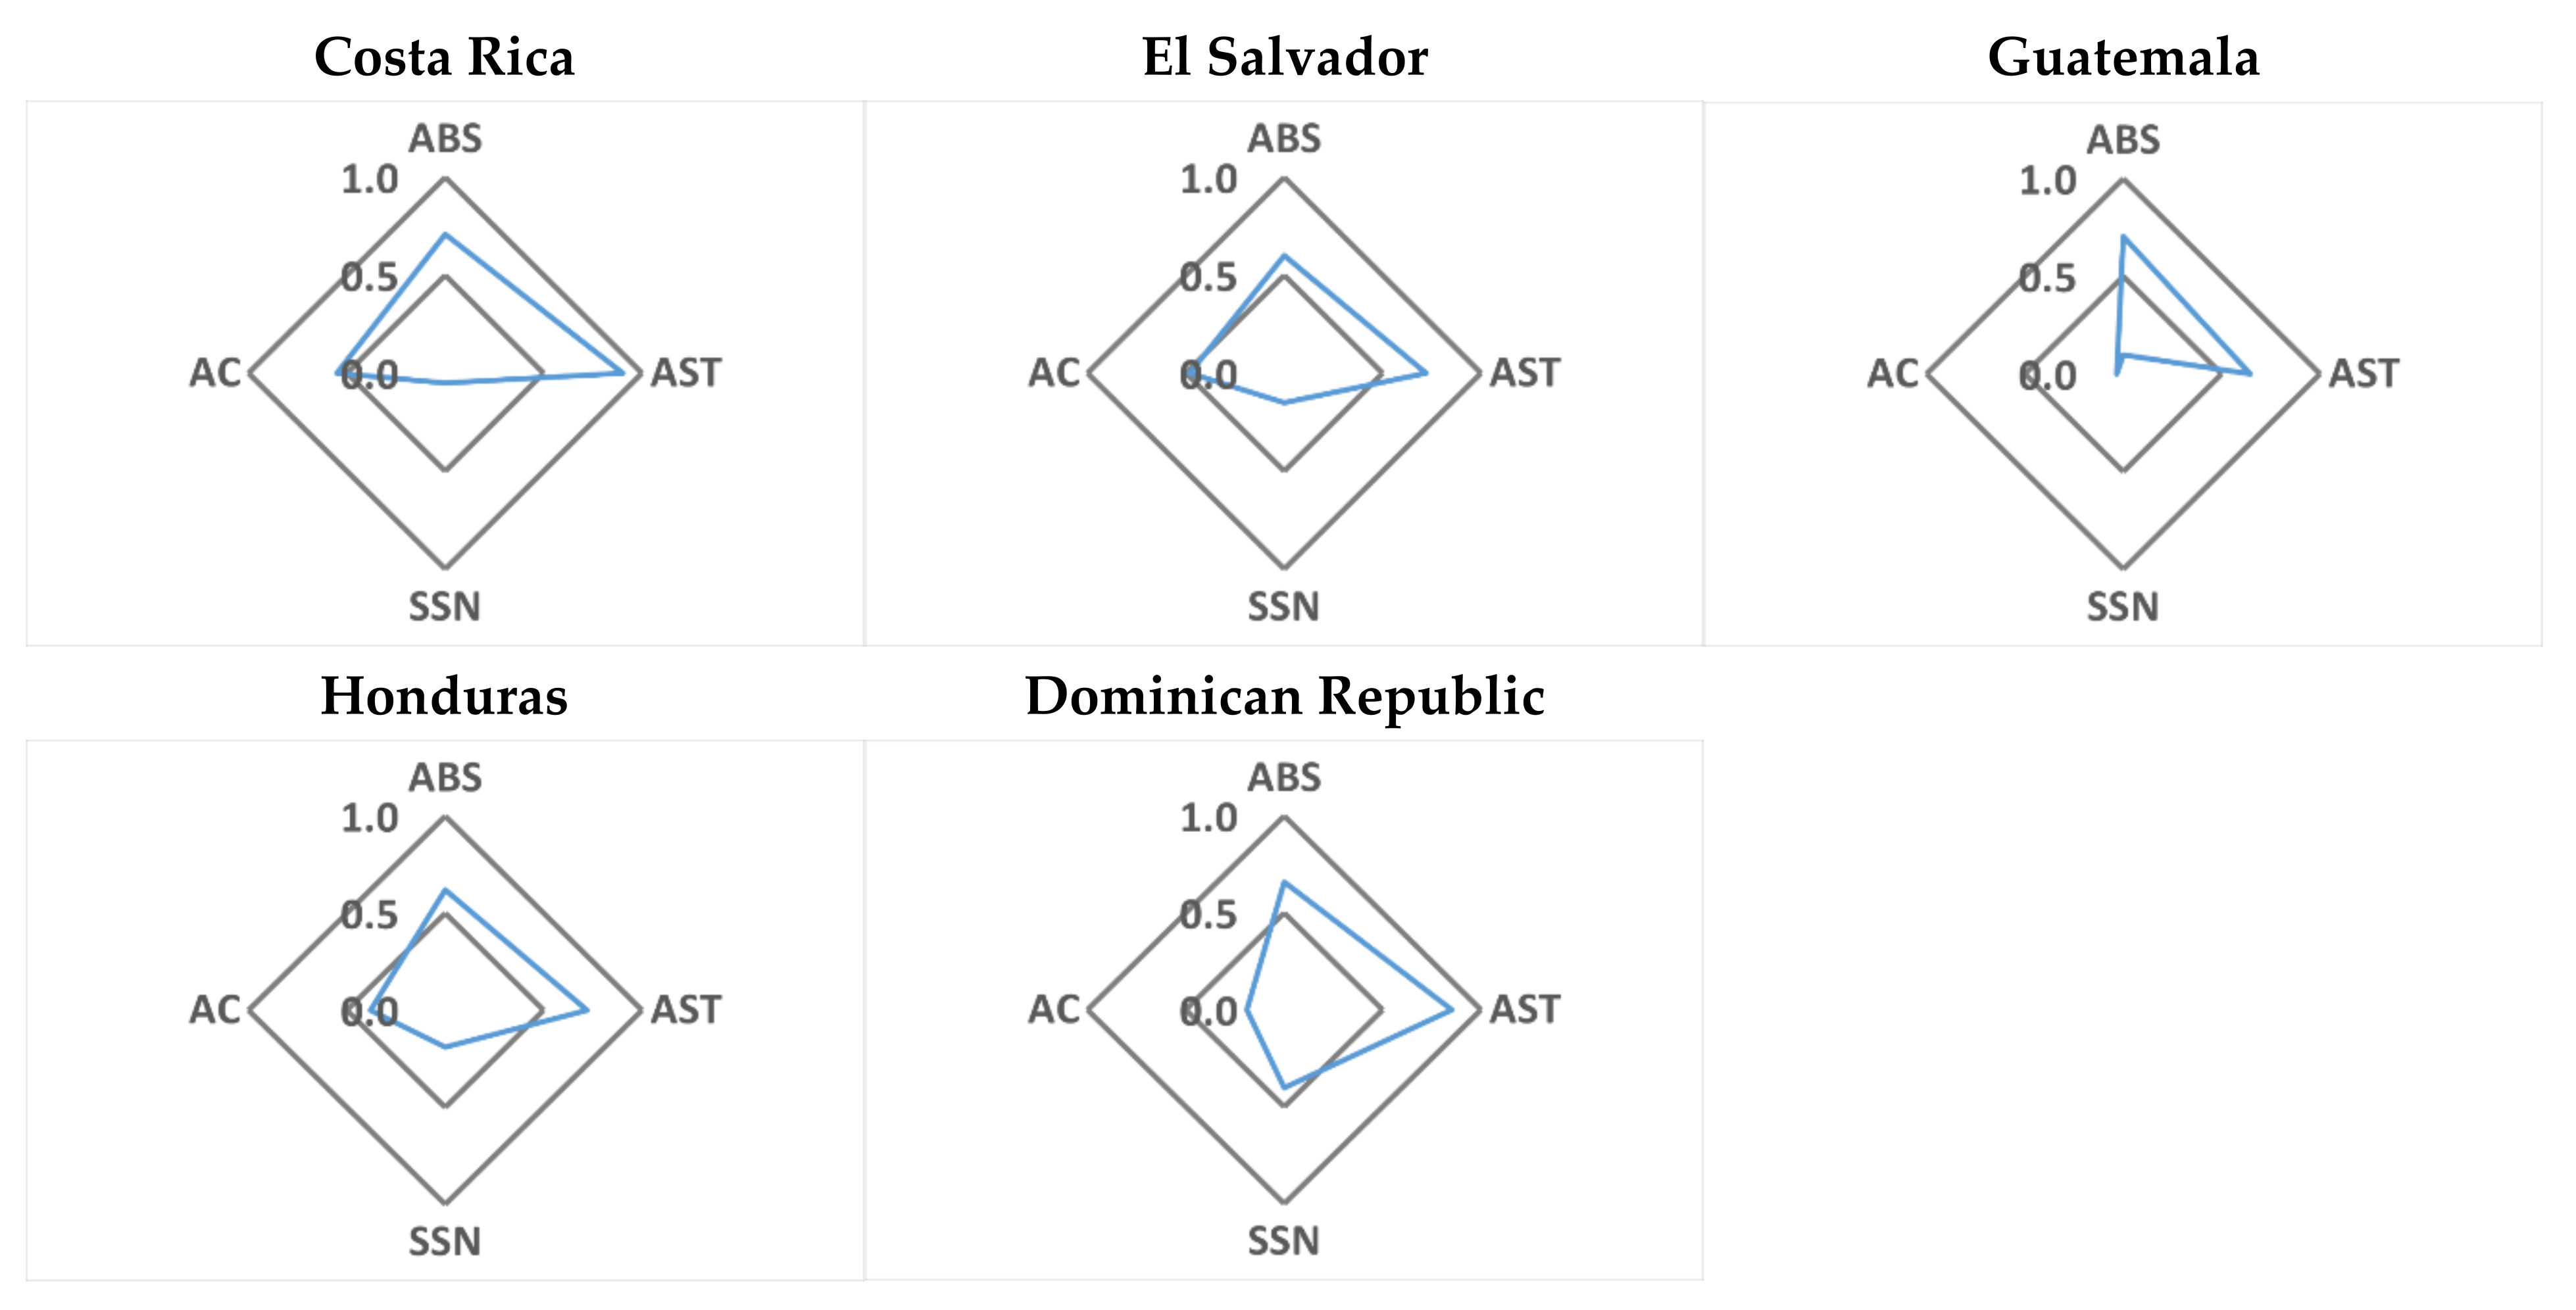
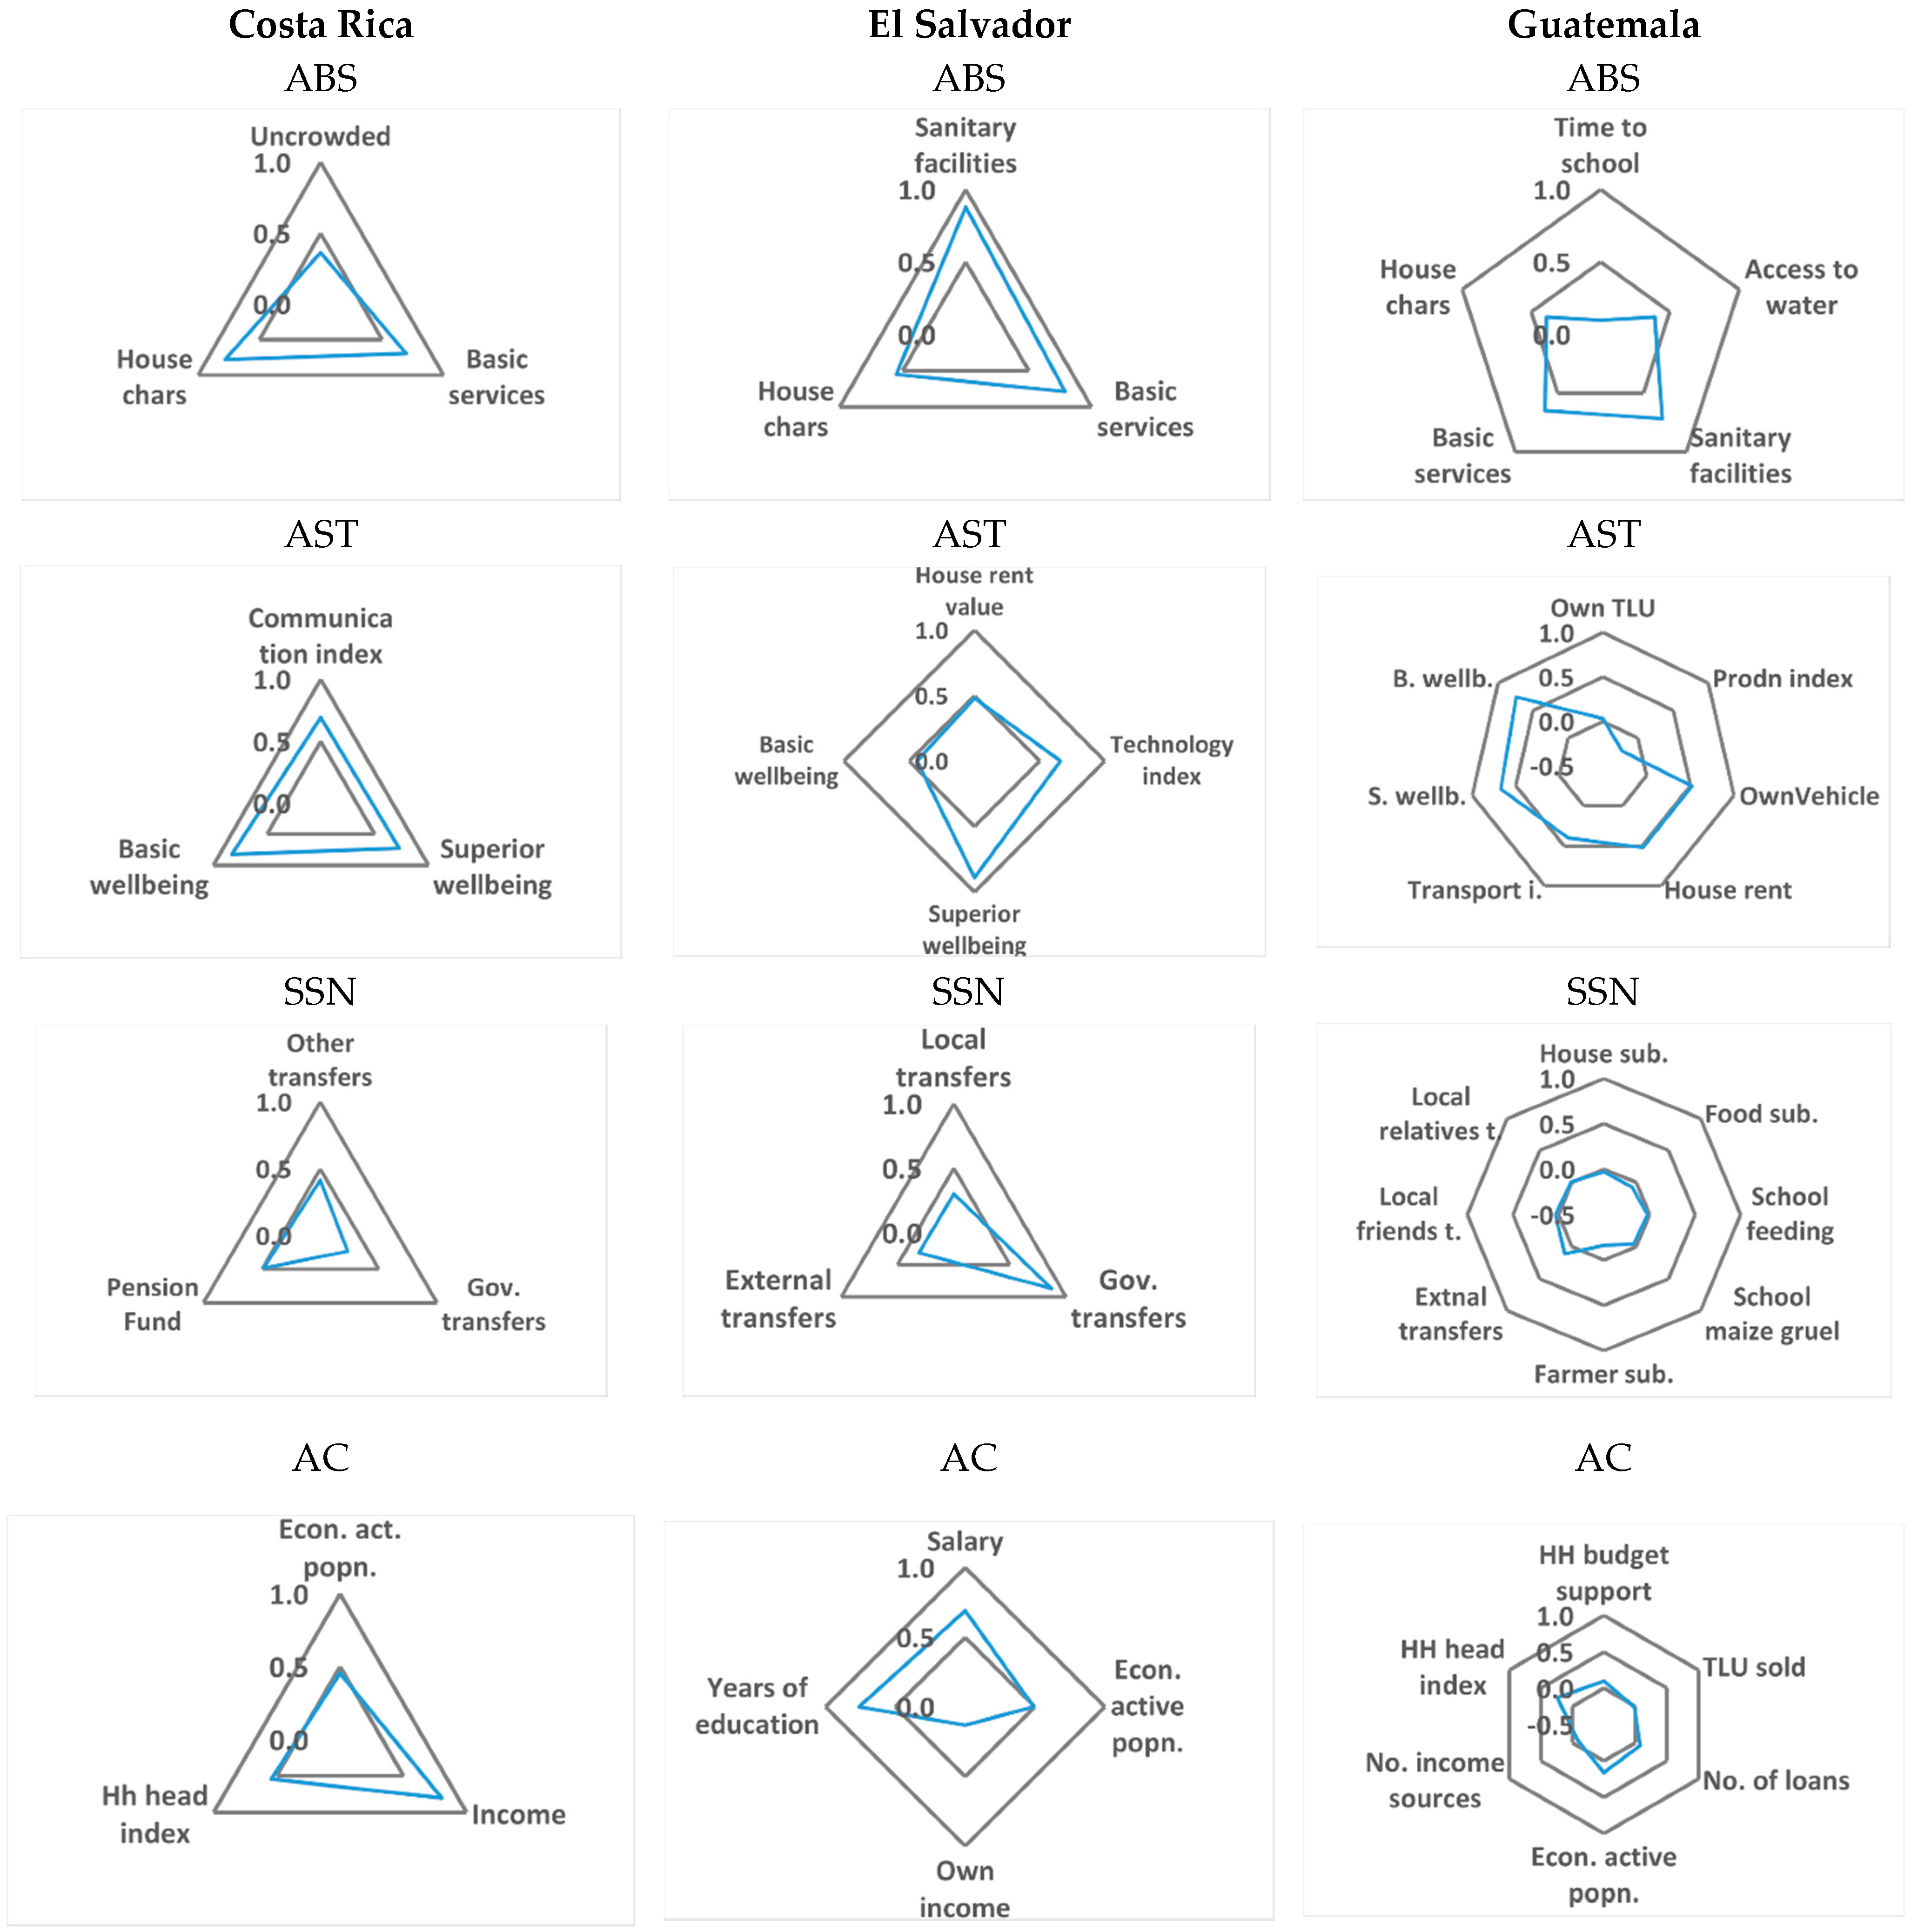
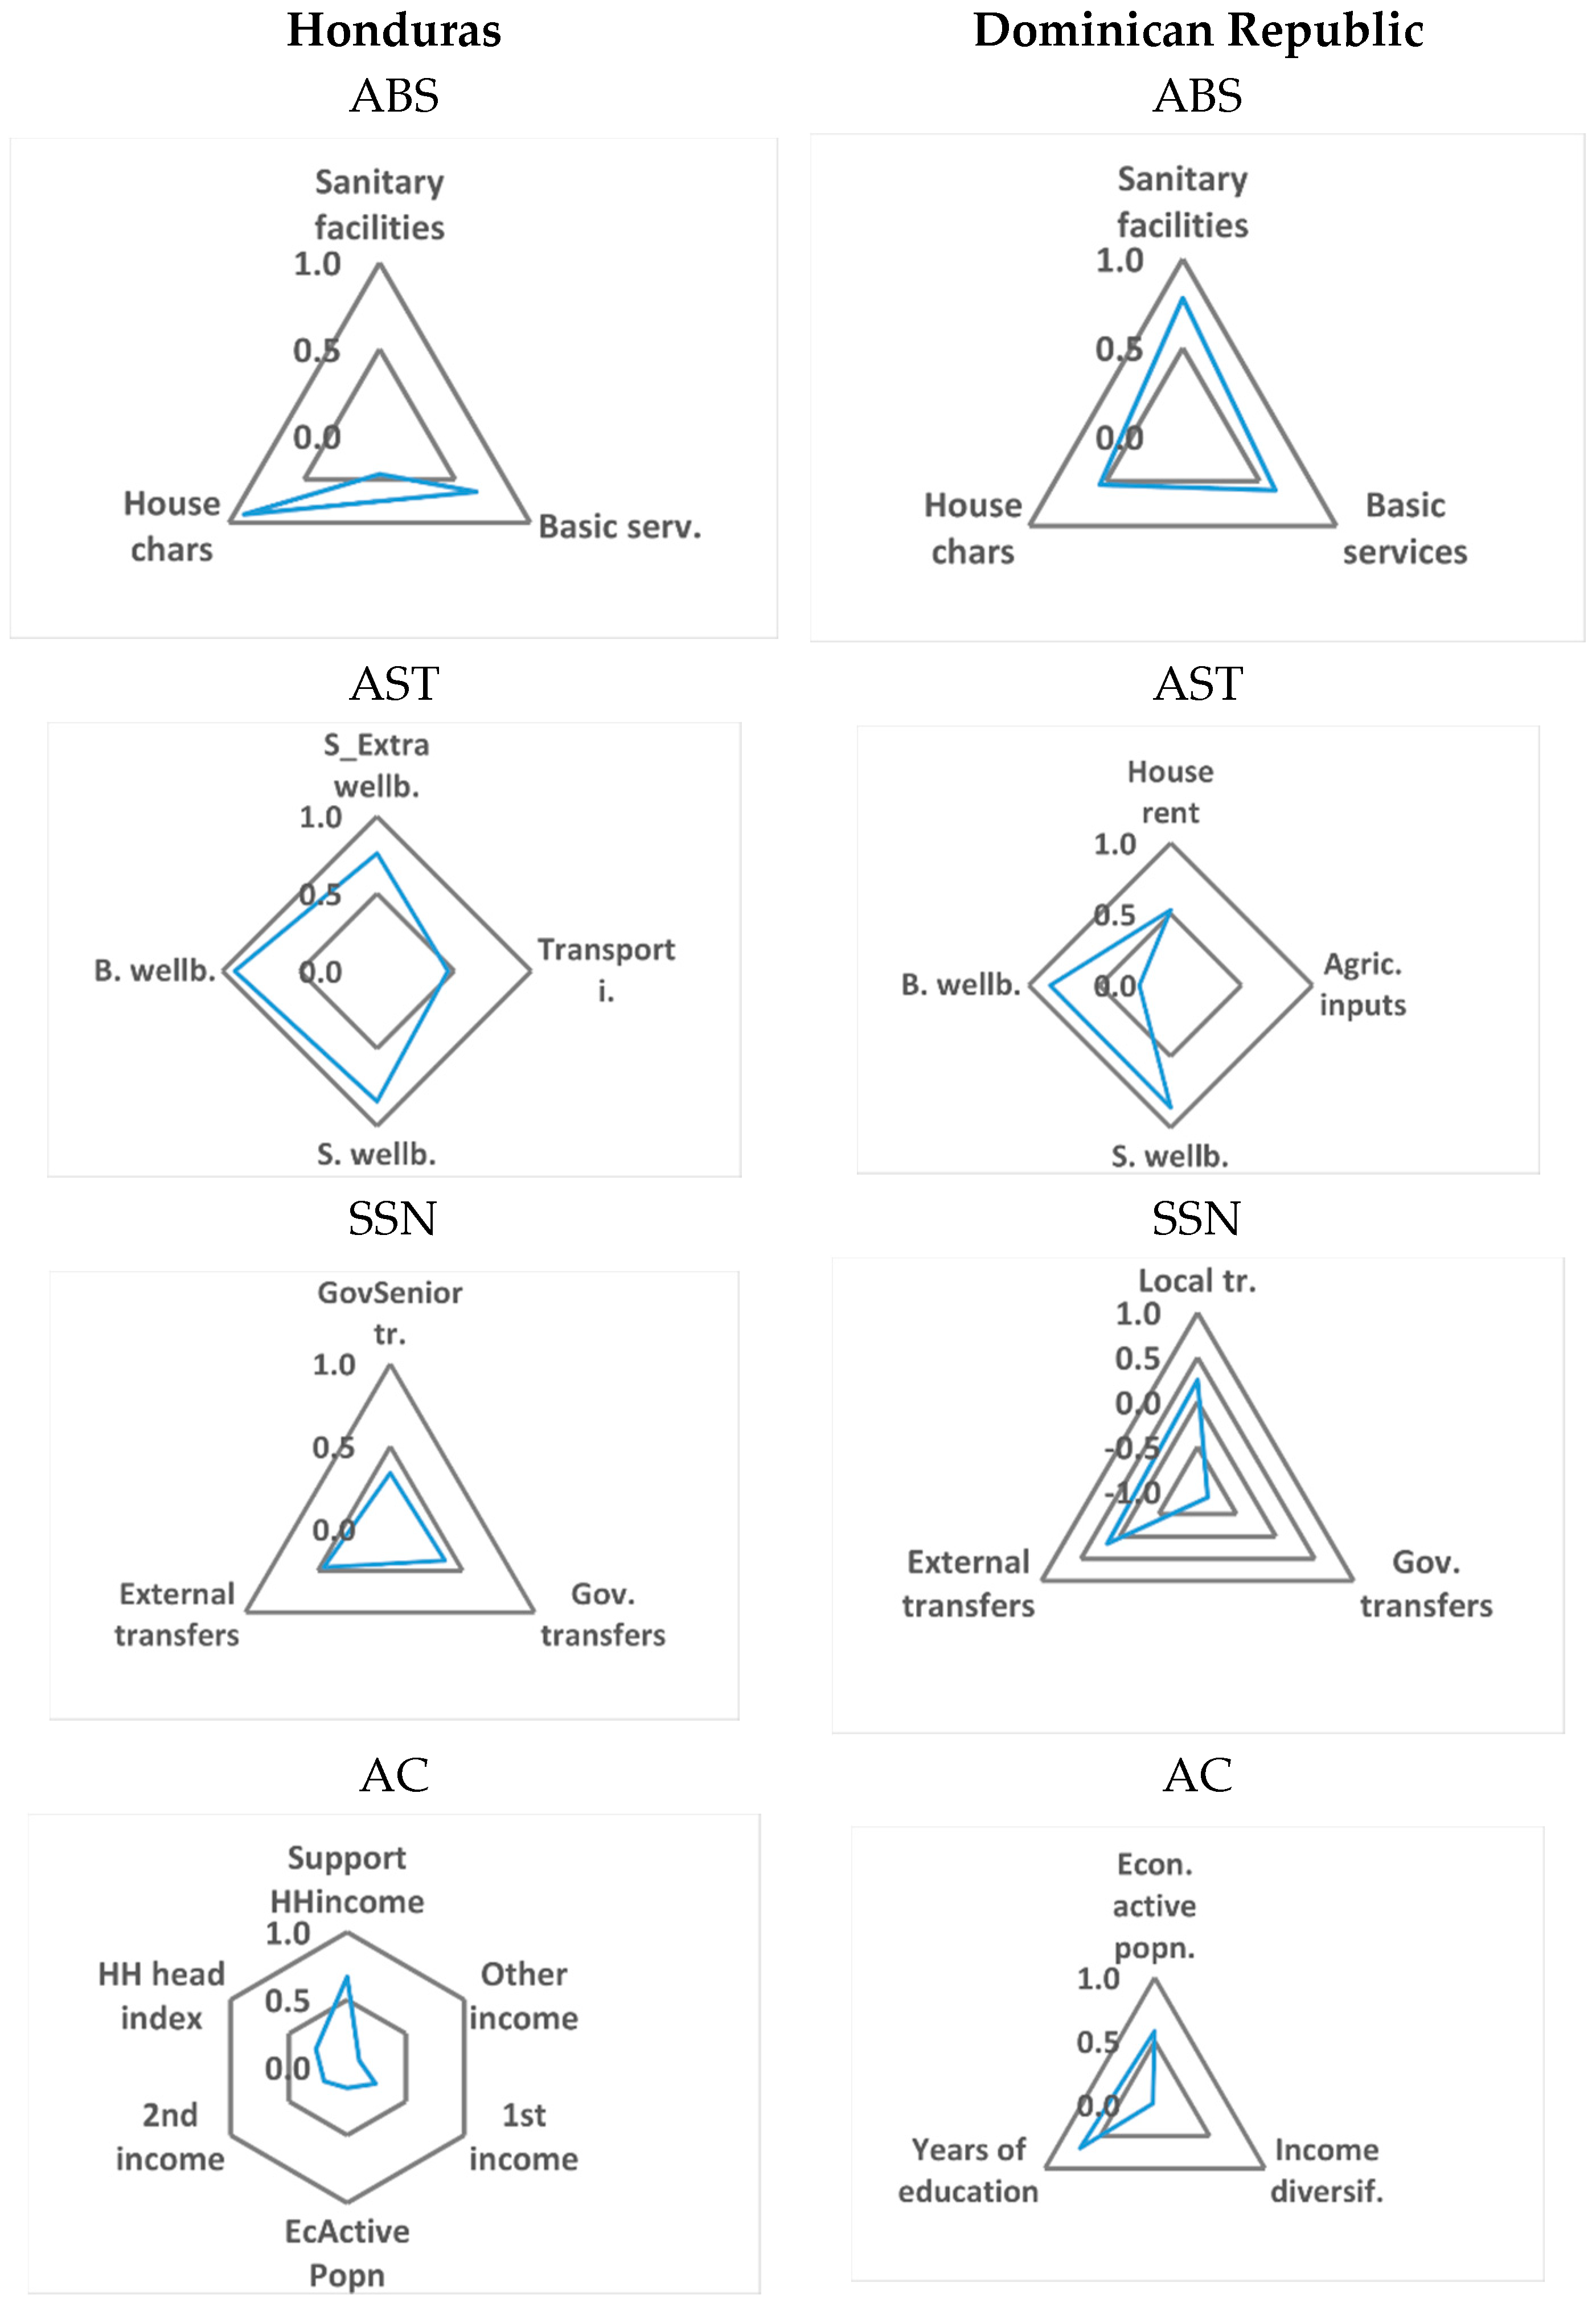
3.2. Cross-Countries Comparison
3.3. Country Specificity for Heterogeneous Contexts
3.4. Farm Diversification
4. Conclusions and Policy Implications
Author Contributions
Funding
Institutional Review Board Statement
Informed Consent Statement
Data Availability Statement
Acknowledgments
Conflicts of Interest
Appendix A


| Costa Rica | ||
|---|---|---|
| Key Determinant | Variable Code | Description |
| ABS | d_walls | Acceptable wall type |
| d_floor | Acceptable floor type | |
| d_hhtype | Household type | |
| d_rooms | Number of rooms | |
| hh_characteristics_index | Household characteristics index | |
| d_water | Acceptable water-supply type | |
| d_electricty | Acceptable electricity | |
| d_trash | Acceptable solid disposal | |
| basic_service_index | Basic services index | |
| d_sewer_sys | Acceptable sewer system | |
| d_trwater | Acceptable water treatment | |
| d_latrIne | Acceptable toilet type | |
| d_overcrowding | The acceptable number of people per room | |
| health_house_index | Health house index | |
| AST | d_radio | Radio presence |
| d_tv | Tv presence | |
| d_licuadora | Blender presence | |
| d_maqcoser | Sewing machine | |
| d_plancha | Iron presence | |
| d_microonda | Microwave presence | |
| riquezahogar_index | Wealth index (minor value) | |
| d_house | Dwelling rent | |
| d_comp | Computer presence | |
| d_vehiculo | Automobile presence | |
| d_refri | Refrigerator presence | |
| d_lavadora | Washing-machine presence | |
| riquezahogarextra_index | Extra wealth index (principal value) | |
| d_phone | Telephone presence | |
| d_cell | Mobile phone presence | |
| d_cable | Cable presence | |
| tecnologia_index | Technology Index | |
| cost house | Monthly dwelling rent | |
| SSN | d_gas | Gas subsidy |
| d_elect | Electricity subsidy | |
| d_pagricola | Agriculture inputs presence | |
| gobtransfer_index | Government transfers Index | |
| st_ayudalocal | Remittances from friends or neighbors | |
| st_ayudaexterior | External remittances from family | |
| AC | tdep | Income from dependent work |
| otingdep | Other income from dependent work | |
| tsec | Secondary work | |
| AC | ingresos_dep_index | Dependent labor earnings index |
| tinder | Monthly dependent work income | |
| actnl | Monthly income from non-work activities | |
| actag | Income from agricultural activities | |
| ingresos_indep_index | Independent work income index | |
| log_edavg | Average years of education of members of the household | |
| economic_active | The inverse of the dependency ratio | |
| FS | log_gastohog | Log of Expenditure per person per day |
| ln_rzngnoaligali | The inverse of the proportion of food expenditure to total expenditure | |
| ln_rzngnoaligali | Log of the inverse of the proportion of starch food expenditure to the total food expenditure | |
| El Salvador | ||
|---|---|---|
| Key Determinant | Variable Code | Description |
| ABS | d_walls | Acceptable wall type |
| d_floor | Acceptable floor type | |
| d_hhtype | Household type | |
| d_rooms | Number of rooms | |
| hh_characteristics_index | Dwelling characteristics index | |
| d_water | Acceptable water-supply type | |
| d_electricty | Acceptable electricity | |
| d_trash | Acceptable solid disposal | |
| basic_service_index | Basic services index | |
| d_sewer_sys | Acceptable sewer system | |
| d_trwater | Acceptable water treatment | |
| d_latrine | Acceptable toilet type | |
| d_overcrowding | The acceptable number of people per room | |
| health_house_index | Health house index | |
| AST | d_radio | Radio presence |
| d_tv | Television-set presence | |
| d_licuadora | Blender presence | |
| d_maqcoser | Sewing machine | |
| d_plancha | Iron presence | |
| d_microonda | Microwave presence | |
| riquezahogar_index | Household wealth index (minor value) | |
| d_house | Dwelling rent | |
| d_comp | Computer presence | |
| d_vehiculo | Automobile presence | |
| d_refri | Refrigerator presence | |
| d_lavadora | Washing-machine presence | |
| riquezahogarextra_index | Extra wealth index (principal value) | |
| d_phone | Phone presence | |
| d_cell | Mobile phone presence | |
| d_cable | Transmission cable presence | |
| tecnologia_index | Technology Index | |
| cost house | Monthly dwelling rent | |
| SSN | d_gas | Gas subsidy |
| d_elect | Electricity subsidy | |
| d_pagricola | Agriculture inputs | |
| gobtransfer_index | Subsidy index | |
| st_ayudalocal | Remittances from friends or neighbors | |
| st_ayudaexterior | External remittances from family | |
| AC | tdep | Income from dependent work |
| otingdep | Income from other dependent work | |
| tsec | Secondary work | |
| AC | ingresos_dep_index | Dependent labor earnings index |
| tinder | Monthly income from self-employment | |
| actnl | Monthly income from non-work activities | |
| actag | Income from agricultural activities | |
| ingresos_indep_index | Independent work income index | |
| log_edavg | Average household schooling | |
| economic_active | The inverse of the dependency ratio | |
| FS | log_gastohog | Log of total expenditure |
| ln_rzngnoaligali | Log of non-food to food expenditure ratio | |
| Guatemala | ||
|---|---|---|
| Key Determinant | Variable Code | Description |
| ABS | d_hhtype | Acceptable dwelling type |
| d_floor | Acceptable floor type | |
| d_walls | Acceptable wall type | |
| d_rooms | Acceptable number of rooms | |
| d_kitchen | Acceptable location of the kitchen | |
| hh_characteristics_index | Dwelling characteristics index | |
| d_water | Acceptable water-supply type | |
| d_electricty | Electricity presence | |
| d_trash | Acceptable solid disposal | |
| hh_servbasic_index | Basic services index | |
| d_trwater | Acceptable water treatment | |
| d_latrine | Toilet presence | |
| d_overcrowding | Acceptable number of people per room | |
| d_lena_chim | Acceptable use of wood and chimney | |
| health_service_index | Health service index | |
| Acceso a agua | Closeness to the source of water in meters (inverse distance) | |
| Acceso an escuela | Closeness to school in minutes (inverse distance) | |
| AST | d_gasstove | Stove presence |
| d_fridge | Refrigerator presence | |
| d_washingmach | Washing-machine presence | |
| d_tv | Television-set presence | |
| d_computer | Computer presence | |
| d_celular | Cell-phone presence | |
| d_Internet | Internet-service presence | |
| basic_wealth_index | Primary wealth index (high monetary value) | |
| d_soundsys | Sound-system presence | |
| d_blender | Blender presence | |
| d_pressurec | Pressure-cooker presence | |
| d_iron | Iron presence | |
| extra_wealth_index | Extra wealth index (low monetary value) | |
| d_moto | Motorcycle presence | |
| d_bicycle | Bicycle presence | |
| d_auto | Automobile presence | |
| transport_index | Transport index | |
| tenencia_vehic | Transport ownership | |
| cosecho_prod | Crop harvesting | |
| crio_animales | Livestock raising | |
| Tiene_negocios | Business ownership | |
| Production_index | Production index | |
| ltut | Ownership of livestock tropical units | |
| house_value | Dwelling rent | |
| SSN | st_ayudafam | Remittances from relatives |
| st_ayudaper | Remittances from friends or neighbors | |
| st_ayudarem | International remittances | |
| st_iagricolas | Agriculture inputs | |
| st_vasoatol | Cereal gruel food aid program | |
| st_alescolar | School food aid program | |
| st_subsidio_alim | Food subsidy | |
| st_subsidio_viv | Dwelling subsidy | |
| AC | edhd | Years of education of household head |
| ywg | Household head working | |
| healthhd | Household head working affiliated to national health social institution | |
| hh_head_index | Household head capacity index | |
| d_isemd | Weekly income as an employee | |
| d_isemi | Weekly income as an entrepreneur | |
| d_isemiag | Weekly income as an agricultural entrepreneur | |
| participation_index | Participation in household income index | |
| economic_active | The inverse of dependency ratio | |
| nincsrc | Number of income sources | |
| num_prestamos | Number of loans | |
| negtluv | Selling of livestock tropical units (hostile) | |
| FS | log_fexppd | Log of daily expenditure per person |
| log_negssexr | Log of starchy staple food expenditure ratio | |
| hdds_9 | Household dietary diversity score as WFP food grouping | |
| hdds_12 | Household dietary diversity score as FANTA food grouping | |
| hdds_16 | Household dietary diversity score as FAO food grouping | |
| FIES | Food Insecurity Experience Scale | |
| Honduras | ||
|---|---|---|
| Key Determinant | Variable Code | Description |
| ABS | d_ceiling | Acceptable ceiling type |
| d_walls | Acceptable wall type | |
| d_floor | Acceptable floor type | |
| hh_characteristics_index | Household characteristics Index | |
| d_trash | Acceptable solid disposal | |
| d_water_pri | Acceptable primary water source | |
| d_electricity | Acceptable electricity | |
| d_sewer_sys | Acceptable sewer system | |
| hh_servbasic_index | Basic services index | |
| d_hhtype | Household type | |
| d_kitchen | Kitchen location | |
| d_overcrowding | The acceptable number of people per room | |
| health_service_index | Health service index | |
| AST | d_refrigerador | Refrigerator presence |
| d_estufa | Stove presence | |
| d_lavadora | washing-machine presence | |
| basic_wealth_index | Primary wealth index (principal value) | |
| d_plancha | Iron presence | |
| d_licuadora | Blender presence | |
| d_tostadora | Toaster presence | |
| higcost_wealth_index | High wealth index (minor value) | |
| d_radio_grabadora | Radiographer presence | |
| d_horno_micro | Microwave presence | |
| d_vhs_dvd | VHS presence | |
| extra_wealth_index2 | Extra wealth index | |
| d_vehiculo | Automobile presence | |
| d_bicicleta | Bicycle presence | |
| d_motocicleta | Moto presence | |
| transport_index | Transport index | |
| SSN | t_trans | Income from Cash Remittances |
| t_famhelp | Income from current aid | |
| t_benefit | Income from Employment Benefits | |
| trans_gov_index | Government transfers Index | |
| t_subsidy | Subsidy income | |
| t_retirement | Retirement income | |
| t_pension | Pension income | |
| subsidy_index | Subsidy index | |
| t_lease | Income from lease | |
| t_lottery | Income from lottery | |
| t_bonos | Household income by vulnerable group bonds | |
| trans_extras_index | Extra transfers index | |
| AC | edhd | Education of the household head |
| edhigh | A higher level of education of the household head | |
| healthhd | IHSS membership of the head of household | |
| hh_head_index | Household Head Index | |
| d_income_rrhh | Human resource or wealth-income | |
| d_other_reme | Income from remittance | |
| d_income_others | Other income sources | |
| participation_index | Participation index | |
| economic_active | Dependency ratio | |
| remesas | Average income from remittances | |
| salary | The average income for salary work | |
| ytraophg | The average income for the primary occupation salary | |
| otras | Average other miscellaneous income | |
| FS | log_fexppd | Log of Expenditure per person per day |
| neg_ssexr | The unfavorable ratio of expenditure on starches to total food | |
| hdds_9 | Household Dietary Diversity Index as PMA food grouping | |
| hdds_12 | Household Dietary Diversity Index as FANTA food grouping | |
| hdds_16 | Household Dietary Diversity Index as FAO food grouping | |
| Dominican Republic | ||
|---|---|---|
| Key Determinant | Variable Code | Description |
| ABS | d_floor | Acceptable floor type |
| d_wallsext | Acceptable external wall type | |
| d_kitchen | Acceptable kitchen | |
| hh_characteristics_index | Household characteristics index | |
| d_electricty | Acceptable electricity | |
| d_water | Acceptable water-supply type | |
| d_trash | Acceptable solid disposal | |
| basic_service_index | Basic services index | |
| d_latrine | Acceptable toilet type | |
| d_overcrowding | The acceptable number of people per room | |
| cooking | Energy type for cooking | |
| health_house_index | Health house index | |
| AST | d_car | Automobile presence |
| d_personalcomputer | Computer presence | |
| d_colortelevision | Tv presence | |
| d_refrigerator | Refrigerator presence | |
| d_washingmachine | Washing machine presence | |
| d_inversor | Invertor presence | |
| riquezahogarextra_index | Extra wealth index (principal value) | |
| d_soundequipmet | Sound equipment presence | |
| d_sewingmachine | Sewing machine | |
| d_gasstove | Gas stove presence | |
| d_microwave | Microwave presence | |
| d_dvd | DVD presence | |
| d_fan | Fan presence | |
| riquezahogar_index | House wealth index (minor value) | |
| d_knife | Knife presence | |
| d_peak | Peak presence | |
| d_hoe | Hoe presence | |
| d_bigknife | Big knife presence | |
| tecnologia_index | Technology index | |
| cost house | Monthly dwelling rent | |
| AC | educacionpromedio | Average years of education of members of the household |
| economic_active | The inverse of the dependency ratio | |
| asalariado1 | Primary wage earner’s income | |
| asalariado2 | Secondary wage earner’s income | |
| independiente1 | Income from the leading independent work | |
| independiente2 | Income from secondary independent work | |
| neoliberal | Income from interest, dividend, and rent | |
| nolaboral2 | Non-work income gambling, inheritance, insurance, etc. | |
| ingresos_dep_index | Income index | |
| SSN | t_comer | Eating comes first |
| t_alimento | Subsidized food from INSPIRE | |
| t_utiles | School equipment | |
| t_botica | Community pharmacy | |
| t_apagon | Power Outage Reduction Program | |
| t_bombillo | Supply of energy-saving light bulbs | |
| t_gas | Gas subsidy | |
| gobtransfer_index | Government transfers index | |
| remesalocal | Transfers from nation | |
| remesaexterior | Transfers from an external source | |
| FS | log_negrazonengel2 | Log of the negative of the Engels ratio |
| log_negssexr2 | Log of the negative of Bennett’s ratio | |
References
- Sabates-Wheeler, R.; Devereux, S.; Mitchell, T.; Tanner, T.; Davies, M.; Leavy, J. Rural Disaster Risk–Poverty Interface; Institute of Development Studies, the University of Sussex: Brighton, UK, 2008. [Google Scholar]
- United Nations International Strategy for Disaster Reduction (UNISDR). Risk and Poverty in a Changing Climate: 2009 Global Assessment Report on Disaster Risk Reduction; United Nations: Geneva, Switzerland, 2009. [Google Scholar]
- Bahadur, A.; Pichon, F. Analysis of Resilience Framework and Approaches: A Bird’s Eye View; Overseas Development Institute (ODI): London, UK, 2017. [Google Scholar] [CrossRef]
- FAO. RIMA-II: Resilience Index Measurement and Analysis II; FAO: Rome, Italy, 2016. [Google Scholar]
- Constas, M.; Barrett, C. Principles of Resilience Measurement for Food Insecurity: Metrics, Mechanisms and Implementation Plans. Presented at the Expert Consultation on Resilience Measurement Related to Food Security, Rome, Italy, 19–21 February 2013; FAO and WFP: Rome, Italy, 2013. [Google Scholar]
- Food Security Information Network (FSIN). Resilience Measurement Principles: Toward an Agenda for Measurement Design; Technical Series No. 1; Resilience Measurement Technical Working Group: Rome, Italy, 2014. [Google Scholar]
- Food Security Information Network (FSIN). A Common Analytical Model for Resilience Measurement. Causal Framework and Methodological Options; Technical Series No. 2. Resilience Measurement Technical Working Group: Rome, Italy, 2014. [Google Scholar]
- Barrett, C.; Constas, M.C. Toward a theory of resilience for international development applications. Proc. Natl. Acad. Sci. USA 2014, 111, 14625–14630. [Google Scholar] [CrossRef] [PubMed] [Green Version]
- Jones, L.; Tanner, T. Measuring ‘Subjective Resilience’: Using Peoples’ Perceptions to Quantify Household Resilience. SSRN Electron. J. 2016. [Google Scholar] [CrossRef]
- Food Security Information Network (FSIN). Measuring Shocks and Stressors as Part of Resilience Measurement; Technical Series No. 5; Resilience Measurement Technical Working Group: Rome, Italy, 2015. [Google Scholar]
- Béné, C.; Al-Hassan, R.M.; Amarasinghe, O.; Fong, P.; Ocran, J.; Onumah, E.; Ratuniata, R.; Van Tuyen, T.; Allister-McGregor, J.; Mills, D.J. Is resilience socially constructed? Empirical evidence from Fiji, Ghana, Sri Lanka, and Vietnam. Glob. Environ. Chang. 2016, 38, 153–170. [Google Scholar] [CrossRef] [Green Version]
- d’Errico, M.; Pietrelli, R.; Romano, D. Household resilience to food insecurity: Evidence from Tanzania and Uganda. Presented at the Fifth AIEAA Congress, Bologna, Italy, 16–17 June 2016; Italian Association of Agricultural and Applied Economics (AIEAA): Bologna, Italy, 2016. [Google Scholar]
- Coleman-Jensen, A.; Rabbitt, M.P.; Smith, M.D. Who is the World’s Food Insecure? New Evidence from the Food and Agriculture Organization’s Food Insecurity Experience Scale. World Dev. 2017, 93, 402–412. [Google Scholar] [CrossRef] [Green Version]
- Bouroncle, C.; Imbach, P.; Rodríguez-Sánchez, B.; Medellín, C.; Martínez-Valle, A.; Läderach, P. Mapping climate change adaptive capacity and vulnerability of smallholder agricultural livelihoods in Central America: Ranking and descriptive approaches to support adaptation strategies. Clim. Chang. 2016, 141, 123–137. [Google Scholar] [CrossRef] [Green Version]
- Imbach, P.; Beardsley, M.; Bouroncle, C.; Medellin, C.; Läderach, P.; Hidalgo, H.; Alfaro, E.; Van Etten, J.; Allan, R.; Hemming, D.; et al. Climate change, ecosystems, and smallholder agriculture in Central America: An introduction to the special issue. Clim. Chang. 2017, 141, 1–12. [Google Scholar] [CrossRef] [Green Version]
- Harvey, C.A.; Saborio-Rodríguez, M.; Ruth Martinez-Rodríguez, M.; Viguera, B.; Chain-Guadarrama, A.; Vignola, R.; Alpizar, F. Climate change impacts and adaptation among smallholder farmers in Central America. Agric. Food Secur. 2018, 7, 57. [Google Scholar] [CrossRef]
- Hernández, M.F.; Torero, M.; Gallegos Robles, M.A.; Falconi, C.A.; Maruyama, E. A Framework for Sustainable Food Security for Latin America and the Caribbean; Technical Note No. 441; Inter-American Development Bank: Washington, DC, USA, 2012. [Google Scholar]
- Zezza, A.; Winters, P.C.; Davis, B.; Carletto, C.; Covarrubias, K.; Quinones, E.; Stamoulis, K.G.; Di Giuseppe, S. Rural Household Access to Assets and Agrarian Institutions: A Cross Country Comparison. In Proceedings of the European Association of Agricultural Economists’ 106th Seminar, Montpellier, France, 25–27 October 2007. [Google Scholar] [CrossRef]
- Serfilippi, E.; De Los Rios, C.; d’Errico, M. Coffee in crisis offers a lesson in resilience: Evidence from Guatemala. In FAO Agricultural Development Economics Working Paper 20-02; FAO: Rome, Italy, 2020. [Google Scholar]
- Bennett, E.; Carpenter, S.R.; Gordon, L.; Ramankutty, N.; Balvanera, P.; Campbell, B.; Cramer, W.; Foley, J.; Folke, C.; Karlberg, L.; et al. Toward more resilient agriculture. Solut. Sustain. Desirable Future 2014, 5, 65–75. [Google Scholar] [CrossRef] [Green Version]
- d’Errico, M.; Garbero, A.; Letta, M.; Winters, P. Evaluating Program Impact on Resilience: Evidence from Lesotho’s Child Grants Programme. J. Dev. Stud. 2020, 56, 2212–2234. [Google Scholar] [CrossRef]
- von Uexkull, N.; d’Errico, M.; Jackson, J. Drought, Resilience, and Support for Violence: Household Survey Evidence from DR Congo. J. Confl. Resolut. 2020, 55, 496–528. [Google Scholar] [CrossRef]
- Alinovi, L.; Mane, E.; Romano, D. Towards the Measurement of Household Resilience to Food Insecurity: Applying a Model to Palestinian Household Data. In Deriving Food Security Information from National Household Budget Surveys. Experiences, Achievement, Challenges; Sibrian, R., Ed.; FAO: Rome, Italy, 2008; pp. 137–152. Available online: http://www.fao.org/3/i0430e/i0430e.pdf (accessed on 8 August 2021).
- Barrett, C.B.; Cissé, J. Estimating development resilience: A conditional moments-based approach. J. Dev. Econ. 2018, 135, 272–284. [Google Scholar] [CrossRef]
- Serfilippi, E.; Ramnath, G. Resilience measurement and conceptual frameworks: A Review of the Literature. Ann. Public Coop. Econ. 2017, 89, 645–664. [Google Scholar] [CrossRef]
- Ansah, I.G.K.; Gardebroek, C.; Ihle, R. Resilience and household food security: A review of concepts, methodological approaches, and empirical evidence. Food Secur. 2019, 11, 1187–1203. [Google Scholar] [CrossRef] [Green Version]
- Knippenberg, E.; Jensen, N.; Constas, M. Quantifying household resilience with high-frequency data: Temporal dynamics and methodological options. World Dev. 2019, 121, 1–15. [Google Scholar] [CrossRef]
- FAO. Gender Differences in Assets; FAO: Rome, Italy, 2011. [Google Scholar]
- SOFA Team; Doss, C. The Role of Women in Agriculture; ESA Working Paper 11-02; FAO: Rome, Italy, 2011. [Google Scholar]
- FAO. Developing a Climate-Smart Agriculture Strategy at the Country Level: Lessons from Recent Experience; FAO: Rome, Italy, 2012. [Google Scholar]
- FAO. FAO Social Protection Framework: Promoting Rural Development for All; FAO: Rome, Italy, 2017. [Google Scholar]
- Grupo Técnico de Análisis de Resiliencia en Seguridad Alimentaria y Nutricional de Costa Rica (ARSANCOR); Grupo Técnico de Análisis de Resiliencia en Seguridad Alimentaria y Nutricional (ARSAN) del Programa de Sistemas de Información para la Resiliencia en Seguridad Alimentaria y Nutricional de la Región del SICA (PROGRESAN-SICA). Costa Rica. Medición y Análisis de Resiliencia en Seguridad Alimentaria y Nutricional en Costa Rica. Informe Final; PROGRESAN-SICA/IT-010/2019; PROGRESAN-SICA: San José, CA, USA, 2019. [Google Scholar]
- Grupo Técnico de Análisis de Resiliencia en Seguridad Alimentaria y Nutricional de Honduras (ARSANHON); PROGRESAN-SICA. Honduras. Medición y Análisis de Resiliencia en Seguridad Alimentaria y Nutricional: Lineamientos de Política Pública Departamental; PROGRESAN-SICA/ IT-006/2019; PROGRESAN-SICA: Tegucigalpa, Honduras, 2019. [Google Scholar]
- Grupo Técnico de Análisis de Resiliencia en SAN de República Dominicana (ARSANDOR); PROGRESAN-SICA. República Dominicana. Medición y Análisis de Resiliencia en Seguridad Alimentaria y Nutricional: Lineamientos de Política Pública Provincial; PROGRESAN-SICA/IT-007/2019; PROGRESAN-SICA: Santo Domingo, Dominican Republic, 2019. [Google Scholar]
- Grupo Técnico de Análisis de Resiliencia en Seguridad Alimentaria y Nutricional de El Salvador (ARSANES); PROGRESAN-SICA. El Salvador. Medición y Análisis de Resiliencia en Seguridad Alimentaria y Nutricional: Lineamientos de Política Pública Departamental; PROGRESAN-SICA/IT-004/2019; PROGRESAN-SICA: San Salvador, El Salvador, 2019. [Google Scholar]
- Grupo Técnico de Análisis de Resiliencia en Seguridad Alimentaria y Nutricional de Guatemala (ARSANGUA); PROGRESAN-SICA. Guatemala. Medición y análisis de resiliencia en Seguridad Alimentaria y Nutricional: Lineamientos de Política Pública Departamental; PROGRESAN-SICA/IT-003/2019; PROGRESAN-SICA: Ciudad de Guatemala, Guatemala, 2019. [Google Scholar]
- Jones, A.D.; Shrinivas, A.; Bezner-Kerr, R. Farm production diversity is associated with greater household dietary diversity in Malawi: Findings from nationally representative data. Food Policy 2014, 46, 1–12. [Google Scholar] [CrossRef]
- Ruel, M.T. Operationalizing dietary diversity: A review of measurement issues and research priorities. J. Nutr. 2003, 133, 3911S–3926S. [Google Scholar] [CrossRef]
- ARSANCOR; PROGRESAN-SICA. Costa Rica. Medición y Análisis de Resiliencia en Seguridad Alimentaria y Nutricional: Lineamientos de Política Pública Regional; PROGRESAN-SICA/IT-005/2019; PROGRESAN-SICA: San José, Costa Rica, 2019. [Google Scholar]
- ARSANES; PROGRESAN-SICA. El Salvador. Medición y Análisis de Resiliencia en Seguridad Alimentaria y Nutricional en El Salvador. Informe Final; PROGRESAN-SICA/IT-009/2019; PROGRESAN-SICA: San Salvador, El Salvador, 2019. [Google Scholar]
- ARSANDOR; PROGRESAN-SICA. República Dominicana. Medición y Análisis de Resiliencia en Seguridad Alimentaria y Nutricional en República Dominicana. Informe Final; PROGRESAN-SICA/IT-011/2019; PROGRESAN-SICA: Santo Domingo, Dominican Republic, 2019. [Google Scholar]
- Romeo, A.; Meerman, J.; Demeke, M.; Scognamillo, A.; Asfaw, S. Linking farm diversification to household diet diversification: Evidence from a sample of Kenyan ultra-poor farmers. Food Secur. 2016, 8, 1069–1085. [Google Scholar] [CrossRef] [Green Version]
- Asfaw, S.; Scognamillo, A.; Di Caprera, G.; Sitko, N.; Ignaciuk, A. Heterogeneous impact of livelihood diversification on household welfare: Cross-country evidence from sub-Saharan Africa. Word Dev. 2019, 117, 278–295. [Google Scholar] [CrossRef]
- Carlisle, L. Diversity, flexibility, and the resilience effect: Lessons from a social-ecological case study of diversified farming in the northern Great Plains, USA. Ecol. Soc. 2014, 19, 45. [Google Scholar] [CrossRef] [Green Version]
- Doss, C.R. Men’s crops? Women’s crops? The gender patterns of cropping in Ghana. World Dev. 2002, 30, 1987–2000. [Google Scholar] [CrossRef] [Green Version]
- Garibaldi, L.A.; Gemmill-Herren, B.; D’Annolfo, R.; Graeub, B.E.; Cunningham, S.A.; Breeze, T.D. Farming Approaches for Greater Biodiversity, Livelihoods, and Food Security. Trends Ecol. Evol. 2017, 32, 68. [Google Scholar] [CrossRef] [PubMed]
- Darnhofer, I.; Bellon, S.; Dedieu, B.; Milestad, R. Adaptiveness to enhance the sustainability of farming systems. Rev. Agron. Sustain. Dev. 2010, 30, 545–555. [Google Scholar] [CrossRef] [Green Version]
- Martin, G.; Magne, M.A. Agricultural diversity to increase adaptive capacity and reduce the vulnerability of livestock systems against weather variability—A farm-scale simulation study. Agric. Ecosyst. Environ. 2015, 199, 301–311. [Google Scholar] [CrossRef]
- Urruty, N.; Tailliez-Lefebvre, D.; Huyghe, C. Stability, robustness, vulnerability, and resilience of agricultural systems. Rev. Agron. Sustain. Dev. 2016, 36, 1–15. [Google Scholar] [CrossRef] [Green Version]
- Alvarez, S.; Timler, C.J.; Michalscheck, M.; Paas, W.; Descheemaeker, K.; Tittonell, P.; Andersson, J.A.; Groot, J.C.J. Capturing farm diversity with hypothesis-based typologies: An innovative methodological framework for farming system typology development. PLoS ONE 2018, 13, e0194757. [Google Scholar] [CrossRef] [PubMed] [Green Version]
- Altieri, M.A.; Funes-Monzote, F.R.; Petersen, P. Agroecological efficient agricultural systems for smallholder farmers: Contributions to food sovereignty. Agron. Sustain. Dev. 2012, 32, 1–13. [Google Scholar] [CrossRef] [Green Version]
- International Fund for Agricultural Development (IFAD). The Latin America and Caribbean Advantage: Family Farming—A Critical Success Factor for Resilient Food Security and Nutrition; IFAD: Rome, Italy, 2019; 52p. [Google Scholar]
- ARSANGUA; PROGRESAN-SICA. Guatemala. Medición y Análisis de Resiliencia en Seguridad Alimentaria y Nutricional: Informe Final; PROGRESAN-SICA/IT-008/2019; PROGRESAN-SICA: Ciudad de Guatemala, Guatemala, 2019. [Google Scholar]
- ARSANHON; PROGRESAN-SICA. Honduras. Medición y Análisis de Resiliencia en Seguridad Alimentaria y Nutricional en Honduras. Informe Final; PROGRESAN-SICA/IT-011/2019; PROGRESAN-SICA: Tegucigalpa, Honduras, 2019. [Google Scholar]


| Household Survey Features | Costa Rica | Dominican Republic | El Salvador | Guatemala | Honduras |
|---|---|---|---|---|---|
| Data collection institution | National Institute of Statistics and Census (INEC) | National Statistics Office (ONE) | Department of Statistics and Census (DIGESTYC) | National Statistics Institute (INE) | National Statistics Institute (INE) |
| Year | 2013 | 2005–2006 | 2015 | 2014 | 2004 |
| Type | Income and expenditure | Income and expenditure | Multi-purpose | Living standard measurement | Living standard measurement |
| Sample | 5623 out of 5627 | 8222 out of 9600 | 23,669 out of 23,670 | 11,317 out of 11,536 | 8121 out of 8175 |
| (99.9%) | (85.6%) | (100.0%) | (98.1%) | (99.4%) | |
| Coverage | National Urban and Rural areas (NUR) and regions | National Urban and Rural areas (NUR) and macro-regions (with 31 provinces and National District) | National Urban and Rural areas (NUR) and territories | National Urban and Rural areas (NUR) and territories | National Urban and Rural areas (NUR) and territories |
| Date | January–December spread monthly | January–December spread monthly | January–December spread monthly | January–December spread monthly | July–November spread monthly |
| Questionnaire | Demography, income and income sources, the expenditure of goods and services, and other information related to social safety nets | Demography, housing, education, health, employment, agricultural production, income and income sources, the expenditure of goods and services, and other information related to social safety nets | Demography, education, ICTs, housing, employment and income, agricultural production, health, family transactions, the expenditure of goods and services, subsidies, childhood and youth conditions | Demography, the cost of goods and services, education, health, migration, labor market, housing, household food insecurity experience, childhood and adolescence conditions | Demography, income, and expenditure of goods and services, education, health, migration, labor market, housing |
| Costa Rica | Dominican Republic | El Salvador | Guatemala | Honduras | |
|---|---|---|---|---|---|
| Assets (AST) | 0.2595 *** | 0.5572 *** | 0.2492 *** | 0.1809 *** | 0.3200 *** |
| (0.0087) | (0.0260) | (0.0041) | (0.0058) | (0.0154) | |
| Access to basic services (ABS) | 0.1339 *** | 0.1095 *** | 0.1207 *** | 0.1686 *** | 0.0261 *** |
| (0.0067) | (0.0259) | (0.0035) | (0.0044) | (0.0046) | |
| Social safety nets (SSN) | −0.0002 | 0.0613 *** | −0.0135 *** | −0.0326 *** | −0.0075 |
| (0.0221) | (0.0042) | (0.0017) | (0.0075) | (0.0048) | |
| Adaptive capacity (AC) | 0.0802 *** | 0.0464 *** | 0.1430 *** | −0.0203 *** | 0.1557 *** |
| (0.0060) | (0.0082) | (0.0034) | (0.0035) | (0.0190) | |
| ABS *AST | −0.01791 | 0.0050 * | 0.0025 | −0.0247 *** | |
| (0.0198) | (0.0026) | (0.0056) | (0.0051) | ||
| AST *AC | −0.0986 *** | ||||
| (0.0099) | |||||
| AC *SSN | −0.0001 | ||||
| (0.0033) | |||||
| Food expenditure per person per day (FEXPPD) | 1 | 1 | 1 | ||
| (0) | (0) | (0) | |||
| Share of food expenditure (Engel) | 0.4340 *** | 1 | |||
| (0.0243) | (0) | ||||
| Negative of the share of SSEXR | 0.2951 *** | 0.3528 *** | 0.6768 *** | 0.1317 *** | |
| (0.0588) | (0.0269) | (0.0171) | (0.0040) | ||
| Household dietary diversity (HDDS9) | 1.1678 *** | 0.6985 *** | |||
| (0.0521) | (0.0275) | ||||
| The ratio of non-food to food expenditure | 1 | ||||
| (0) | |||||
| Total expenditure per person per day | 1.0807 *** | ||||
| (0.0112) | |||||
| Food insecurity experience (FIE) (Rasch value of ELCSA) | 5.7913 *** | ||||
| (0.1686) | |||||
| Chi−squared (χ²) | 134.77 | 26.87 | 232.83 | 1050.42 | 131.77 |
| p-value | 0.000 | 0.000 | 0.000 | 0.000 | 0.000 |
| TLI | 0.914 | 0.959 | 0.976 | 0.812 | 0.952 |
| CFI | 0.954 | 0.985 | 0.991 | 0.877 | 0.972 |
| RMS | 0.053 | 0.026 | 0.049 | 0.073 | 0.032 |
| Pr RMSEA | 0.246 | 1.000 | 0.589 | 0.000 | 1.00 |
| Number of observations | 5 623 | 8 222 | 23 669 | 11 317 | 8 121 |
| Costa Rica | Dominican Republic | El Salvador | Guatemala | Honduras | |
|---|---|---|---|---|---|
| Intercept | 61.205 *** | 73.864 *** | 50.078 *** | 57.620 *** | 61.1557 *** |
| (0.673) | (0.356) | (0.380) | (0.425) | (0.6667) | |
| Economic shock | 0.155 | ||||
| (0.152) | |||||
| Natural shock (drought/flood) | −0.186 | ||||
| (0.210) | |||||
| Other shocks | 1.236 *** | ||||
| (0.381) | |||||
| Number of children < 5 years | −3.829 *** | −0.337 *** | 0.742 *** | 0.154 | −2.0738 *** |
| (0.389) | (0.126) | (0.116) | (0.125) | (0.1818) | |
| Number of children from 5 to <10 years | −1.657 *** | −1.457 *** | 2.419 *** | −0.338 *** | −1.7965 *** |
| (0.384) | (0.119) | (0.117) | (0.126) | (0.1706) | |
| Number of children from 10 to <18 years | −0.284 | −0.891 *** | 2.935 *** | −0.859 *** | −1.0972 *** |
| (0.263) | (0.093) | (0.081) | (0.086) | (0.1340) | |
| Gender: number of female adults | 5.000 *** | 1.172 *** | 3.794 *** | 0.851 *** | 1.8657 *** |
| (0.322) | (0.121) | (0.087) | (0.115) | (0.1860) | |
| Gender: female household head | −3.714 *** | −0.320 * | −1.738 *** | −1.891 *** | −1.3625 *** |
| (0.498) | (0.186) | (0.143) | (0.235) | (0.3469) | |
| Gender: number of male adults | 1.568 *** | −0.300 *** | 2.177 *** | 0.282 ** | −0.9457 *** |
| (0.309) | (0.110) | (0.092) | (0.119) | (0.1898) | |
| Livelihood: agricultural | −3.131 *** | −2.028 *** | −3. 542 *** | −2.8231 *** | |
| (0.285) | (0.159) | (0.230) | (0.4310) | ||
| Household size: small | −0.985 *** | −3.522 *** | −0.347 | −0.8448 ** | |
| (0.243) | (0.189) | (0.252) | (0.3971) | ||
| Poverty: extreme (food poor) | −13.692 *** | −16.254 *** | −18.500 *** | ||
| (0.210) | (0.218) | (0.304) | |||
| Poverty: poor | −6.767 *** | −9.864 *** | −11.738 *** | ||
| (0.199) | (0.140) | (0.210) | |||
| Area: rural | −7.719 *** | −3.574 *** | −7.971 *** | −5.326 *** | −12.3324 *** |
| (0.459) | (0.186) | (0.140) | (0.195) | (0.3785) |
| Costa Rica | |
|---|---|
| Territory (Region) | |
| Chorotega | −8.817 *** |
| (0.678) | |
| Pacífico Central | −8.010 *** |
| (0.711) | |
| Brunca | −9.858 *** |
| (0.680) | |
| Huetar Caribe | −11.561 *** |
| (0.688) | |
| Huetar Norte | −9.674 *** |
| (0.680) | |
| Observations | 5 623 |
| R-squared | 0.2186 |
| Dominican Republic | |
| Territory (Province) | |
| Azua | −5.798 *** |
| (0.522) | |
| Baoruco | −8.458 *** |
| (0.691) | |
| Barahona | −7.182 *** |
| (0.497) | |
| Dajabon | −6.332 *** |
| (1.220) | |
| Duarte | −2.302 *** |
| (0.577) | |
| Elias Piña | −10.115 *** |
| (0.824) | |
| El Seibo | −4.972 *** |
| (0.582) | |
| Espaillat | −1.212 * |
| (0.624) | |
| Independencia | −7.942 *** |
| (0.882) | |
| La Altagracia | 0.102 |
| (0.474) | |
| La Romana | −0.890 * |
| (0.465) | |
| La Vega | −2.286 *** |
| (0.509) | |
| María Trinidad Sánchez | −1.259 * |
| (0.708) | |
| Monte Cristi | −3.659 *** |
| (0.778) | |
| Pedernales | −10.175 *** |
| (1.297) | |
| Peravia | −2.669 *** |
| (0.553) | |
| Puerto Plata | −1.820 *** |
| (0.541) | |
| Hermanas Mirabal | −3.410 *** |
| (0.922) | |
| Samana | −2.835 *** |
| (0.854) | |
| San Cristóbal | −2.092 *** |
| (0.395) | |
| San Juan | −6.683 *** |
| (0.472) | |
| San Pedro de Macorís | −2.333 *** |
| (0.423) | |
| Sánchez Ramírez | −3.450 *** |
| (0.724) | |
| Santiago | −1.595 *** |
| (0.408) | |
| Santiago Rodríguez | −3.713 *** |
| (1.085) | |
| Valverde | −1.722 ** |
| (0.731) | |
| Monseñor Nouel | −2.576 *** |
| (0.701) | |
| Monte Plata | −6.920 *** |
| (0.467) | |
| Hato Mayor | −6.628 *** |
| (0.595) | |
| San José de Ocoa | −4.085 *** |
| (0.832) | |
| Santo Domingo | −1.910 *** |
| (0.350) | |
| Observations | 8 222 |
| R-squared | 0.5822 |
| El Salvador | |
| Territory (Departamento) | |
| Santa Ana | 2.261 *** |
| (0.311) | |
| Sonsonate | 0.901 *** |
| (0.343) | |
| Chalatenango | 4.483 *** |
| (0.407) | |
| La Libertad | 3.380 *** |
| (0.321) | |
| San Salvador | 3.985 *** |
| (0.299) | |
| Cuscatlán | 1.256 *** |
| (0.328) | |
| La Paz | 1.143 *** |
| (0.358) | |
| Cabañas | 1.914 *** |
| (0.352) | |
| San Vicente | 2.096 *** |
| (0.360) | |
| Usulután | 1.548 *** |
| (0.388) | |
| San Miguel | 3.501 *** |
| (0.326) | |
| Morazán | 1.486 *** |
| (0.355) | |
| La Unión | 3.539 *** |
| (0.352) | |
| Observations | 23 670 |
| R-squared | 0.4967 |
| Guatemala | |
| Territory (Departamento) | |
| El Progreso | −5.568 *** |
| (0.508) | |
| Sacatepéquez | −1.413 *** |
| (0.422) | |
| Chimaltenango | −2.861 *** |
| (0.507) | |
| Escuintla | −5.230 *** |
| (0.446) | |
| Santa Rosa | −5.490 *** |
| (0.541) | |
| Sololá | −0.277 |
| (0.561) | |
| Totonicapán | −2.400 *** |
| (0.560) | |
| Quetzaltenango | −2.617 *** |
| (0.453) | |
| Suchitepéquez | −6.091 *** |
| (0.468) | |
| Retalhuleu | −5.582 *** |
| (0.541) | |
| San Marcos | −2.800 *** |
| (0.542) | |
| Huehuetenango | −2.268 ** |
| (0.536) | |
| Quiché | −2.494 *** |
| (0.556) | |
| Baja Verapaz | −5.793 *** |
| (0.574) | |
| Alta Verapaz | −5.948 *** |
| (0.592) | |
| Petén | −6.495 *** |
| (0.486) | |
| Izabal | −1.397 *** |
| (0.554) | |
| Zacapa | −1.121 *** |
| (0.556) | |
| Chiquimula | −5.527 *** |
| (0.566) | |
| Jalapa | −5.498 *** |
| (0.519) | |
| Jutiapa | −6.459 *** |
| (0.475) | |
| Observations | 11 317 |
| R-squared | 0.583 |
| Honduras | |
| Territory (Departamento) | |
| Atlántida | −0.3244 |
| (0.8210) | |
| Colón | −2.9900 *** |
| (0.7058) | |
| Comayagua | −6.5267 *** |
| (0.8377) | |
| Copán | −11.0965 *** |
| (0.7381) | |
| San Pedro Sula, Cortés | −1.2310 *** |
| (0.3037) | |
| Resto de Cortés | 0.8205 |
| (0.6343) | |
| Choluteca | −6.7883 *** |
| (0.7879) | |
| El Paraíso | −12.5532 *** |
| (0.6816) | |
| Resto de Francisco Morazán | −6.4972 *** |
| (1.0356) | |
| Gracias a Dios | 0.5682 |
| (1.9858) | |
| Intibucá | −7.7107 *** |
| (0.9957) | |
| Islas de la Bahía | 6.5423 *** |
| (1.9621) | |
| La Paz | −7.6270 *** |
| (0.9261) | |
| Lempira | −12.1412 *** |
| (1.0688) | |
| Ocotepeque | −8.2790 *** |
| (1.1276) | |
| Olancho | −6.3465 *** |
| (0.6445) | |
| Santa Bárbara | −10.7710 *** |
| (0.6556) | |
| Valle | −8.7641 *** |
| (1.1645) | |
| Yoro | −2.5708 *** |
| (0.7092) | |
| Observations | 8 123 |
| R-squared | 0.4301 |
Publisher’s Note: MDPI stays neutral with regard to jurisdictional claims in published maps and institutional affiliations. |
© 2021 by the authors. Licensee MDPI, Basel, Switzerland. This article is an open access article distributed under the terms and conditions of the Creative Commons Attribution (CC BY) license (https://creativecommons.org/licenses/by/4.0/).
Share and Cite
Sibrian, R.; d’Errico, M.; Palma de Fulladolsa, P.; Benedetti-Michelangeli, F. Household Resilience to Food and Nutrition Insecurity in Central America and the Caribbean. Sustainability 2021, 13, 9086. https://doi.org/10.3390/su13169086
Sibrian R, d’Errico M, Palma de Fulladolsa P, Benedetti-Michelangeli F. Household Resilience to Food and Nutrition Insecurity in Central America and the Caribbean. Sustainability. 2021; 13(16):9086. https://doi.org/10.3390/su13169086
Chicago/Turabian StyleSibrian, Ricardo, Marco d’Errico, Patricia Palma de Fulladolsa, and Flavia Benedetti-Michelangeli. 2021. "Household Resilience to Food and Nutrition Insecurity in Central America and the Caribbean" Sustainability 13, no. 16: 9086. https://doi.org/10.3390/su13169086