Article

Characterizing the Theory of Spreading Electric Vehicles in Luxembourg

1
Department of Engineering, University of Luxembourg, L-1359 Luxembourg, Luxembourg
2
Department of Energy, Institute of Science and High Technology and Environmental Sciences, Graduate University of Advanced Technology, Kerman 7631818356, Iran
*
Author to whom correspondence should be addressed.
Sustainability 2021, 13(16), 9068; https://doi.org/10.3390/su13169068
Submission received: 28 June 2021 / Revised: 6 August 2021 / Accepted: 10 August 2021 / Published: 13 August 2021
(This article belongs to the Collection Sustainable Development of Electric Vehicle)

Abstract

:
The development of electric vehicles (EVs) is happening around the world with different goals. Many researchers have worked on various aspects of EVs from technological and supporting policy issues to the development of required infrastructures. However, arguing the proper time to realize the spreading of EVs in each region is neglected. For this purpose, the performance of two contextual factors in each region on the growth of EVs is investigated. Low carbon electricity generation and greenhouse gases emissions are the selected parameters, which are explored in the context of nine European countries, besides Luxembourg, to find their impacts on the issue. These countries have the highest shares of EVs in their energy systems. The achieved results are applied to the Luxembourg case to evaluate how different contextual factors may have hindered the growth of EVs here. In the next step, an analogy between the spreading EVs in Luxembourg and leapfrogging different technologies in the world is made to build a theory of the development of EVs. The theory defines the spreading EVs in Luxembourg as a leapfrogging energy technology to adopt new technology. It is concluded that the development of EVs has a normal priority in Luxembourg.

1. Introduction

The speed of technological progress in the past few decades in industrializing countries has inspired a renewed optimism about some shorter paths to the planned development. For industrializing countries, the idea is tremendously appealing, because it assumes that if an advanced, cleaner technology exists, it can be transferred to developing countries and widely deployed. Specifically, it is gathering more attention that developing countries do not need to choose necessarily the same path of development as industrialized countries did before [1]. Rather they might well be able to pass over the dirty stages and keep up with clean technologies [2,3]. The idea is known as leapfrogging, which has been applied to several different technological opportunities such as information and communication technologies (ICT) and biotechnology [4].
There is a belief about the role of leapfrogging strategies to avoid the lock-in effect in industrializing countries [5]. Actually, the lock-in effect is a big concern for environmentalists. The effect is describing why hydrocarbon-intensive technologies continue to dominate in developed economies [5]. It describes that taking short-term actions to invest in leapfrogging technologies can be placed to prevent lock-in [5,6]. However, it is still unclear to what extent a leapfrogging strategy could be effective to avoid being locked into hydrocarbon-intensive technologies and infrastructures similar to what happened to developed economies.
In the first look, the concept of technology leapfrogging refers to an idea that today’s developing countries have access to a set of efficient technologies that were not available to developed countries in the past when they were at similar stages of economic development [7,8]. Everything is perfect on the paper. However, several historical failures in projects that followed the idea have been recorded. The challenges would induce a different viewpoint about the success of applying the core idea in any case.
The considered issue in this study is an aspect of future energy systems. The purpose of investigating the future issues is to provide policymakers with the data to facilitate their decisions or assist the researchers to imagine new worlds with the proposed scenarios [9,10]. The main features of these scenarios in Europe have been indicated according to agreed roadmaps in the European Union [11]. Electric vehicles and the growth rate of road transport electrification is a key issue in the future energy system that attracted attention significantly. The use of electric vehicles enhances the application of electricity in the energy system and directly addresses environmental concerns and energy security. However, there is a wide range of registering electric vehicles in the EU member states. The wide range of applying EVs is interpreted as the different penetration rates of EVs in various regions. Despite so many efforts to spread electric vehicles, its market share has expanded less than was expected in some countries [12]. As stated in the literature, the market would not reach a commercial scale over the next 20 years and probably will remain in a niche format [12,13].
An assessment of the effective factors on emerging new trends in different countries to go toward/outward electric vehicles is the subject of this study. Investigating the barriers to the development of EVs in different countries were noticed previously. Indeed, barriers were classified to present different aspects [14]. As identified in the literature, the barriers were presented with the following five categories: technical, policy, economic, infrastructure, and social. For depicting this category, the customers’ viewpoint was referenced. The issue was explored in the literature on a greater scale [15]. They evaluated barriers on a wide-scale of deployment of alternative fuels and technologies, as well as potential policies and actions. An investigation of different policy incentives with the fuzzy-set qualitative comparative analysis methodology was conducted in [16]. The authors concluded that to increase the promotion of EVs, a mix of incentives is needed. A study of the operational difficulties of applying batteries to electric vehicles was conducted in [17]. The purpose was to show how these difficulties negatively affected the interest of individuals or companies to use EVs for their transportation. Discussing the spreading of electric vehicles with the psychological viewpoint was recently noticed [18]. The purpose of this study was to show how different aspects of spreading EVs could be challenged by the psychological consideration. In another study, the conflict of interest between different stakeholders and the inaction of related actors were distinguished as the key barriers inhibiting the further development of EVs [19]. The users’ judgment and their perceptions to use new technology in the transport sector was the subject of another study. Indeed, the customers’ resistance to adopt the unproven technologies of EVs was discussed [20].
The significance of this study is to investigate the drivers to promote electric vehicles and not to argue the facing difficulties of EVs. Alternatively, the study addresses the issue from a policy maker’s point of view and not a user of EVs. Usually, barriers are referred to as difficulties that face the growth of EVs, but sometimes a lack of push or weak ambition has the same function. The latest point is rarely focused on, especially in the context of a specific country, which is the subject of this study.
To study the considered idea, the nine European countries with the highest share of electric vehicles are investigated to find the function of the contextual factors.
To increase the precision of studying the function of the selected parameters, it is assumed that the impact of the user’s behavior to adopt the technology is not varied considerably in the studied countries. Alternatively, it is supposed that people with various origins in the studied countries more or less behave similarly to adopt electric vehicles. Indeed, this assumption is not generally applicable because nationality or borders may distinguish people in behavior in some cases [21]. However, the assumption across Europe, regarding the Schengen agreement, with a considerable intra-Europe labor mobility rate, is not far from the reality [22]. Therefore, it is hypothesized that the high penetration rate of electric vehicles in the European market could not be largely attributed to differences among various nationalities. Rather, it is recognized as the decision of the governments to encourage people toward a favorable path based on available local potentials.
The comparison results are used to explain the growth rate of EVs in Luxembourg.
The transport sector in Luxembourg is responsible for a big fraction of total oil-products’ consumption. It draws more attention when the rapid growth of an annual number of registered passenger cars received attention in Luxembourg in the last three decades. From 1990 to 2016, the growth of registered cars was significant, more than 213% [23]. This figure is further highlighted when the highest number of passenger cars per thousand inhabitants in Luxembourg in comparison with other European countries is noticed [24]. Therefore, it is interpreted as a unique opportunity, which is inclined to advanced energy technologies.
To accelerate the spreading of electric vehicles, the government has introduced single-purpose funds. It has aimed at decreasing the purchasing cost of the technologies. Thus, Luxembourg can take advantage of electric vehicles to move toward a cleaner system quickly, before sinking into an entire hydrocarbon infrastructure.
However, it is questioned to what extent introducing EVs in Luxembourg could be similar to forerunner countries in Europe such as Norway, Finland, and Denmark. Alternatively, how are the initiatives of the development of electric vehicles in Luxembourg similar to other countries?
Explaining Luxembourg’s initiatives to pursue EVs is the next considered topic in the paper. Generally, if the conditions of a country are not similar to the leading countries in this field, how initiatives to spread EVs could be described.
To address the issue, the promotion of EVs is assumed as a leapfrogging technology-based project to be compared with historical leapfrogging cases. The purpose of exploration is to characterize the development theory of EVs in Luxembourg.
The outcome would be contributed to responding to the following questions,
-
To what extent would the initiatives of transferring electric vehicles in Luxembourg be comparable with other similar projects elsewhere?
-
What could the incentives and barriers to a leapfrogging argument in Luxembourg be?
-
What can be inferred about Luxembourg’s ability to leapfrog?
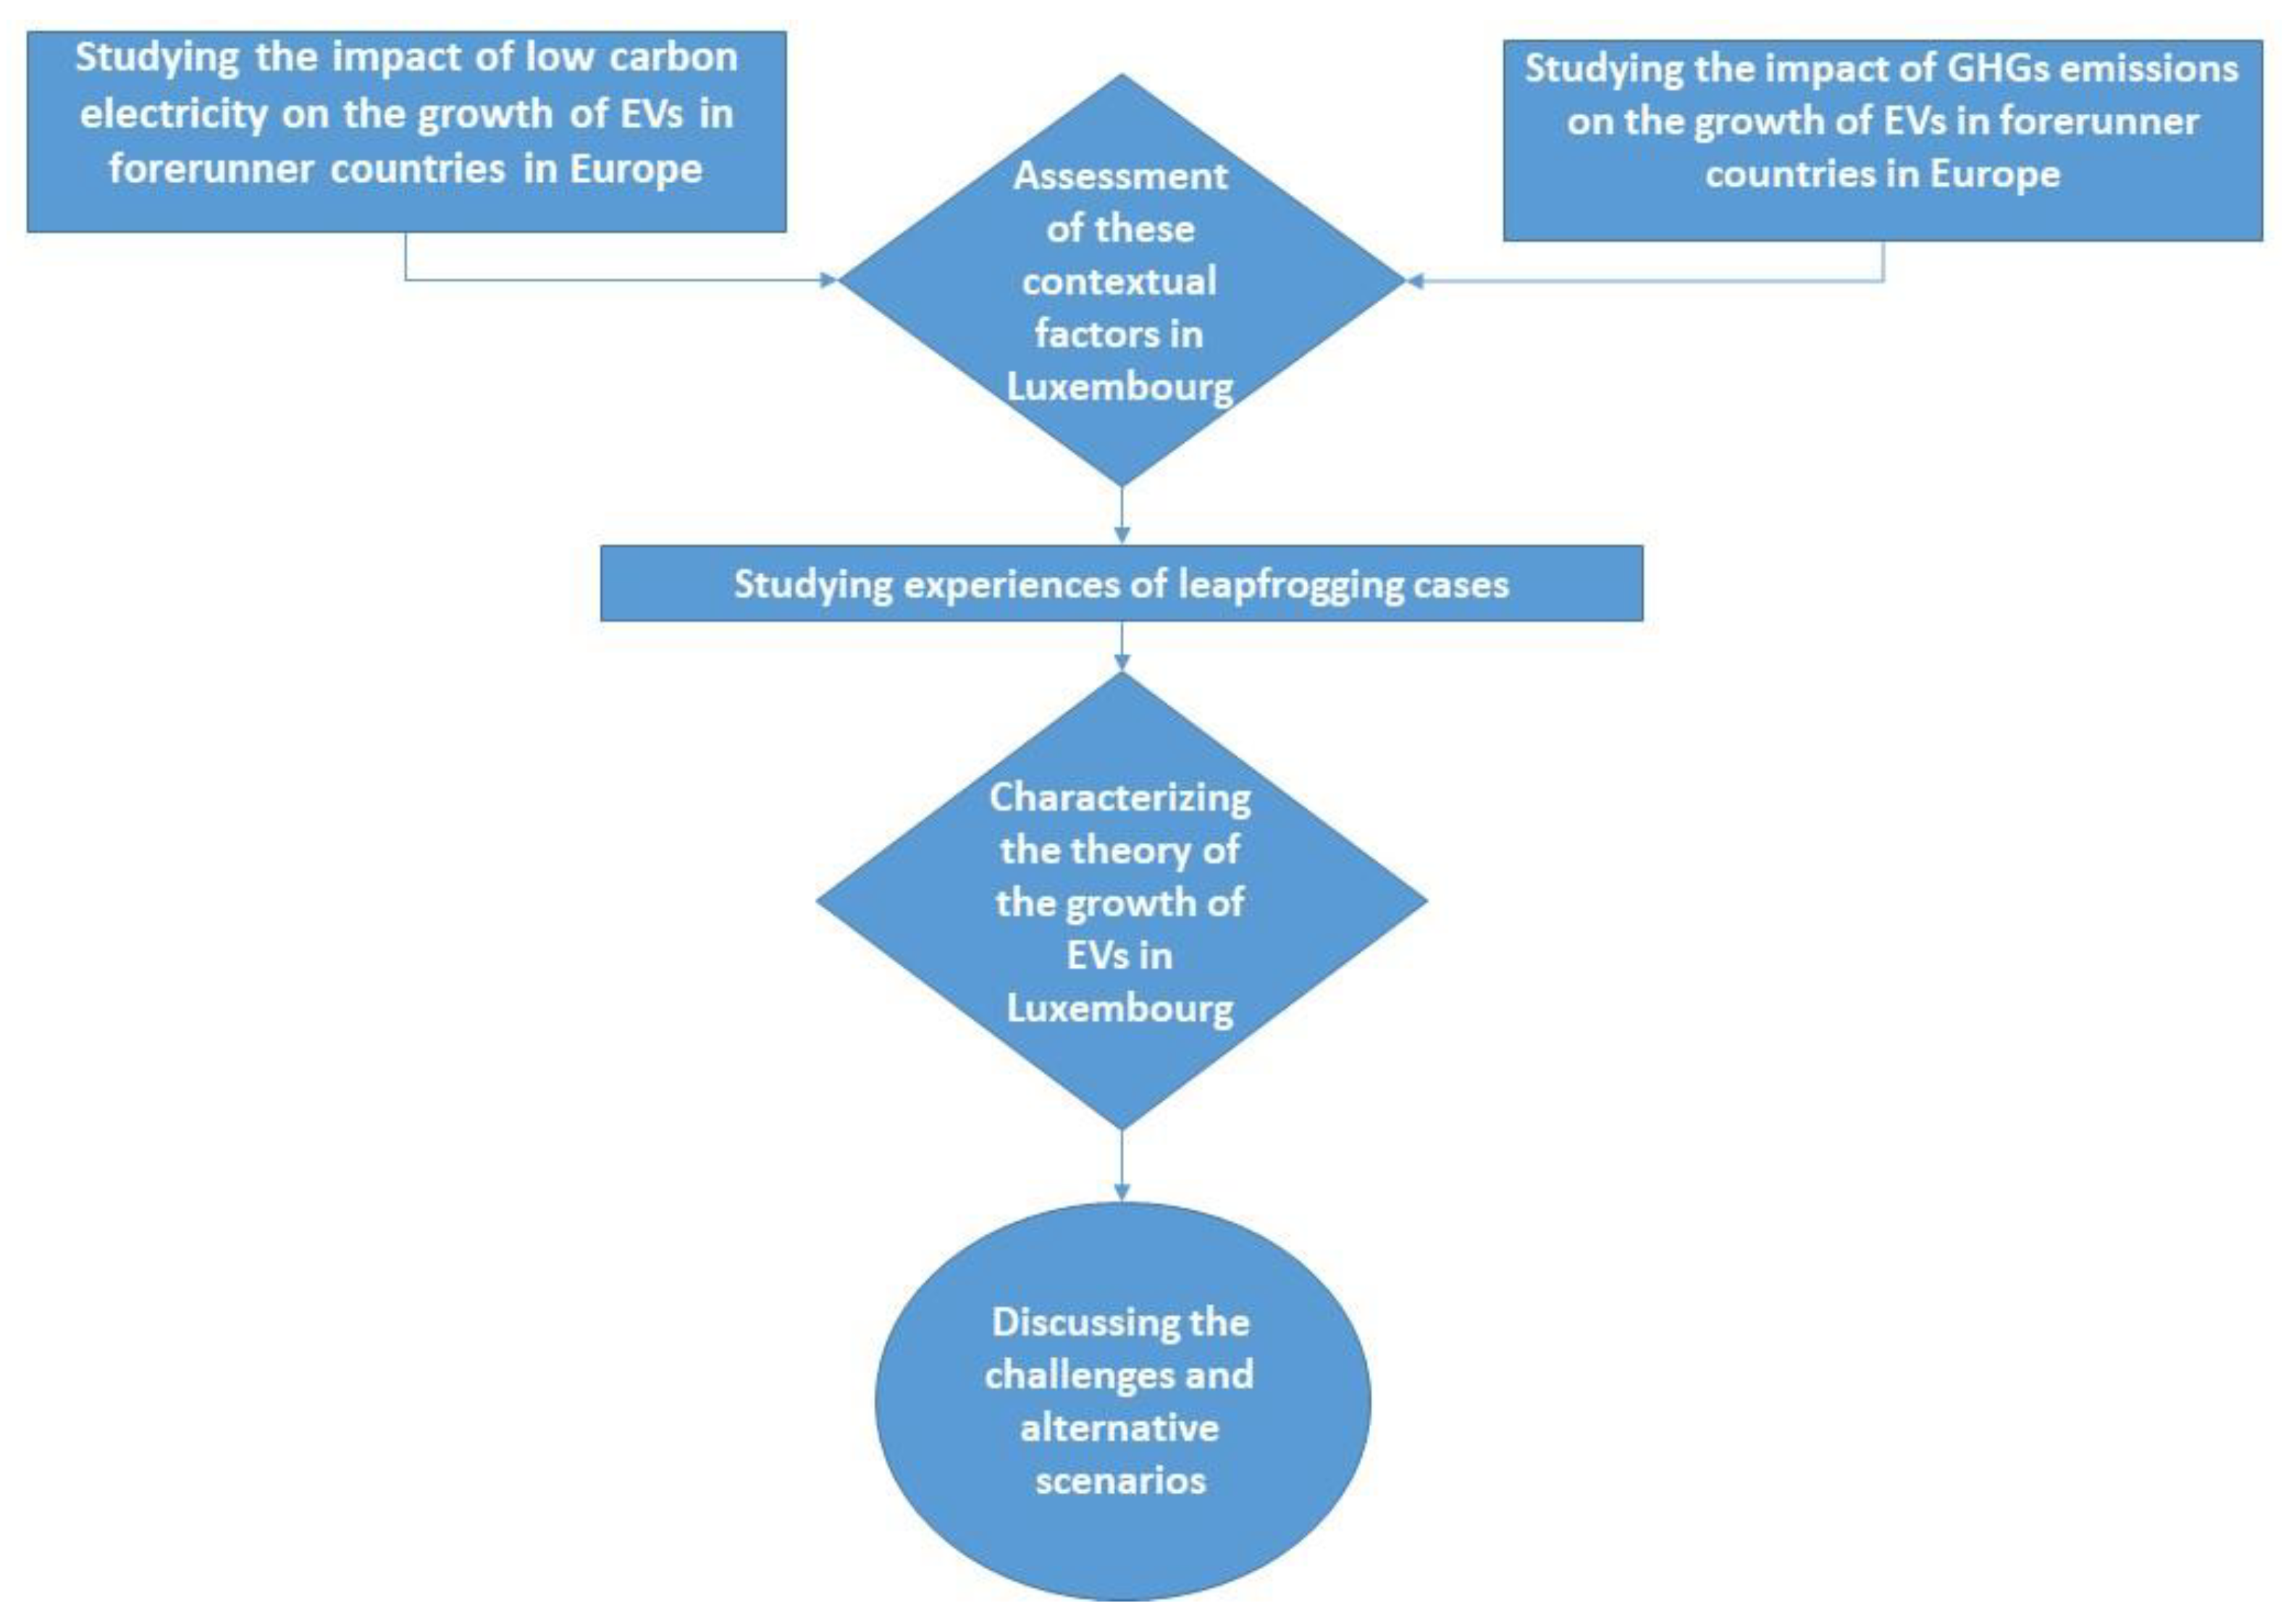
In this study, the theory of spreading electric vehicles in terms of purpose is addressed.
Studying the link between the growth of low carbon electricity generation and the promotion of electric vehicles in diverse regions leads to a preliminary yet holistic conceptualization of the topic. Furthermore, it provides a comprehensive understanding of how the interactions of contextual factors cause a move toward/outward the development of EVs.
The expected contribution of this study focuses on characterizing the theory of spreading electric vehicles in the context of Luxembourg. The study explores the impact of two specific contextual factors on the growth of EVs to characterize the theory of spreading in Luxembourg. To the best knowledge of the authors, there is no published research in the scope of the study in the context of Luxembourg. This paper is organized into the following eight sections: In Section 2, the applied procedure is described. The analysis of two contextual factors in the nine countries with the highest share of EVs is conducted in Section 3. In Section 4, leapfrogging processes are explored. The initiatives of spreading EVs in Luxembourg in a theoretical template is discussed in Section 5. In Section 6, alternative scenarios to invest in instead of spreading EVs are explored. In Section 7, the results are discussed. Finally, Section 8 includes the conclusion.

2. Research Design

The employed methodology in the study is a comparative research method based on the evidence in the existing literature, which is a distinctive form of research. It is applied to study the literature with a consistent concept.
The comparative method provides access to valid theories in the scope of the project in the world. The main function of the method is to prevent researchers from over-generalizing based on their own, or what is called idiosyncratic [25].
The reason for applying the research method is the lack of studying the issue in the context of Luxembourg in the scope of this study. The purpose to conduct the literature review is to synthesize the literature and integrate diverse and sometimes conflicting perspectives from the literature to build a theory in the field. The theory is about the purpose of the development of electric vehicles in Luxembourg. The applied logic in this research method is to explore different outcomes with different contextual conditions as factors of influence [25].
The methodology includes determining the scope of the review, identifying the relevant literature, and structuring and synthesizing the literature to build a theory in the context of Luxembourg [26,27]. The expected theory is a generalization from the literature review.
In this study, it is aimed to find the impact of generating low carbon electricity and GHG emissions as two contextual factors on the spreading of EVs in Luxembourg. For this purpose, the nine European countries with the highest share of EVs in the energy systems are focused on. The objective is to understand the strength of each parameter in the case studies to find to what extent these parameters would drive the spreading of EVs in Luxembourg. In the next step, spreading the electric vehicles in Luxembourg is compared to leapfrogging technologies in the world using available case studies with the purpose of analyzing the drivers and limiting factors to contribute toward building a theory. An overview of the different steps of the paper is shown in Figure 1.

3. Case Studies

In this section, two contextual factors are selected to compare the countries with the highest share of EVs in their energy system. It is intended to show the impact of the considered factors on driving the development of electric vehicles in different countries rather than measuring it.

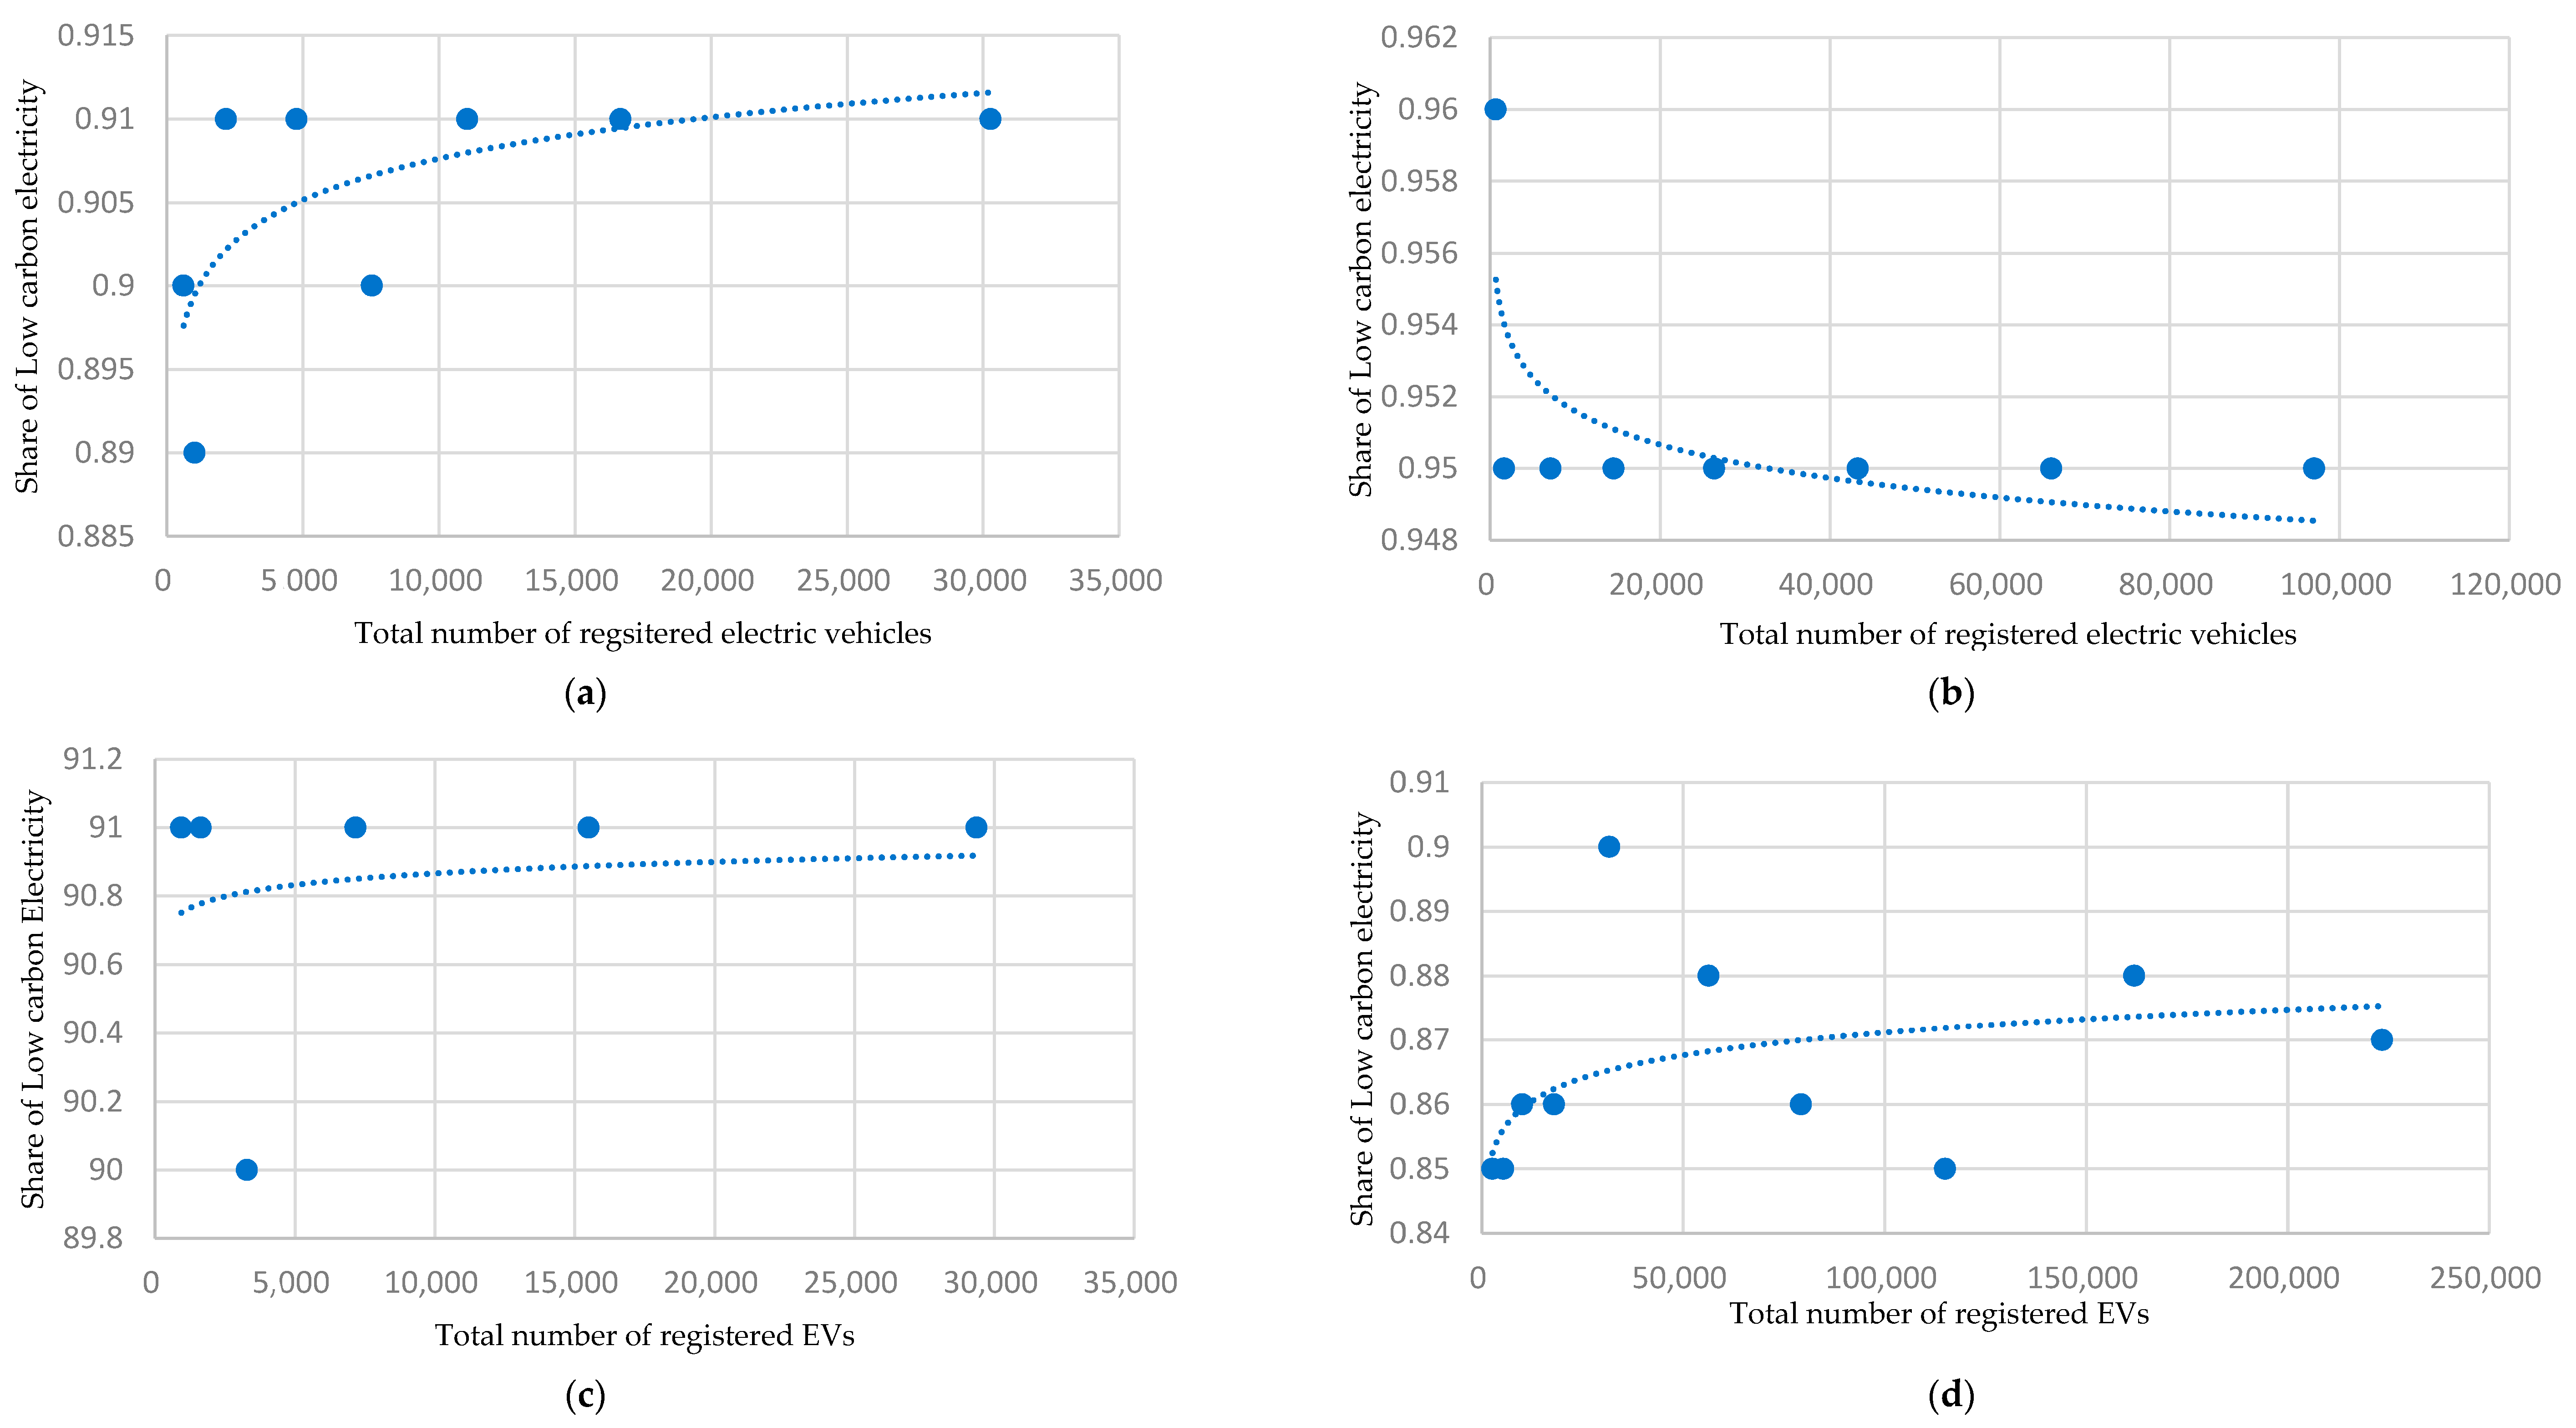
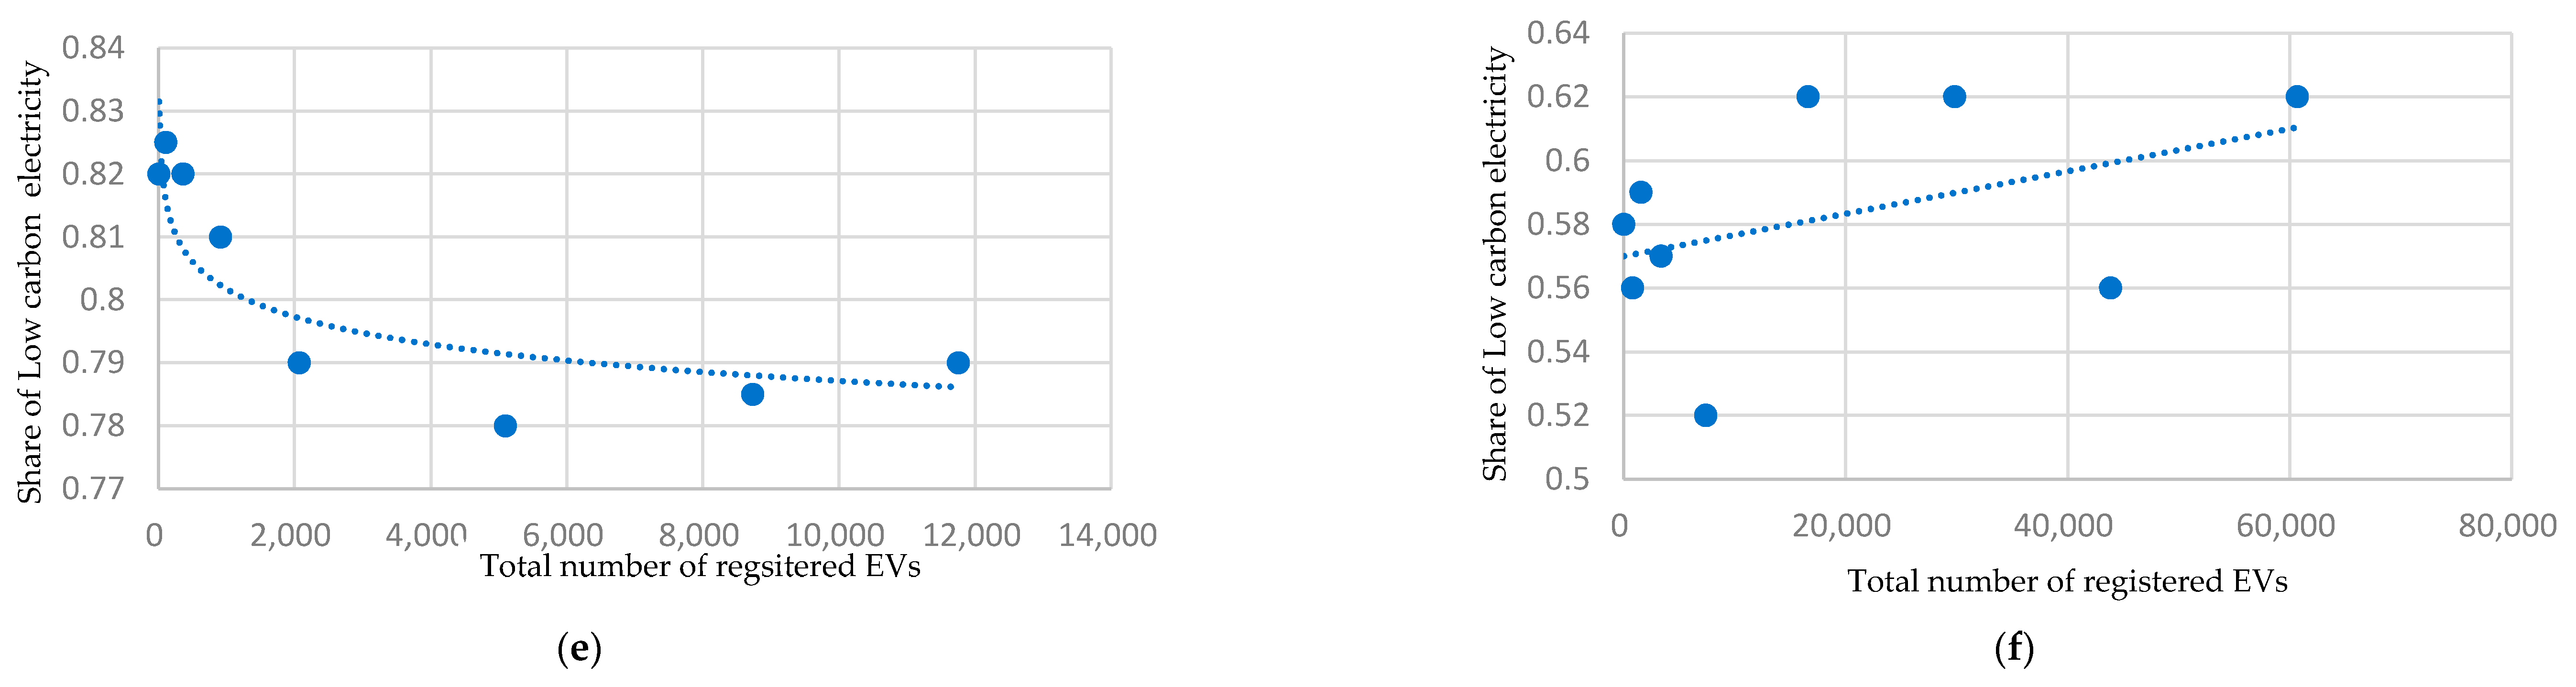
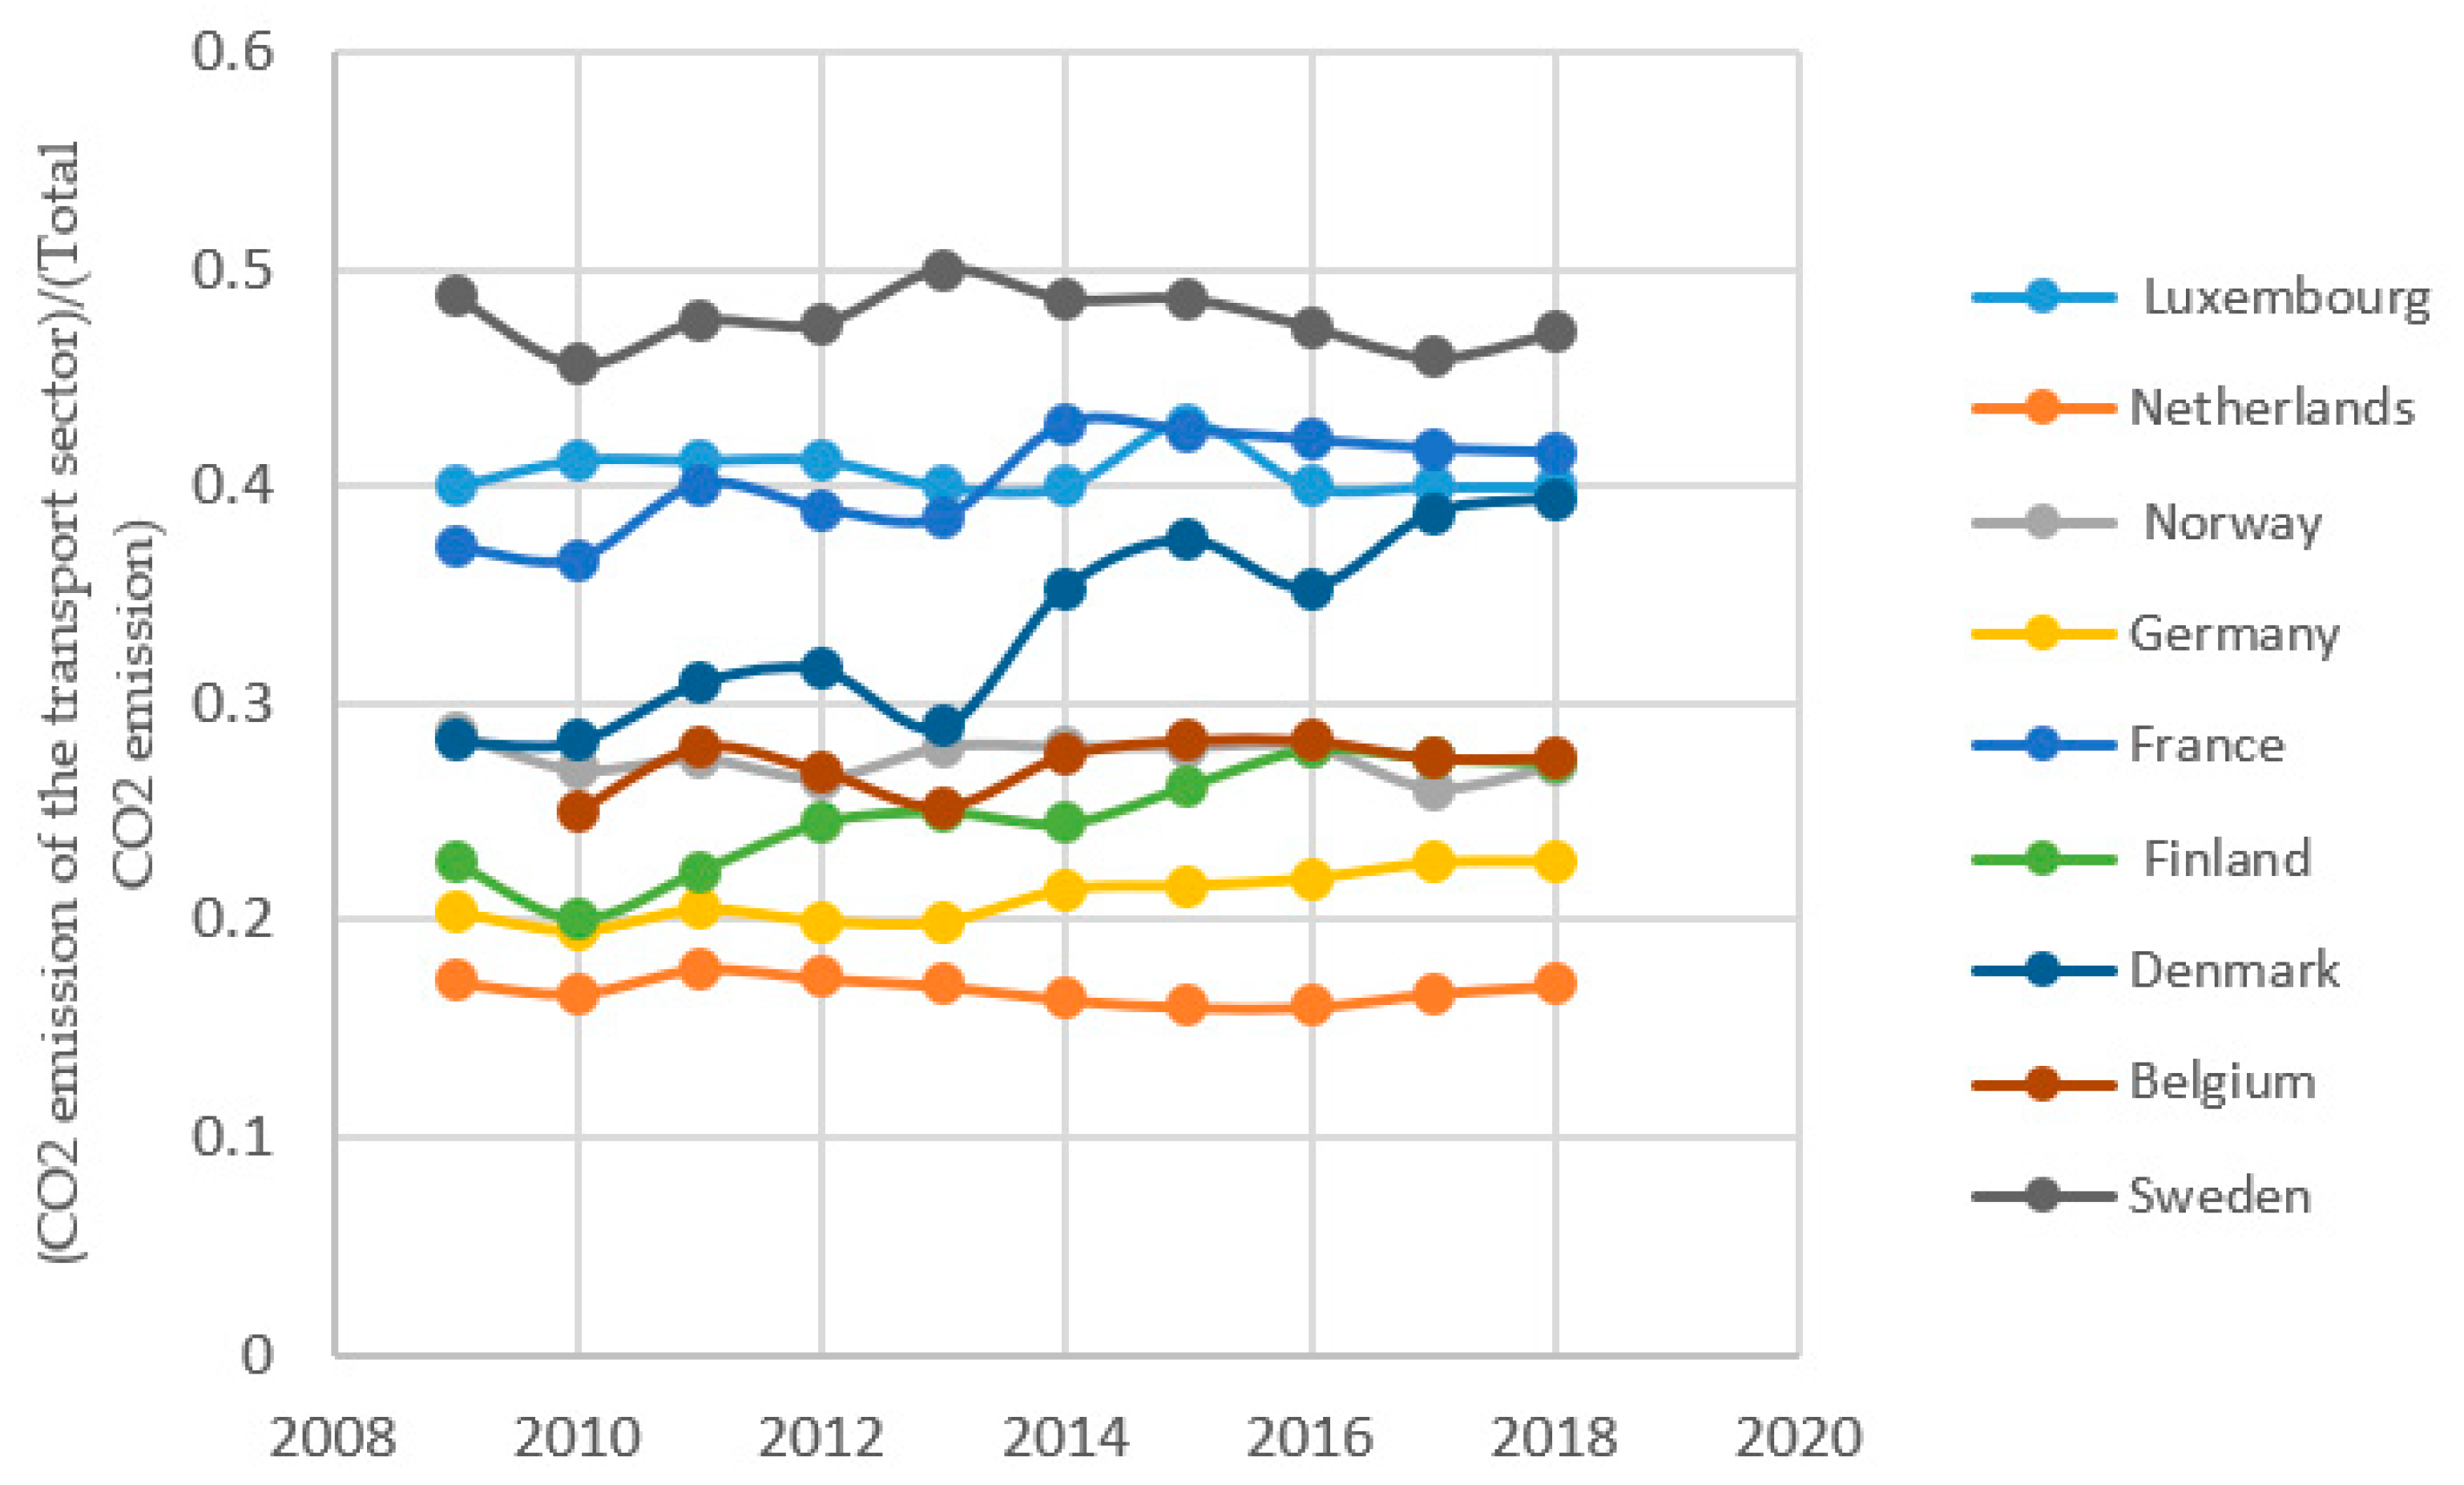
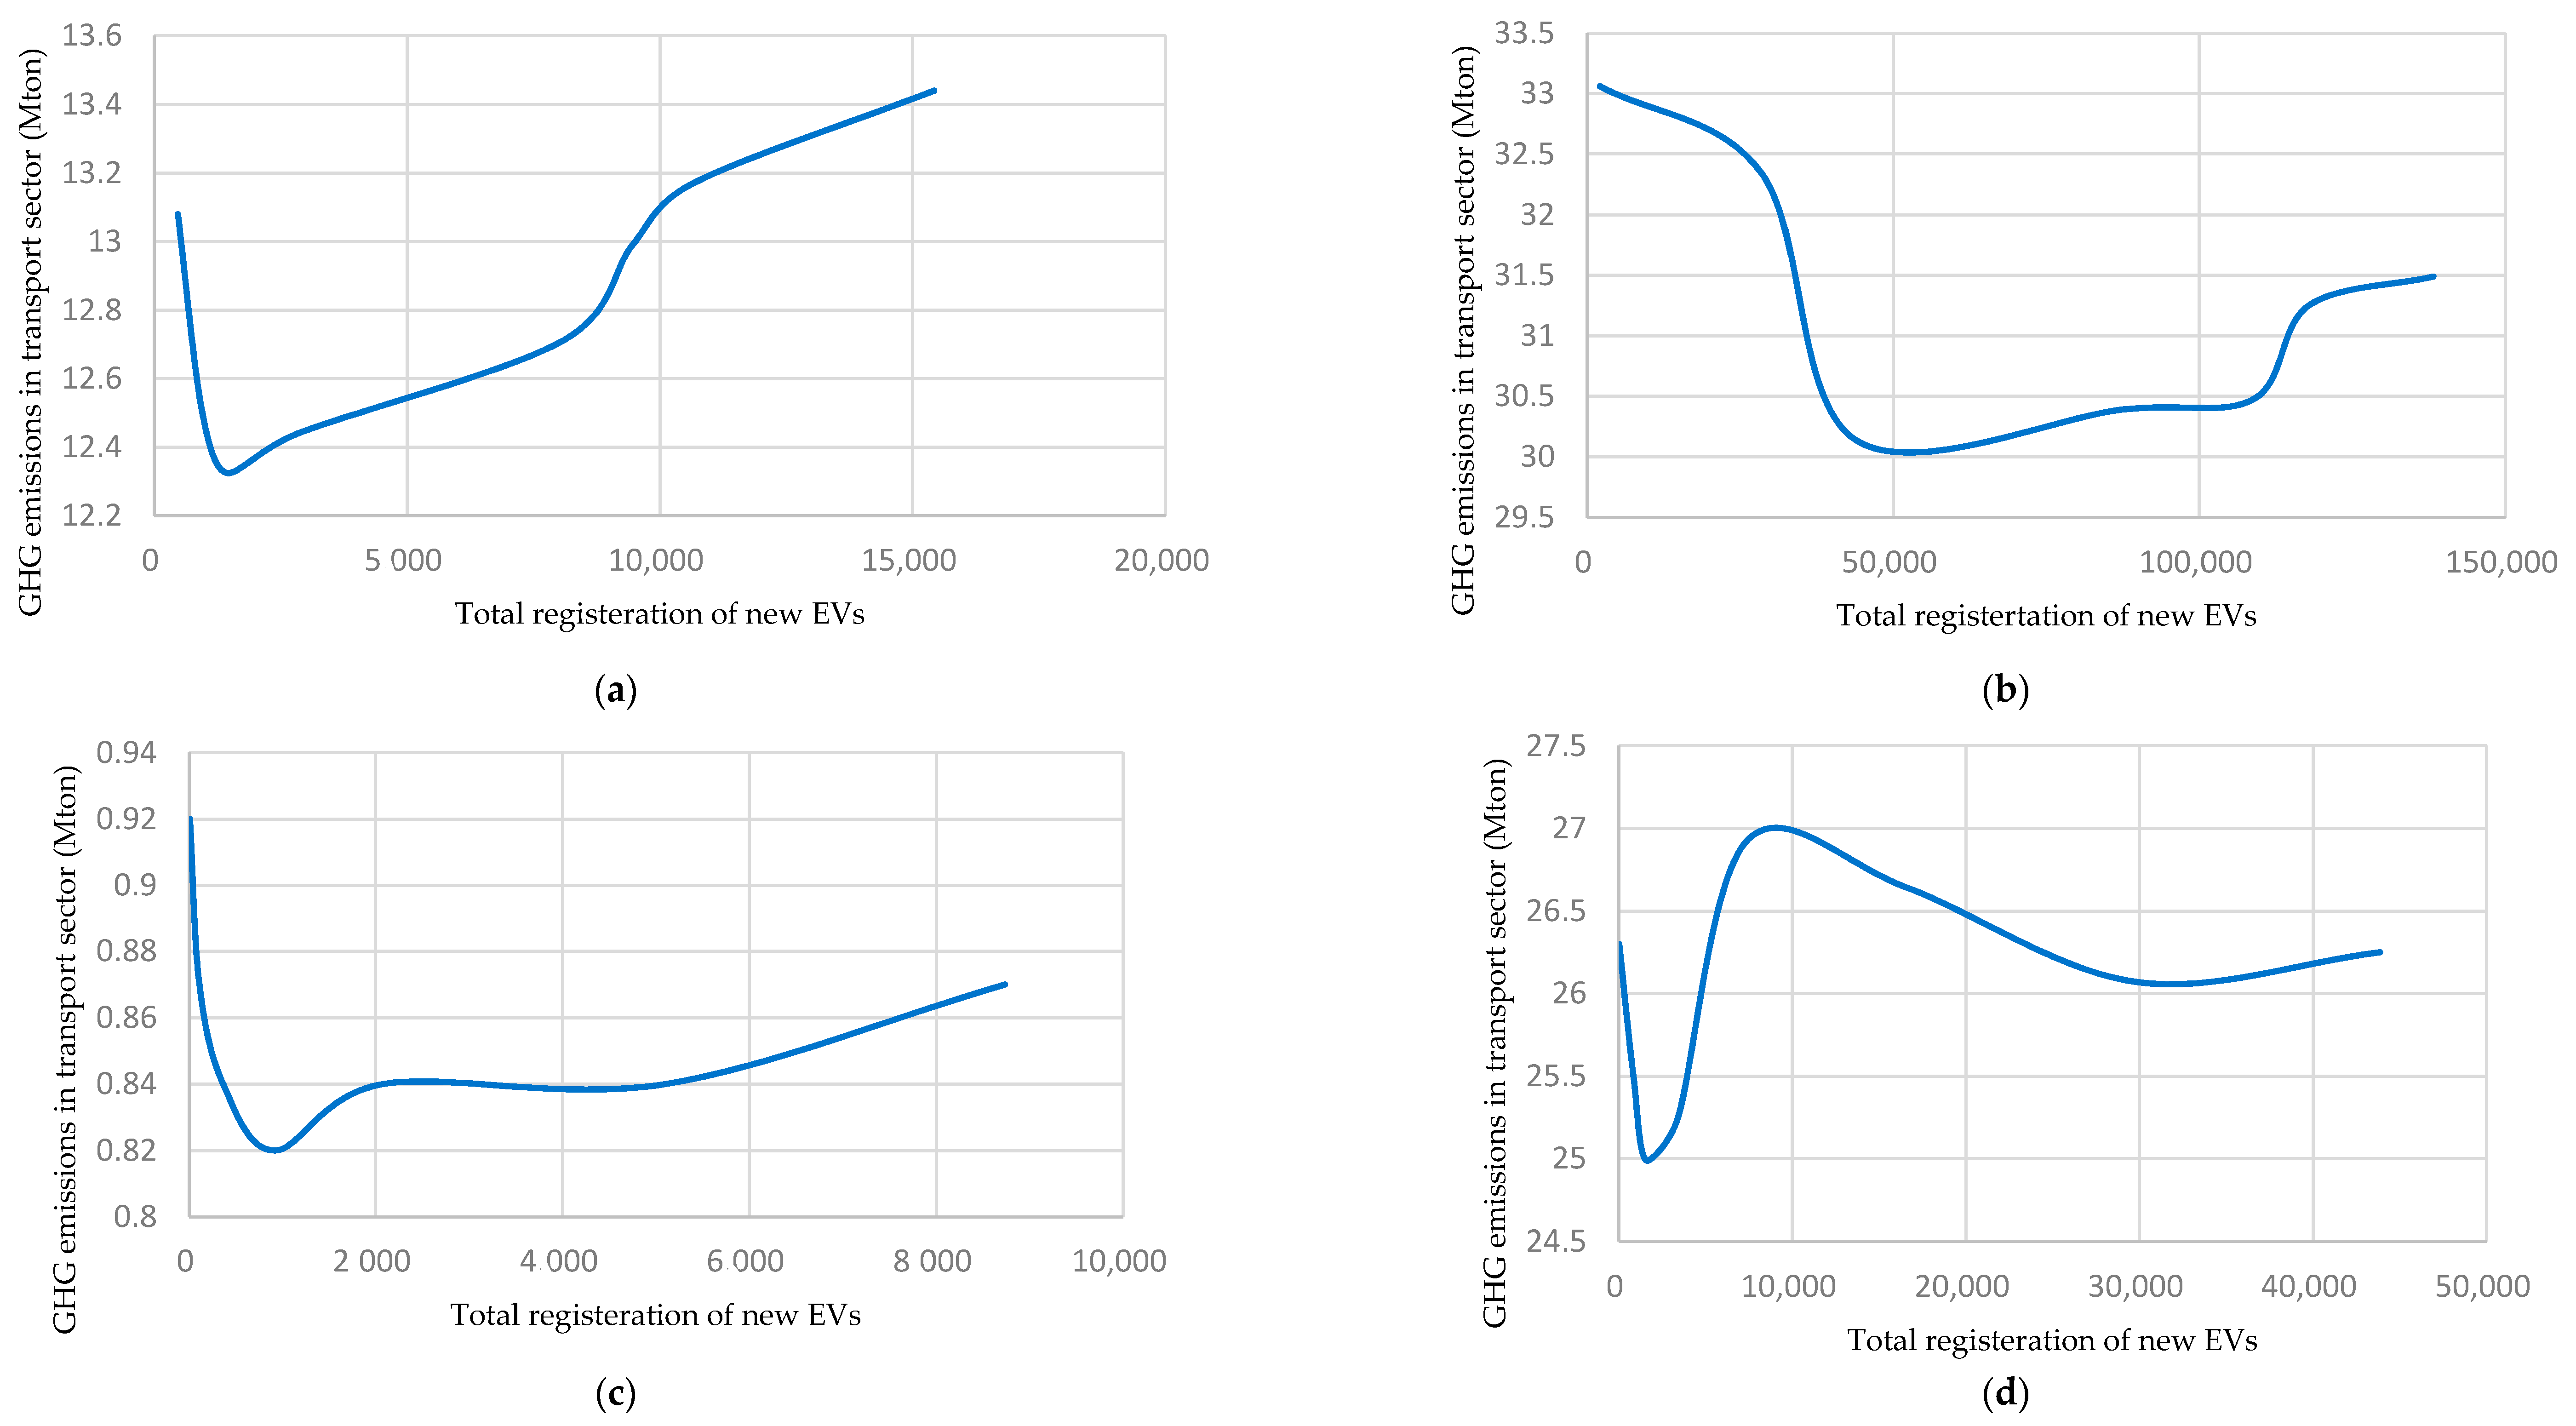
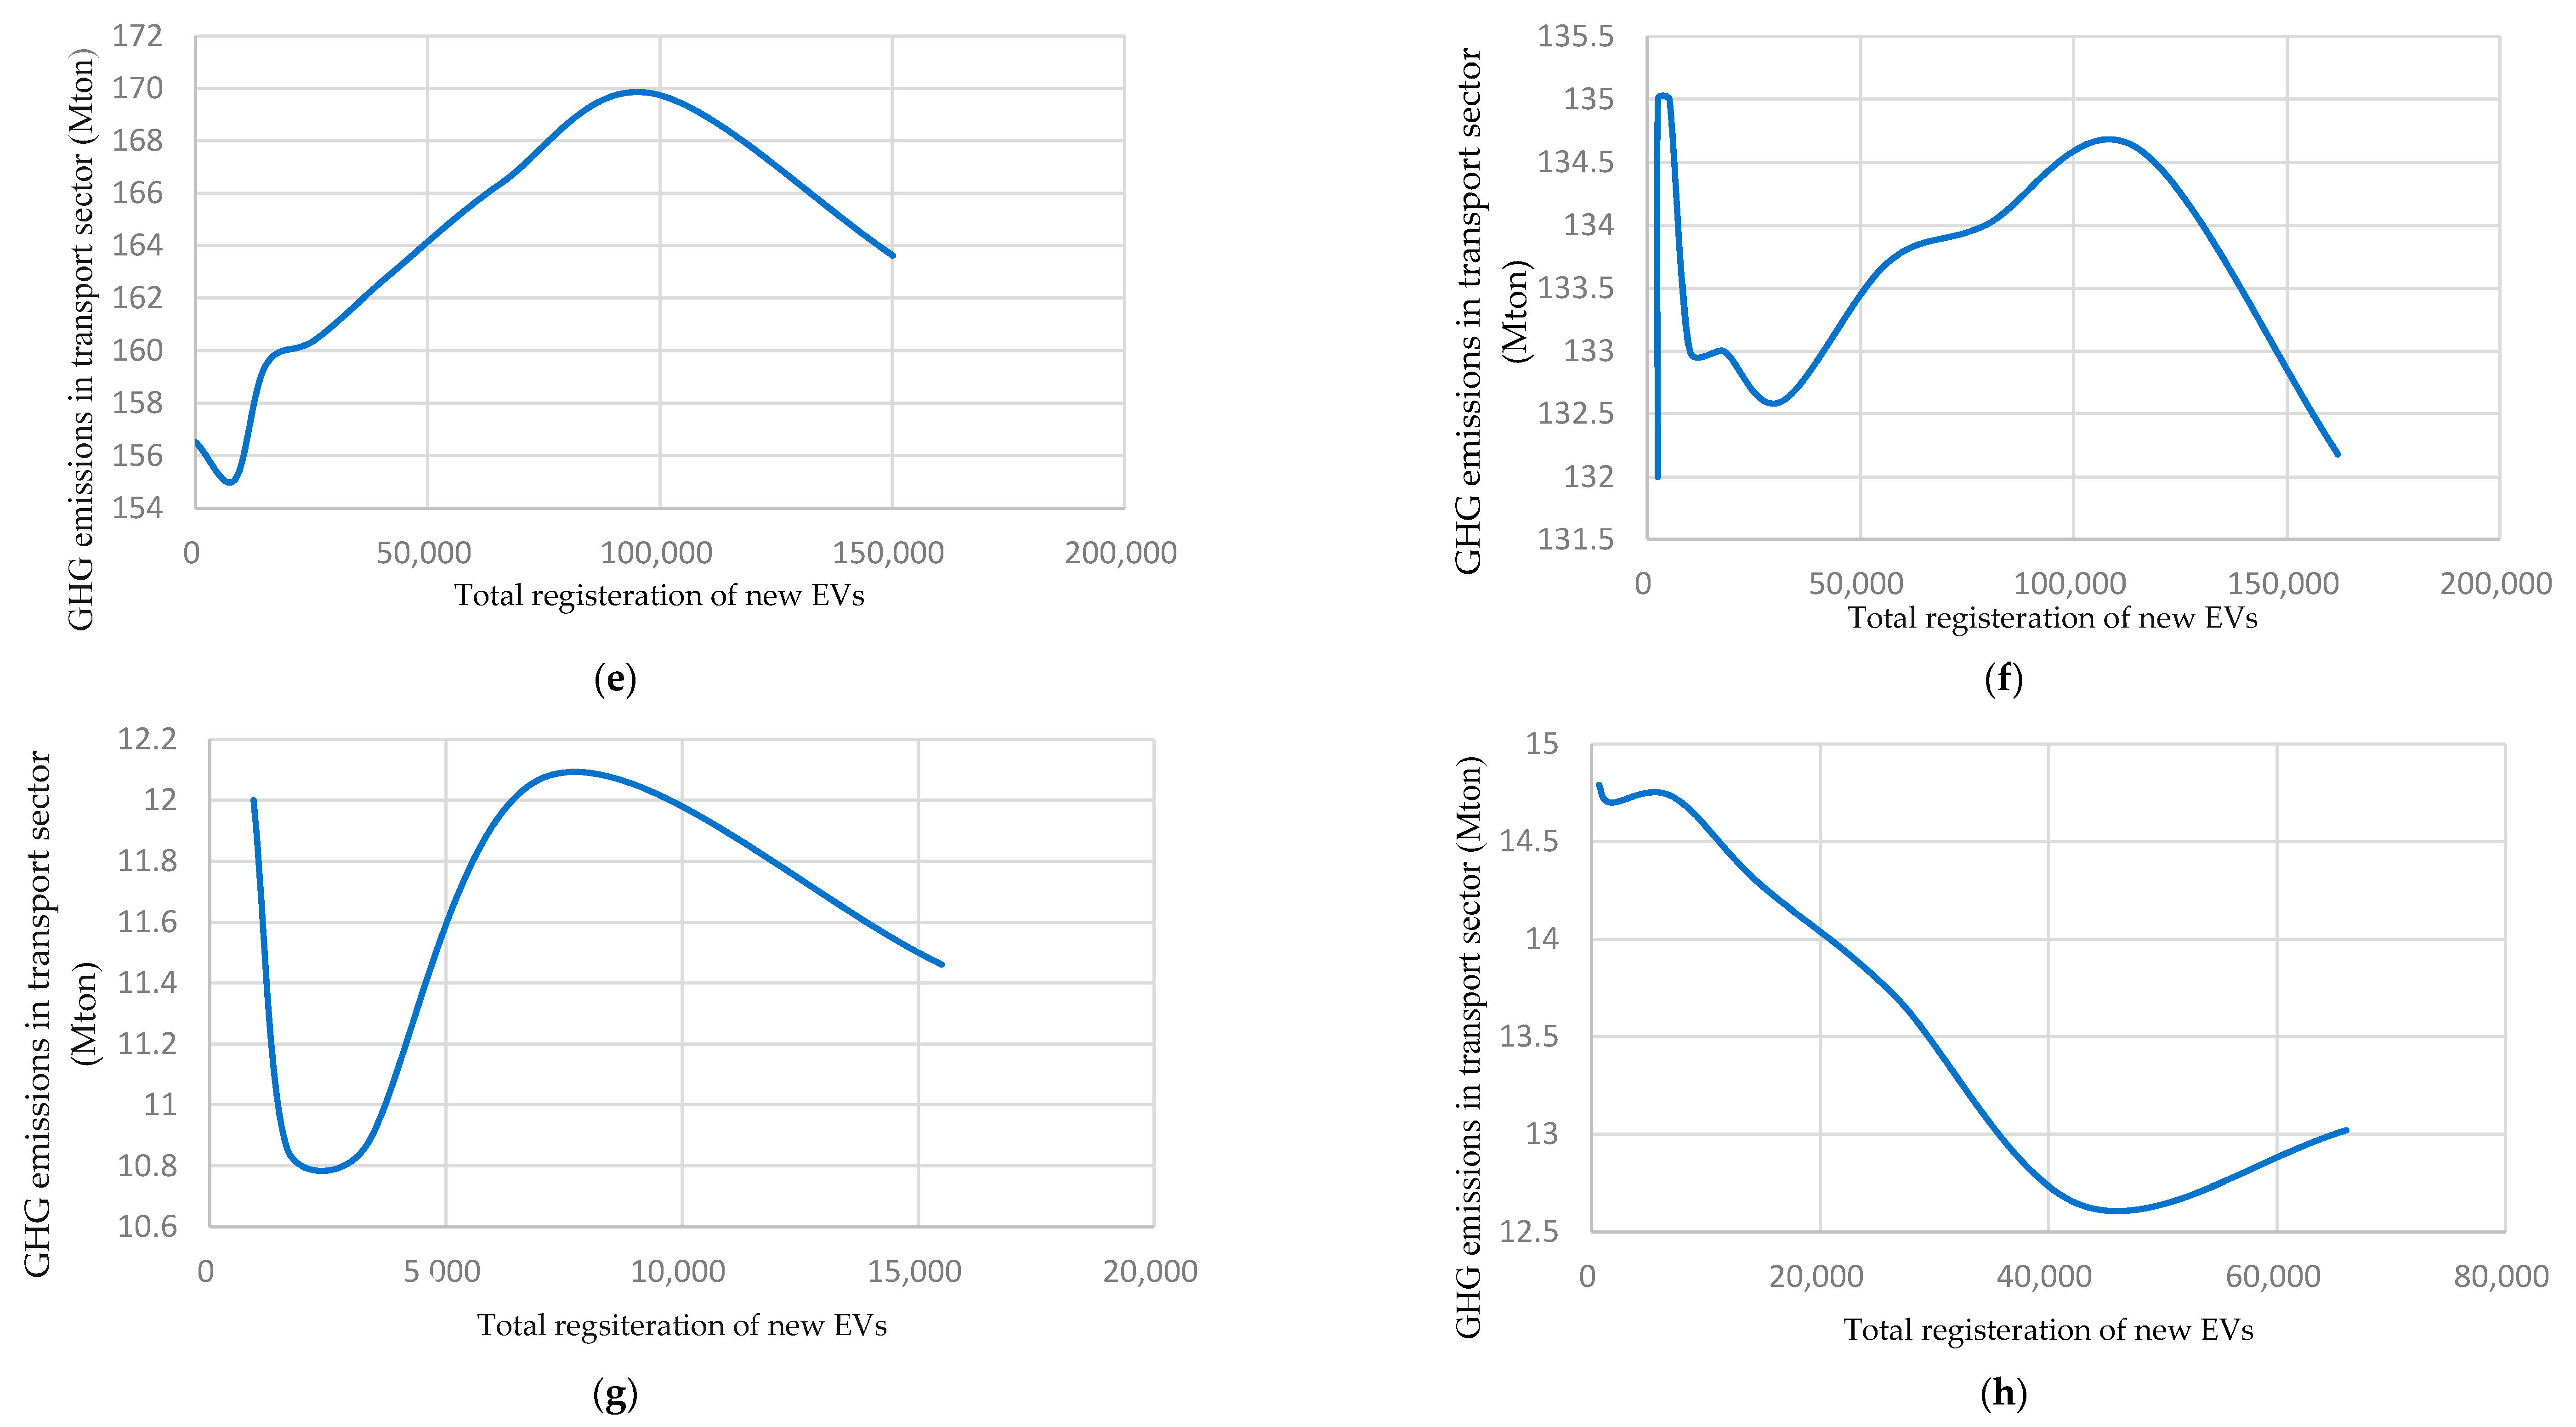
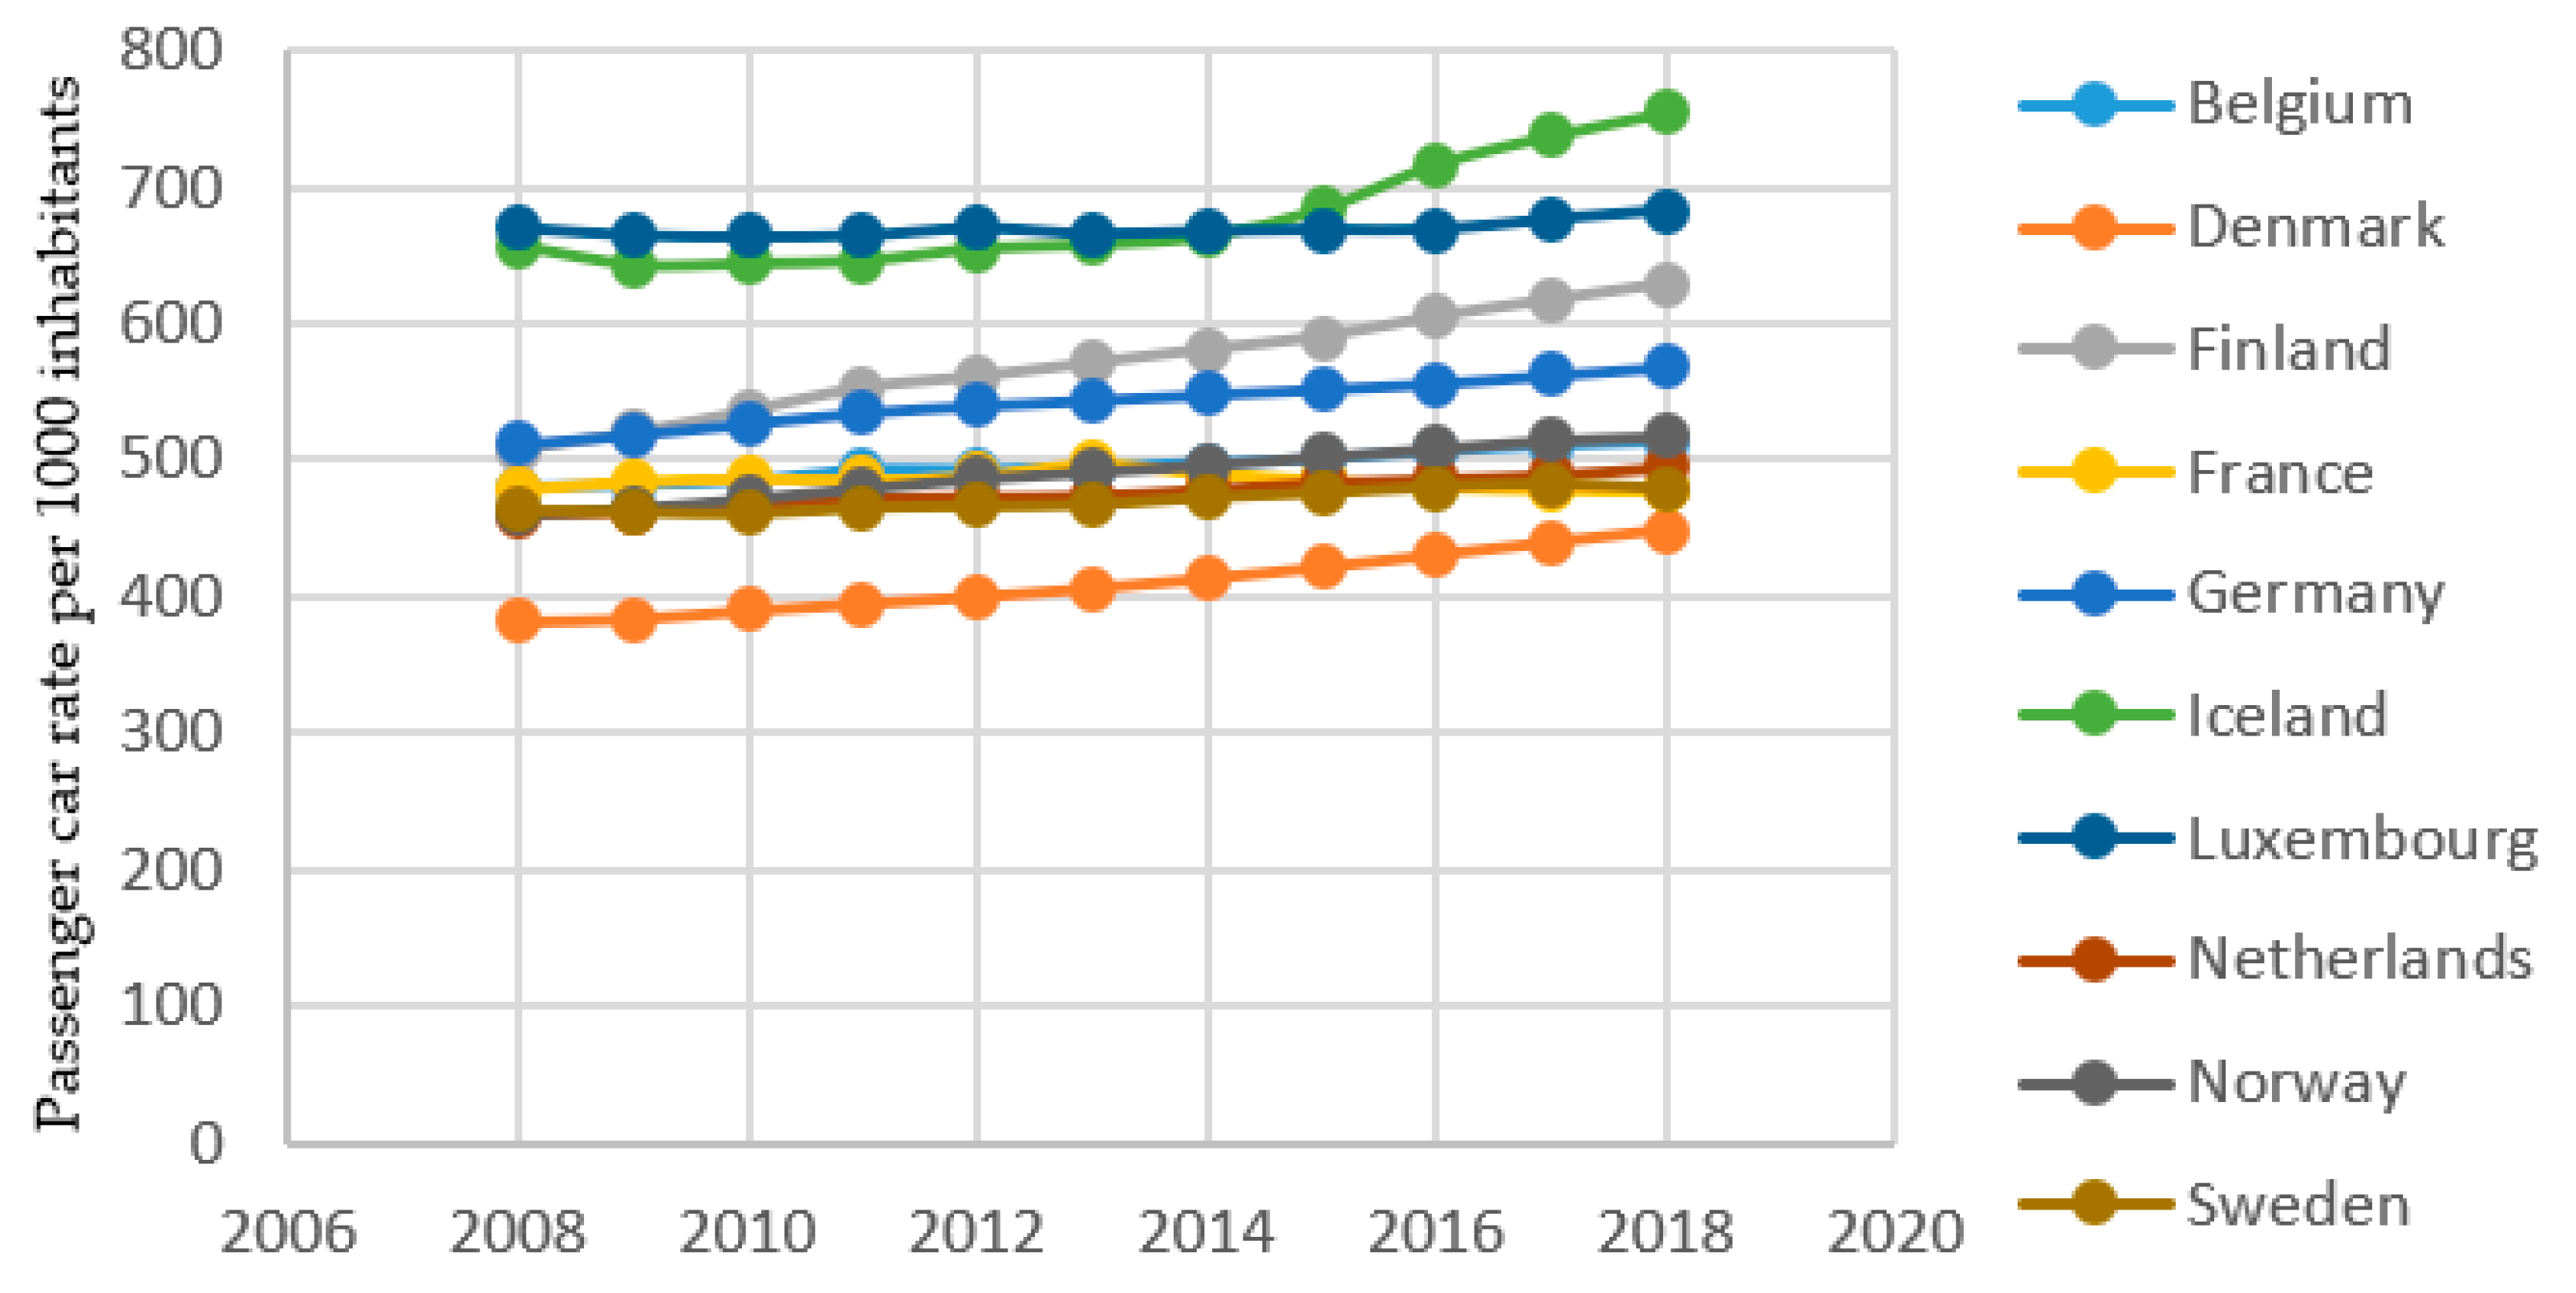
3.1. The Relation of Local Generation of Low Carbon Electricity and Total Number of Registered Electric Vehicles

In this part, we intend to show the relationship between the capacity of generating electricity using low-carbon energy sources and the total number of registered electric vehicles in the countries listed in Table 1.
There is an overview of the studied countries with a focus on the share of low-carbon sources of energy, including renewables, in generating electricity in Table 1. The table shows the current condition as well as the future targets for the studied countries.
The relationship between the total number of registered new electric vehicles and the share of electricity generated by low carbon energy sources and renewable energy in each region is shown in Figure 2 and Figure 3. It is important to mention that there are two recognizable relationships between these two parameters in the studied countries. However, for finding the strength of the relationship between these two sets of data, the concept of the correlating coefficient is used. The formula used to calculate the coefficient is known as Pearson’s Formula (1), which is used as a basic formula in Excel software, as well [28].
C o r r e l ( X , Y ) = i = 1 n x i y i n x ¯ y ¯ ( i = 1 n x i 2 n x ¯ 2 ) ( i = 1 n y i 2 n y ¯ 2 )
where X, Y are two sets of independent variables and x ¯ , y ¯ are the average for array X and Y, respectively.
The calculated correlation coefficients, shown in Table 2, are to represent how the strength of the coefficients could divide countries into two groups.
In six countries, i.e., Norway, Iceland, Sweden, Finland, France, and Belgium, the development of EVs was independent of generating low carbon electricity. The first remark in Figure 2 is about the share of low-carbon electricity in these countries. Based on Figure 2, the contribution of low-carbon electricity in Sweden, Norway, and Finland was more than 90%. The share of this parameter in Iceland and France was more than 80%. In this group, Belgium had the lowest share of low-carbon electricity, around 62%. It could be concluded that the existing capacity in these countries has encouraged the government to design incentives for switching the fuel in their transport sectors. It should be noted, based on Table 1, that all these countries have planned to reach 100% low-carbon electricity in their energy system by 2050. Therefore, the main issue in this group is to develop electrification in the transport sector. It is worth noting that there is a negative value for the coefficient related to Iceland in Table 2. The negative value means with an increase in the capacity of low-carbon electricity generation, the number of registered electric vehicles will decrease. This happened due to the occurrence of a higher growth of registered electric vehicles in the lower capacity of generating low-carbon electricity. However, the graph in Figure 2e could confirm that the decision of the authors regarding the group of countries Iceland was placed within was correct.
In the remaining countries besides Luxembourg, i.e., Germany, Denmark, and the Netherlands, the increase in the number of EVs depends on the enhancement of the capacity of low-carbon electricity generation (Figure 3a–d). The calculated correlating factors shown in Table 2 confirm the strong relationship between the number of EVs and the low-carbon generation of electricity. In comparison with the previous group, these countries had a lower capacity for the generation of low-carbon electricity internally. The Netherlands had the lowest share with around 20% and the contribution of low-carbon sources in the generation of electricity in Germany and Denmark was higher, respectively.
However, Luxembourg is structurally different (Figure 3e). It is already a net importer of electricity. By 2019, 87% of consumed electricity was imported [23,29]. Moreover, Luxembourg has a limited potential for generating renewable electricity locally [23]. In other words, local electricity generation by low-carbon sources will not exceed a limited level in the future. It is concluded that importing electricity is a permanent need to meet the needs of residents in Luxembourg. Regarding the correlating factors shown in Table 2, the expected pattern in Luxembourg needs to be similar to the countries in the second group. However, comparing the initiatives to spread electric cars in Luxembourg with leading countries will lead to confusing results. As, in all members of the second group, the targeted share of low-carbon electricity is 100% in the future, based on Table 1, while the local potential to generate low-carbon electricity is limited in Luxembourg. Thus, in the first step, it is concluded that there is a need to characterize new initiatives to describe the promotion of electric vehicles, which are independent of the local generation of electricity. Furthermore, regarding different contextual factors in various regions, the necessity of non-unique versions of changes in the ongoing energy transition is highlighted.

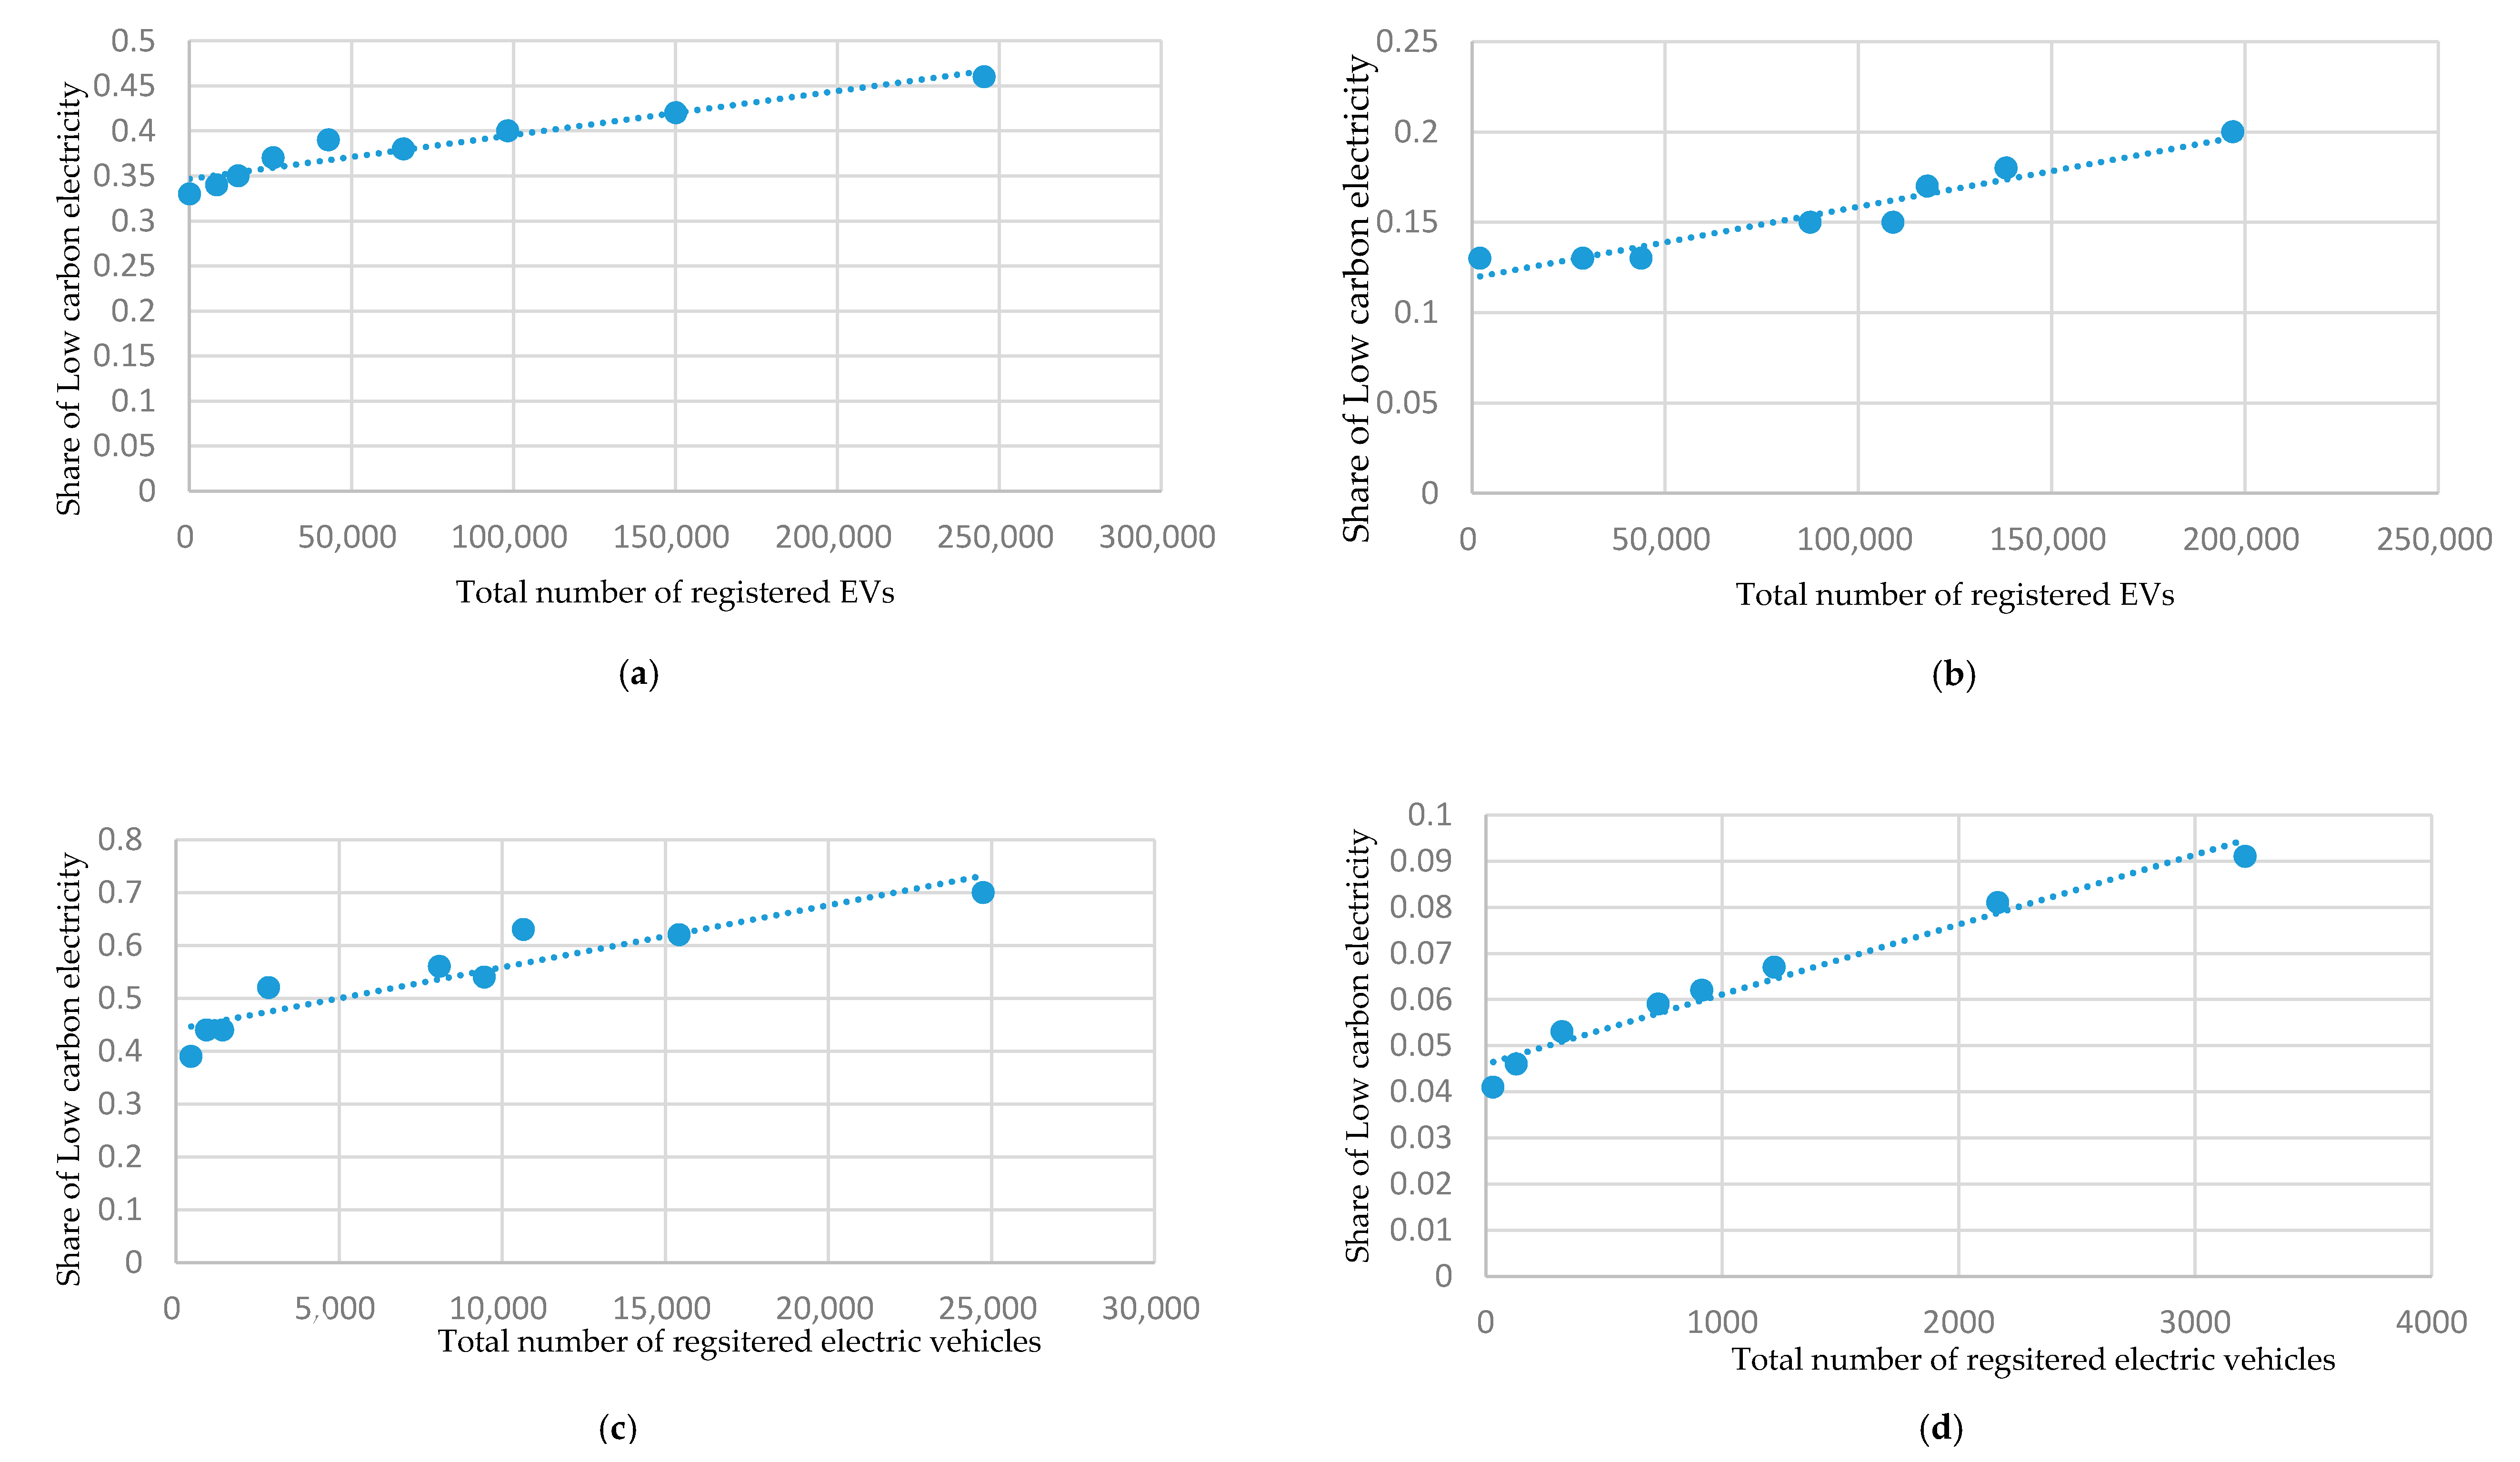
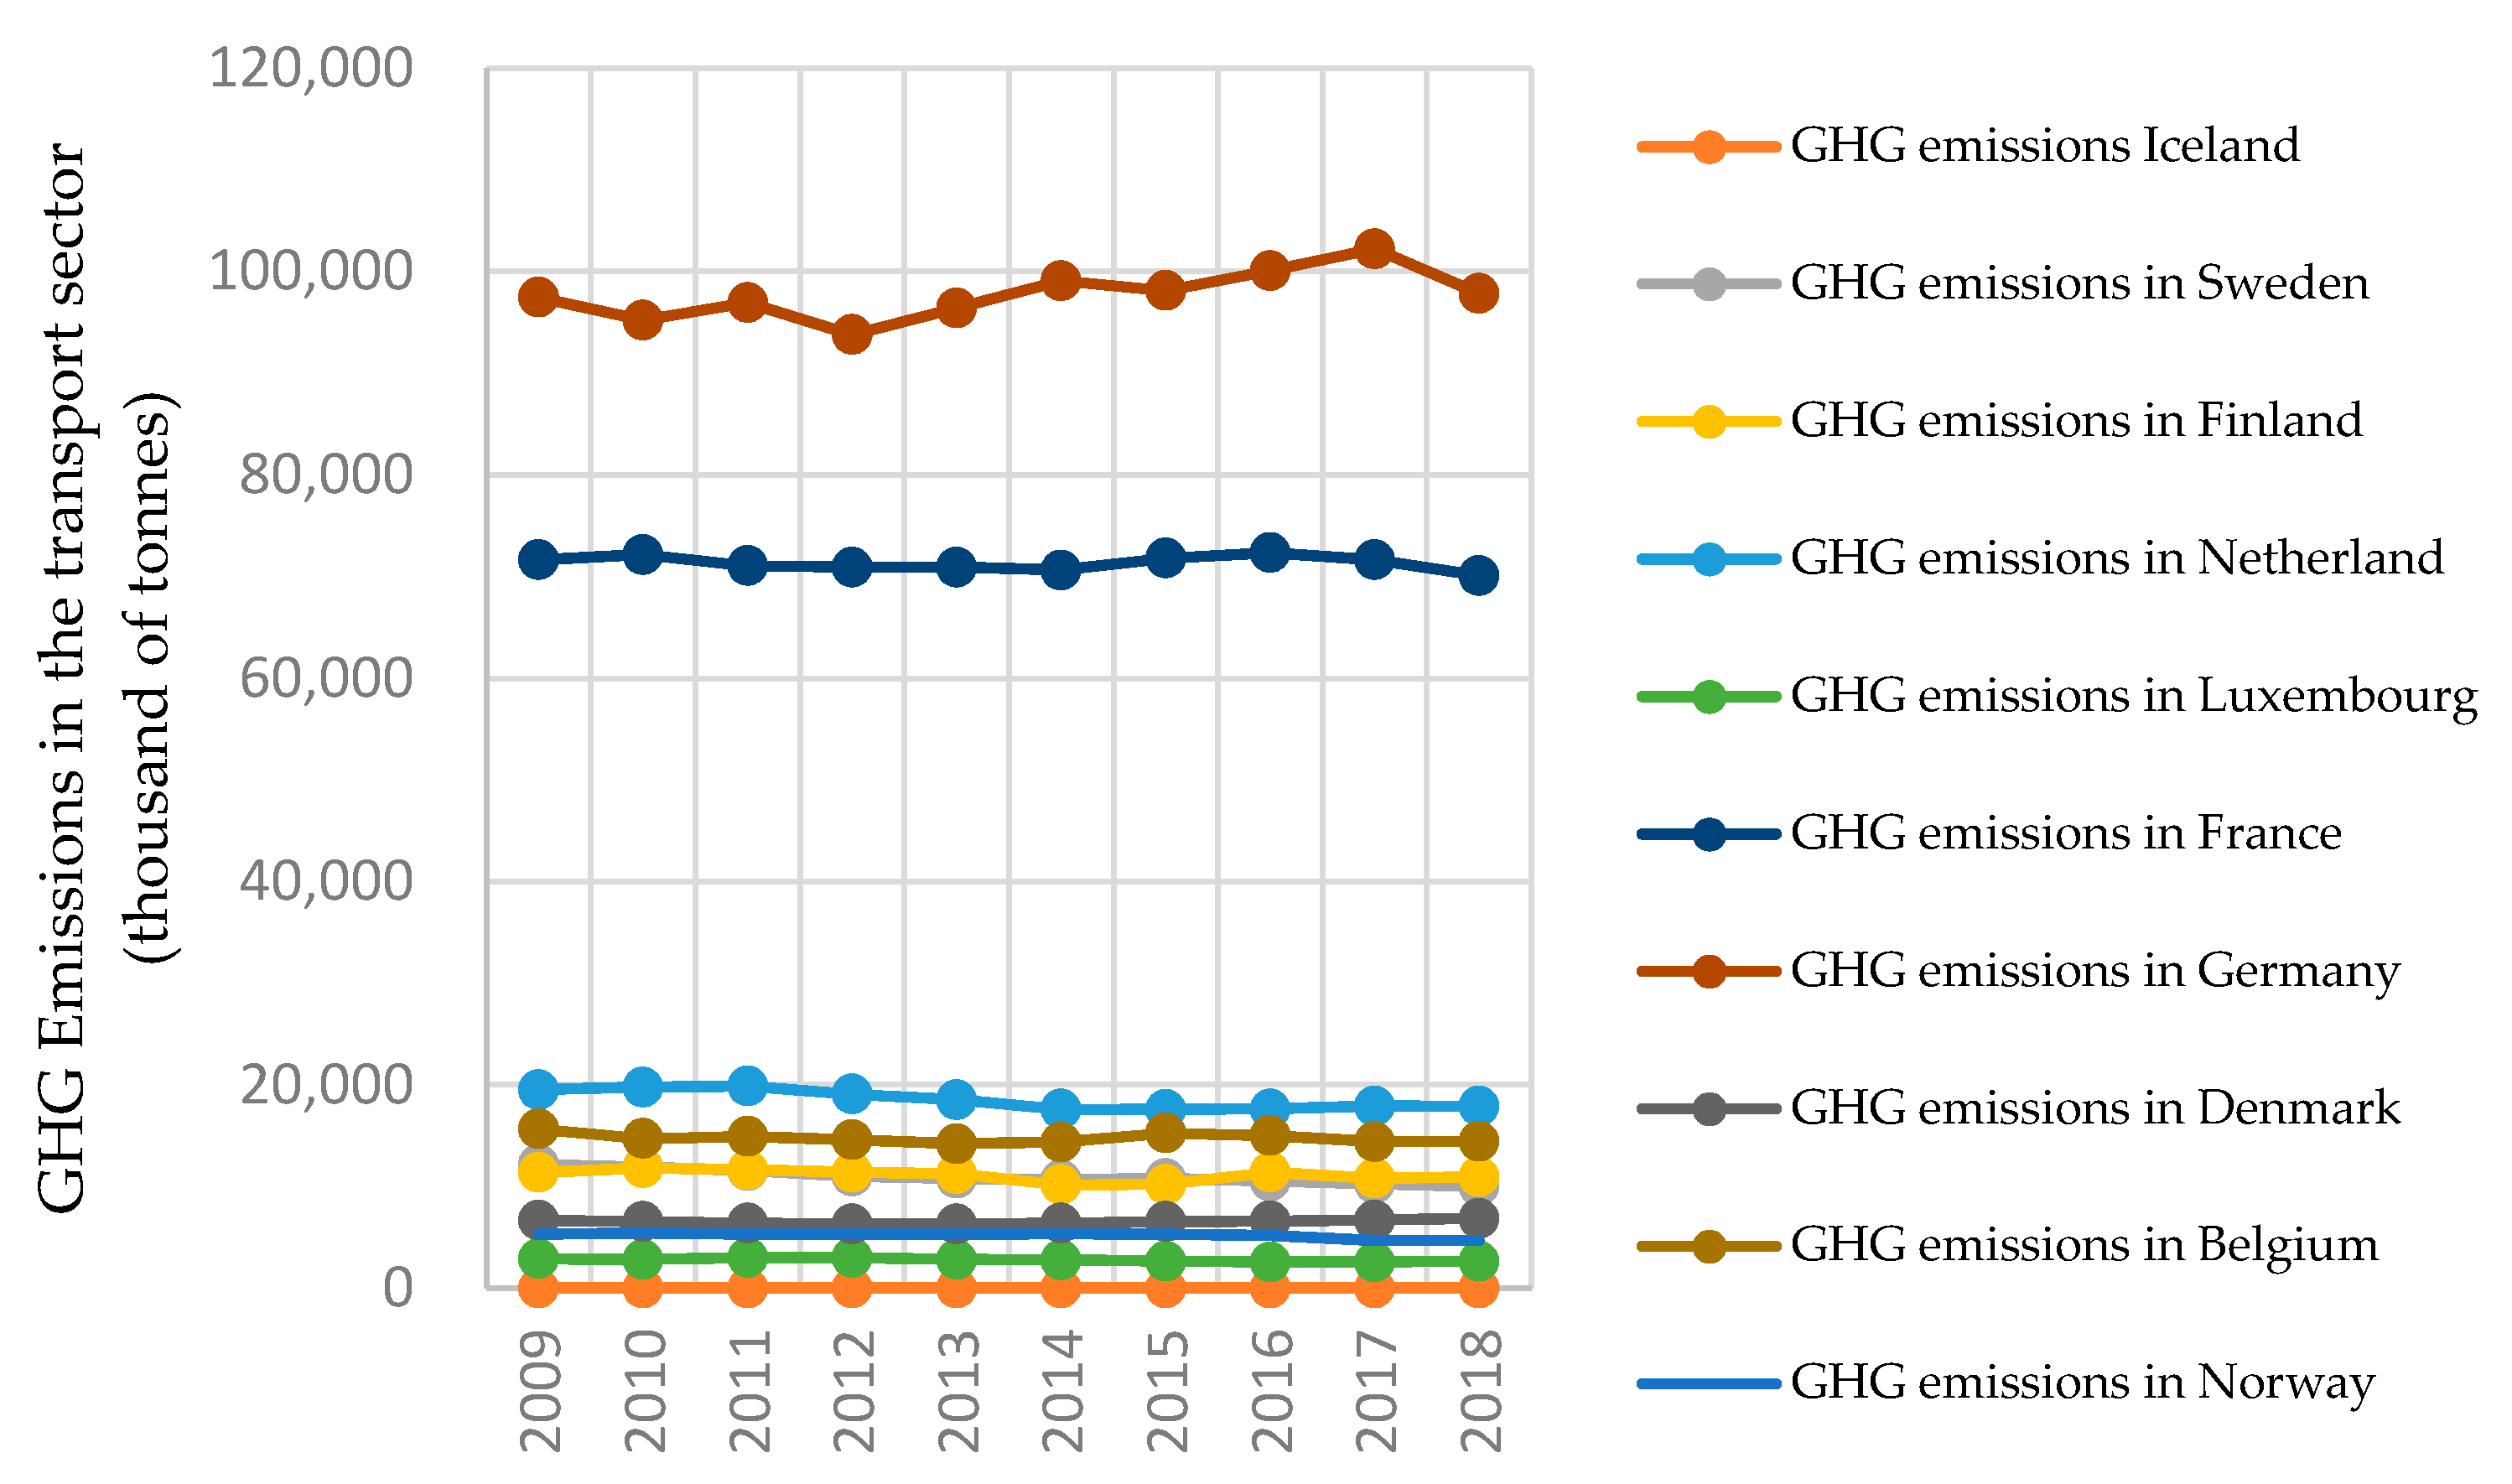
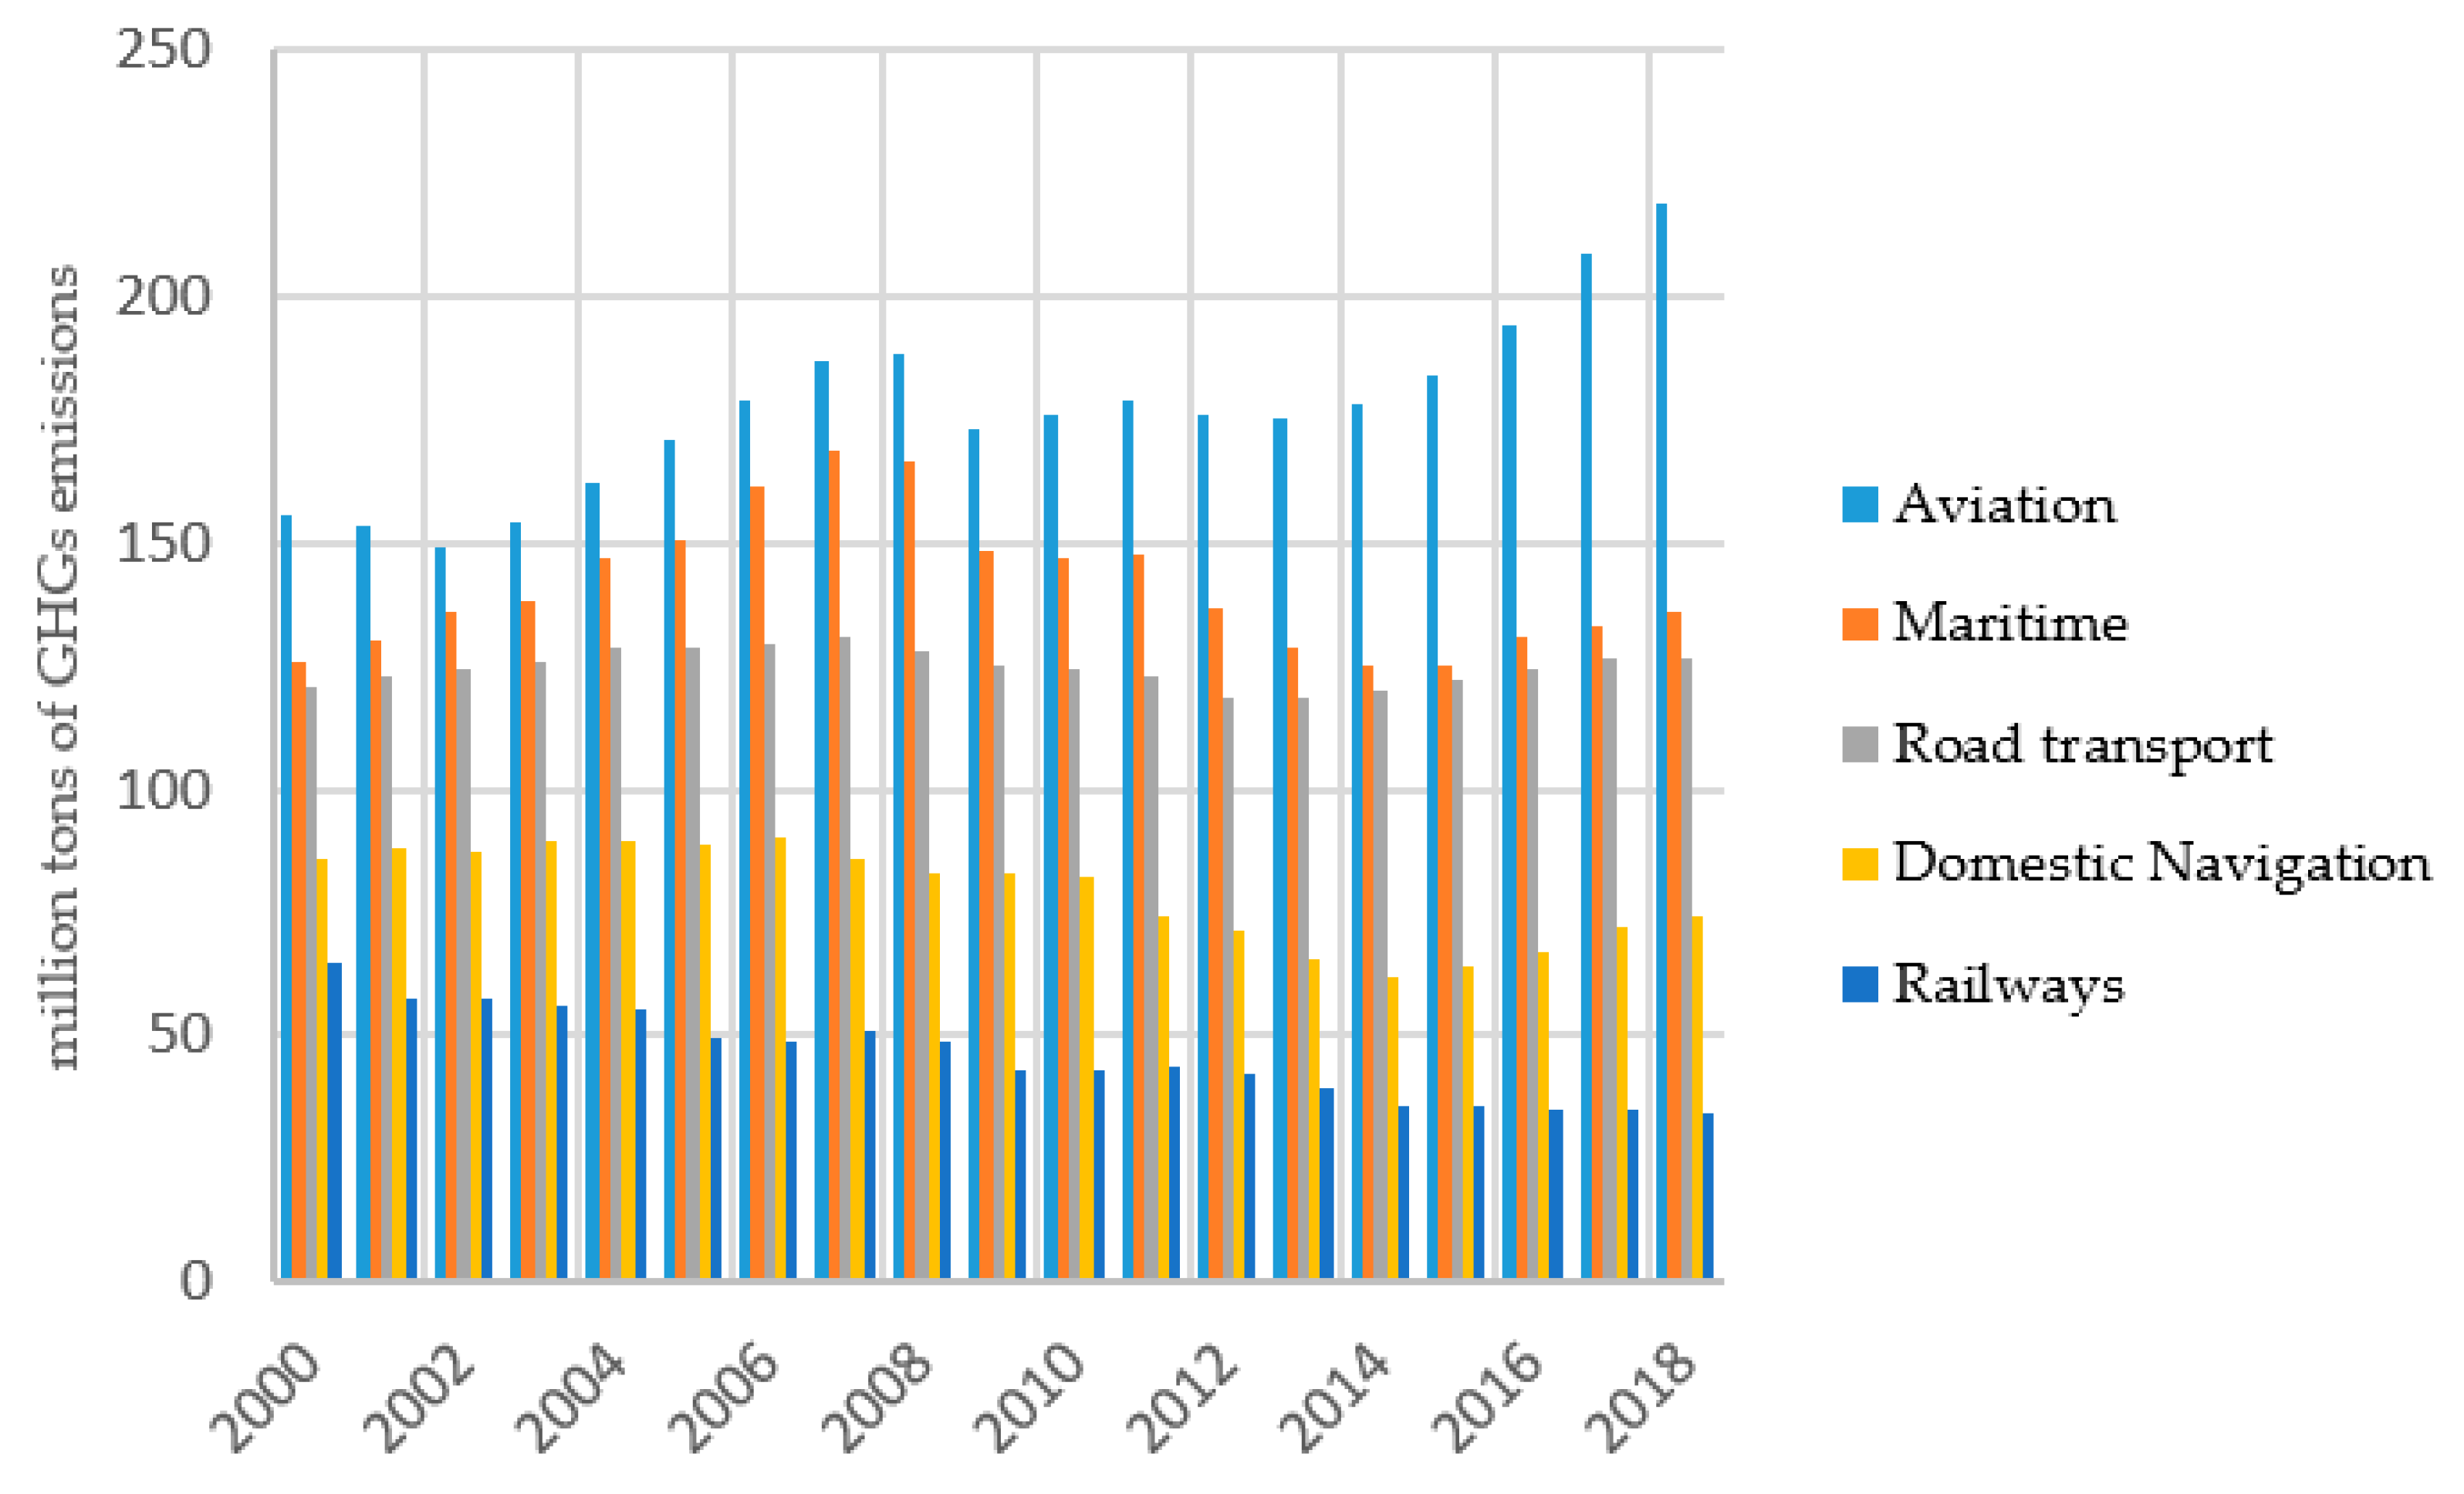
3.2. Exploring Considered Countries in Terms of GHG Emissions

In this section, the emission of GHGs in the considered countries is explored. The goal is to assess the strength of this parameter to drive the development of electric vehicles. Simply, do the countries with the highest GHG emissions in absolute quantity have the highest penetration of EVs?
The depicted parameter in Figure 4 is the absolute quantity of GHG emissions in the transport sector. This sector in Germany, France, the Netherlands, and Belgium was the biggest emitter of GHGs, respectively. However, this order is not the same as the countries’ order with the highest share of EVs in their markets [23].
In Figure 5, the ratio of ‘share of emission of CO2 in the transport sector to total emitted CO2’ is shown in each country. The transport sector of Sweden, France, Luxembourg, Denmark, and Belgium, respectively, are responsible for the highest ratio. However, none of the countries in this order as the emitters of polluting gasses had the same position in the list of the countries with the highest share of EVs. It is concluded that GHG emissions have not been a strong enough parameter to drive the growth of EVs. In other words, GHG emissions are not a decisive factor to cause changes in the available shares of different vehicles based on their fuel types, despite the local generation of low-carbon electricity discussed in Section 3.1, which has had a sensible impact on the growth of the number of EVs.
In Figure 6, the relationship of GHG emissions and spreading electric vehicles in each of the considered countries is shown to support the claim for identifying GHG emissions as a non-determinant factor.
The main finding in Figure 6 is the lack of a recognizable relationship between the growth of electric vehicles and the growth of GHGs emissions in the transport sector in the studied countries. The correlating coefficients between GHG emissions and the number of electric vehicles in each region are shown in Table 3. The correlating coefficients, in Table 3, confirm that there is no recognizable pattern between GHGs emissions and the number of electric vehicles in the considered countries.
The reason for the complex reaction of GHG emissions to the penetration of EVs might refer to the different shares of passenger cars in each transport sector. In Figure 7, the change in the number of passenger cars per 1000 inhabitants in the studied countries is shown. Comparing the growth rate of passenger vehicles in Figure 7 and the relevant graphs in Figure 6 reveals the impact of road transport on GHG emissions in each region. If the growth rate of GHG emissions follows the changes of passenger vehicles per 1000 inhabitants, it could be interpreted as the main role of road transport in GHG emissions. However, in none of the studied countries could road transport be distinguished as the main role.
For a better understanding of the issue, the share of different modes of transport in GHG emissions in Europe is shown in Figure 8. Based on Figure 8, aviation and maritime had a higher share of GHG emissions than road transport. Alternatively, to affect greenhouse gas emissions in the transport sector, addressing road transport by introducing EVs without paying attention to other modes of transportation will not be beneficial.
In Section 3.2, it was revealed that the high emission of GHGs in the transport sector in the studied countries did not drive the growth of EVs in the studied countries. It could be concluded that the considerable share of GHG emissions in the transport sector of Luxembourg could not affect the growth of EVs, too.

4. Exploring Leapfrogging Processes in the Term of Purposes

It has already been deduced that the initiatives of diffusing electric vehicles in Luxembourg could not be the same as similar cases in some European countries. The dissimilarity was attributed to different contextual factors. The considered pathway to characterize the initiatives of diffusing EVs in Luxembourg is to assume the growth of EVs as a technology-based leapfrogging case. The purpose is to explore historical initiatives used to describe diffusing technologies and to find a template to characterize the spreading EVs in the format of a leapfrogging strategy.

4.1. Comparing Spreading EVs in Luxembourg with Historical Leapfrogging Cases in the World

Spreading mobile phones was an early adoption of new technologies [32]. However, the main reason for the successful diffusion of mobile phones was avoiding the construction of costly wire-based infrastructure. Moreover, emerging mobile phones did not threaten the existing stakeholders that support the rapid growth of the diffusion process of mobile phones [33].
The Korean stakeholder fostered a technology with strong governmental support to renovate the structure of the steel industry. It was enabled by investing in technological capabilities [34,35].
Leapfrogging in the automobile sector in Korea and China had the same format as the Luxembourg case but was very different in the drivers. The change was in the automobile industry to drive the manufacturing process. It happened on a large scale by the investment of strong private actors and smaller involvement of local governments apart from domestic market protection. It was coupled with strict environmental regulation to improve the quality of transferred technologies [36].
The Brazilian case in the development of the ethanol program as fuel in the transportation sector was similar to the Korean and Chinese cases. The main driver of this change was the oil crisis in the 1970s, which induced the demand for the change. Therefore, the government policies focused on creating the domestic market as a long-term opportunity for ethanol production [37].
The emerging wind industries in India could be considered as an environmental leapfrogging case. It had direct impacts on the decarbonization of the power generation sector. It caused India to turn into a host for the big manufacturer companies in this field from a net importer position [38]. The major driver was to respond to a drastic increase in energy demand from 1990–2010 by the deployment of clean energy technology locally [39]. There was a definite set of policies supporting the lasting growth of this industry in India [40].
The growth of high voltage grids and improved cook stoves in the east of Africa and the transfer of solar technology to rural areas in South Africa are examples of leapfrogging cases, which faced challenges to be realized. In all cases, the offered solutions were perfect in the theoretical phase. However, a lack of budget and poor knowledge of society to support the projects hindered their successes [41,42,43,44]. The main recognizable driver in these cases was an inherent need to change the relevant infrastructures.

4.2. Lessons Learned from the Case Studies

Exploring the case studies in Section 4.1 provided us with knowledge of the main drivers to leapfrogging projects as discussed in the literature [45].
-
As a pathway to expedite the development process in a region or country.
-
As a strategy to transfer an advanced technology for manufacturing locally.
-
As a tactic to facilitate the adoption and use of a new technology.
In the first case, the purpose is to remove polluting technology quicker and keep growing with lower environmental effects, such as the emerging wind industry in India and the transfer of renewable technology to Africa [46].
In the second type, the objective is to catch up with developed economies and their level of industrial development [47]. In this case, latecomers avoid adopting technology at an early phase of diffusion. Korean and Chinese automotive industries were two examples of this type. Indeed, the concept is to prevent industrializing countries following the resource-intensive path created by industrialized countries. Therefore, leapfrogging to the most advanced available technology is employed.
In the third type, responding to the direct or indirect demand of the user, which may be driven by the infrastructures, is focused [48]. Adopting mobile phones is an example of this type.
In summary, the historical exploration of the case studies shows that meeting the needs was accompanied by economic benefits for the host countries. Moreover, to successfully maintain the transfer, access to external knowledge in the format of technological capabilities and internal parameters is required. One explanation for the failure of technology transfer, even those who had successful experience elsewhere, is the lack of a needed capacity in the hosting countries. It is reflected in the concept of absorptive capacity in the literature [49]. It could be interpreted as the ability to learn and apply the technologies and associated practices of already developed countries.

5. Theory of Spreading Electric Vehicles in Luxembourg

The main goal in this section is to address the necessity or the proper time to support electric vehicles by the Luxembourgish government. However, before explaining the theory, it is necessary to examine whether supporting the spread of electric vehicles just for environmental purposes is valid.

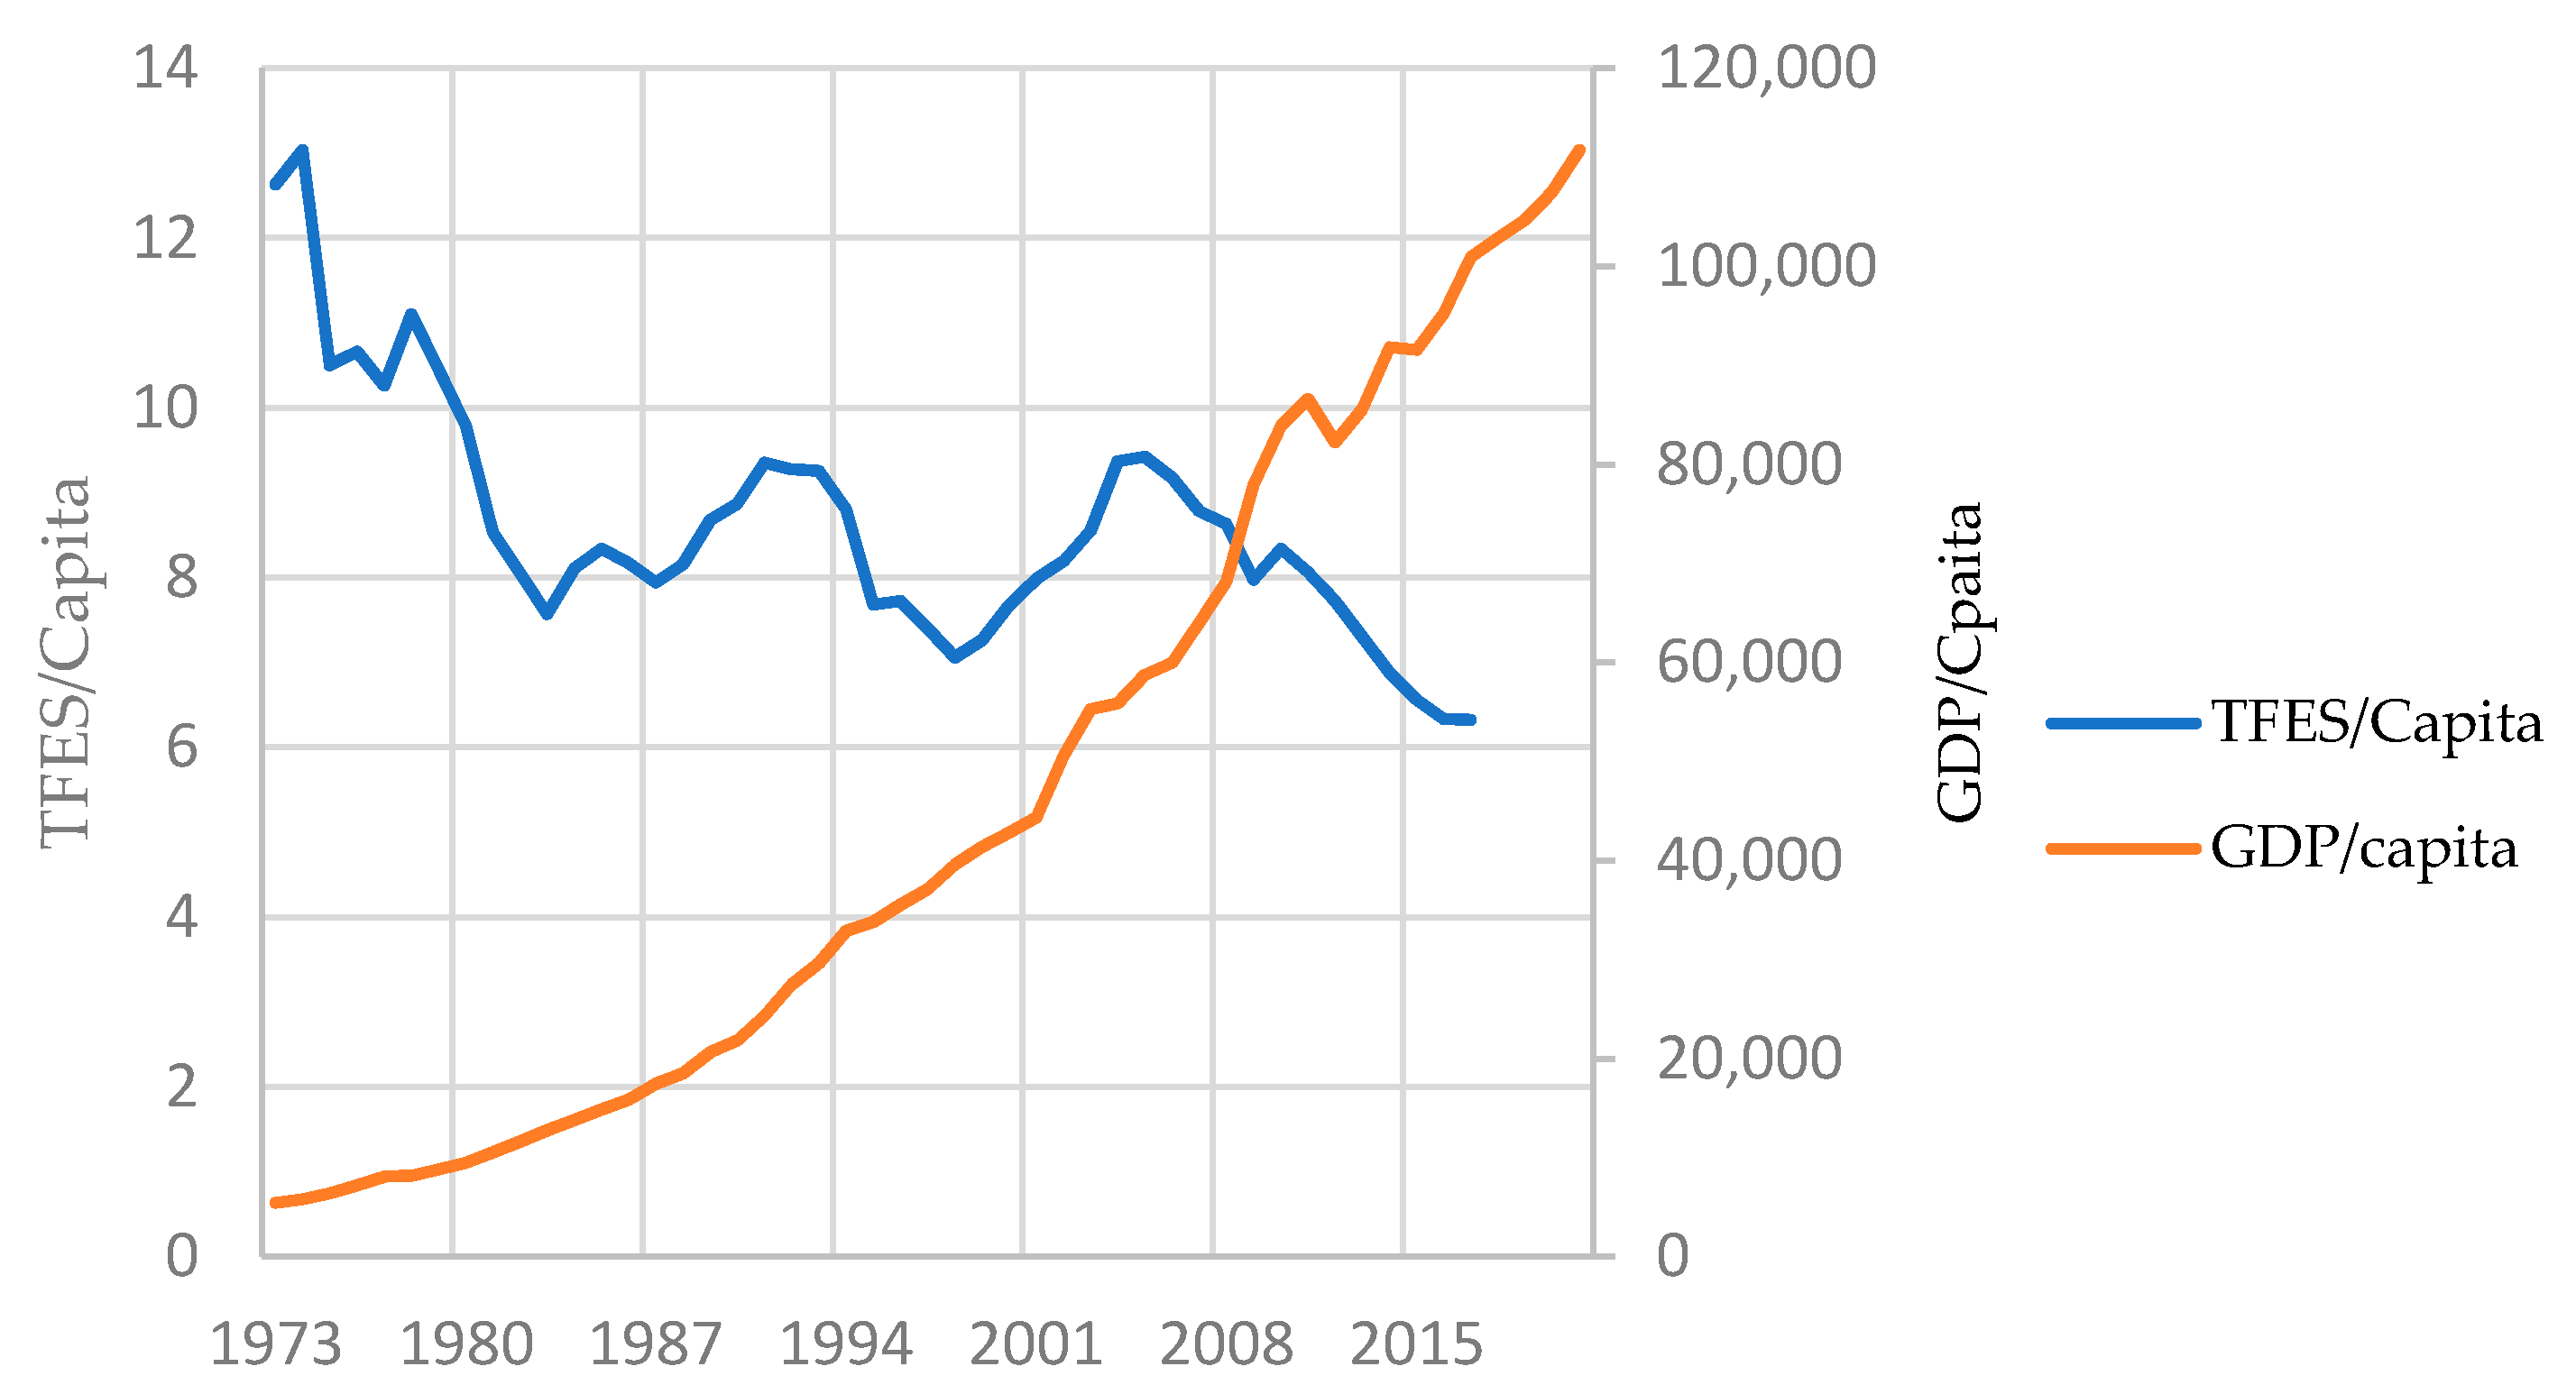
5.1. Examining Spreading Electric Vehicles in Luxembourg for Environmental Purposes

It was revealed in Section 3.2 that GHG emissions have not been a driver to promote the spreading of electric vehicles in the studied countries. In this section, challenges of designing policies to spread a technology just for environmental issues are investigated. In this part, it is assumed that environmental concerns are the main driver to develop EVs.
The case would be different when the purpose of technology transfer is to deal with externalities such as pollution [3], because the transfer does not inherently cause an increase in the profit or efficiency, vividly. For further clarification, the issue is discussed by searching for the disadvantages of technology-led policies.
First of all, there are many factors related to the considered technology that interact strongly, such as consumer behavior, the structure of the automotive market and fuel price, etc. The interactions will determine the cost-effectiveness of policy interventions. In many cases, the result would be very controversial, especially when it is not successful. Consequently, finding justifying reasons for the failure is difficult [50].
Secondly, generalizing the application of the policy instruments to any case is another concern. Simply, expecting to address a wide range of issues using policy instruments from single changes in public transport to change protective tariffs on fuel might happen as a result [51,52].
Finally, supervising the execution of the strategy by controlling the feedback of the policy is another issue. Feedback, especially in the case of environmental concerns, has weak mechanisms, as emission standards are seldom enforced in developing countries, particularly when it is a push-market case [3].

5.2. Characterizing the Spreading Theory of EVs in Luxembourg Regarding the Purpose

It has already been discussed that supporting the development of electric vehicles because of environmental issues has not been performed, historically. Moreover, it faces significant challenges to be implemented by policy means. Therefore, there is a need to explore the purpose of developing electric vehicles in Luxembourg.
By reducing gasoline consumption, or oil products in general, more money will remain in the country and could be used to boost the local economy. As the U.S. Energy Information Administration confirmed, over 80 percent of the cost of an imported gallon of gas immediately leaves the local economy [53]. Switching from imported oil products to local electricity generated using low carbon energy sources will lead to an improving energy security and economic growth. However, it could not be a driver for the Luxembourg case because Luxembourg is a net importer of electricity and has limited potential for generating low carbon electricity locally. Therefore, it is not expected that Luxembourg will become a country reliant on the local production of electricity in the future. Therefore, switching to local potentials of energy resources could not be a driver for the development of EVs in Luxembourg.
Moreover, becoming involved in the production chain of electric vehicles is not conceivable in Luxembourg, as well. Economic growth and energy consumption as two key parameters are not dependent on each other in Luxembourg. Indeed, the relation between total final energy consumption (TFEC) and gross domestic product (GDP) per capita in Luxembourg has had a downward trend after 2004. Figure 9 shows the decoupled relation between TFEC and GDP in Luxembourg. It is concluded, following the existing trend, that involvement in manufacturing processes is not conceivable in Luxembourg. Thus, promoting electric vehicles for involvement in the manufacturing process is not a driver for Luxembourg.
It is hypothesized that the goal of diffusing EVs in Luxembourg is the early adoption of new technology. Indeed, this theory addresses the time of supporting the considered technology in the context of Luxembourg, regarding existing potentials. Alternatively, increasing the share of electric vehicles by designing policy instruments in Luxembourg is not recommended until the application of electric vehicles causes added value for the national economy.
The principle of the suggested theory is following Potter’s theory about the factor-based advantage [55]. Potter’s theory categorizes the world into the following two circumstances: situations in which a factor-based advantage exists, and those in which it does not. Based on the literature, Potter’s theory has been applied to conduct the strategic planning of countries such as Singapore [56].

5.3. Challenges of the Proposed Theory of Diffusing Electric Vehicles Facing Luxembourg

In this section, the limitations of the spreading of the technology regarding the suggested theory are discussed.
Regarding the built theory, the difference between transferring electric vehicles to Luxembourg compared with transferring EVs to other countries is about the time of transfer. Indeed, a high-priority transfer of EVs in other countries becomes a normal transfer in Luxembourg.
Change in the meaning of transferring electric vehicles from a ‘need’ in the transport sector to a ‘novel’ concept with less priority has its disadvantages that limit the transfer. For example,
-
The performance of a novel technology is uncertain and can only be assessed after months or typically after years [57].
-
The cost of novel technology falls considerably with greater volume [58].
-
The facilitation of adopting the path of one novel technology may distort the development path of another one [59].
As highlighted, the technological diffusion of a novel technology might be hindered or limited by uncertainty issues [57]. This uncertainty might stem from two sources. The first one would be the future efficiency or the future quality of questioned technology [60]. The other source is the unclear condition of evaluating saving resources because the future price of fuel and technology are completely unknown to the purchaser [61].
Furthermore, uncertainty does not just exist at an individual level. The government is challenged by issuing a policy in favor of a specific technology when there are no data about its future condition. They are deeply afraid of getting into a technological lock-in by supporting a monopoly [62]. Indeed, the ideal condition for leapfrogging technology is being led by the market, where technological advances are driven by market demand [63].

6. Scenarios

This section discusses the question raised in Section 1 regarding what scenarios will be invested in if the government does not need to intervene in diffusing EVs in Luxembourg in the short or mid-term. The scenarios represent a wide range of activities in the short- to long-term. They include immediate responses to replace supporting electric vehicle technologies and long-term strategies to affect the future behavior toward public transportation. Moreover, it is attempted to draw attention to two points. The first one is the lack of absorptive capacity to spread EVs and the second is the inconsistency of the current institutions with an electrification strategy.

6.1. Scenario One; toward Electric Buses

Buses are probably the key applications of electricity as the drivers of the engine and power system in the transport sector [64]. They do not need to have a specific route as a tram does. Usually, they run on fixed routes; therefore, planning for charging is easily feasible. The supporting facilities for maintenance could be much more economically realistic than private vehicles. Moreover, they could be purchased in large quantities. Therefore, the client could influence the technological options to improve the quality of services.

6.2. Scenario Two; from Technology Push to the Market Pull

Increasing the chance of success in the diffusion of new technology could be improved by decreasing the cost of supporting facilities or devices [19]. Deciding to increase electrification in the transport sector needs to be accumulated with some activities to improve access-charging facilities in the country. In addition, the needed regulations need to be created or imported. Improving network externalities is the main idea in this scenario. It is a matter of creating or improving the relationship between technologies, infrastructures, interdependent industries, and users. The significance of this point could be understood by reviewing the literature, where it is emphasized that physical and informational networks have a high degree of importance with growing sizes [49,65].

6.3. Scenario Three; Polluter Pays Principle

Generally, fuel consumption for moving is a growing contributor to air pollution and environmental health risk. One method is applying the ‘polluter pays’ concept to adjust fuel taxes to reflect environmental externalities [66]. The benefits of this principle for the government are numerous such as improving the efficiency of resource use, achieving a proper source to finance the maintenance of road congestion impact, redistributing income. However, the share of tax in fuel in Luxembourg compared to other European countries is lower [67]. Figure 10 represents the fuel tax in Luxembourg compared with other countries in the European Union. The growth of fuel taxation is aligned with facing transportation externalities.

6.4. Scenario Four; Affecting the Future Behavior, from the Transfer of the End-of-Pipe Technologies to Change the Institutions in the Transport Sector

Affecting the future behavior toward applying collective technologies is another scenario. It is needed to recognize the cultural habit of society to understand that the society is geared toward a single-family unit or has a strong allegiance to its local community [68]. It would be beneficial to have some insights about accepting the rate of public proposals for any modal shift in transport demand.

7. Discussion of the Results

This paper presented a different viewpoint on the purpose of spreading electric vehicles in Luxembourg. The study showed how an appraised technology in some countries is challenged to be developed in other regions. It is not a matter of the availability of barriers, as discussed in the literature in different aspects. It is about the driving factors, which encourage the policymakers to design incentives to spread the technology. Arguing the drivers and their strength to spread EVs highlights the role of contextual factors in different regions. This study provided an opportunity to show how uncertain aspects of the considered technology and the different contextual factors of the region can cast doubt on the benefits of applying the technology in a certain period.
Electrification in different sectors of the energy system is accelerating. In the transport sector, electric vehicles are applied to switch the consumption between fossil fuels and electricity. However, the issue for countries with a low capacity of generation of electricity to use their internal resources for this purpose is different. It is not a matter of finding another pathway. Electrification is a predictable fate and an ultimate choice in energy systems. It is a matter of time to decide to go toward this choice. Uncertainties of the technology and the stability of the conventional energy system play a great role in the timing of this decision in these countries. The theory in the context of Luxembourg was built but could be generalized to similar cases.

8. Conclusions

This study addressed the spreading of EVs from a policy maker’s viewpoint. We tried to analyze an argument about the supporting reasons to spread EVs in different regions. Therefore, the initiatives of the leading countries were explored. For this purpose, it was assumed that contextual factors have decisive roles.
The capacity of the studied countries to generate low carbon electricity was chosen as the first criterion for the comparison. The countries were divided into two groups based on the high or low dependence of the number of registered EVs on the capacity of generating low-carbon electricity. It was revealed that available or planned capacity to generate low-carbon electricity is effective on the growth of electrification in the transport sector. However, it was shown that Luxembourg is structurally different from the studied countries.
The second selected criterion to compare the countries was GHG emissions. It was intended to explore whether the countries with the highest share of EVs in their market have the highest share of GHG emissions in the transport sector or not. The results revealed that there is no meaningful relationship between the growth of EVs in the studied countries and GHG emissions. It was deduced that GHG emissions have not been a driver in the studied countries to spread EVs.
The historical diffusions of different technologies, especially energy technologies, were explored to know the drivers of the transfers. Moreover, it was shown how designing a policy to address environmental concerns would be challenging. As a result, it was hypothesized that the spreading of EVs in Luxembourg is similar to the transfer of a novel technology. The theory was built to address the proper time to support the spreading of EVs in Luxembourg. Indeed, different contextual factors in Luxembourg compared with the studied countries caused a change in the necessity of spreading EVs and decreased the priority of this transfer.
Finally, alternative scenarios were suggested rather than supporting the spreading of EVs in Luxembourg. The scenarios included different considerations to be applicable in the short- and long-term.

Author Contributions

Conceptualization, A.A.; methodology, A.A.; investigation, R.A.; data curation, A.A.; writing—review and editing, J.H.; supervision, S.L. All authors have read and agreed to the published version of the manuscript.

Funding

This research received no external funding.

Institutional Review Board Statement

Not applicable.

Conflicts of Interest

No conflict of interest.

References

  1. Perkins, R. Environmental leapfrogging in developing countries: A critical assessment and reconstruction. Nat. Resour. Forum 2003, 27, 177–188. [Google Scholar] [CrossRef]
  2. Goldemberg, J. Leapfrog energy technologies. Energy Policy 1998, 26, 729–741. [Google Scholar]
  3. Kojima, M. Leapfrogging Technology: Cost-Effective Solution for Pollution in Developing Countries? World Bank: Washington, DC, USA; Available online: https://openknowledge.worldbank.org/handle/10986/11323 (accessed on 30 March 2021).
  4. Steinmueller, W.E. ICTs and the possibilities for leapfrogging by developing countries. Int. Labour Rev. 2001, 140, 193–210. [Google Scholar] [CrossRef]
  5. Rip, A.; Kemp, R. Technological change. Hum. Choice Clim. Chang. 1998, 2, 327–399. [Google Scholar]
  6. Unruh, G.C. Understanding carbon lock-in. Energy Policy 2000, 28, 817–830. [Google Scholar] [CrossRef]
  7. Murphy, J.T. Making the energy transition in rural east Africa: Is leapfrogging an alternative? Technol. Forecast. Soc. Chang. 2001, 68, 173–193. [Google Scholar] [CrossRef]
  8. International Energy Agency. 2021. Available online: https://www.iea.org/countries (accessed on 30 March 2021).
  9. Vita, V.; Lazarou, S. Investigating the European Energetic Situation Under a Potential Scenario that Marginally Meets Green Deal Requirements. WSEAS Trans. Power Syst. 2020, 15, 143–148. [Google Scholar] [CrossRef]
  10. Lazarou, S.; Christodoulou, C.; Vita, V. Global Change Assessment Model (GCAM) considerations of the primary sources energy mix for an energetic scenario that could meet Paris agreement. In Proceedings of the 2019 54th International Universities Power Engineering Conference (UPEC), Bucharest, Romania, 3–6 September 2019. [Google Scholar]
  11. Siddi, M. The European Green Deal: Assessing Its Current State and Future Implementation; FIIA Working Paper 114; FIIA: Helsinki, Finland, 2019. [Google Scholar]
  12. Steinhilber, S.; Wells, P.; Thankappan, S. Socio-technical inertia: Understanding the barriers to electric vehicles. Energy Policy 2013, 60, 531–539. [Google Scholar] [CrossRef]
  13. Tran, M.; Banister, D.; Bishop, J.; McCulloch, M. Simulating early adoption of alternative fuel vehicles for sustainability. Technol. Forecast. Soc. Chang. 2013, 80, 865–875. [Google Scholar] [CrossRef]
  14. Adhikari, M.; Ghimire, L.P.; Kim, Y.; Aryal, P.; Khadka, S.B. Identification and Analysis of Barriers against Electric Vehicle Use. Sustainability 2020, 12, 4850. [Google Scholar] [CrossRef]
  15. Browne, D.; O’Mahony, M.; Caulfield, B. How should barriers to alternative fuels and vehicles be classified and potential policies to promote innovative technologies be evaluated? J. Clean. Prod. 2012, 35, 140–151. [Google Scholar] [CrossRef]
  16. Yong, T.; Park, C. A qualitative comparative analysis on factors affecting the deployment of electric vehicles. Energy Procedia 2017, 128, 497–503. [Google Scholar] [CrossRef]
  17. Wikström, M.; Hansson, L.; Alvfors, P. Investigating barriers for plug-in electric vehicle deployment in fleets. Transp. Res. Part D Transp. Environ. 2016, 49, 59–67. [Google Scholar] [CrossRef]
  18. Viola, F. Electric Vehicles and Psychology. Sustainability 2021, 13, 719. [Google Scholar] [CrossRef]
  19. Xue, Y.; You, J.; Shao, L. Understanding socio-technical barriers to sustainable mobility–insights from demonstration program of EVs in China. Probl. Ekorozw. Probl. Sustain. Dev. 2014, 9, 29–36. [Google Scholar]
  20. Egbue, O.; Long, S. Barriers to widespread adoption of electric vehicles: An analysis of consumer attitudes and perceptions. Energy Policy 2012, 48, 717–729. [Google Scholar] [CrossRef]
  21. Bonera, M.; Corvi, E.; Codini, A.P.; Ma, R. Does Nationality Matter in Eco-Behaviour? Sustainability 2017, 9, 1694. [Google Scholar] [CrossRef] [Green Version]
  22. Fries-Tersch, E.; Tugran, T.; Bradley, H. 2017 Annual Report on Intra-EU Labour Mobility; European Commission: Brussels, Belgium, 2018; Volume 12. [Google Scholar] [CrossRef]
  23. Statista Research Department. Statistics Portal Grand Duchy of Luxembourg. 2021. Available online: https://statistiques.public.lu/en/support/about-site/index.html (accessed on 21 June 2021).
  24. Eurostat. European Statistics. 2021. Available online: https://ec.europa.eu/eurostat/data/database (accessed on 22 September 2020).
  25. Esser, F.; Vliegenthart, R. Comparative research methods. Int. Encycl. Commun. Res. Methods 2017, 1–22. [Google Scholar] [CrossRef] [Green Version]
  26. Brüggemann, M.; Engesser, S.; Büchel, F.; Humprecht, E.; Herrero, L.C. Hallin and Mancini Revisited: Four Empirical Types of Western Media Systems. J. Commun. 2014, 64, 1037–1065. [Google Scholar] [CrossRef]
  27. Webster, J.; Watson, R.T. Analyzing the past to prepare for the future: Writing a literature review. MIS Q. 2002, 26, xiii–xxiii. [Google Scholar]
  28. Nettleton, D. Commercial Data Mining: Processing, Analysis and Modeling for Predictive Analytics Projects; Elsevier: Amsterdam, The Netherlands, 2014. [Google Scholar]
  29. Statista. Business Data Platform. 2021. Available online: https://www.statista.com/statistics/ (accessed on 21 July 2019).
  30. U.N.E.C.F. Europe. UNECE Statistical Database. 2020. Available online: https://w3.unece.org/PXWeb/en/Table?IndicatorCode=44 (accessed on 12 September 2018).
  31. European Envirnoment Agency. 2021. Available online: https://www.eea.europa.eu/data-and-maps/indicators/transport-emissions-of-greenhouse-gases/transport-emissions-of-greenhouse-gases-10 (accessed on 24 June 2021).
  32. Kyem, P.A.K.; LeMaire, P.K. Transforming recent gains in the digital divide into digital opportunities: Africa and the boom in mobile phone subscription. Electron. J. Inf. Syst. Dev. Count. 2006, 28, 1–16. [Google Scholar] [CrossRef] [Green Version]
  33. Kumar, S.; Zahn, C. Mobile communications: Evolution and impact on business operations. Technovation 2003, 23, 515–520. [Google Scholar] [CrossRef]
  34. Freeman, C. Continental, national and sub-national innovation systems—Complementarity and economic growth. Res. Policy 2002, 31, 191–211. [Google Scholar] [CrossRef]
  35. Kim, Y.; Worrell, E. International comparison of CO2 emission trends in the iron and steel industry. Energy Policy 2002, 30, 827–838. [Google Scholar] [CrossRef]
  36. Lee, H.-S.; Anderson, B.-B. Automobile industry of China: Past, present and future. World Rev. Entrep. Manag. Sustain. Dev. 2006, 2, 144–160. [Google Scholar] [CrossRef]
  37. Moreira, J.R.; Goldemberg, J. The alcohol program. Energy Policy 1999, 27, 229–245. [Google Scholar] [CrossRef]
  38. Lewis, J.; Wiser, R.H. Fostering a renewable energy technology industry: An international comparison of wind industry policy support mechanisms. Energy Policy 2007, 35, 1844–1857. [Google Scholar] [CrossRef] [Green Version]
  39. Chaurasiya, P.K.; Warudkar, V.; Ahmed, S. Wind energy development and policy in India: A review. Energy Strategy Rev. 2019, 24, 342–357. [Google Scholar] [CrossRef]
  40. Lall, S. Technology and Human Capital in Maturing Asian Countries. Sci. Technol. Soc. 1998, 3, 11–48. [Google Scholar] [CrossRef]
  41. Davis, M. Rural household energy consumption: The effects of access to electricity—Evidence from South Africa. Energy Policy 1998, 26, 207–217. [Google Scholar] [CrossRef]
  42. Batchelor, S.; Brown, E.; Scott, N.; Leary, J. Two birds, one stone—Reframing cooking energy policies in Africa and Asia. Energies 2019, 12, 1591. [Google Scholar] [CrossRef] [Green Version]
  43. Lee, K.; Lim, C. Technological regimes, catching-up and leapfrogging: Findings from the Korean industries. Res. Policy 2001, 30, 459–483. [Google Scholar] [CrossRef]
  44. Karekezi, S. Renewables in Africa—Meeting the energy needs of the poor. Energy Policy 2002, 30, 1059–1069. [Google Scholar] [CrossRef]
  45. Sauter, R.; Watson, J. Technology Leapfrogging: A Review of the Evidence; A Report for DFID; Sussex Energy Group, University of Sussex: Brighton, UK, 2008. [Google Scholar]
  46. Gallagher, K.S. Foreign technology in China’s automobile industry: Implications for energy, economic development, and environment. China Environ. Ser. 2003, 6, 1–18. [Google Scholar]
  47. Gallagher, K.S. Handbook Trade ahe Environment; Edward Elgar: Boston, MA, USA, 2010; pp. 147–157. [Google Scholar]
  48. Mody, A.; Sherman, R. Leapfrogging in switching systems. Technol. Forecast. Soc. Chang. 1990, 37, 77–83. [Google Scholar] [CrossRef]
  49. Katz, M.L.; Shapiro, C. Network externalities, competition, and compatibility. Am. Econ. Rev. 1985, 75, 424–440. [Google Scholar]
  50. Metcalfe, J.S. Innovation Policy in a Knowledge-Based Economy; Springer: Berlin/Heidelberg, Germany, 2005; pp. 47–74. [Google Scholar] [CrossRef]
  51. Edler, J.; Fagerberg, J. Innovation policy: What, why, and how. Oxf. Rev. Econ. Policy 2017, 33, 2–23. [Google Scholar] [CrossRef] [Green Version]
  52. Head, B.W. Wicked problems in public policy. Public Policy 2008, 3, 101. [Google Scholar]
  53. Todd, J.; Chen, J.; Clogston, F. Creating the Clean Energy Economy. Analysis of the Electric Vehicle Industry; International Economic Development Council: Washington, DC, USA, 2013. [Google Scholar]
  54. Organization for Economic Co-Operation and Development (OECD). 2021. Available online: https://data.oecd.org/gdp/gross-domestic-product-gdp.htm (accessed on 30 March 2021).
  55. Porter, M.E. Towards a dynamic theory of strategy. Strateg. Manag. J. 1991, 12, 95–117. [Google Scholar] [CrossRef]
  56. Carlile, P.R.; Christensen, C.M. The Cycles of Theory Building in Management Research, Division of Research; Harvard Business School: Boston, MA, USA, 2005. [Google Scholar]
  57. Geroski, P.A. Models of technology diffusion. Res. Policy 2000, 29, 603–625. [Google Scholar] [CrossRef]
  58. Hermosilla, J.C.; Martínez, P.C.; de la Plana, C. Technology Transfer and Sustainable Development in Emerging Economies: The Problem of Technology Lock-in; Instituto de Empresa: Madrid, Spain, 2003. [Google Scholar]
  59. Cowan, R.; Gunby, P. Sprayed to death: Path dependence, lock-in and pest control strategies. Econ. J. 1996, 106, 521–542. [Google Scholar] [CrossRef]
  60. Mansfield, E. Industrial research and technological innovation. Econ. Anal. 1968, 78, 676–679. [Google Scholar]
  61. Kuper, G.H.; van Soest, D.P. Does oil price uncertainty affect energy use? Energy J. 2006, 27, 55–78. [Google Scholar] [CrossRef] [Green Version]
  62. Cowan, R. Nuclear power reactors: A study in technological lock-in. J. Econ. Hist. 1990, 50, 541–567. [Google Scholar] [CrossRef] [Green Version]
  63. Schroeder, P.; Anantharaman, M. Lifestyle Leapfrogging in Emerging Economies: Enabling Systemic Shifts to Sustainable Consumption. J. Consum. Policy 2017, 40, 3–23. [Google Scholar] [CrossRef]
  64. Borén, S. Electric buses’ sustainability effects, noise, energy use, and costs. Int. J. Sustain. Trans. 2020, 14, 956–971. [Google Scholar] [CrossRef] [Green Version]
  65. Farrell, J.; Saloner, G. Installed base and compatibility: Innovation, product preannouncements, and predation. Am. Econ. Rev. 1986, 76, 940–955. [Google Scholar]
  66. Nash, J.R. Too much market: Conflict between tradable pollution allowances and the polluter pays principle. Harv. Environ. Law Rev. 2000, 24, 465. [Google Scholar]
  67. Europe, F. Statistical report. Relig. Educ. 2017, 13, 252–254. [Google Scholar]
  68. Wicklein, R.C. Designing for appropriate technology in developing countries. Technol. Soc. 1998, 20, 371–375. Available online: https://www.tandfonline.com/toc/urea20/13/3 (accessed on 30 March 2021). [CrossRef]
Figure 1. An overview of the research methodology.
Sustainability 13 09068 g001
Figure 2. Countries with low dependency on local generation of low-carbon electricity to total number of registered electric vehicles (a) Sweden 2012–2019, (b) Norway 2012–2019, (c) Finland 2014–2019, (d) France 2008–2019, (e) Iceland 2012–2019, (f) Belgium 2011–2019 [8,30].
Sustainability 13 09068 g002aSustainability 13 09068 g002b
Figure 3. Countries with high dependency on local generation of low-carbon electricity to total number of registered electric vehicles (a) Germany 2011–2019, (b) Netherlands 2012–2019, (c) Denmark 2011–2019, (d) Luxembourg [8,30].
Sustainability 13 09068 g003
Figure 4. GHG emissions in transport sector in the considered countries [8].
Sustainability 13 09068 g004
Figure 5. Comparison of share of CO2 emission in transport sector in nine countries—2008–2018 [8].
Sustainability 13 09068 g005
Figure 6. Relation between GHG emissions and total number of registered EVs (a) Denmark 2011–2018, (b) Netherlands 2012–2018, (c) Iceland 2012–2018, (d) Belgium 2011–2018, (e) Germany 2011–2018, (f) France 2009–2018, (g) Finland 2014–2018, (h) Norway 2012–2018, (i) Sweden 2009–2018, (j) Luxembourg 2015–2018 [8,30].
Sustainability 13 09068 g006aSustainability 13 09068 g006bSustainability 13 09068 g006c
Figure 7. Passenger car rate per 1000 inhabitants in studied countries [23].
Sustainability 13 09068 g007
Figure 8. Emitted GHGs in transport sector in EU by transport mode [31].
Sustainability 13 09068 g008
Figure 9. Total final energy consumption vs. GDP in Luxembourg 1973–2018 [8,54].
Sustainability 13 09068 g009
Figure 10. Fuel prices in different European countries [67].
Sustainability 13 09068 g010
Table 1. An overview of future perspective of low carbon and renewable electricity in case studies [8].
CountriesThe Main Source of Renewable Energy in Total Electricity Consumption in 2019Share of Low-Carbon Energy Sources in Electricity Generation 2019Targeted Share of Renewable Energy in Total Electricity Consumption in 2050
NorwayHydropower > 69%95%—Hydro–Solar–Wind–Waste100%—hydropower (not less than 70%)
DenmarkWind > 49%70%—Wind–Biofuel–Solar–Waste100%—wind offshore
FinlandHydropower > 41%65%—Hydro–Nuclear–Wind–Biofuel–Waste53%—2030
SwedenHydropower > 41%91%—Hydro–Nuclear–Wind–Biofuel–Waste100%—2040
IcelandHydropower > 73%80%—Hydro–other renewables100%—2030
The NetherlandsWind > 10%20%—Wind–Solar–Biofuels–Nuclear–Hydro100%—2050
GermanyWind > 20%46%—Wind–Nuclear–Biofuel–Waste–Solar–Hydro100%—2050
FranceWind < 10%90%—Nuclear–Hydro–Wind–Solar–Geothermal85–90%—2050 without new reactors
BelgiumWind < 10%62%—Nuclear–Wind–Solar–Hydro–Biofuel–Waste32%—2030
LuxembourgHydropower < 8%9.1%—Hydro–Wind–Solar–Biofuels25%—2030
Table 2. Correlating coefficients between GHGs emission and low carbon electricity in the studied countries.
Correlation CoefficientCountries with High DependencyCountries with Low Dependency
0.92Denmark
0.96Netherlands
0.958Germany
0.98Luxembourg
−0.747 Iceland
0.43 Belgium
0.33 France
0.282 Finland
0.36 Norway
0.502 Sweden
Table 3. Correlating coefficients between GHG emissions and number of EVs in the studied countries.
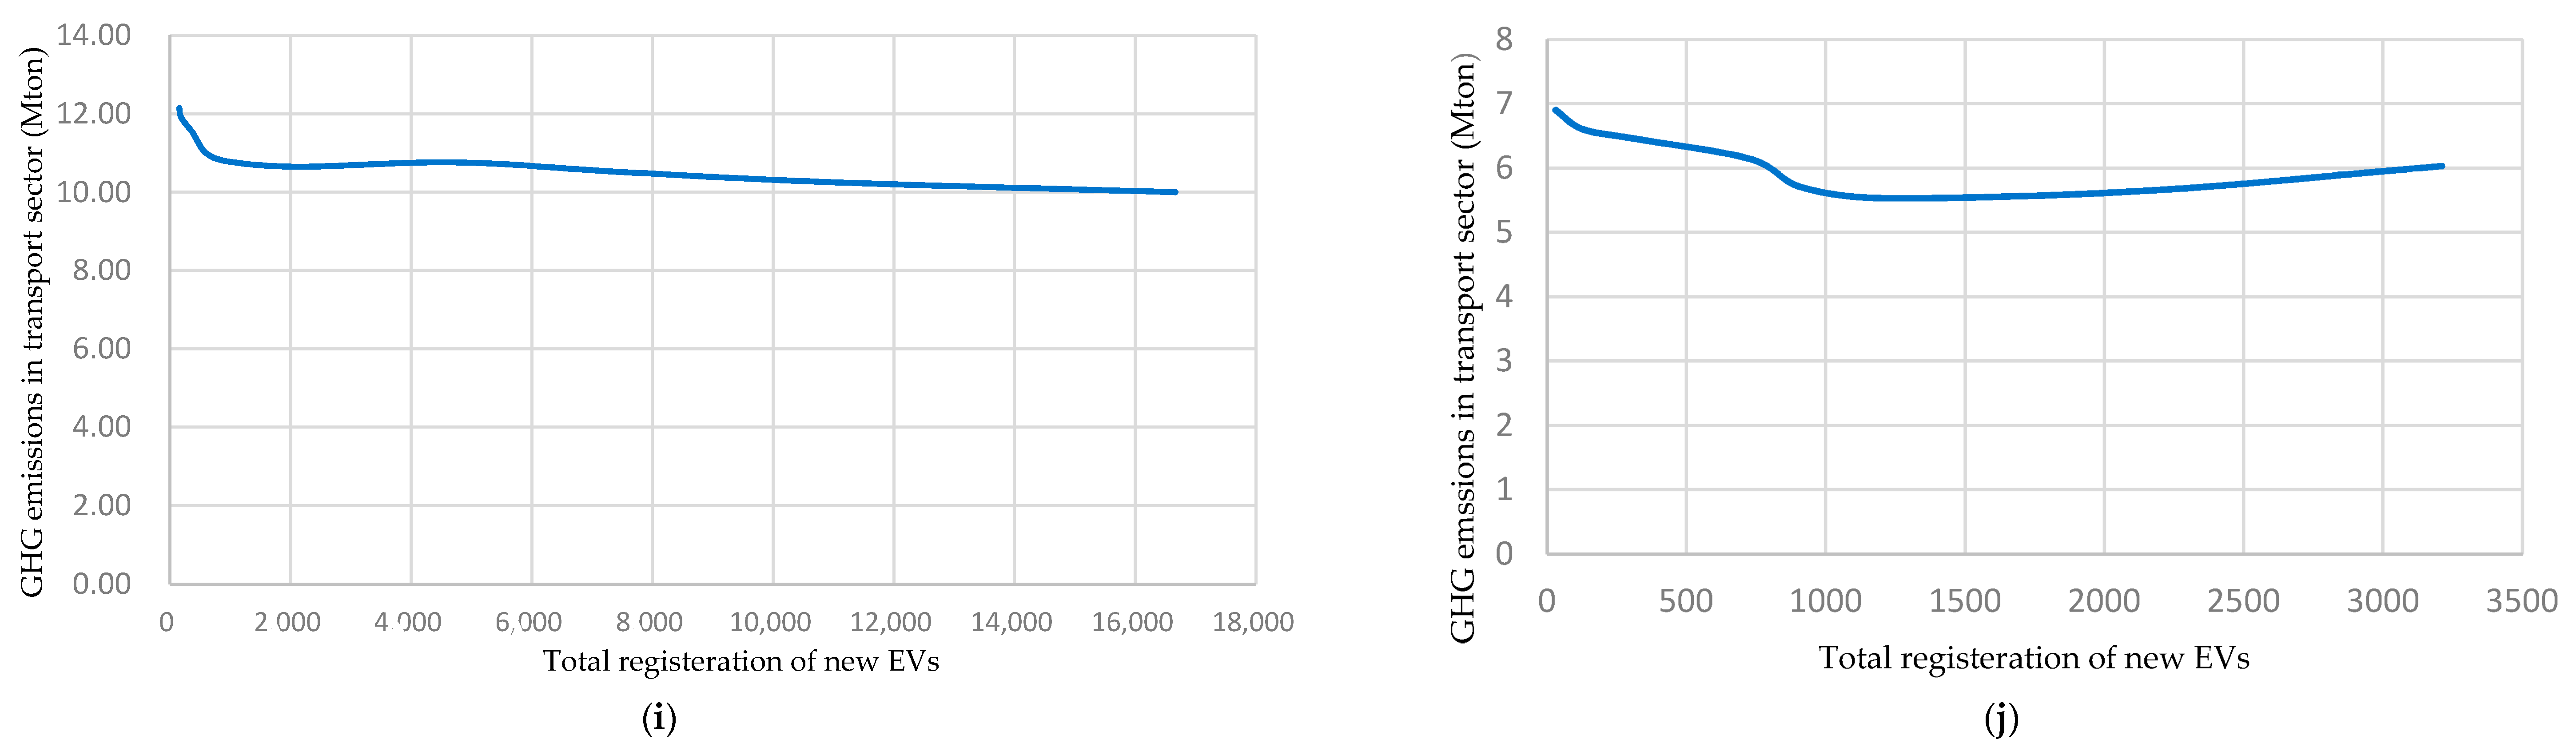
Correlating Coefficient-GHGs Emission and No. EVCountries
0.134France
0.157Finland
−0.915Norway
−0.592Luxembourg
−0.788Sweden
0.72Germany
0.35Belgium
0.95Iceland
−0.51Netherland
0.744Denmark
Publisher’s Note: MDPI stays neutral with regard to jurisdictional claims in published maps and institutional affiliations.

