
Can Urban Forest Settings Evoke Positive Emotion? Evidence on Facial Expressions and Detection of Driving Factors


Abstract
:1. Introduction
2. Materials and Methods
2.1. Study Area and Data Source
2.2. Photo Treatment and Analysis
2.3. Statistical Analysis
3. Results
3.1. Happy Score
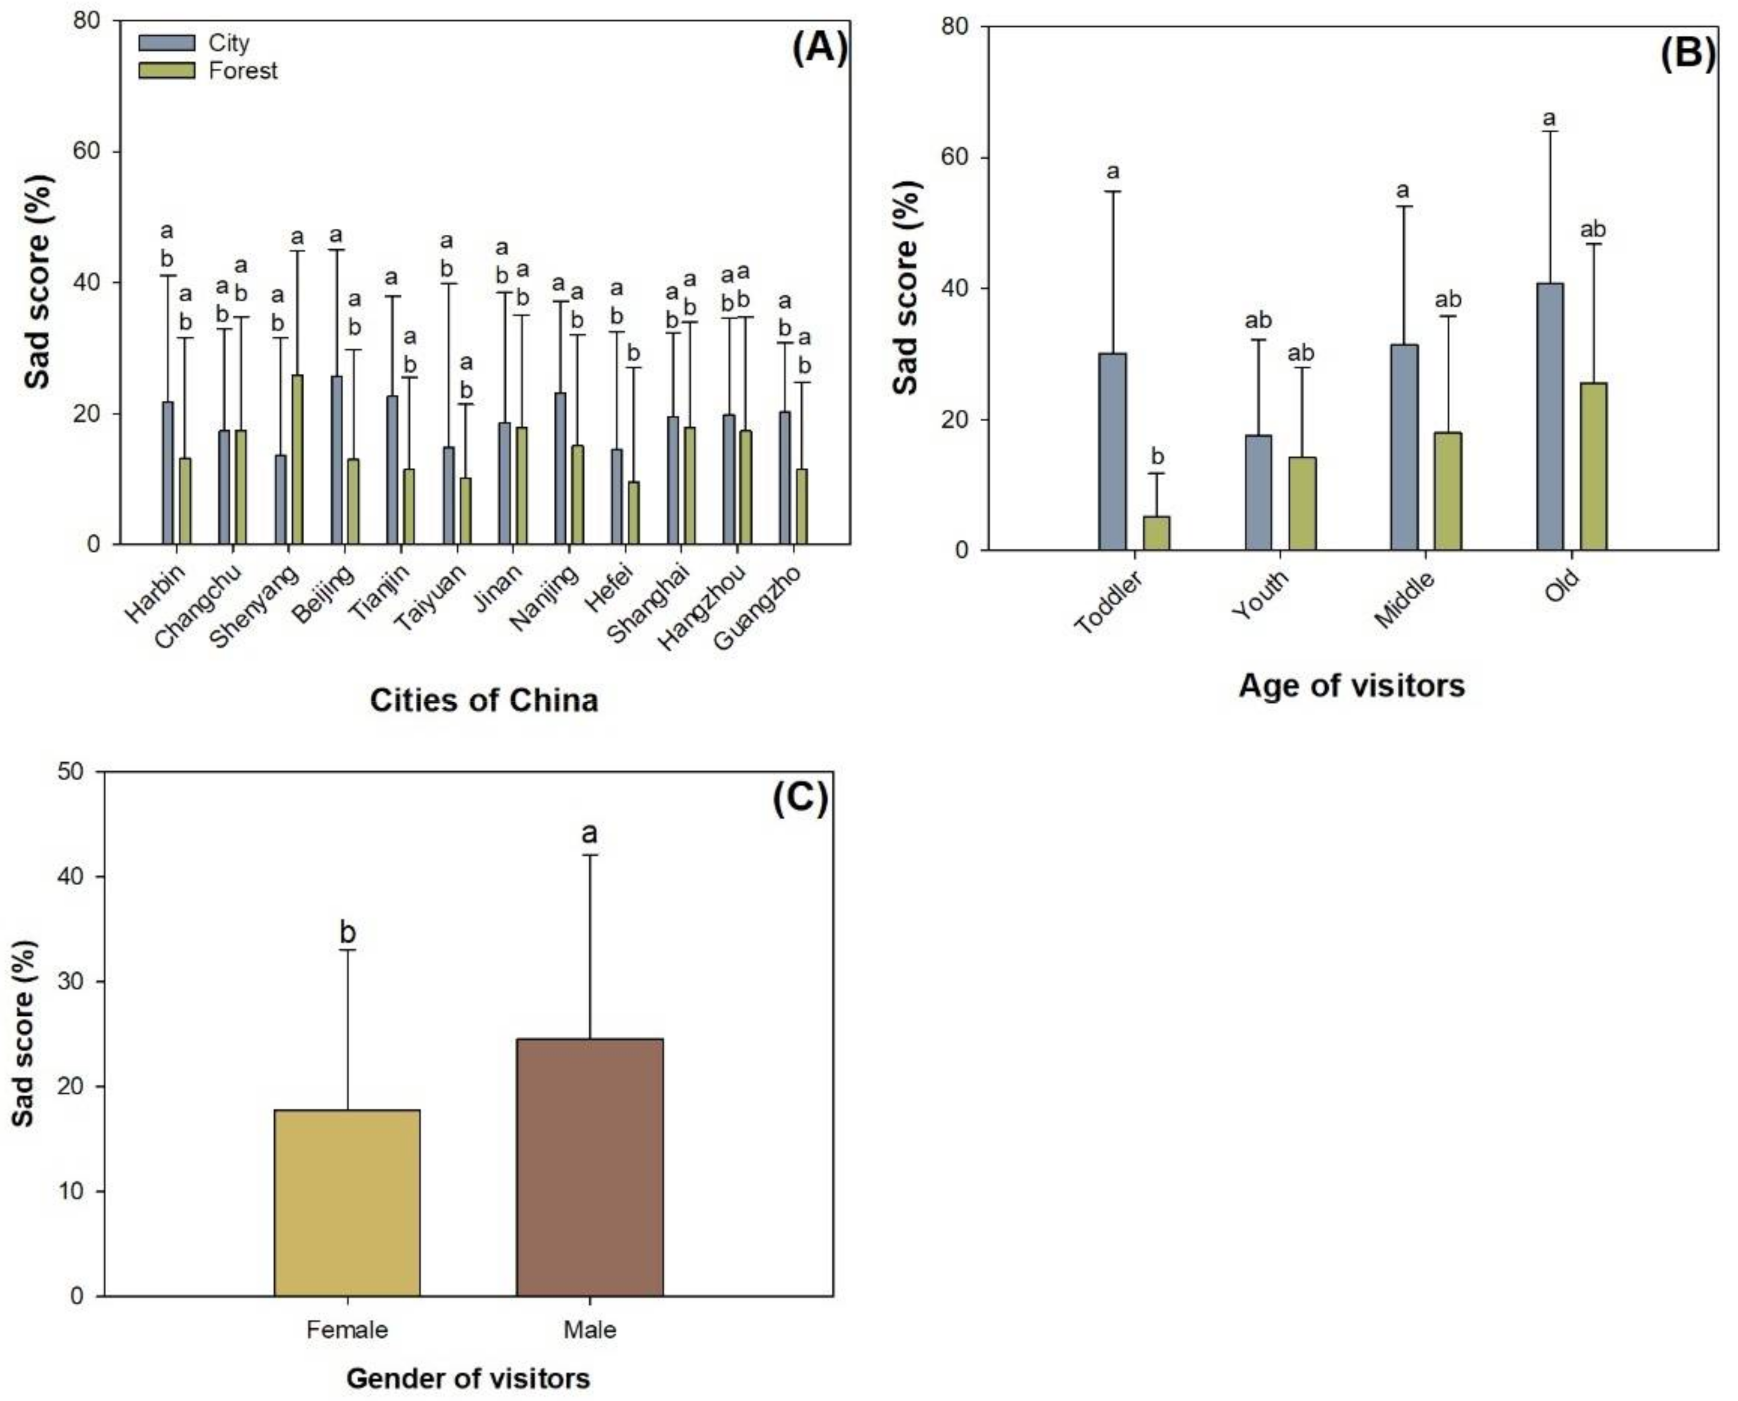
3.2. Sad Score
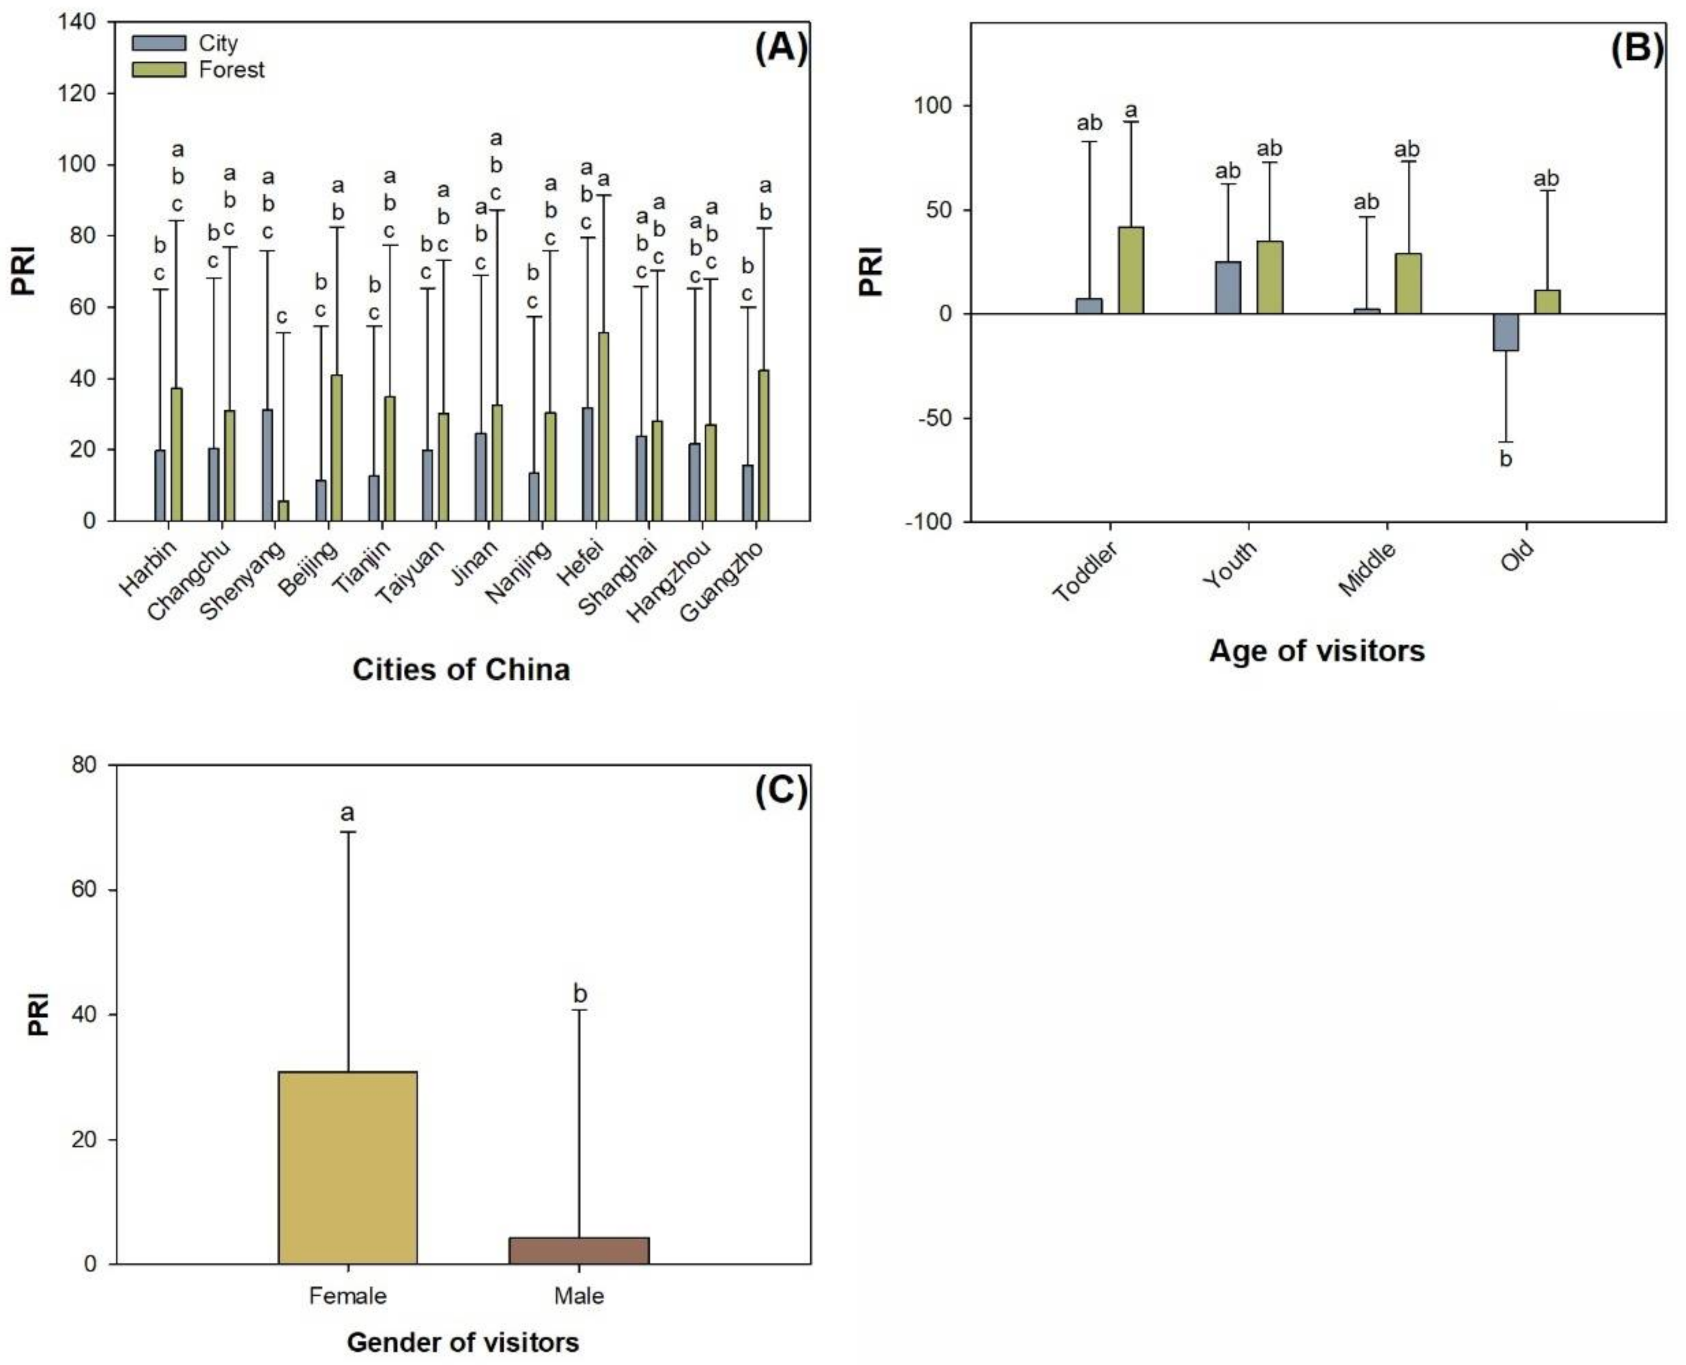
3.3. Positive Response Index
3.4. Regression Analysis
4. Discussion
4.1. More Positive Emotion in Forests Than in Cities
4.2. Gender Effect on Facial Expressions
4.3. Age Effect on Facial Expressions
4.4. Driving Forces from Environmental Factors
4.5. Limits of the Study
5. Conclusions
Supplementary Materials
Author Contributions
Funding
Institutional Review Board Statement
Informed Consent Statement
Data Availability Statement
Acknowledgments
Conflicts of Interest
References
- Pykett, J.; Osborne, T.; Resch, B. From Urban Stress to Neurourbanism: How Should We Research City Well-Being? Ann. Am. Assoc. Geogr. 2020, 110, 1936–1951. [Google Scholar] [CrossRef]
- Nieuwenhuijsen, M.J.; Khreis, H. Car free Cities: Pathway to healthy urban living. Environ. Int. 2016, 94, 251–262. [Google Scholar] [CrossRef] [PubMed]
- European Environment Agency. Urban Adaptation to Climate Change in Europe 2016—Transforming Cities in a Changing Climate; Publications Office of the European Union: Luxembourg, 2016. [Google Scholar]
- Zhou, C.W.; Yan, L.B.; Yu, L.F.; Wei, H.X.; Guan, H.M.; Shang, C.F.; Chen, F.Y.; Bao, J.Z. Effect of Short-term Forest Bathing in Urban Parks on Perceived Anxiety of Young-Adults: A Pilot Study in Guiyang, Southwest China. Chin. Geogr. Sci. 2019, 29, 139–150. [Google Scholar] [CrossRef] [Green Version]
- Guan, H.; Wei, H.; He, X.; Ren, Z.; An, B. The tree-species-specific effect of forest bathing on perceived anxiety alleviation of young-adults in urban forests. Ann. For. Res. 2017, 60, 327–341. [Google Scholar] [CrossRef]
- Ulrich, R.S.; Simons, R.F.; Losito, B.D.; Fiorito, E.; Miles, M.A.; Zelson, M. Stress recovery during exposure to natural and urban environments. J. Environ. Psychol. 1991, 11, 201–230. [Google Scholar] [CrossRef]
- Baum, A.; Fleming, R.; Singer, J.E. Understanding environmental stress: Strategies for conceptual and methodlogical integration. In Advances in Environmental Psychology; Baum, A., Singer, J.E., Eds.; Lawrence Erlbaum Associates: Hillsdale, NJ, USA, 1985; Volume 5, pp. 185–205. [Google Scholar]
- Diener, E.; Suh, E.M.; Lucas, R.E.; Smith, H.L. Subjective well-being: Three decades of progress. Psychol. Bull. 1999, 125, 276–302. [Google Scholar] [CrossRef]
- Grossman, P.; Niemann, L.; Schmidt, S.; Walach, H. Mindfulness-based stress reduction and health benefits—A meta-analysis. J. Psychosom. Res. 2004, 57, 35–43. [Google Scholar] [CrossRef]
- Coldwell, D.F.; Evans, K.L. Visits to urban green-space and the countryside associate with different components of mental well-being and are better predictors than perceived or actual local urbanisation intensity. Landsc. Urban Plan. 2018, 175, 114–122. [Google Scholar] [CrossRef]
- Nitoslawski, S.A.; Galle, N.J.; Van den Bosch, C.K.; Steenberg, J.W.N. Smarter ecosystems for smarter cities? A review of trends, technologies, and turning points for smart urban forestry. Sust. Cities Soc. 2019, 51, 101770. [Google Scholar] [CrossRef]
- Kabisch, N.; Puffel, C.; Masztalerz, O.; Hemmerling, J.; Kraemer, R. Physiological and psychological effects of visits to different urban green and street environments in older people: A field experiment in a dense inner-city area. Landsc. Urban Plan. 2021, 207, 103998. [Google Scholar] [CrossRef]
- Kobayashi, H.; Ikei, H.; Song, C.; Kagawa, T.; Miyazaki, Y. Comparing the impact of forest walking and forest viewing on psychological states. Urban For. Urban Green. 2021, 57, 126920. [Google Scholar] [CrossRef]
- Stigsdotter, U.K.; Corazon, S.S.; Sidenius, U.; Kristiansen, J.; Grahn, P. It is not all bad for the grey city—A crossover study on physiological and psychological restoration in a forest and an urban environment. Health Place 2017, 46, 145–154. [Google Scholar] [CrossRef] [PubMed]
- Vert, C.; Gascon, M.; Ranzani, O.; Marquez, S.; Triguero-Mas, M.; Carrasco-Turigas, G.; Arjona, L.; Koch, S.; Llopis, M.; Donaire-Gonzalez, D.; et al. Physical and mental health effects of repeated short walks in a blue space environment: A randomised crossover study. Environ. Res. 2020, 188, 109812. [Google Scholar] [CrossRef] [PubMed]
- Triguero-Mas, M.; Gidlow, C.J.; Martínez, D.; de Bont, J.; Carrasco-Turigas, G.; Martínez-Íñiguez, T.; Hurst, G.; Masterson, D.; Donaire-Gonzalez, D.; Seto, E.; et al. The effect of randomised exposure to different types of natural outdoor environments compared to exposure to an urban environment on people with indications of psychological distress in Catalonia. PLoS ONE 2017, 12, e0172200. [Google Scholar] [CrossRef] [Green Version]
- Kotera, Y.; Richardson, M.; Sheffield, D. Effects of Shinrin-Yoku (Forest Bathing) and Nature Therapy on Mental Health: A Systematic Review and Meta-analysis. Int. J. Ment. Health Addict. 2020, 2020, 1–25. [Google Scholar] [CrossRef]
- Kaplan, R.; Kaplan, S. The Experience of Nature: A Psychological Perspective; Cambridge University Press: New York, NY, USA, 1989. [Google Scholar]
- Pihel, J.; Ode Sang, Å.; Hagerhall, C.; Nyström, M. Expert and novice group differences in eye movements when assessing biodiversity of harvested forests. For. Policy Econ. 2015, 56, 20–26. [Google Scholar] [CrossRef]
- Aerts, R.; Honnay, O.; Van Nieuwenhuyse, A. Biodiversity and human health: Mechanisms and evidence of the positive health effects of diversity in nature and green spaces. Br. Med. Bull. 2018, 127, 5–22. [Google Scholar] [CrossRef] [Green Version]
- Ekman, P.; Davidson, J.R. The Nature of Emotion: Fundamental Questions; Oxford University Press: New York, NY, USA, 1994. [Google Scholar]
- Wikipedia Contributors. Emotion. Available online: https://en.wikipedia.org/w/index.php?title=Emotion&oldid=1018211762 (accessed on 18 April 2021).
- Bielinis, E.; Janeczko, E.; Takayama, N.; Zawadzka, A.; Slupska, A.; Pietka, S.; Lipponen, M.; Bielinis, L. The effects of viewing a winter forest landscape with the ground and trees covered in snow on the psychological relaxation of young Finnish adults: A pilot study. PLoS ONE 2021, 16, e0244799. [Google Scholar] [CrossRef]
- Bielinis, E.; Lukowski, A.; Omelan, A.; Boiko, S.; Takayama, N.; Grebner, D.L. The Effect of Recreation in a Snow-Covered Forest Environment on the Psychological Wellbeing of Young Adults: Randomized Controlled Study. Forests 2019, 10, 827. [Google Scholar] [CrossRef] [Green Version]
- Takayama, N.; Korpela, K.; Lee, J.; Morikawa, T.; Tsunetsugu, Y.; Park, B.J.; Li, Q.; Tyrvainen, L.; Miyazaki, Y.; Kagawa, T. Emotional, Restorative and Vitalizing Effects of Forest and Urban Environments at Four Sites in Japan. Int. J. Environ. Res. Public Health 2014, 11, 7207–7230. [Google Scholar] [CrossRef] [Green Version]
- McEwan, K.; Giles, D.; Clarke, F.J.; Kotera, Y.; Evans, G.; Terebenina, O.; Minou, L.; Teeling, C.; Basran, J.; Wood, W.; et al. A Pragmatic Controlled Trial of Forest Bathing Compared with Compassionate Mind Training in the UK: Impacts on Self-Reported Wellbeing and Heart Rate Variability. Sustainability 2021, 13, 1380. [Google Scholar] [CrossRef]
- Wikipedia Contributors. Facial Expression. Available online: https://en.wikipedia.org/w/index.php?title=Facial_expression&oldid=1011786479 (accessed on 25 April 2021).
- Wei, H.; Hauer, R.J.; Chen, X.; He, X. Facial expressions of visitors in forests along the urbanization gradient: What can we learn from selfies on social networking services? Forests 2019, 10, 1049. [Google Scholar] [CrossRef] [Green Version]
- Wei, H.; Hauer, R.J.; He, X. A forest experience does not always evoke positive emotion: A pilot study on unconscious facial expressions using the face reading technology. For. Policy Econ. 2021, 123, 102365. [Google Scholar] [CrossRef]
- Wei, H.; Ma, B.; Hauer, R.J.; Liu, C.; Chen, X.; He, X. Relationship between environmental factors and facial expressions of visitors during the urban forest experience. Urban For. Urban Green. 2020, 53, 126699. [Google Scholar] [CrossRef]
- Wei, H.; Hauer, R.J.; Zhai, X. The relationship between the facial expression of people in university campus and host-city variables. Appl. Sci. 2020, 10, 1474. [Google Scholar] [CrossRef] [Green Version]
- Park, B.J.; Furuya, K.; Kasetani, T.; Takayama, N.; Kagawa, T.; Miyazaki, Y. Relationship between psychological responses and physical environments in forest settings. Landsc. Urban Plan. 2011, 102, 24–32. [Google Scholar] [CrossRef]
- Kim, S.S.; Song, K.S.; Go, J.H. A Study of design with spatial rule-based engine using geospatial big-data. In Proceedings of the 2018 International Conference on Information and Communication Technology Convergence, Jeju, Korea, 17–19 October 2018; pp. 1273–1275. [Google Scholar]
- Wikipedia Contributors. National Day of the People’s Republic of China. Available online: https://en.wikipedia.org/w/index.php?title=National_Day_of_the_People%27s_Republic_of_China&oldid=1023749763 (accessed on 18 May 2021).
- Dai, L.; Xue, T.; Wu, B.; Rong, X.; Xu, B. Spatiotemporal Structure Features of Network Check-in Activities of Urban Residents and Their Impacting Factors: A Case Study in Six Urban Districts of Beijing. J. Asian Archit. Build. Eng. 2017, 16, 131–138. [Google Scholar] [CrossRef] [Green Version]
- Climatic Data Centre. Meteorological Data Centre of China Meteorological Administration. Available online: http://data.cma.cn/ (accessed on 18 April 2021).
- Guo, S.L.; Wei, H.X.; Li, J.P.; Fan, R.F.; Xu, M.Y.; Chen, X.; Wang, Z.Y. Geographical Distribution and Environmental Correlates of Eleutherosides and Isofraxidin in Eleutherococcus senticosus from Natural Populations in Forests at Northeast China. Forests 2019, 10, 872. [Google Scholar] [CrossRef] [Green Version]
- Guo, S.L.; Zhang, D.H.; Wei, H.Y.; Zhao, Y.N.; Cao, Y.B.; Yu, T.; Wang, Y.; Yan, X.F. Climatic Factors Shape the Spatial Distribution of Concentrations of Triterpenoids in Barks of White Birch (Betula Platyphylla Suk.) Trees in Northeast China. Forests 2017, 8, 334. [Google Scholar] [CrossRef] [Green Version]
- Wei, H.X.; Liu, P. The accuracy validation of FireFACE software in analyzing facial expressions of urban forest visitors. Preprints 2020, 265. [Google Scholar] [CrossRef]
- Conover, W.J.; Iman, R.L. Rank Transformations as a Bridge between Parametric and Nonparametric Statistics. Am. Stat. 1981, 35, 124–129. [Google Scholar]
- Sloan, J.L.; Burney, O.T.; Pinto, J.R. Drought-Conditioning of Quaking Aspen (Populus tremuloides Michx.) Seedlings during Nursery Production Modifies Seedling Anatomy and Physiology. Front. Plant Sci. 2020, 11, 11. [Google Scholar] [CrossRef]
- Baiyi, A.N.; Hongxu, W.E.I.; Linlin, L.I.; Peng, G.U.O. Nutrient Uptake and Utilization and Antioxidants of Fruits in Red Raspberry (Rubus idaeus L.) Cultivar ‘Autumn Bliss’ in response to Fertilization under Extended Photoperiod. Not. Bot. Horti Agrobot. 2018, 46, 440–448. [Google Scholar]
- Hongxu, W.E.I.; Hengtian, Z.; Xin, C. Foliar N:P Stoichiometry in Aralia elata Distributed on Different Slope Degrees. Not. Bot. Horti Agrobot. 2019, 47, 887–895. [Google Scholar]
- Li, X.; Xia, H.; Wang, J.; Chen, Q. Nutrient uptake and assimilation in fragrant rosewood (Dalbergia odorifera T.C. Chen) seedlings in growing media with un-composted spent mushroom residue. PLoS ONE 2021, 16, e0249534. [Google Scholar]
- Liu, P.; Cao, B.; Wang, Y.; Wei, Z.; Ye, J.; Wei, H. Spectral effect of streetlamps on urban trees: A simulated study on tissue water, nitrogen, and carbohydrate contents in maple and oak. PLoS ONE 2021, 16, e0248463. [Google Scholar]
- Nawijn, J.; Marchand, M.A.; Veenhoven, R.; Vingerhoets, A.J. Vacationers Happier, but Most not Happier After a Holiday. Appl. Res. Qual. Life 2010, 5, 35–47. [Google Scholar] [CrossRef] [Green Version]
- Du, S.; Tao, Y.; Martinez, A.M. Compound facial expressions of emotion. Proc. Natl. Acad. Sci. USA 2014, 111, E1454–E1462. [Google Scholar] [CrossRef] [PubMed] [Green Version]
- Kerrihard, A.L.; Khair, M.B.; Blumberg, R.; Feldman, C.H.; Wunderlich, S.M. The effects of acclimation to the United States and other demographic factors on responses to salt levels in foods: An examination utilizing face reader technology. Appetite 2017, 116, 315–322. [Google Scholar] [CrossRef] [PubMed]
- Yu, C.P.; Lin, C.M.; Tsai, M.J.; Tsai, Y.C.; Chen, C.Y. Effects of Short Forest Bathing Program on Autonomic Nervous System Activity and Mood States in Middle-Aged and Elderly Individuals. Int. J. Environ. Res. Public Health 2017, 14, 897. [Google Scholar] [CrossRef] [PubMed]
- Bielinis, E.; Takayama, N.; Boiko, S.; Omelan, A.; Bielinis, L. The effect of winter forest bathing on psychological relaxation of young Polish adults. Urban For. Urban Green. 2018, 29, 276–283. [Google Scholar] [CrossRef]
- Chaplin, T.M. Gender and Emotion Expression: A Developmental Contextual Perspective. Emot. Rev. 2014, 7, 14–21. [Google Scholar] [CrossRef] [PubMed] [Green Version]
- Dopko, R.L.; Capaldi, C.A.; Zelenski, J.M. The psychological and social benefits of a nature experience for children: A preliminary investigation. J. Environ. Psychol. 2019, 63, 134–138. [Google Scholar] [CrossRef]
- Zhu, J.; Xu, C. Sina microblog sentiment in Beijing city parks as measure of demand for urban green space during the COVID-19. Urban For. Urban Green. 2021, 58, 126913. [Google Scholar] [CrossRef]
- Zhu, X.; Gao, M.; Zhang, R.; Zhang, B. Quantifying emotional differences in urban green spaces extracted from photos on social networking sites: A study of 34 parks in three cities in northern China. Urban For. Urban Green. 2021, 62, 127133. [Google Scholar] [CrossRef]
- Baylis, P.; Obradovich, N.; Kryvasheyeu, Y.; Chen, H.; Coviello, L.; Moro, E.; Cebrian, M.; Fowler, J.H. Weather impacts expressed sentiment. PLoS ONE 2018, 13, e0195750. [Google Scholar] [CrossRef] [PubMed]
- Elsadek, M.; Liu, B.Y.; Lian, Z.F.; Xie, J.F. The influence of urban roadside trees and their physical environment on stress relief measures: A field experiment in Shanghai. Urban For. Urban Green. 2019, 42, 51–60. [Google Scholar] [CrossRef]
- Jeong, M.A.; Park, S.; Song, G.S. Comparison of human thermal responses between the urban forest area and the central building district in Seoul, Korea. Urban For. Urban Green. 2016, 15, 133–148. [Google Scholar] [CrossRef]
- Kong, Q.Q.; Ge, Q.S.; Xi, J.C.; Zheng, J.Y. Human-biometeorological assessment of increasing summertime extreme heat events in Shanghai, China during 1973–2015. Theor. Appl. Climatol. 2017, 130, 1055–1064. [Google Scholar] [CrossRef]
- Qian, Z.H.; Cao, C.H.; Feng, G.L. Spatial distribution characteristics of nearly extremely anomalous temperature events in summer and winter in China. Acta Phys. Sin. 2017, 66, 049201. [Google Scholar]
- Gao, J.J.; Yu, F.; Xu, Z.H.; Duan, J.; Cheng, Q.; Bai, L.J.; Zhang, Y.W.; Wei, Q.N.; Yi, W.Z.; Pan, R.B.; et al. The association between cold spells and admissions of ischemic stroke in Hefei, China: Modified by gender and age. Sci. Total Environ. 2019, 669, 140–147. [Google Scholar] [CrossRef] [PubMed]
- Paraskevopoulou, A.T.; Kamperi, E. Design of hospital healing gardens linked to pre-or post-occupancy research findings. Front. Archit. Res. 2018, 7, 395–414. [Google Scholar] [CrossRef]
- Paraskevopoulou, A.T.; Kamperi, E.; Demiris, N.; Economou, M.; Theleritis, C.; Kitsonas, M.; Papageorgiou, C. The impact of seasonal colour change in planting on patients with psychotic disorders using biosensors. Urban For. Urban Green. 2018, 36, 50–56. [Google Scholar] [CrossRef]


| City Name | Place | Name of Place | Coordinate | Female | Male | Total |
|---|---|---|---|---|---|---|
| Harbin | City | Zhongyang Street | 45°46′ N, 126°37′ E 1 | 74 | 27 | 101 |
| Forest | Sun Island | 45°48′ N, 126°36′ E | 15 | 78 | 93 | |
| Changchun | City | Chongqing Road | 43°53′ N, 125°20′ E | 17 | 9 | 26 |
| Forest | Jingyue Pool | 43°48′ N, 125°27′ E | 32 | 20 | 52 | |
| Shenyang | City | Shengyang Middle Street | 41°48′ N, 123°27′ E | 48 | 12 | 60 |
| Forest | Shenyang Expo Garden | 41°52′ N, 123°39′ E | 11 | 5 | 16 | |
| Beijing | City | Tiananmen Square | 39°55′ N, 116°24′ E | 323 | 178 | 501 |
| Forest | Beijing Olympic Park | 39°60′ N, 116°24′ E | 63 | 28 | 91 | |
| Tianjin | City | Binjiang Road | 39°08′ N, 117°12′ E | 179 | 52 | 231 |
| Forest | Tanggu Forest Park | 39°05′ N, 117°41′ E | 8 | 6 | 14 | |
| Taiyuan | City | Wuyi Square | 38°52′ N, 112°34′ E | 10 | 3 | 13 |
| Forest | Yingze Park | 37°51′ N, 112°34′ E | 13 | 3 | 16 | |
| Jinan | City | Quancheng Park | 36°40′ N, 117°01′ E | 114 | 27 | 141 |
| Forest | Jinan Forest Park | 36°40′ N, 116°57′ E | 11 | 1 | 12 | |
| Nanjing | City | Nanjing Confucius Temple | 32°01′ N, 118°47′ E | 148 | 51 | 199 |
| Forest | Laoshan National Forest Park | 32°04′ N, 118°34′ E | 7 | 10 | 17 | |
| Hefei | City | Municipal Government Park | 31°52′ N, 117°17′ E | 29 | 3 | 32 |
| Forest | Dashushan Forest Park | 31°50′ N, 117°10′ E | 29 | 10 | 39 | |
| Shanghai | City | The Bund of Shanghai | 31°14′ N, 121°29′ E | 199 | 81 | 280 |
| Forest | Gongqing Forest Park | 31°19′ N, 121°33′ E | 69 | 20 | 89 | |
| Hangzhou | City | Hangzhou Yan’an Road | 30°15′ N, 120°10′ E | 141 | 15 | 156 |
| Forest | Hangzhou West Lake | 30°15′ N, 120°09′ E | 274 | 98 | 372 | |
| Guangzhou | City | Shangxiajiu Pedestrian Street | 23°07′ N, 113°15′ E | 84 | 25 | 109 |
| Forest | Huolushan Forest Park | 23°11′ N, 113°24′ E | 107 | 57 | 164 | |
| Total | 2005 | 819 | 2824 |
| Source | DF 1 | Happy | Sad | PRI 2 | |||
|---|---|---|---|---|---|---|---|
| F Value | p Value | F Value | p Value | F Value | p Value | ||
| Model | 128 | 3.66 3 | <0.0001 | 2.98 | <0.0001 | 3.65 | <0.0001 |
| Error | 2695 | - | - | - | - | - | - |
| City | 11 | 2.47 3 | 0.0045 | 3.36 | 0.0001 | 3.58 | <0.0001 |
| Place | 1 | 33.43 | <0.0001 | 36.76 | <0.0001 | 40.44 | <0.0001 |
| Gender | 1 | 267.65 | <0.0001 | 71.22 | <0.0001 | 189.45 | <0.0001 |
| Age | 3 | 9.57 | <0.0001 | 30.83 | <0.0001 | 26.04 | <0.0001 |
| City × Place | 11 | 1.61 | 0.0889 | 1.89 | 0.0358 | 1.96 | 0.0286 |
| City × Gender | 11 | 0.56 | 0.862 | 0.49 | 0.9116 | 0.32 | 0.9821 |
| City × Age | 25 | 1.18 | 0.2446 | 1.34 | 0.1233 | 1.11 | 0.3158 |
| Place × Gender | 1 | 0.38 | 0.5392 | 0.02 | 0.8843 | 0.06 | 0.8039 |
| Place × Age | 2 | 2.61 | 0.0734 | 3.66 | 0.0258 | 0.0258 | 0.0091 |
| Gender × Age | 2 | 0.34 | 0.714 | 1.5 | 0.2238 | 0.69 | 0.5013 |
| City × Place × Gender | 11 | 0.63 | 0.8086 | 0.93 | 0.508 | 0.77 | 0.6714 |
| City × Place × Age | 16 | 1.05 | 0.4012 | 0.82 | 0.6614 | 0.73 | 0.7649 |
| Place × Gender × Age | 2 | 0.82 | 0.4416 | 1.93 | 0.1448 | 1.59 | 0.205 |
| City × Place × Gender × Age | 31 | 0.87 | 0.6676 | 1.47 | 0.1066 | 1.06 | 0.3735 |
| Parameter | Coefficient | Parameter Estimate | SE 1 | Model R2 | F value | Pr > F |
|---|---|---|---|---|---|---|
| Happy | Intercept | 1310.84 | 47.08 | - | 775.05 | <0.0001 |
| MinT 2 | 7.45 | 3.26 | 0.0018 | 5.21 | 0.0225 | |
| Sad | Intercept | 1141.74 | 89.35 | - | 163.30 | <0.0001 |
| Latitude | 7.83 | 2.54 | 0.0033 | 9.46 | 0.0021 | |
| PRI 3 | Intercept | 1685.24 | 89.35 | - | 355.78 | <0.0001 |
| Latitude | −7.88 | 2.54 | 0.0034 | 9.60 | 0.0020 |
Publisher’s Note: MDPI stays neutral with regard to jurisdictional claims in published maps and institutional affiliations. |
© 2021 by the authors. Licensee MDPI, Basel, Switzerland. This article is an open access article distributed under the terms and conditions of the Creative Commons Attribution (CC BY) license (https://creativecommons.org/licenses/by/4.0/).
Share and Cite
Liu, P.; Liu, M.; Xia, T.; Wang, Y.; Wei, H. Can Urban Forest Settings Evoke Positive Emotion? Evidence on Facial Expressions and Detection of Driving Factors. Sustainability 2021, 13, 8687. https://doi.org/10.3390/su13168687
Liu P, Liu M, Xia T, Wang Y, Wei H. Can Urban Forest Settings Evoke Positive Emotion? Evidence on Facial Expressions and Detection of Driving Factors. Sustainability. 2021; 13(16):8687. https://doi.org/10.3390/su13168687
Chicago/Turabian StyleLiu, Ping, Mengnan Liu, Tingting Xia, Yutao Wang, and Hongxu Wei. 2021. "Can Urban Forest Settings Evoke Positive Emotion? Evidence on Facial Expressions and Detection of Driving Factors" Sustainability 13, no. 16: 8687. https://doi.org/10.3390/su13168687