Article

Monitoring Study on Dust Dispersion Properties during Earthwork Construction

1
School of Civil Engineering, Chongqing University, Chongqing 400045, China
2
Key Laboratory of New Technology for Construction of Cities in Mountain Area, Ministry of Education, Chongqing University, Chongqing 400045, China
*
Author to whom correspondence should be addressed.
Sustainability 2021, 13(15), 8451; https://doi.org/10.3390/su13158451
Submission received: 15 July 2021 / Revised: 20 July 2021 / Accepted: 26 July 2021 / Published: 28 July 2021

Abstract

:
Dust generated in earthwork construction activities can seriously affect the air quality at a construction site and have adverse effects on the health of construction workers. To accurately and quantitively analyze the distribution characteristics of construction dust and the effect of dust prevention measures during earthwork construction under normal construction and construction with dust control measures, multiple collection points and one meteorological parameter collection point were placed at the construction site. From half an hour before the construction to half an hour after the construction, the particle concentration was recorded once every minute. The monitoring results indicated that there was a significant positive correlation between dust concentration during earthwork construction and the number of soil shipments. The dust concentration was highest at the earth excavation site, followed by the area of the waste truck’s transportation path. Earth excavation primarily resulted in the generation of many coarse particles, the concentration of which was the highest near the excavation site. The average concentration increments of PM2.5 and TSP (total suspended particulate) caused by earthwork construction were 55.06 and 375.17 μg/m3 at the construction site, respectively. The concentration increment of PM2.5 and TSP decreased by 72.01% and 40.16%, respectively, when a spray system and artificial sprinkling were adopted. Through the methodology and results of this study, construction companies can systemically plan their construction work by considering the key equipment to be used and can effectively manage the pollutants found within construction sites.

1. Introduction

Air pollution has become a vital issue worldwide, especially in areas in which infrastructure construction is carried out on a large scale. The construction industry is one of the main causes of air pollution [1]. Construction projects discharge a large amount of particulate matter into the environment, which causes harm not only to construction workers but also to the surrounding residents. The adverse effects of air pollution are extensive, especially in the area of public health. Studies have shown that an increase in the PM concentration in the air will cause harm to human bodies [2], and inhalable particulate matter will penetrate the lungs and cause lung diseases [3]. Therefore, air pollution has attracted increasing attention in various industrial fields.
Outside the construction industry, many scholars have conducted correlated studies, which have primarily focused on the dispersion rules of dust during tunnel construction and mining construction [4,5], diseases caused by dust [6,7], dust prevention measures [8,9] and health risk assessments of involved employees [10,11,12]. However, dust pollution in the construction industry should be emphasized equally. Over the years, urban construction activities have continued, especially due to the development and construction of new real estate. The development of large-scale construction has led to an increasingly serious problem of dust pollution [13,14,15]. As shown in the comparative estimates, for every increment of 3 × 10 4 4 × 10 4 m 2 in the amount of construction in the urban center, the average contribution of dust generated from construction projects to the urban TSP (total suspended particulate) increases by 1 μ g / m 3 [16]. Because of the large number of employees, as well as high labor intensity, outdoor production and poor working conditions in the construction industry, dust pollution greatly threatens the health of related employees and nearby residents [17,18]. With the increase in construction activities, the pollution of construction dust is predicted to become more serious in the future. Therefore, it is necessary to study the dispersion of building dust pollution.
As shown in previous studies [10,19,20], construction dust pollution is predominantly derived from the following four sources: (1) excavation dust; (2) field handling, stacking and processing of building materials; (3) dust from clearing and stacking construction waste and (4) primary dust caused by scattering during the transportation of building materials by vehicles and the secondary dust caused when the dust on the road surface is raised by the vehicles and then dispersed with the wind. The above four sources of construction dust pollution mostly occur during the foundation excavation and backfilling stages, which are primarily correlated with earthwork construction. Therefore, during the major construction stage of a project, dust pollution from earthwork is the most significant factor [21].
However, to date, there has been insufficient research on dust dispersion during earthwork construction. Most studies have been implemented on the premise that the level of dust generated at a construction site is kept consistent under a certain construction period and a certain construction area. This assumption mainly focuses on the analysis of the overall pollution contribution made by construction dust to the entire city, but the variations in the construction dust at the site are omitted [10,21,22,23,24]. Moreover, project construction is divided into several different construction stages, and the construction activities and site conditions of each stage differ significantly. The dust emission amount and intensity during different construction stages also vary. Some studies have emphasized the health hazards of construction dust to related employees as well as control measures [1,10,11,13,20,25,26]. In other studies, the meteorological factors and corresponding construction conditions at the location of the case have been ignored [27], the data collection points were limited, the field data coverage was incomplete or the data could not be collected in real-time [11,28].
Therefore, in this study, we chose a commercial-complex residential project located in a typical city in the Jianghan Plain of China to study the space–time distribution of dust diffusion under two construction conditions: normal construction and dust removal measures. Targeting earthwork construction, the research set up a plurality of dust concentration collection points inside and outside the workplace for real-time monitoring to record meteorological and construction data. First, Pearson’s correlation coefficient was used to analyze the degree of correlation between the dust generated by earthwork construction activities and the influencing factors. Then, based on an analysis of the changes in the dust concentration at each collection point during earthwork construction, the distribution of the dust concentration at the construction site and changes in the dust particle composition during the middle and late stages of the construction were explored in different states. On this basis, the background concentration value of the dust was used for comparison, and the increment of the dust concentration at the construction site as well as the retention of dust at the construction site after completion were discovered to have different states.

2. Methods

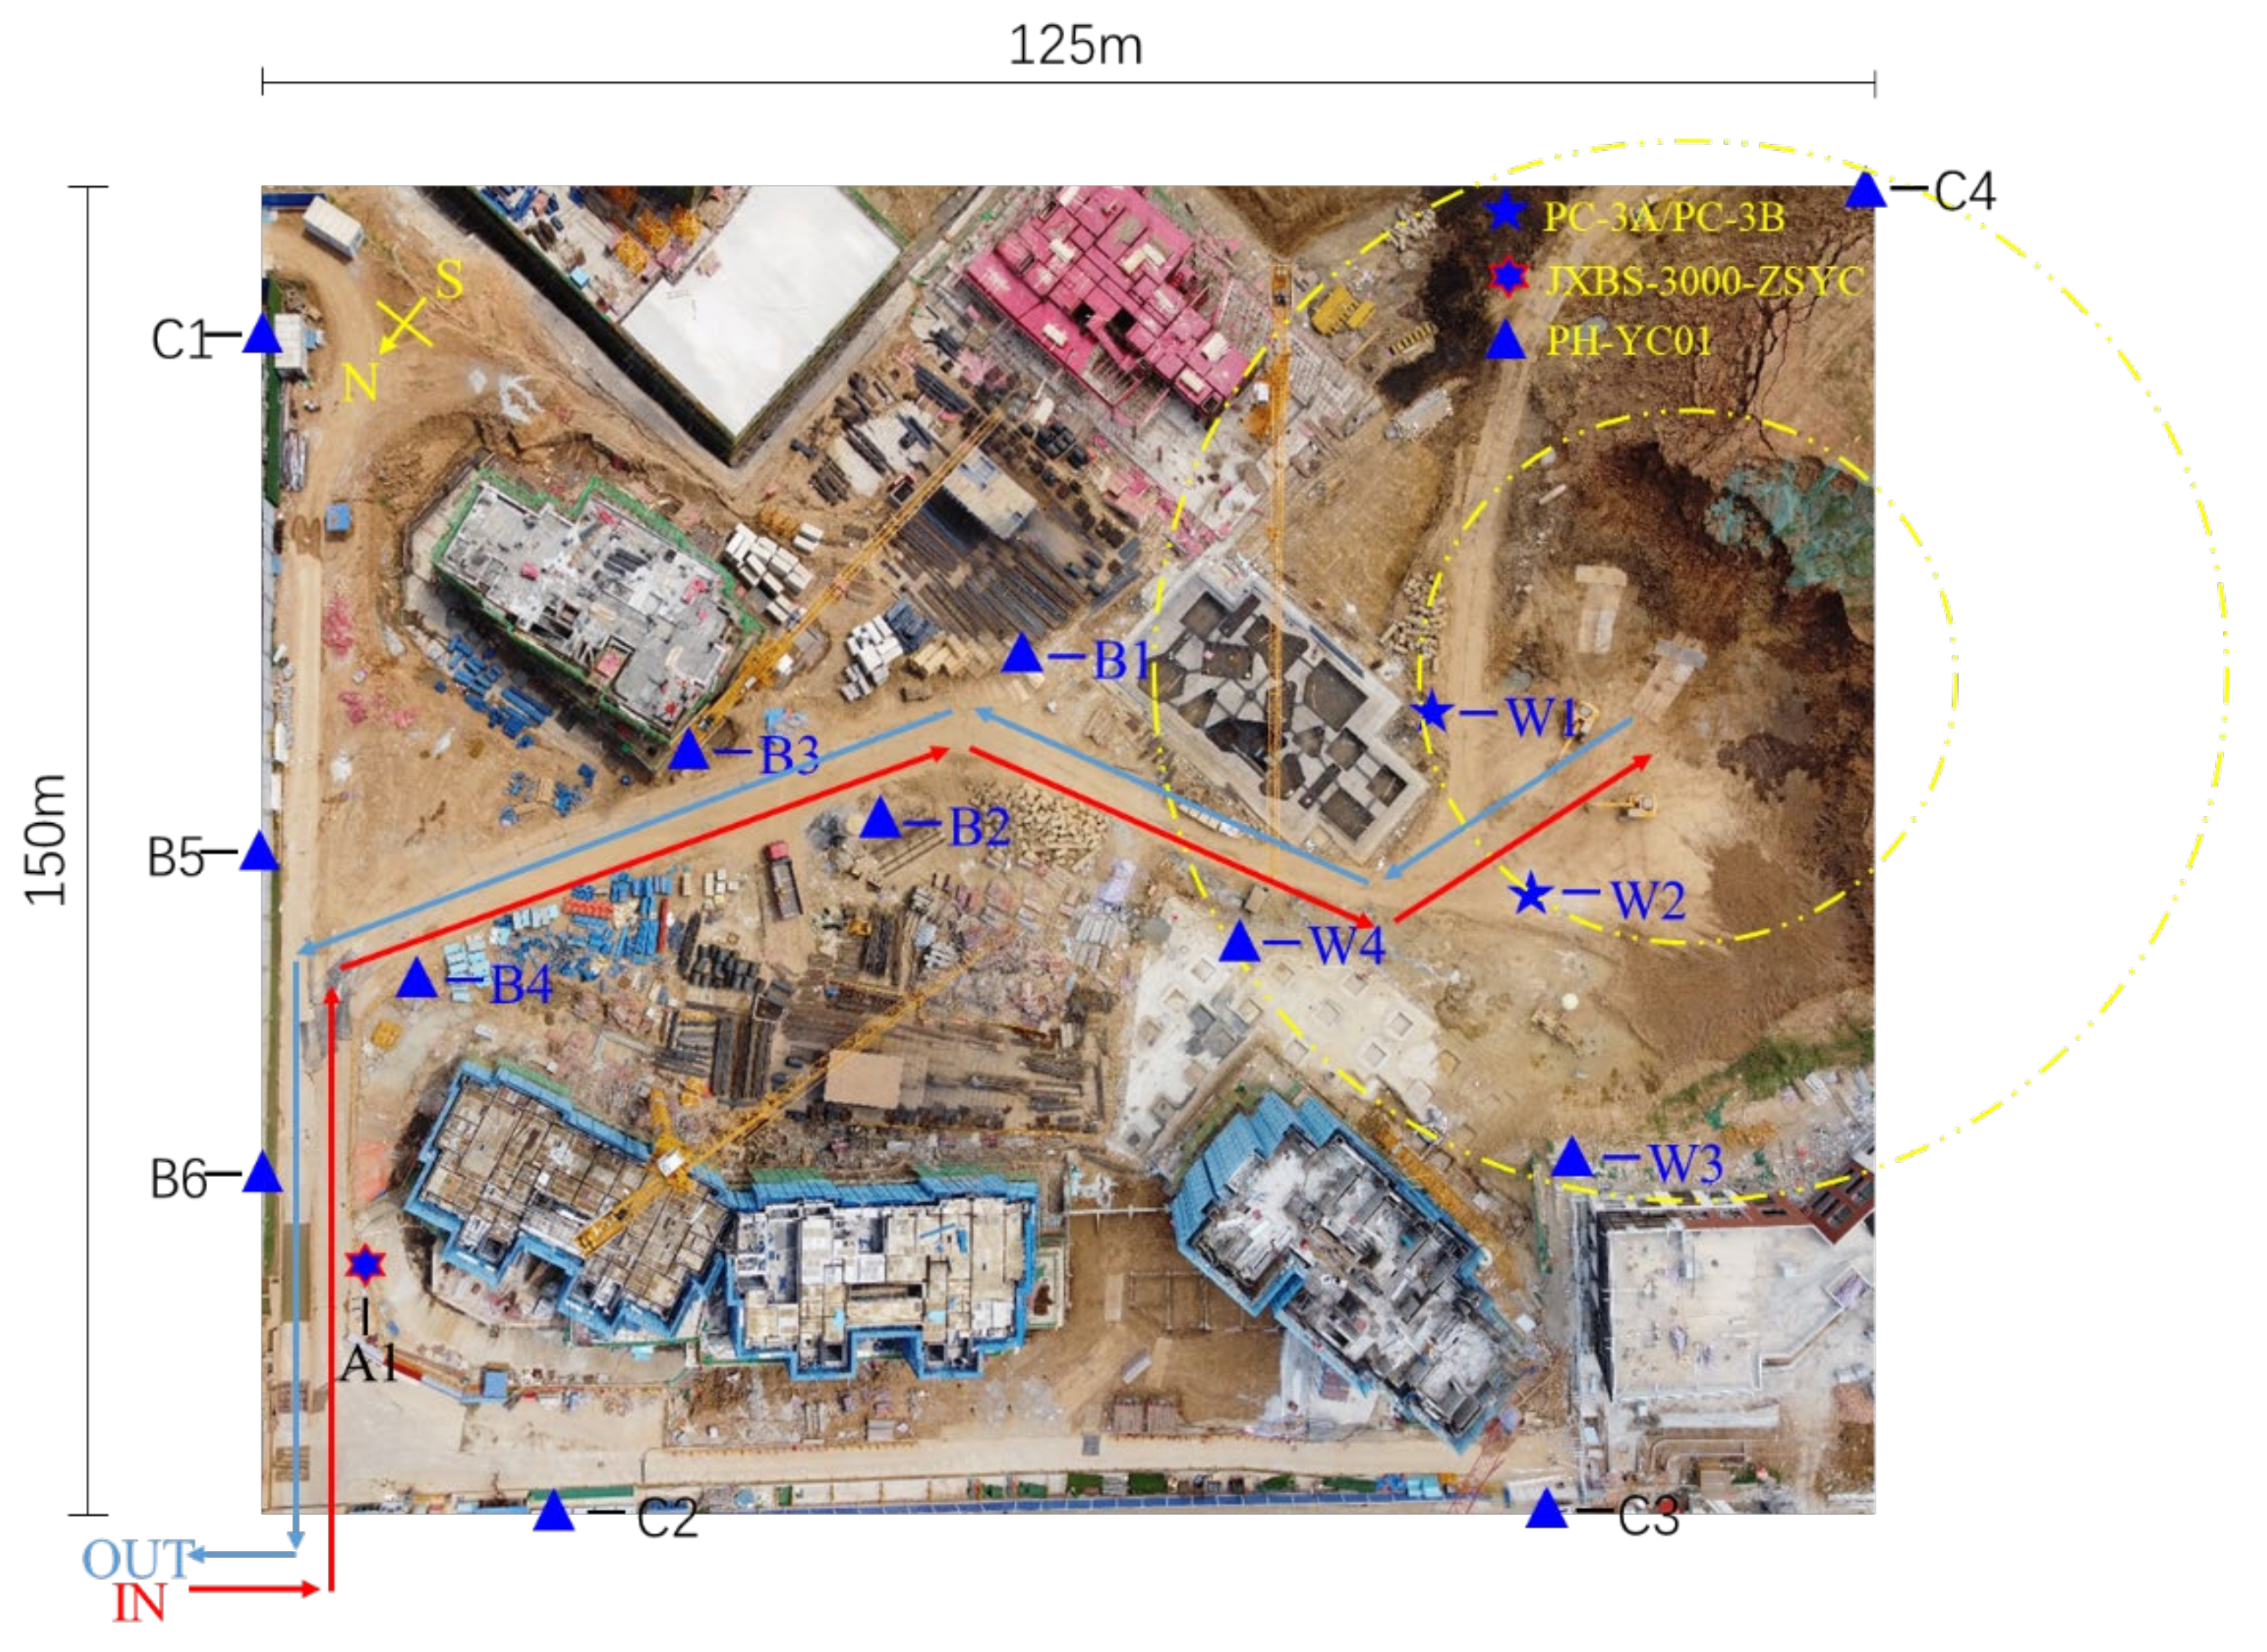
2.1. Monitoring Location

The actual on-site monitoring was carried out on a housing construction project in Wuhan, Hubei Province, China (Figure 1). The total construction area of the project is approximately 280,000 m2, consisting of 18 residential buildings, affiliated commercial buildings and basements. This site is a typical urban commercial-residential complex project. The Jianghan Plain, in which the project is located, is subject to a subtropical monsoon climate. The earth’s surface constituents are predominantly composed of modern river alluvium and lake silt, classified as fine sand, silt and clay.

2.2. Monitoring Equipment

2.2.1. Meteorological Observation

To study the influence of meteorological factors on the distribution characteristics of construction dust, it is necessary to measure these factors on the construction site accurately. In this study, a fixed meteorological dust monitor (JXBS-3000-ZSYC) was selected. The monitor can accurately record meteorological factors such as wind speed, air humidity, atmospheric pressure and temperature in real-time. In addition, it is equipped with a built-in data logger to store the real-time monitoring data of the meteorological factors and promote an analysis of the collected data. Because of the large volume of the fixed meteorological dust monitor, such monitors are supposed to occupy large spaces. As a result, the instalment of a fixed meteorological dust monitor near a construction site may cause some inconvenience to the construction workers. As shown in Figure 2, the overall area of the construction site accounts for 18,750 square meters, within which meteorological factors such as wind speed, air humidity, atmospheric pressure and temperature in real-time were the same, so the fixed meteorological monitor was placed at the exit of the construction site (A1), as shown in Figure 2. During the research, the meteorological data were recorded once every 3 min.

2.2.2. Particulate Matter Measurement

A dispersion-type dust monitoring station, PH-YC01, and the inhalable dust continuous tester, PC-3A and PC-3B were used to measure the concentration of particulate matter. The PH-YC01 dispersion-type dust monitoring station is manufactured by Wuhan Xinpuhui Technology Co., Ltd. Given the fact that such a dispersion-type dust monitoring station needs to be connected to a 220 V power supply, it had to be fixed at the monitoring point. Each dispersion-type dust monitoring station was connected to an environmental data collector, and the data were read by the collector. The inhalable dust continuous tester is a portable instrument used to continuously measure the mass and concentration of particulate matter, the manufacturer of which is Qingdao Loobo Jianye Environmental Protection Technology Co. Ltd. (Qingdao, China) Among the inhalable dust continuous testers, PC-3A was used to monitor the concentration of PM2.5, while PC-3B was used to monitor the concentration of TSP.
Both tools can continuously measure the mass and concentration of particulate matter. Inside the measuring cell, the particles in the sampled air were detected using the laser scattering method [29,30]. The interval ranged from 1 to 99 min; thus, the interval for the above dust monitoring stations was fixed at 1 min and the installation height of the particulate matter measurement sensor was 2.5 m.

2.3. Monitoring Plan

2.3.1. Particulate Matter Measurement

The study was conducted on 25–30 October 2020. The earthwork margin at the construction site was approximately 100,000 m3. The construction site is located in the central urban area; thus, the municipal regulations stipulated that earthwork could only be transported at night. Therefore, the study was primarily conducted between 19:00 on the first day and 04:00 on the second day. The specific start and end times are presented in Table 1. The project management personnel were notified approximately 30 min before the start of construction, and they turned on the equipment for monitoring and recorded the time as the monitoring start time. The construction start time was when the excavator began working, and the end of the construction was when the excavator was shut down. The monitoring ended approximately 30 min after the end of construction, namely the shutdown time of the first monitoring device. It should be noted that during this period, the construction of the main structure was completely stopped, and only earth excavation and transportation were carried out. Therefore, the influences of the construction of the main structure were excluded, and the monitoring data in this study could accurately reflect the influence of the earthwork construction on the dust distribution characteristics.

2.3.2. Monitoring Indicators

At present, detection indicators aimed at the concentration of dust in construction projects mainly include dust fall,   PM 2.5 , PM 10 and TSP [31,32]. The sampling frequency of dust fall is too low to accurately reflect the change in dust concentration in a short time [33]; therefore, this indicator was not selected for the study. In previous research, the correlation between PM 2.5 and PM 10 was very high [34,35], and the changing trend and the change range were almost the same; thus,   PM 2.5 and TSP were used in this study. The air humidity, temperature, atmospheric pressure and wind speed at the construction site were obtained using the meteorological monitor. In addition, the total numbers of excavators and earth shipments on that day were recorded.

2.3.3. Monitoring Points and Sampling Frequency

In this study, four types of monitoring points were considered. Here, the specific meanings of the four types of monitoring points and the significance of their selection are introduced in detail. W1, W2, W3 and W4 were Type 1 monitoring points, which were all located near the excavation site. Among them, W1 and W2 were approximately 25 m and W3 and W4 were approximately 50 m from the earthwork excavation site. There were no obstacles between the four points and the earthwork excavation site. B1, B2, B3, B4, B5 and B6 were Type 2 monitoring points, which were located on the transportation path of the truck. Of these, B1, B2, B3 and B4 were located near the unhardened pavement, and B5 and B6 were set on the hardened pavement. A car wash pool was located near B6, where the waste transport vehicle must be washed for mud removal before leaving the construction area. C1, C2, C3 and C4 were Type 3 monitoring points located at the four corner points of the construction site. O1 and O2 were Type 4 monitoring points. Point O1 was located at the entrance of the project department and along the path of the truck. Point O1 was located on the roadway outside the project; therefore, it is not shown in Figure 2. The O2 point was located near the residential area with a straight-line distance of 200 m from the project, and it was used as the background concentration value sampling point in the research.

2.4. Meteorological Observation and Working Conditions

Monitoring was carried out on five nights. Table 2 presents the working conditions of each day, and Table 3 presents the meteorological data of each day. In the following text, October 25 to October 26 is called the first day, October 26 to October 27 is called the second day, and so on; October 29 to October 30 is called the fifth day.
This study aims to present the real temporal and spatial changes in the dust concentration at the construction site caused by the earthwork construction, and the construction party did not take relevant dust prevention measures during monitoring three days before the monitoring. On the fourth and fifth days, sprinkling systems and ground sprinkling were adopted for dust control. Figure 3 is a schematic diagram of dust prevention measures at the construction site. The light blue colored blocks indicate the locations where the spray device was installed, while the blue dots show the area where the road was sprayed. In general, the spray de-vice was installed above the enclosure of the construction site to prevent the construction dust from spilling out. Due to the complexity of the construction site, it was impossible to fix the spray device in a certain place, so the dust removal treatment was carried out at the excavation site and the earthwork transport road by artificial water spraying.
According to the records, it rained on the construction site from 23:32 on the fifth day to 01:46 on the next day. According to the local regulations, the construction on the site was stopped when it rained. Therefore, the construction monitoring time on the fifth day was short, but relevant data after the rain were also collected. In the five days of earthwork construction, three excavators were working continuously at the construction site, but the total number of excavated waste trucks daily was different from the first day to the fifth day, at 161, 140, 183, 144 and 101, respectively.
As can be seen from the variation of the air humidity chart over time, the air humidity on the fifth day was almost always higher and rose as time went on. On the fifth day, the precipitous drop of the humidity occurred because the rain stopped. The construction site is located in the Jianghan Plain near the Yangtze River, and the overall humidity was at a relatively high level during the study period. Regarding the graph of temperature change over time, the temperature reduced over the five days as time progressed, and the temperature of the third day was the highest. It should be noted that the graph of wind speed change with time shows only the wind speed on the third and fourth days, because the wind speed on the first, second and fifth days was low, and the wind speed measured by the instrument in the above days was 0.

3. Results and Discussion

3.1. Analysis of Main Influencing Factors of Dust Emission from Earthwork

The Pearson correlation coefficient in the SPSS statistical analysis software was used to analyze the degree of correlation between the dust generated from earthwork construction activities and the related influencing factors, and then whether the relevant factors were the main influential factors of dust emissions during earthwork construction activities was determined [34]. Using a meteorological monitor, weather data such as the wind speed, temperature, humidity and atmospheric pressure at each construction site were obtained. The number of excavators on-site and the total number of soil shipments every day were recorded manually.
To compare the influence of various factors on dust emissions before and after the earthwork construction, data without dust prevention measures in the first three days were selected for analysis. The dust concentration values of the data collection points in the first three days were averaged as a whole, and the monitoring data were divided into three parts: before construction, during construction and after construction. The data were averaged over time at all times before and after construction. The data generated during construction were averaged every 0.5 h. Finally, 44 sets of data were obtained for the correlation analysis. It should be noted that if a shorter period were selected for averaging, the difference in the changes in various indicators would be too small, and the calculation results would be almost the same if more computing resources were used. If a longer period were selected, the changes in the indicators could not be accurately mastered. Since the wind speed was 0 in the first two days of the monitoring period, only 15 groups remained after the data processing of the third day. There were too few data samples, so wind speed and dust concentration were not analyzed in the correlation analysis. Relevant literature has proved that the two are closely related [11,34].
As shown in Table 4, the significance level between the average concentration of PM 2.5 , TSP and each meteorological factor was greater than 0.01, failing to pass the significance test, and the correlation coefficient was less than 0.3, indicating that the dust emissions during earthwork construction were not significantly correlated with any single meteorological factor in Table 3. This result is also in line with those of previous studies [28,36]. The average concentrations of PM 2.5 and TSP were significantly positively correlated with the number of soil shipments, with a correlation coefficient of 0.814 and a significance level of less than 0.01, passing the significance test [2,28,36]. Obviously, the more soil shipments per unit time, the higher the average dust concentration at the construction site.

3.2. Increase in Dust Concentration Caused by Excavation and Transportation

Based on the high-density data collection, this study accurately quantified the dust concentration at the construction site. Based on striking a balance between the representativeness and accuracy of the data, the difference was used as the discriminant index to select the measured data to confirm the true situation of the data source.
As shown in Figure 4, as construction activities continued, the values of each monitoring point increased to different degrees. For the background concentration value, the value of the sampling point was relatively stable, while the values of other points fluctuated greatly. The numerical ranges of the different points varied considerably. For example, the concentrations of PM 2.5 and TSP at W1 near the earthwork excavation site were higher than the concentration at C2, which was located at the corner of the construction site.
Based on the above diagram, only the numerical order of each point could be determined. To further reveal the underlying causes, the concentration data of PM 2.5 and TSP during the start and end periods of the construction activities were processed to obtain the average concentration and medians at each point during the construction activities. In Table 4, each collection point corresponds to the three average concentrations. From left to right, the data represent the average concentration on the first, second and third days during construction, and the median index can be deduced similarly.
According to the data in Table 5, the following information can be obtained. During construction, the average concentration of dust at all the sampling points was greater than the background concentration, and all the positions of the construction site were affected to varying degrees. The order of the degree of influence (from large to small) was Type 1, Type 2 and Type 3. Furthermore, as the earthwork construction activities continued, the concentration values varied greatly across the construction site, and the data values of one or two collection points could not be used to characterize the dust concentration value of the entire construction site. If the scope of the construction site is substantial, it is necessary to analyze data from multiple collection points to characterize the concentration value of the construction site. For similar studies in the future, it is recommended to select more than four characteristic points and one background concentration value point for the research.
Earthwork operations are mainly carried out using large machinery. The increase in the dust concentration is attributed to the waste transporting and loading behaviors of the excavators, the exhaust generated by the excavator and waste trucks during use, the dust emissions formed when the vehicles pass dust-covered surfaces and the secondary dust caused by the wind. These four types of behaviors occur continuously near the first type of points, so its average and median values are both at the highest level. The numerical comparison of the sampling points can also reflect the significant variations in the dust pollution in different areas at the construction site. By comparing the data from Table 5, the following analysis can be carried out. According to the comparison results of W1, W2, W3 and W4, for W1 and W2, the concentration values of PM 2.5 and TSP were relatively close and those for W3 and W4 were relatively close, but because the two points W3 and W4 were relatively far away from the excavation site, the PM 2.5 and TSP concentrations were lower than those of W1 and W2, indicating that the closer the point was to the earth excavation site, the higher the dust concentration value.
With regard to the second type of point, the increase in dust concentration was mainly attributed to the emissions of dust formed when the vehicles passed the dust-covered surface. The closer this was to the excavation site, the higher the concentrations of PM 2.5 and TSP of the sampling point. The distance between the excavation site and point B4 in the diagram was more than 100 m, indicating that the impact scope of dust dispersion caused by earthwork excavation was greater than 100 m. According to the comparison results of the dust concentration values of the sampling points on hardened and non-hardened pavements, the hardened pavement had a significant effect on dust suppression. The formation of road dust is caused by vehicles rolling over the dust on the road and dispersing it into the air. Regardless of whether the road is hardened or not, there will be a large amount of dust on the surface during earthwork, but the mass concentration of the dust on the hardened road will be lower than that on the unhardened pavement.
The third type of point was located at the four corners of the construction site. Because point C4 was close to the excavation site, its dust concentration value was relatively high. However, because C4 was behind a small hillside, the dust was stopped by the intermediate obstacle. The concentration of C4 was much smaller than that of W3 and W4. The other three points were also affected by on-site construction and truck transportation, and the dust concentration value was greater than the background concentration value. Point O1 was located on the path of the waste transport vehicle outside the construction site. However, because a car washing pool is set at the entrance of the construction site, the dust on the surface of the vehicle needs to be washed off before the vehicle leaves the construction site, so the dust concentration is relatively low. In addition, the results also indicate that the car wash pool can prevent the waste truck from taking pollutants out of the construction site.

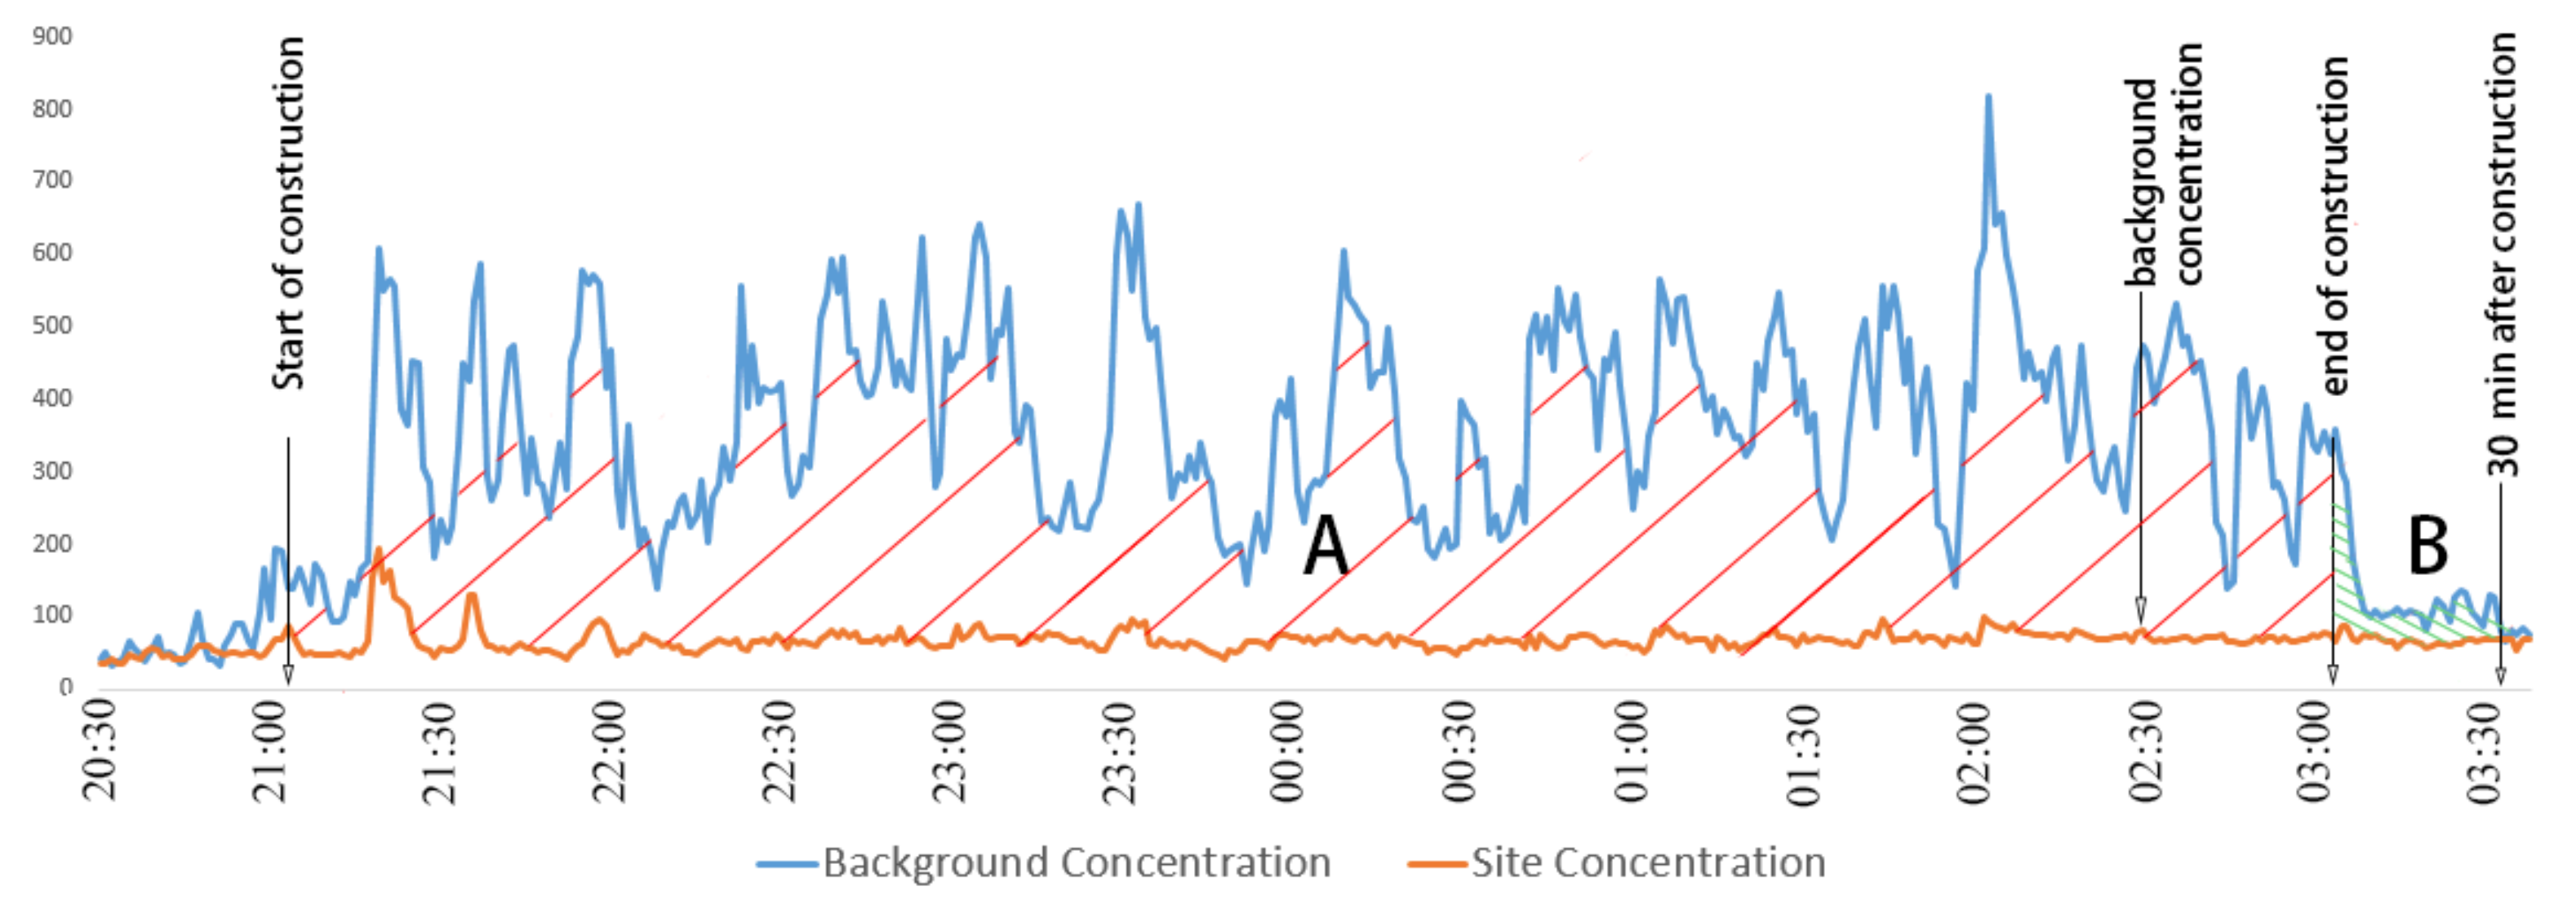
3.3. Time for Dust Concentration to Reach Steady State

Construction sites have widely adopted measures using enclosure spraying or fog cannons to reduce dust. There is no scientific basis for the start-up time of spraying or fog gun machines, and they are often operated continuously. This mode will cause a significant waste of water resources. According to the observation of the former data, the increase in dust concentration during the construction process will reach a stable state after a period of time. In this state, the concentration value of the collection point will be close to the average concentration value of the collection point throughout the construction. Therefore, it is necessary to accurately predict the time at which the dust concentration reaches a stable state in order to organize dust reduction measures at the construction site and save water resources, which is helpful for the intelligent control of the construction process. Therefore, it is necessary to study these characteristic times. Direct observations of the change in the curve value per minute are insufficient to determine these factors, and detailed changes in dust concentrations could not be reflected by averaging the concentration value over a long period of time. In this study, the collected data were averaged every 10 min and sorted based on the time sequence. It is assumed that when Equations (1) and (2) are satisfied simultaneously, the dust concentration at the sampling point is deemed to have reached a steady state.
Avg T i > Min Med ,   Avg × 80 %
Avg T i + 1 > Min Med ,   Avg × 80 %
where T i denotes the average value of the dust concentration for 10 min in a certain period, T i + 1 represents the average value of the dust concentration for 10 min in the next period, Med represents the median of the dust concentration throughout the construction, and Avg represents the average value of the dust concentration throughout the construction. It should be noted that in most cases, the value of the dust concentration fluctuates greatly, and the median can better reflect the state of the dust concentration than the average.
Table 6 shows the time interval required for the first and second collection points to reach a stable state. As shown in the table, the time for the concentration of the two pollutants PM 2.5 and TSP to reach the steady-state level is inconsistent, and the time required for the concentration of PM 2.5 to reach the steady-state level is earlier than that of the TSP. This is because the TSP emissions are greater than that of PM 2.5 during the construction operation, so it takes a considerable amount of time to reach a higher concentration value. According to the time required for the above pollutants to reach a stable state, the construction organization could turn on the enclosure spray or fog gun machine for dust suppression for 5 to 15 min after the earth excavation and start of transportation, as recommended. The key dust reduction area of the fog gun machine is near the earth excavation site and on the transportation path of the truck.
As shown by the comparison of the values on the first, second and third days, it takes longer for the pollutant concentration to reach the pollution state during the first two days than on the third day. As measured by the meteorological observation instruments, the wind speed during the construction operation during the first two days was 0, and the windy state remained during the construction operation on the third day. It can be inferred that the wind accelerated the dispersion of pollutants, causing the concentration of pollutants to reach a pollution state level earlier.
As shown by the comparison of the first and second types of collection points, the time for the dust concentration of the first type of collection points to reach the pollution state level was shorter than that of the second type of collection points. The reason for this phenomenon was consistent with the reason why the average dust concentration of the first type of collection points was higher, which will not be repeated here. It takes a long time for the TSP concentration at the second type of points to reach the pollution level. Because of their large weight, TSP particles cannot float in the air for a long time and drift over substantial distances. This dispersion requires the movement of large construction equipment at the construction site, which can increase the regional TSP concentration in other areas.

3.4. Dust Removal Rate of Construction Site under the Action of Dust Prevention Measures

To more intuitively understand the dust removal effect caused by dust control measures, the dust concentration data of the first three days without dust control measures were compared with the dust concentration data of the next two days with measures taken. The dust removal rate of each monitoring point can be calculated according to formulas (3) and (4):
R xPM 2.5 = Avg x 1 PM 2.5 + x 2 PM 2.5 + x 3 PM 2.5 Avg x 4 PM 2.5 + x 5 PM 2.5 Avg x 1 PM 2.5 + x 2 PM 2.5 + x 3 PM 2.5
R xTSP = Avg x 1 TSP + x 2 TSP + x 3 TSP Avg x 4 TSP + x 5 TSP Avg x 1 TSP + x 2 TSP + x 3 TSP
where R x P M 2.5 and R x T S P are, respectively, the P M 2.5 and TSP dust removal rate of monitoring point x . x 1 PM 2.5 and x 1 TSP are the average dust concentrations of P M 2.5 and TSP at monitoring point x during the construction of the first day, respectively.
Table 7 gives the average dust concentration in the construction stage two days after each collection point and gives the dust removal rate at each monitoring point according to Formulas 3 and 4. O1 and O2 were outside the construction site, hence this paper did not calculate the values for those points.
Comparing the dust removal rates of TSP and PM 2.5 in Table 7. Overall, the dust removal efficiency of TSP was slightly higher than that of PM 2.5 , indicating that manual water sprinkling and dust removal by spraying had a greater inhibitory effect on large particles. Points B1~B4 in the second type of monitoring points and the first type of monitoring points were mainly influenced by the dust removal by manual sprinkling, indicating that the manual sprinkling measures had a positive effect on dust reduction. Of the above points, the dust removal efficiency of Type 1 monitoring points was slightly higher than that of B1~B4, but the overall value was close to that of B1~B4. The PM 2.5 dust removal efficiency was 23.7–42.3%, and the TSP dust removal efficiency was 35.7–47.2%. B5 and B6 were close to the spray device and were located on the hardened road treated by sprinkler measures. Therefore, the dust removal efficiency of B5 and B6 was at the highest level in the collection point. The dust removal efficiency of PM 2.5 and TSP could both reach about 50%. Although C2 and C3 were close to the spraying device, they were not greatly affected due to being at a certain distance from the earth excavation site and the earth transportation road. Therefore, the dust removal efficiency was lower than the monitoring points located on the earth excavation site and the earth transportation road. C1 and C4 were located at the far east and south of the construction site. Various dust removal measures were located far from these points, but they still had a certain dust removal efficiency, indicating that dust control measures not only had an impact on the monitoring points near the measures taken but also could inhibit dust travel to a certain extent. In summary, artificial sprinkling or spraying for dust removal showed a good dust removal effect in the earthwork excavation site and earthwork transportation road, the dust removal efficiency for TSP was higher than PM 2.5 , and the dust removal efficiency was greater than 30%. However, the dust removal efficiency was relatively low in positions where the dust itself was not greatly affected. The use of dust prevention measures could effectively prevent the jump and migration of dust.

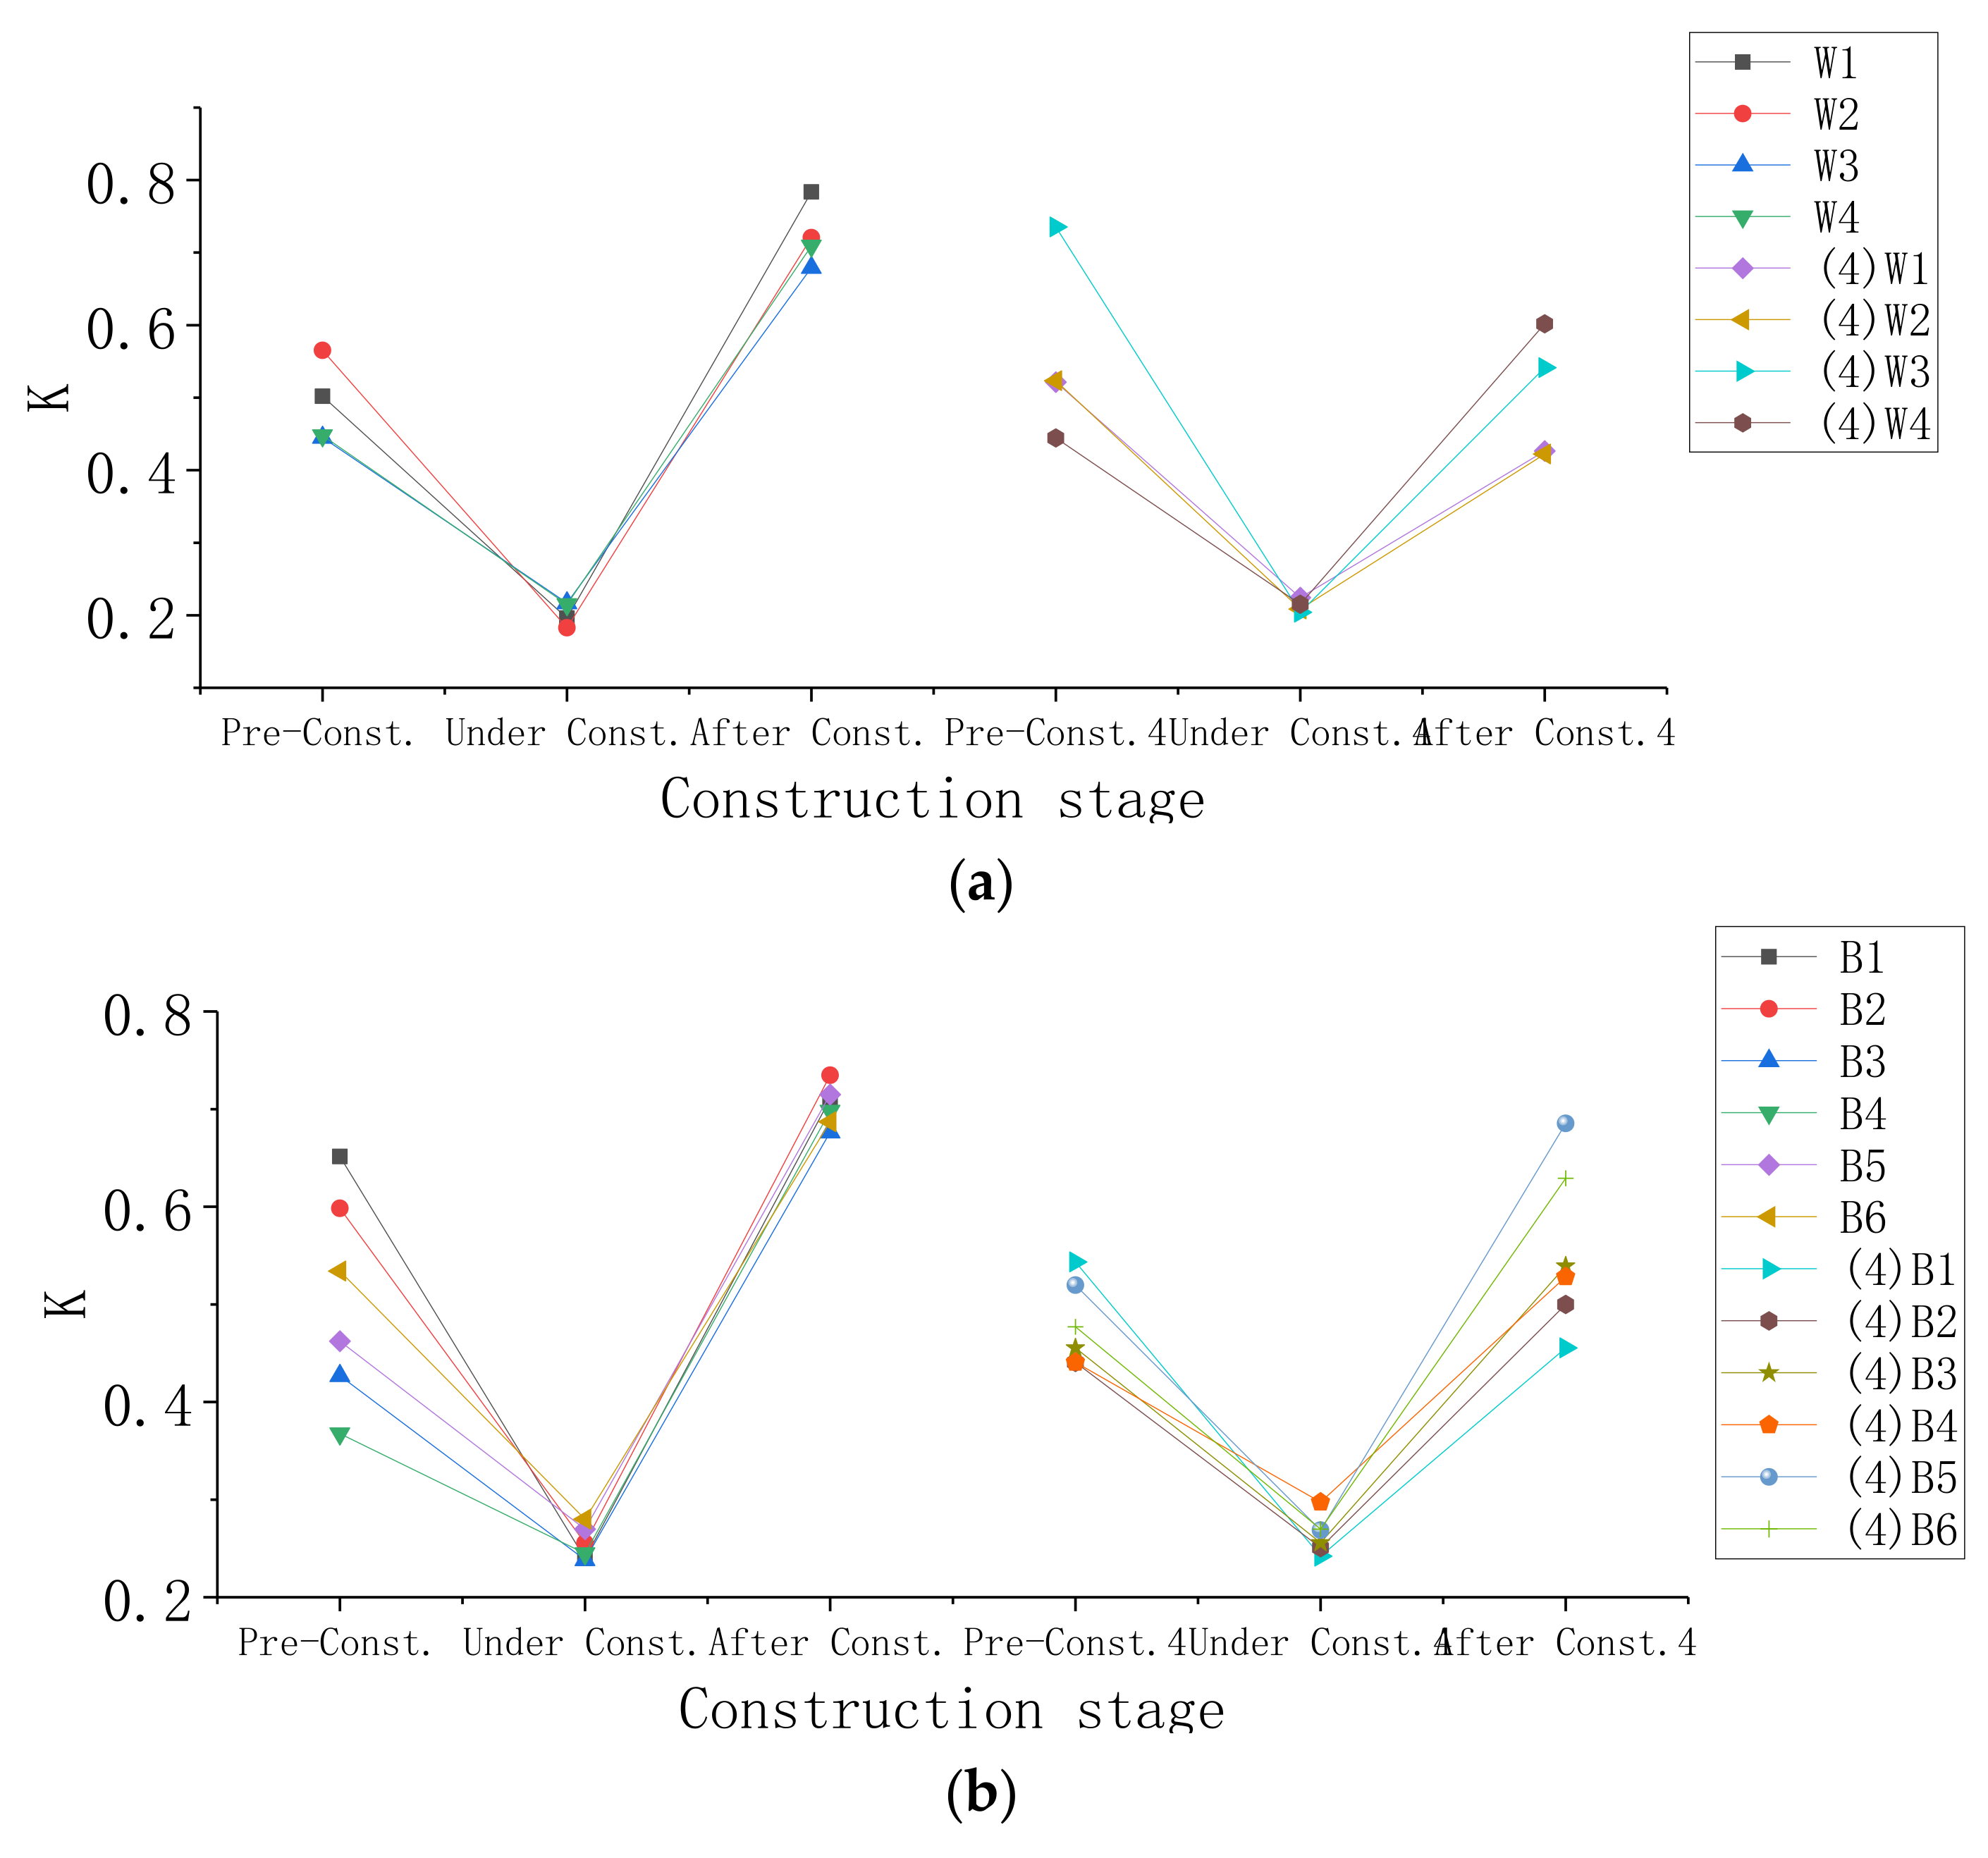
3.5. Changes in the Composition of Dust

To more intuitively understand the changes in the composition of the particulate matter caused by the construction, the data from the entire monitoring period were divided into three parts: before construction (A), during construction (B), and after construction (C). Equations (5) and (6) were used to process the data:
K 1 A = C 1 A a v e P M 2.5 C 1 A a v e T S P
K A = K 1 A + K 2 A + K 3 A 3
where C 1 A a v g P M 2.5 is the average value of all the PM 2.5 concentration values before construction and C 1 A a v e T S P is the average value of all the TSP concentration values before construction. K 1 A indicates the percentage of PM 2.5 in the TSP before the first day of construction. K A indicates the proportion of PM 2.5 in the TSP in all monitoring data before construction. In the same way, according to the above rules, the proportions of PM 2.5 in the TSP, K B   and   K C during and after construction can be obtained. Notably, because the construction operation will affect the dust concentration index for a period of time after the construction is completed, during the calculation of K C , the last 10 min average value of the monitoring data was used. It should be mentioned here that dust control measures were adopted on the fourth day. To compare the impact of dust fall on the change of dust composition, the data of the fourth day were calculated separately in this paper. In the case of sudden rain on the fifth day, the data on the fifth day would not be calculated. The data were processed in the above manner, and the K value broken line graph was used to show the change rule of each sampling point.
The following key information can be obtained by analyzing Figure 5:
(1)
Except for monitoring point O1, the K value of all sampling points tended to first decrease and then increase. This result indicates that in the non-construction stage, PM 2.5 accounted for a higher proportion of the TSP concentration, and the main pollution source was fine particles ( PM 2.5 ), with fewer coarse particles ( PM 2.5 100 ). However, coarse particles ( PM 2.5 100 ) increased sharply and were significant pollution sources due to the impacts of the construction operations. Therefore, in dust fall research, it is necessary to study the coarse and fine particles separately and determine the dust reduction measures for particles of different sizes. In earthwork construction, the dust reduction method of coarse particles is mainly taken into account;
(2)
Before construction, the K value of each sampling point in the construction site differed significantly, varying between 0.35 and 0.6. Although other areas in the site were in a shutdown stage before sampling, the construction operations during the day still had a significant impact on those at night. The K value of each sampling point was less than the K value of the O2 point, indicating that construction operations during the day led to an increase in the concentration of coarse particles;
(3)
During the construction, the K value of the first type of sampling point varied between 0.18 and 0.22, and the K value of the second type of sampling point varied between 0.24 and 0.28. This suggests that the closer the location to the excavation site, the higher the proportion of coarse particles in the pollutants. The weight of coarse particles was larger than that of fine particles, and they could not be suspended in the air for a long time [36]; the closer the point was to the place where the disturbance was greater, the higher the proportion of coarse particles. The K values of the third and fourth types of sampling points varied between 0.21 and 0.66. Because point C4 was located near the earth excavation site, the K value was small. The values at all other points decreased but remained different. As for points C1 and O1, C1 was located at the easternmost side of the construction site, avoiding the path of the waste truck, and was the farthest point from the excavation point relative to other sampling points and is the least affected. The K value of point O1 during the construction phase further illustrates the necessity of setting up a car wash pool;
(4)
After construction, the K values of all the sampling points increased. The K value range of the first type point was 0.68–0.78. The K value range of the second type point was 0.68–0.73. This indicates that the coarse particles settled at places that were significantly affected by construction operations. However, their K value was higher than those of the third and fourth sampling points (0.59–0.71), because the fine particles were still suspended in the air due to the impact of construction;
(5)
By comparing the variation rule of dust composition after the use of dust control measures, the following noteworthy points were found. First, during the construction stage, the K value of the site sampling points did not change significantly, indicating that the sprinkler system and the artificial road sprinkler made no significant difference regarding the influence on the coarse and fine particles during the construction stage. However, after the completion of construction, the K values of the sampling points of Type 1 and 2 were smaller than those without dust removal measures. This phenomenon indicated that after the construction, the use of dust removal measures would make the proportion of TSP in the dust lower; that is, after the construction, the coarse particles in the air would be relatively reduced. After the use of dust removal measures, coarse particles were more likely to be captured by water fog, which could achieve particle sedimentation or inhibit the migration of particles.

3.6. Increment of Dust Concentration on Construction Site

Based on the collected data, Equations (7)–(10) were used to calculate the dust concentration increments at the sampling point, the relative increments of the dust concentration at the sampling point, the average concentration increments of dust at the construction sites and the relative increments of the average dust concentrations at the construction sites. In this study, the above formula was used to analyze the emissions of dust from construction quantitatively. The increments in the dust concentration at the sampling point indicate the absolute value of that value caused by earthwork construction, and the relative increase in dust concentration at the sampling point indicates the percentage of the concentration increment caused by construction. In addition, the increment in the average concentration of dust at the construction site and the relative increment in the average concentration of the dust at the construction site were used to indicate an increase in the absolute value and percentage of the dust concentration generated by the earthwork construction for the entire construction site. It should be noted that because the construction operation will affect the concentration value for a period of time after the construction is stopped, the dust concentration at each sampling point is the average value of the dust concentration from the beginning of the construction until 30 min after stopping the construction.
Dust   concentration   increment   at   sampling   point = Avg dust   concentration   value   at   each   sampling   point background   concentration   value
Relative   increment   of   dust   concentration   at   sampling   point = dust   concentration   increment   at   sampling   point background   concentration   value × 100 %
Average   concentration   increment   of   dust   at   constrution   site = increment   of   dust   concentration   at   sampling   points number   of   sampling   points   × number   of   monitoring   days
Relative   increment   of   average   dust   concentration   at   construction   site = relative   increment   of   dust   concentration   at   sampling   points number   of   sampling   points   × number   of   monitoring   days
Figure 6 more intuitively shows the increase in the concentration of particulate matter caused by the construction operations at each sampling point. According to Equations (7) and (8), the   average concentration increment of PM 2.5 is 55.06 μ g / m 3 at the construction site, and the average TSP concentration increment is 375.17   μ g / m 3 , respectively, without taking any dust control measures. According to Formula (9) and (10), the average relative increment of the PM 2.5 concentration is 0.99 at the construction site, and the average relative increment in TSP concentration is 4.25. This means that in the earthwork construction phase, the concentration of PM 2.5 almost doubled compared with the shutdown period, and the TSP concentration increased by 4.25 times. PM 2.5 / TSP = 0.147, indicating that approximately 14.7% of the particles in the dust emissions during earthwork construction had a particle size of less than 2.5   μ m . These particles will remain suspended in the air for a long time when there is no precipitation [35]. After being inhaled, these particles can cause harm to humans [37]. In general, the content of particles with large diameters in earthwork construction dust is relatively large, and the content of particles with small diameters is relatively small. This conclusion has also been mentioned in similar studies [38]. The average concentration increment of PM 2.5 was 32   μ g / m 3 and that of TSP was 224.67 μ g / m 3 when the dust-proof measures of a spray system and artificial water sprinkling were adopted. Compared with situations without dust control measures, the pollutant value was greatly reduced. At this time, the average relative increment of the PM 2.5 concentration in the construction site was 0.64, and the average relative increment of TSP concentration was 2.88. According to the above values, the PM 2.5 concentration increment and TSP concentration increment were reduced by 72.01% and 40.16%, respectively.
According to the classification of environmental air function zones in the Chinese Ambient Air Quality Standards (GB3095-2012) [39], the first-class areas include nature reserves, scenic spots and other areas in need of special protection; the second-class areas are business, traffic, and resident mixed districts, cultural districts, industrial districts and rural areas. The construction site monitored in this work belongs to the second-class area of the ambient air function zone, so it is subjected to the second-level concentration limit. The daily average concentration limit of TSP is 300 μ g / m 3 , and the daily average concentration limit of PM 2.5 is 75   μ g / m 3 . According to the monitoring results, during the earthwork construction, if no means were used to suppress the generation and diffusion of dust, the sum of the background concentration value and the increment of the average concentration of dust in the construction site would be far higher than the concentration limit. The concentration level of dust particles could be greatly reduced by using a spray system and artificial sprinkling. Therefore, in this stage, the construction organization should take proper protective measures, and the staff at the construction site should take safety precautions to avoid bodily harm caused by dust pollution.

3.7. Remaining Rate of Dust in Construction Site

Due to local government regulations, most earthworks are completed at night. From the end of construction on the first day to the beginning of other projects on the second day, a sufficient time interval was reserved during this period. In this study, the data collected 30 min after the construction stopped at each collection point were monitored to calculate the retention rate of the dust. This parameter could be used to measure the residual amount of dust in the workplace after the construction stops. Project managers can thus more clearly determine the degree of dust retention at the site after the completion of the construction, which can promote construction organization and arrangement. The retention rate of the dust at the construction site refers to the ratio of the increment of the dust concentration generated by the construction activities to the dust concentration value caused by the construction activity remaining in the construction site after the construction activities have stopped for 30 min. The area under the concentration curve was used (Figure 7), and the retention rate was calculated as follows:
Retention   fraction =   B A   +   B × 100 %
According to the data shown in Table 8, 0.82~3.76% of PM 2.5 and 0.81~1.9% of the TSP generated by the construction operations at the construction site would remain 0.5 h after the completion of the construction. The coarse particles produced during construction settle faster than the fine particles, and thus the fine particles will have a higher retention fraction. According to the comparison results of the data from the second and third days, the dust retention rate is higher under static wind conditions. Under the influence of wind, although the construction site is more likely to reach a polluted state, it is also easier to reduce the retention fraction of the dust at the construction site. According to the calculation results, the retention rates of PM 2.5 and TSP on the fourth and fifth days were relatively large because the denominator in Equation (11) was greatly reduced after the adoption of relevant dust prevention measures. By comparing the data of the fourth and fifth days, it could be seen that due to the occurrence of rain, the value of the retention fraction decreased, and the residual amount of particulate pollutants in the construction site decreased to a certain extent.

4. Conclusions and Recommendations

4.1. Conclusions

This paper presents the results of a study on dust dispersion during the earthwork construction of a typical urban commercial-residential complex project in Jianghan Plain, China. The concentration values of PM 2.5 and TSP in each area of the construction site were taken as the research objects. The study provided estimates of the critical parameters related to dust dispersion during earthwork construction. These parameters could be used to reveal the distribution and changes in the dust at construction sites during earthwork construction. At the same time, the positive effect of dust control measures on pollutant concentration reduction was also presented. This study can be used as a reference for related earthwork monitoring in other areas of the Jianghan Plain. The following conclusions were drawn from this study:
(1)
The aforementioned dust emissions were related to the average concentrations of PM 2.5 and TSP. The correlation coefficient with the number of unearthed trips was 0.814, and the significance level was less than 0.01, which showed a strong positive correlation;
(2)
During the earthwork construction stage, all parts of the construction site were affected, and there were obvious differences. The data of one or two collection points could not be used to characterize the dust concentration value of the entire construction site. The earth excavation area was the most affected, and the impact scope of the dust dispersion caused by it was greater than 100 m, followed by the impact on the transportation path of the truck. The closer the point was to the earth excavation site, the higher the dust concentration;
(3)
The dust removal efficiency was more than 30% when artificial sprinkling or spraying was used in the earth excavation site and the earth transport road, and the dust removal efficiency of TSP was higher than PM 2.5 . Where the two measures were used at the same time, the dust removal efficiency of PM 2.5 and TSP could reach about 50%;
(4)
The time required for the concentration of the two pollutants PM 2.5 and TSP—to reach the steady-state level was inconsistent. The time for the PM 2.5 concentration to reach the steady-state level was earlier than that of the TSP. The closer to the earthwork excavation, the shorter the time to reach the steady level. In the non-construction stage, PM 2.5 accounted for a higher proportion of the TSP particle concentration. Under the influence of earthwork construction, coarse particles occupy a dominant position as a pollution source. The closer to the excavation site, the higher the proportion of coarse particles in the pollutants. The use of dust control measures did not change the proportion of pollutants in the construction process, but after the completion of construction, the coarse particles in the air of the construction site were relatively reduced;
(5)
The average concentration increment of PM 2.5 at the construction site caused by earthwork construction was 55.06   μ g / m 3 , and the average concentration increment of TSP was 375.17   μ g / m 3 . The sum of the background concentration value and the average incremental dust concentration at the construction site was much higher than the concentration limit. The average concentration increment of PM 2.5 was 32 μ g / m 3 and that of TSP was 224.67   μ g / m 3 when the dust-proof measures of the spray system and artificial water sprinkling were adopted. Due to the use of dust control measures, the PM 2.5 concentration increment and TSP concentration increment were reduced by 72.01% and 40.16%, respectively. With or without dust control measures, the ratio of the concentration of particles with different diameters was close to the following: TSP: PM 2.5 = 1:0.147;
(6)
Half an hour after the completion of construction, 0.82–3.76% of PM 2.5 and 0.81–1.9% of TSP remained at the construction site because of earthwork construction operations. The coarse particles generated during construction work settle faster than fine particles. Under static wind conditions, the dust retention rate is higher. Under the influence of wind, although the construction site was more likely to reach a steady state, the retention rate of dust at the construction site could be reduced more easily. Rainwater would reduce the number of particulate pollutants in the construction site.

4.2. Recommendations

The research results presented in this paper were based on the earthwork construction of a typical urban commercial-residential complex project located in the Jianghan Plain. The results generated from the selection of different construction sites from those used in this study might be slightly different. Therefore, it is necessary to conduct a long-term study on earthwork construction in more engineering cases to better understand dust dispersion in workplaces during earthwork construction.
Based on the conclusions drawn in this paper, our research may enable construction practitioners to create much more targeted countermeasures for different construction activities based on their dust emission and to resolve the concerns raised by dust exposure on a macro scale. The specific dust prevention measures implemented could include the deployment of a dust sensor network. The collated information could be stored in a repository in order to create much more targeted control measures for construction activities. Furthermore, this approach may be able to expeditiously solve the unpredictable civil complaints of residents who live near construction sites through the effective management of and reduction in construction pollutants.

Author Contributions

Conceptualization, J.H., L.H. and Q.L.; project administration, J.H.; formal analysis, Q.L.; validation, Y.L., F.Z. and X.X.; investigation, Q.L., Y.L., F.Z. and X.X. writing—original draft preparation, Q.L. All authors have read and agreed to the published version of the manuscript.

Funding

This research was funded by the National Key Research and Development Plan of the 13th Five-Year Plan (Grant No.2016YFC0702105).

Institutional Review Board Statement

Not applicable.

Informed Consent Statement

Not applicable.

Data Availability Statement

The data presented in this study are available on request from the corresponding author. The data are not publicly available due to data are applied to follow-up studies.

Acknowledgments

The instruments used in this study were provided by the Key Laboratory of New Technology for Construction of Cities in the mountain area (Chongqing University).

Conflicts of Interest

The authors declare no conflict of interest. We wish to confirm that we do not have any commercial or associative interest that represents a conflict of interest in connection with the work submitted. We confirm that we have given due consideration to the protection of intellectual property associated with this research and that there are no impediments to publication with respect to intellectual property.

References

  1. Li, C.Z.; Zhao, Y.Y.; Xu, X.X. Investigation of dust exposure and control practices in the construction industry: Implications for cleaner production. J. Clean Prod. 2019, 227, 810–824. [Google Scholar] [CrossRef]
  2. Gautam, S.; Patra, A.K.; Prusty, B.K. Opencast mines: A subject to major concern for human health. Int. J. Geol. Min. 2012, 2, 25–31. [Google Scholar]
  3. Finkelman, R.B.; Orem, W.; Castranova, V.; Tatu, C.A.; Belkin, H.E.; Zheng, B.S.; Lerch, H.E.; Maharaj, S.V.; Bates, A.L. Health impacts of coal and coal use: Possible solutions. Int. J. Coal Geol. 2002, 50, 425–443. [Google Scholar] [CrossRef]
  4. Kanaoka, C.; Furuuchi, M.; Inaba, J.; Ohmata, K.; Myojo, T. Flow and dust concentration near working face of a tunnel under construction. J. Aerosol Sci. 2000, 31, 31–32. [Google Scholar] [CrossRef]
  5. Sun, Z.; Su, Z. Study on dust diffusion regularity in tunnel slag process. Ind. Saf. Environ. Prot. 2017, 43, 100–103. [Google Scholar]
  6. Bakke, B.; Stewart, P.; Eduard, W. Determinants of Dust Exposure in Tunnel Construction Work. Appl. Occup. Environ. Hyg. 2002, 17, 783–796. [Google Scholar] [CrossRef]
  7. Galea, K.S.; Mair, C.; Alexander, C.; de Vocht, F.; van Tongeren, M. Occupational Exposure to Respirable Dust, Respirable Crystalline Silica and Diesel Engine Exhaust Emissions in the London Tunnelling Environment. Ann. Occup. Hyg. 2016, 60, 263–269. [Google Scholar] [CrossRef]
  8. Liu, J.; He, N.; Wen, W.Y.; Liu, J. Water Jet Vacuum Dust Suppression Device Used to Tunnel Development. Adv. Mater. Res. 2012, 594–597, 1188–1192. [Google Scholar] [CrossRef]
  9. Xu, Y.; Yang, D.H.; Zhang, Y.W. Tunnel Construction Dust Monitoring and Dust Control Technology of High Altitude and High and Cold Area. Appl. Mech. Mater. 2014, 578–589, 703–708. [Google Scholar] [CrossRef]
  10. Li, X.; Su, S.; Huang, T. Health damage assessment model for construction dust. J. Tsinghua Univ. (Sci. Technol.) 2015, 055, 50–55. [Google Scholar]
  11. Huang, T. The Monitoring and Analysis of the Health Damage Caused by Fugitive Dust in the Building Construction Phase. Master’s Thesis, Tsinghua University, Beijing, China, 2013. [Google Scholar]
  12. Chen, X.F.; Guo, C.; Song, J.X.; Wang, X.; Cheng, J.H. Occupational health risk assessment based on actual dust exposure in a tunnel construction adopting roadheader in Chongqing, China. Build Environ. 2019, 165, 106415. [Google Scholar] [CrossRef]
  13. Wu, Z.Z.; Zhang, X.L.; Wu, M. Mitigating construction dust pollution: State of the art and the way forward. J. Clean Prod. 2016, 112, 1658–1666. [Google Scholar] [CrossRef]
  14. Gangolells, M.; Casals, M.; Gasso, S.; Forcada, N.; Roca, X.; Fuertes, A. A methodology for predicting the severity of environmental impacts related to the construction process of residential buildings. Build Environ. 2009, 44, 558–571. [Google Scholar] [CrossRef] [Green Version]
  15. Zhu, W.N.; Feng, W.; Li, X.D.; Zhang, Z.H. Analysis of the embodied carbon dioxide in the building sector: A case of China. J. Clean Prod. 2020, 269, 122438. [Google Scholar] [CrossRef]
  16. Programme, T.U.N.D. Urban Air Pollution Control in China; Science and Technology of China Press: Beijing, China, 2001. [Google Scholar]
  17. Liu, J.G.; Diamond, J. Science and government—Revolutionizing China’s environmental protection. Science 2008, 319, 37–38. [Google Scholar] [CrossRef] [PubMed]
  18. Chan, C.K.; Yao, X. Air pollution in mega cities in China. Atmos. Environ. 2008, 42, 1–42. [Google Scholar] [CrossRef]
  19. Wen, L. Numerical Simulation of the Spatial Migration Rule of Fugitive Dusts at Urban Building Construction Sites. Master’s Thesis, Lanzhou University, Lanzhou, China, 2011. [Google Scholar]
  20. Xie, Z. Research on Formation, Diffusion and Controlling of Construction Dust; Chongqing University: Chongqing, China, 2018. [Google Scholar]
  21. Huang, T.; Li, X.; Su, S.; Liu, S. Monitoring and Analysis of Dust Pollution during Earthwork Construction. J. Saf. Environ. 2014, 14, 317–320. [Google Scholar]
  22. Zhang, X.L.; Shen, L.Y.; Zhang, L. Life cycle assessment of the air emissions during building construction process: A case study in Hong Kong. Renew. Sustain. Energy Rev. 2013, 17, 160–169. [Google Scholar] [CrossRef]
  23. Zhao, X.; Cheng, S.; Tian, G.; Li, G.; Wang, H. Construction Fugitive Dust Pollution and Control in Beijing. J. Beijing Univ. Technol. 2007, 10, 1086–1090. [Google Scholar]
  24. Zhang, Z.; Wu, F. Evaluation of health damage caused by construction dust pollution. J. Tsinghua Univ. (Sci. Technol.) 2008, 6, 922–925. [Google Scholar]
  25. Nlj, E.T.; Hilhorst, S.; Spee, T.; Spierings, J.; Steffens, F.; Lumens, M.; Heederik, D. Dust control measures in the construction industry. Ann. Occup. Hyg. 2003, 47, 211–218. [Google Scholar]
  26. Fan, S.C.; Wong, Y.W.; Shen, L.Y.; Lu, W.S.; Wang, T.; Yu, A.; Shen, Q.P. The effectiveness of DustBubbles on dust control in the process of concrete drilling. Saf. Sci. 2012, 50, 1284–1289. [Google Scholar] [CrossRef] [Green Version]
  27. Shou-bin, F.; Gang, T.; Gang, L.; Yu-hu, H.; Jian-ping, Q.; Shui-yuan, C. Road fugitive dust emission characteristics in Beijing during Olympics Game 2008 in Beijing, China. Atmos. Environ. 2009, 43, 6003–6010. [Google Scholar] [CrossRef]
  28. Gautam, S.; Prusty, B.K.; Patra, A.K. Dispersion of respirable particles from the workplace in opencast iron ore mines. Environ. Technol. Innov. 2015, 3, 11–27. [Google Scholar] [CrossRef]
  29. Li, J.Y.; Li, H.R.; Ma, Y.H.; Wang, Y.; Abokifa, A.A.; Lu, C.Y.; Biswas, P. Spatiotemporal distribution of indoor particulate matter concentration with a low-cost sensor network. Build. Environ. 2018, 127, 138–147. [Google Scholar] [CrossRef]
  30. Cheriyan, D.; Choi, J.H. Estimation of particulate matter exposure to construction workers using low-cost dust sensors. Sustain. Cities Soc. 2020, 59, 102197. [Google Scholar] [CrossRef]
  31. Zhao, P.; Feng, Y.; Jin, J.; Han, B.; Zhu, T.; Zhang, X. Characteristics and control indicators of fugitive dust from building construction sites. Acta. Sci. Circumstantiae 2009, 29, 1618–1623. [Google Scholar]
  32. Lee, C.H.; Tang, L.W.; Chang, C.T. Modeling of fugitive dust emission for construction sand and gravel processing plant. Environ. Sci. Technol. 2001, 35, 2073–2077. [Google Scholar] [CrossRef]
  33. China, Ministry of Ecology and Environment of People’s Republic of China. Ambient Air--Determination of Dustfall--Gravimetric Method; Ministry of Ecology and Environment of People’s Republic of China: Beijing, China, 1994.
  34. Hong, J.; Kang, H.; Jung, S.; Sung, S.; Hong, T.; Park, H.S.; Lee, D.E. An empirical analysis of environmental pollutants on building construction sites for determining the real-time monitoring indices. Build. Environ. 2020, 170, 106636. [Google Scholar] [CrossRef]
  35. Cheriyan, D.; Hyun, K.Y.; Jaegoo, H.; Choi, J.H. Assessing the distributional characteristics of PM10, PM2.5, and PM1 exposure profile produced and propagated from a construction activity. J. Clean Prod. 2020, 276, 124335. [Google Scholar] [CrossRef]
  36. Ding, G. Study on the Emission Characteristics and Modeling of Building Construction Dust; South China University of Technology: Guangzhou, China, 2020. [Google Scholar]
  37. Cohen, A.J.; Anderson, H.R.; Ostro, B.; Pandey, K.D.; Krzyzanowski, M.; Kunzli, N.; Gutschmidt, K.; Pope, A.; Romieu, I.; Samet, J.M.; et al. The global burden of disease due to outdoor air pollution. J. Toxicol. Env. Health A 2005, 68, 1301–1307. [Google Scholar] [CrossRef] [PubMed]
  38. Yan, H.; Ding, G.L.; Li, H.Y.; Wang, Y.S.; Zhang, L.; Shen, Q.P.; Feng, K.L. Field Evaluation of the Dust Impacts from Construction Sites on Surrounding Areas: A City Case Study in China. Sustainability 2019, 11, 1906. [Google Scholar] [CrossRef] [Green Version]
  39. China, Ministry of Ecology and Environment of People’s Republic of China. Air Quality Standard of China; China, Ministry of Ecology and Environment of People’s Republic of China: Beijing, China, 2012.
Figure 1. The geographic location of the project.
Sustainability 13 08451 g001
Figure 2. Schematic diagram of sampling points.
Sustainability 13 08451 g002
Figure 3. Schematic diagram of dust prevention measures.
Sustainability 13 08451 g003
Figure 4. Concentration change diagram on 25 October at characteristic points in the monitoring interval.
Sustainability 13 08451 g004
Figure 5. K value diagram of each sampling point: (a) K value change diagram for the first type of sampling point; (b) K value change diagram for the second type of sampling point; (c) K value change diagram for the third and fourth types of sampling points.
Sustainability 13 08451 g005aSustainability 13 08451 g005b
Figure 6. Increment and relative increment of dust concentration at each sampling point.
Sustainability 13 08451 g006
Figure 7. Schematic diagram of the concentration curve.
Sustainability 13 08451 g007
Table 1. Research time interval table.
Date Monitoring Interval Construction Section Monitoring Time (min) Construction Time (min)
Start time 1 25 October 20:3025 October 21:05428369
End time 1 26 October 03:3826 October 03:04
Start time 2 26 October 19:3026 October 20:05435365
End time 2 27 October 02:4527 October 02:14
Start time 3 27 October 20:0027 October 20:40461390
End time 3 28 October 03:4128 October 03:10
Start time 4 28 October 20:3028 October 20:50403353
End time 4 29 October 03:1329 October 02:43
Start time 5 29 October 19:0029 October 19:33499244
End time 5 30 October 03:1929 October 23:37
Table 2. Actual working condition.
TimeDay 1Day 2Day 3Day 4Day 5
Number of excavators33333
Total number of soil shipments161140183144101
Prevention and control measures×××
WeatherSunnySunnySunnySunnyRain
Table 3. Weather condition.
Air
Humidity
Sustainability 13 08451 i001
Temperature Sustainability 13 08451 i002
Wind
Velocity
Sustainability 13 08451 i003
Table 4. Correlation analysis of the dust concentration in earthwork construction and potential factors.
TemperatureHumidityAtmospheric PressureNumber of Soil Shipments
P M 2.5 Pearson correlation−0.1930.2380.1850.814 **
Sig. (two-tailed)0.2100.1200.2300.000
Number of cases44444444
TSP Pearson correlation−0.2020.2110.0750.843 **
Sig. (two-tailed)0.1880.1690.6300.000
Number of cases44444444
** The correlation is significant at the level of 0.01 (two-tailed).
Table 5. Average and median dust concentration during construction for three days at each collection point.
Sites Average   Concentration   during   Construction   ( μ g   m 3 ) Median Concentration
during   Construction   ( μ g   m 3 )
P M 2.5 TSP P M 2.5 TSP
W1 173881172871
W2 168924170862
W3 152701150653
W4 149691148653
B1 135567136564
B2 138543135514
B3 126530126498
B4 130529128515
B5 121450121439
B6 114408114397
C1 6411765113
C2 8922091208
C3 8626087241
C4 9243492404
O1 6014060134
O2 62926291
Table 6. Time for the concentration values of the first and second types of collection points to reach a steady state.
Site25–26 October 26–27 October 27–28 October
Time Required to Reach Construction Pollution State
PM2.5 (min)TSP (min)PM2.5 (min)TSP (min)PM2.5 (min)TSP (min)
W1 15–2515–255–1525–350–1010–20
W2 15–2515–255–1515–2510–2010–20
W3 5–155–1525–3525–3510–2010–20
W4 5–155–1515–2525–3510–2010–20
B1 25–3535–4515–2535–450–1010–20
B2 25–3545–5515–2535–4510–2010–20
B3 15–2525–3525–3535–4510–2020–30
B4 25–3525–3515–2545–5510–2010–20
B5 25–3515–255–1545–5510–2020–30
B6 25–3515–255–1545–5520–3020–30
Table 7. Average dust concentration in the second two days of construction at each collection point and overall dust removal efficiency.
Sites Average   Concentration   during   Construction   ( μ g   m 3 ) Dust Removal Efficiency (%)
P M 2.5 TSP P M 2.5 TSP
W1 11147934.844.3
W2 10345837.947.2
W3 8740642.340.5
W4 8940539.539.7
B1 8735535.535.7
B2 8934035.135.8
B3 8832229.637.6
B4 9833123.735.8
B5 6121149.652
B6 5820249.449.5
C1 6011372.3
C2 6017333.321.3
C3 6516924.734.3
C4 843278.223.5
O1 72150--
O2 5081--
Table 8. Calculation of retention fraction.
DateRetention Fraction
P M 2.5 TSP
25–26 October 0.03390.0158
26–27 October 0.02150.0107
27–28 October 0.00820.0081
28–29 October 0.03760.019
29–30 October 0.0310.0154
Publisher’s Note: MDPI stays neutral with regard to jurisdictional claims in published maps and institutional affiliations.

