Article

Techno-Economic Assessment of Battery Electric Trains and Recharging Infrastructure Alternatives Integrating Adjacent Renewable Energy Sources

1
German Aerospace Center (DLR), Institute of Vehicle Concepts, 70569 Stuttgart, Germany
2
Institute of Electric Power Systems, Otto von Guericke University, 39106 Magdeburg, Germany
*
Author to whom correspondence should be addressed.
Sustainability 2021, 13(15), 8234; https://doi.org/10.3390/su13158234
Submission received: 31 May 2021 / Revised: 6 July 2021 / Accepted: 14 July 2021 / Published: 23 July 2021

Abstract

:
Battery electric multiple units (BEMU) are an effective path towards a decarbonized regional rail transport on partly electrified rail lines. As a means of sector coupling, the BEMU recharging energy demand provided through overhead line islands can be covered from decentralized renewable energy sources (RES). Thus, fully carbon-free electricity for rail transport purposes can be obtained. In this study, we analyze cost reduction potentials of efficient recharging infrastructure positioning and the feasibility of covering BEMU energy demand by direct-use of locally produced renewable electricity. Therefore, we set up a model-based approach which assesses relevant lifecycle costs (LCC) of different trackside electrification alternatives comparing energy supply from local RES and grid consumption. The model-based approach is applied to the example of a German regional rail line. In the case of an overhead line island, the direct-use of electricity from adjacent wind power plants with on-site battery storage results in relevant LCC of EUR 173.4 M/30a, while grid consumption results in EUR 176.2 M/30a whereas full electrification results in EUR 224.5 M/30a. Depending on site-specific factors such as existing electrification and line lengths, BEMU operation and partial overhead line extension can lead to significant cost reductions of recharging infrastructure as compared to full electrification.

1. Introduction

1.1. Background

Aiming for the decarbonization of the transport sector, the substitution of diesel-powered vehicles by zero-tailpipe alternatives is broadly discussed. Within the public transport sector, the deployment of battery-powered electric bus and train systems plays an important role to increase energy efficiency and to abate emissions.
About 54% of the German rail network is not electrified [1]. In 2017, regional rail transport in Germany accounted for 680.5 million train-km, of which about 36% had been operated with trains in diesel traction (diesel multiple units—DMU). In current public tenders for transport contracts in German regional rail transport, more than 305.1 million train-km are to be allocated to tenderers for both battery electric multiple units (BEMU) and fuel-cell electric multiple units (FCEMU), till 2038 [1] (p. 158). Aiming for locally emission-free operation, the future regional rail traffic capacity yields a cumulated demand of 1768 to 2560 trains with zero-tail-pipe drivetrains till 2038 in Germany [1] (p. 164).
According to the German Federal Ministry of Transport and Digital Infrastructure (BMVI) [2], the electrification of the German rail network will be increased to 70% in a mid-term time horizon. Due to high capital expenditures (CAPEX) of overhead line (OHL) equipment, economic feasibility of full electrification is usually only yielded at train service frequencies of one or more trainsets per hour (for 2-car multiple units) [3]. On those non- or partly electrified tracks, the substitution of trains equipped with internal combustion engines by multiple units with locally emission-free drivetrains, such as BEMU and FCEMU, offer a cost-effective alternative against full lineside electrification [1,4]. Both drivetrain-technologies are interlinked to an appropriate energy infrastructure providing the charging electricity from OHL or hydrogen from refueling stations.
The technical feasibility and assessment of lifecycle costs (LCC) of regional train transport with zero-tailpipe drivetrain multiple units is subject to several feasibility studies, especially in German research [4,5,6,7]. The results show a strong dependency on the rail line and network characteristics, such as grid topology, length of line, electrified sections and schedule.
The replacement with BEMU on railway-lines with non-electrified section-lengths of less than 40 km (one-way) and an electrified start- or end-station may not necessarily require further recharging infrastructure in every case. Railway manufacturers claim catenary-free autonomies of BEMU trains in the range of 60 to 100 km [1,4] while this parameter also varies depending on the rail-line and schedule characteristics.

1.2. Positioning of Recharging Infrastructure and Sector Coupling with Adjacent RES

The balancing of electrification extensions against the size of battery is subject to model-based analysis, as being discussed by Royston et al., 2019 [8] at the example regional rail route in the United Kingdom. Battery storage capacities of the BEMU and charging infrastructure have to be designed according to well-defined operational worst-case conditions (e.g., winter, delays, track interruptions, end-of-life conditions) in order to also secure transport-operation at difficult—while not exceptional—operational conditions. The vehicle energy demand of traction, HVAC (heating, ventilation and air conditioning), secondary auxiliaries and the additional energy demand caused by external disturbances and incidents have to be covered by an appropriate battery management system [7]. The energy demand characteristic of BEMU at charging substations results in predictable punctual high loads on the electricity grids, especially when substations are connected to the public electricity grid at medium voltage.
The energy demand of BEMU, recharged at newly constructed charging stations or short electrified island sections, can be covered by local RES especially in rural areas. The coupling of BEMU recharging facilities and local RES requires the use of a stationary storage to synchronize the fluctuating energy supply characteristics and the punctual energy demand of BEMU. Integrating RES for direct electricity use, the storage system has to meet the requirements of both high power and high capacity. Hence, chemical power-to-gas storage systems are less likely to be considered [9].
In the field of scheduled public transport, regional trains and buses show similar operation conditions in terms of fixed routes and dwell times, resulting in predictable energy demands at charging spots. The combination of recharging infrastructure and batteries of railway multiple units need a reliable energy supply to maintain a stable operation even under demanding conditions, as discussed in studies concerning bus-networks [10,11,12]. An efficient layout of the charging infrastructure and an appropriate dimensioning of battery capacity is crucial to minimize the total cost of ownership according to Kunith (2016) [10]. Kunith (2016) [10] and Rogge (2015) [11] present approaches for positioning of charging stations in bus networks using model-based analyses. Vilppo (2015) [12] conducted dimensioning of the traction battery according to peak-load requirements. Rogge (2015) [11] discussed the impact on the electricity grid based on the load profiles of a selected charging station and a combined load profile of the entire network.

1.3. Research Objectives and Approach

Little attention in academic literature has been put to model-based analysis investigating layout and positioning of recharging infrastructure for BEMU. The impact of charging infrastructure positioning and specification on the relevant LCC has not been discussed in detail. While hydrogen costs for FCEMU refueling with hydrogen from onsite electrolysis based on electricity produced from local wind power plants (WPP) have been analyzed in Herwartz (2020) [5], the feasibility and cost assessment of BEMU recharging with electricity produced from local RES has not yet been investigated.
This study aims to evaluate the cost reduction potentials of efficient positioning of BEMU recharging infrastructure on non or partly electrified railway lines of the German regional rail passenger transport which are currently operated by DMU. Further, we assess the sector coupling potential of BEMU recharging infrastructure and adjacent RES.
First, we classify way-side electrification alternatives and discuss energy supply options for BEMU-operation including the direct-use of renewable electricity produced by local RES. Second, we present a model-based approach that incorporates (1) the dimensioning of the charging infrastructure (OHL length, capacity of substation), and (2) the relevant LCC comprising capital expenses (CAPEX) and operational expenses (OPEX) of charging infrastructure and multiple units.
Different trackside electrification alternatives are defined based on simulation-based energy trajectory of a multiple unit and according to the rail-line and schedule-related specific requirements of the BEMU operation. The required additional trackside electrification is subject to model-based dimensioning of the recharging infrastructure including OHL and substation. Evaluating the sector-coupling potential, we compare BEMU energy supply covered from local RES to supply from public grid. Substations include an additional battery storage system if the main energy demand is covered by local RES. The focus of the presented study is put to WPP (wind power plants), since on-shore wind energy has the highest share in annual electricity production, in Germany, accounting for 18.7% of the gross electricity consumption in 2020 [13].
The LCC model compares differential costs of the analyzed energy supply schemes. The model includes the CAPEX and OPEX of recharging infrastructure (substation, OHL, battery storage) and multiple units. Additionally, energy costs are calculated by associated price patterns for energy supply from electricity grid and from local WPP.
The developed model-based approach is then applied to regional transport line “RB26” in Brandenburg, Germany, comparing different electrification and energy supply alternatives.

2. Railway Energy Supply Alternatives

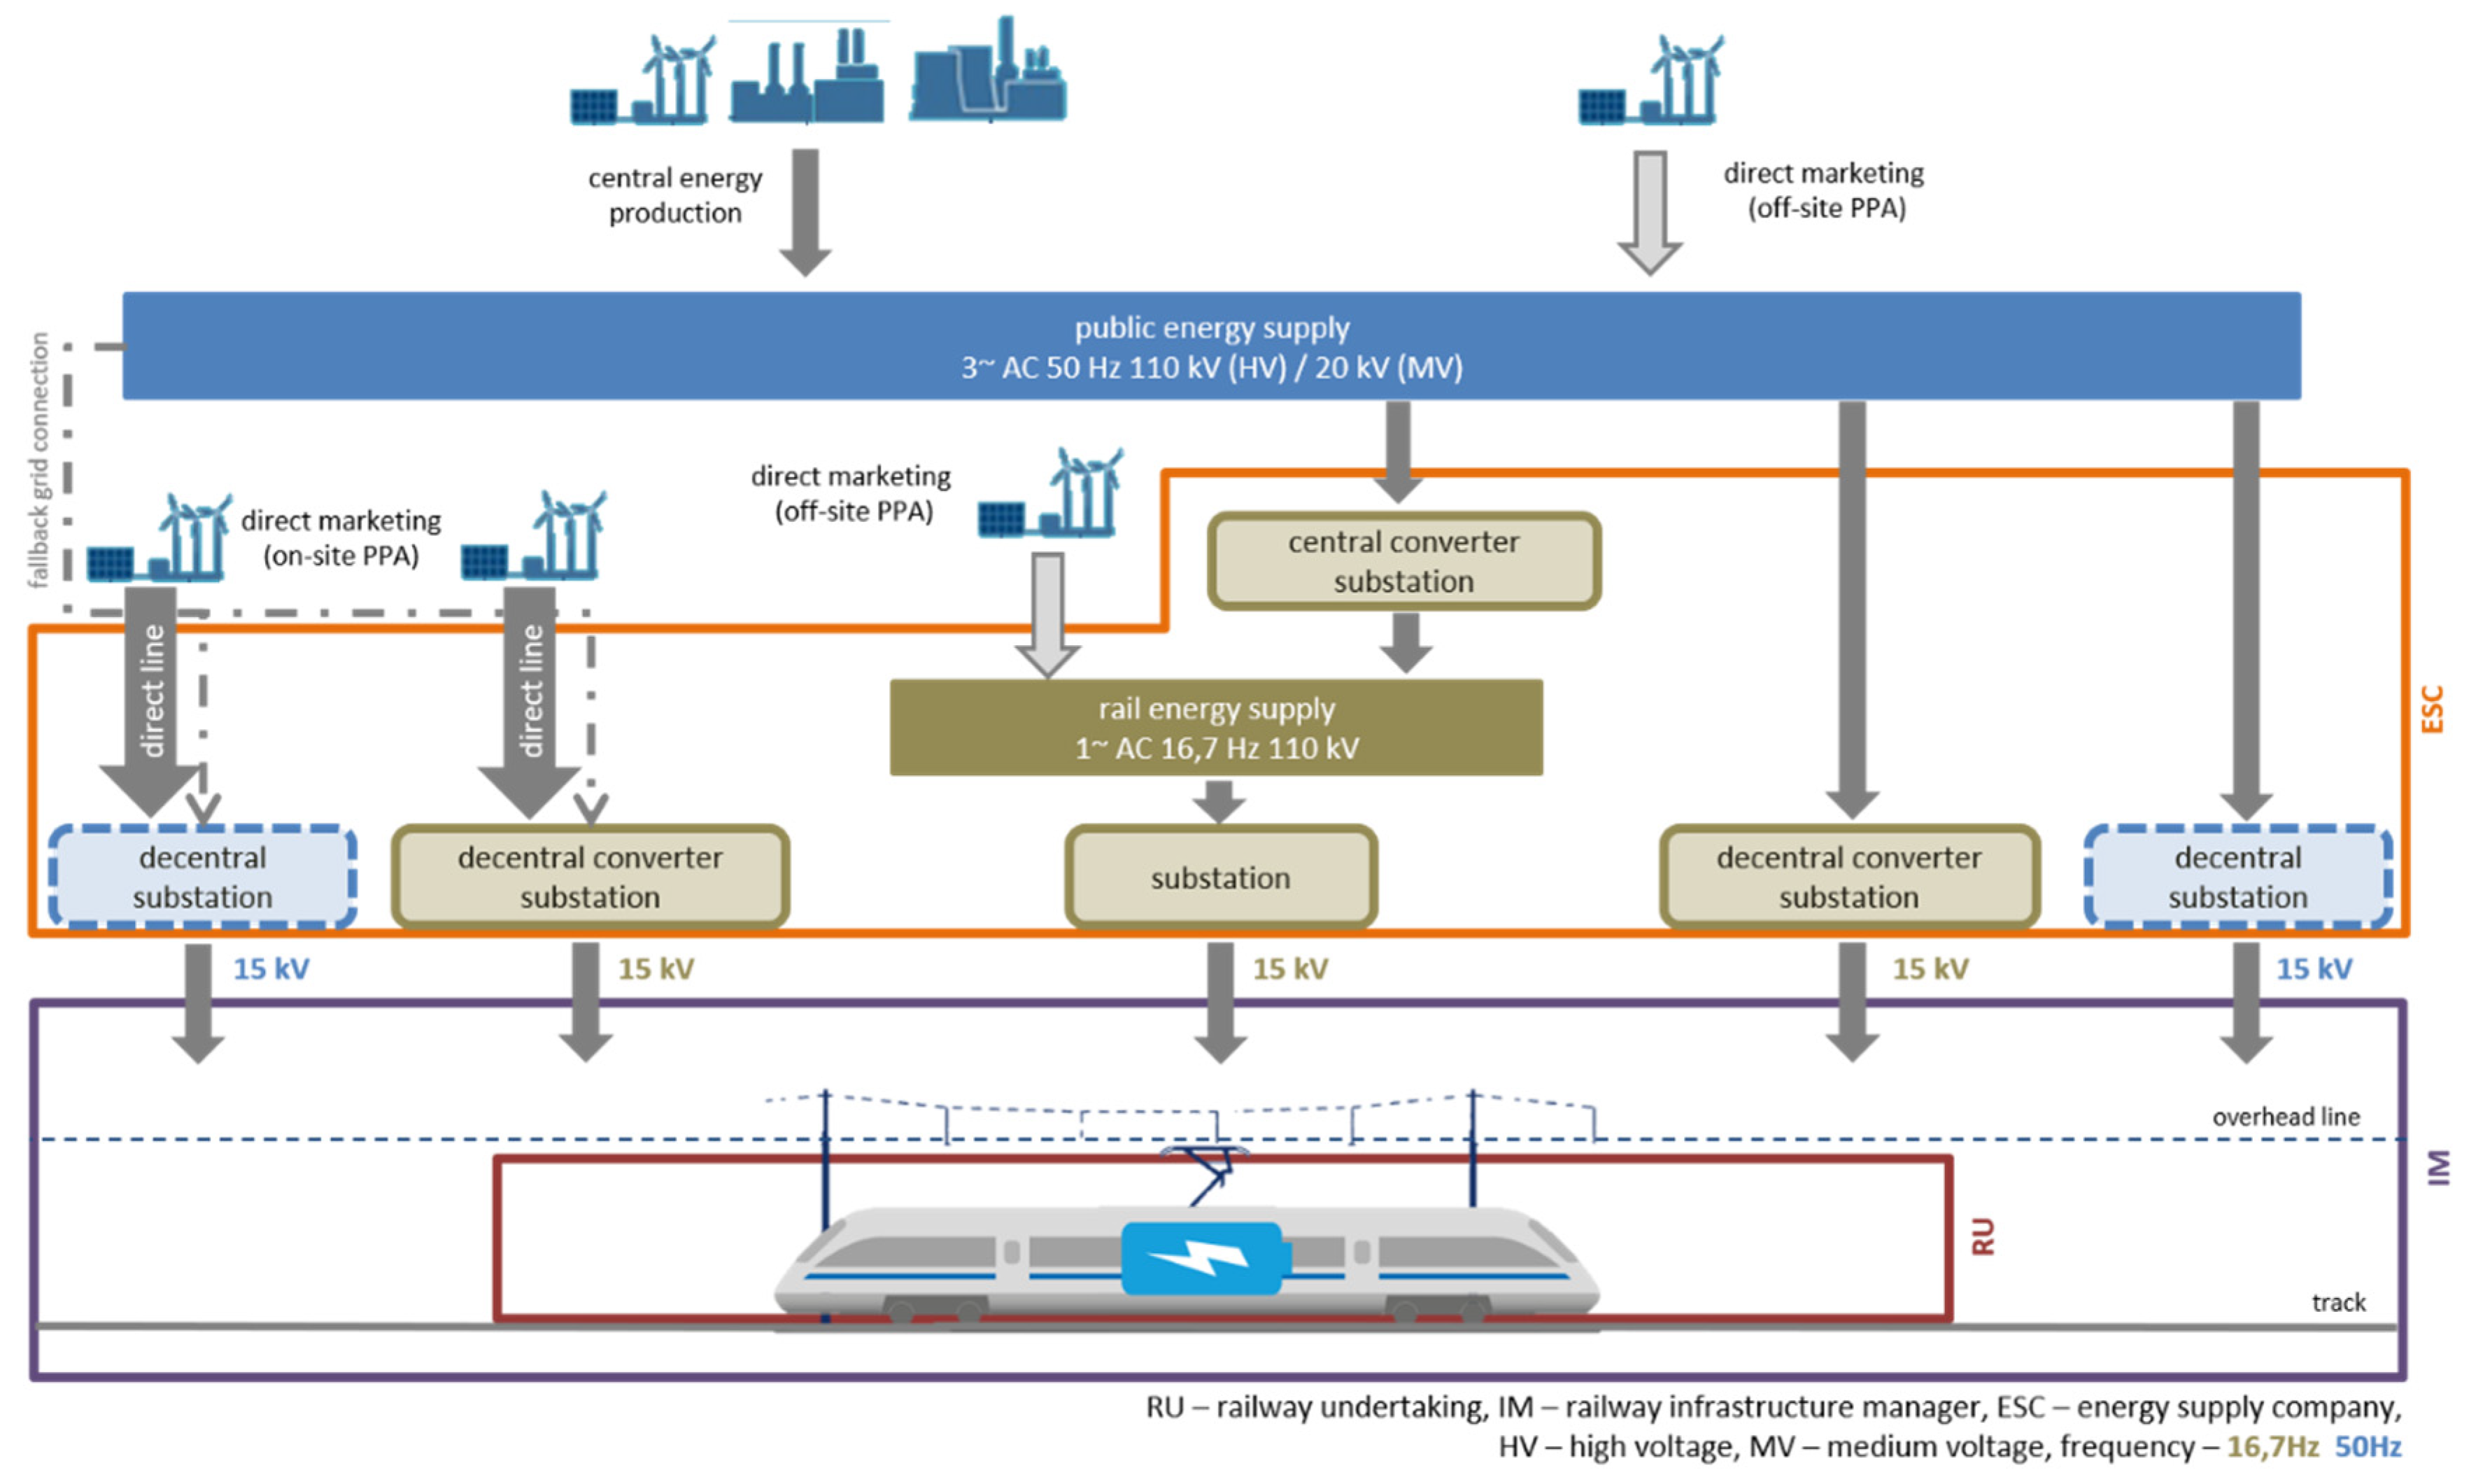
2.1. State of the Art—Railway Energy Supply Systems

The power supply of European railway systems is subject to standardization according to DIN EN 50163, distinguishing between direct/alternating current (DC/AC) with distinct voltage levels [14,15], of which AC-standards are defined by 15 kV/16.7 Hz and 25 kV/50 Hz. Due to significant differences in rail power systems in Europe [16], a Europe-wide generalization of BEMU recharging systems for different railway applications faces great hurdles. Hence, an adaption to national standards is required both at vehicle and recharging infrastructure side.
Regarding the German rail passenger transport, EMU and BEMU are supplied via a pantograph connected to an OHL fed with single-phase AC at 15 kV/16.7 Hz [14]. In Germany, energy supply for rail applications is supplied either (1) from rail electricity grid at 110 kV/16.7 Hz 1 AC or (2) from public electricity grid at 110 or 220 kV/50 Hz 3 AC. Central (1) and decentral (2) energy supply paths for BEMU recharging and responsibilities of operating companies are depicted in Figure 1.
In the case of (1), central converter substations convert and transform electricity from public grid to rail energy supply requirements (110 kV/16.7 Hz 1 AC), where central substations transform to OHL voltage levels of 15 kV/16.7 Hz. In the case of (2), converter substations transform and convert 50 Hz grid frequency to 16.7 Hz catenary frequency. Decentral converter substations are either connected to mid-voltage (15–30 kV) or high-voltage (110 kV) public grid.

2.2. Trackside Electrification Alternatives

For the presented approach, we differentiate between topology of trackside electrification (1) and energy supply (2) alternatives. (1) describes the positioning of OHL extension along the rail line depending on existing OHL, rail line and schedule characteristics as well as BEMU operating range. Trackside electrification alternatives can be implemented by extending an existing OHL (“OHL extension”—OHLE) or by newly constructed OHL islands (“OHL island”—OHLI), as shown in Figure 2. OHLEs can usually be fed from an already existing substation, whereas an OHLI requires a new converter substation supplying allocated OHL sections. An OHLI can be constructed either at intermediate stops or start/end stations alongside the rail line.

2.3. BEMU Energy Supply Schemes

Based on the abovementioned criteria, different energy supply alternatives for OHLI and OHLE can be derived, of which some are excluded here due to incompatibility of vehicle recharging and energy supply infrastructure or due to infeasibility in terms of energy legislation. According to Dschung [17], BEMU and EMU are adaptable with minor effort to energy supply at 50 Hz fed from OHL. This would facilitate the connection to public grid, since substation can forgo converting frequency to 16.7 Hz. Despite these arguments, railway energy supply at 15 kV/50 Hz is not yet standardized according to [15].
An OHLE extending from an existing OHL can be usually supplied by existing substations, although additional power demand beyond a certain threshold necessitates to extend the substation’s capacity. If future BEMU operation on a railway line requires the new construction of an OHLI, a connection to railway grid at the (converter) substation site is usually non-existent. Hence, new OHLI substations are connected to public grid at mid-voltage level, according to power demand of the fed OHL section.
Here, we differentiate between main energy supply from public grid and from local RES. For the latter, reduced or omitted taxes, fees and levies can open up energy cost reduction opportunities when energy demand is covered by locally produced electricity. Self-consumption of locally produced renewable energy is yet seldom applied to other use cases than power to gas applications [18]. Railway applications and especially BEMU recharging are not likely to meet the conditions for self-consumption according to German Renewable Energy Sources Act (EEG 2017) [19] (s. Appendix A for further information on the legislative framework). If the energy demand of substations is covered by local RES, we assume an energy pricing by direct marketing applied through power purchase agreements (PPA) (differences on-site/off-site PPA, cp. Figure 1, for additional informations. Appendix A).
In our approach, the contracting of energy is done in form of an on-site PPA towards railway undertaking and WPP operator. We assume a direct transmission line from WPP towards the OHL feeding substation (OHLI), whereby grid charges and associated levies are omitted [20]. Furthermore, an on-site battery storage is constructed at the OHLI substation in order to match BEMU timetable-bound peak power demands and fluctuating energy production from WPP. For the purpose of energy supply reliability, the OHLI substation is additionally connected to public grid. In our approach, the contracting of energy is done in form of an on-site PPA towards railway undertaking and WPP operator. We assume a direct transmission line from WPP towards the OHL feeding substation (OHLI), whereby grid charges and associated levies are omitted [20]. Furthermore, an on-site battery storage is constructed at the OHLI substation in order to match BEMU timetable-bound peak power demands and fluctuating energy production from WPP. For the purpose of energy supply reliability, the OHLI substation is additionally connected to public grid.
The energy supply alternatives for OHLE and OHLI which are assessed by our model-based approach are shown in Table 1.

3. Materials and Methods

3.1. Model-Based Approach

The presented model-based approach comprises step (A) to (D) (see Figure 3) and assesses relevant lifecycle costs of BEMU operation comparing electrification alternatives of railway lines with yet not sufficient OHL electrification. Energy supply alternatives (energy from grid, local WPP) are accounted in terms of resulting energy costs.

3.1.1. Multiple Unit Energy Demand and Trackside Electrification Alternatives

The energy demand is calculated by longitudinal simulation based on the modelling approach presented by Schenker 2020 [21]. The direct method optimization presented in [21] results in a reduced-energy trajectory compared to manual operation. The model optimizes the trajectory of a round trip of a railway line considering the route’s characteristics, such as length, elevation, speed limits, schedule and vehicle characteristics, such as mass, power characteristics and resistance coefficients. For this study, we simulated a full electrification scenario, where only traction motors and propulsion converters are subject to optimization and other drivetrain components are excluded. The simulation output comprises power demand at DC-link over the whole round trip with a maximum step-size of 100 m. The step-size is further decreased in the vicinity of stops in order to gain appropriate accuracy in the numerical discretization for solving the longitudinal equation system [21].
In a second step, the characteristic of battery recharging via pantograph is modelled for each trackside electrification alternative. The control strategy, introduced below, is assumed to be equal for EMU (full electrification) and BEMU (part electrification) operation. Figure 4 depicts the topology of BEMU drivetrain components connected at the DC-link. Braking energy is recuperated to the battery. The characteristic of BEMU drivetrain components (transformer, line converter, DCDC-converter, battery, propulsion and auxiliary converters rectifier) is calculated by static component efficiencies.
The auxiliary power demand includes a share for HVAC (heating, ventilation, air-conditioning) applications and secondary consumption for traction such as air compressors and component cooling systems. HVAC power demand ( P H V A C ) is estimated according to [22] by:
P H V A C = n c a r s ( 1.2   k W ° C T + 21.2   k W )
where n c a r s is the number of cars in the multiple unit and T is the ambient temperature. Secondary auxiliaries ( P s e c ) are calculated as presented in [23] as follows:
P s e c , i = 0.06 P t r a c , i
where P t r a c , i is the actual traction power.
Depending on the rail line characteristics and schedule requirements, electrification alternatives containing OHL sections are set up. To estimate the necessary OHL extension for each alternative, we set up an iterative model comprising a simplified operation strategy for BEMU recharging depending on the location of OHL sections alongside the rail line.
The traction storage capacity has to be designed for worst-case (winter) conditions and must also keep reserves for incidents and delays during operation [7]. The battery storage and useable SoC (State of Charge) range is assumed to be constant for all electrification alternatives in this investigation. The iterative approach increases the OHL extension stepwise (step size of 100 m) and checks (1) if the battery SoC is within the defined SoC range (SoCmin/SoCmax) and (2) that SoC at the end of a round trip (including stop and turn times) equals the SoC level at start (charge-sustaining round trip). The maximum recharging power from catenary is during stop limited to 80 A at 15 kV (1.2 MW) based on standardization according to DIN EN 50163 [15], while during driving higher charging powers are technically feasible. Despite this, we assume 1.2 MW as static parameter applied to the design case. Additional available charging power though can be used as buffer for incidents and delays.
The control strategy assumes that braking energy is fed to the battery and only in case of a fully charged battery the surplus of recuperated energy is fed back to the catenary. While driving under catenary, the energy demand for acceleration and auxiliaries is covered rather from catenary than from battery for efficiency reasons. The charging energy provided through catenary comprises the share of charged energy under each section, yielding the energy demand to the OHL feeding substation.
The multiple unit energy demand of a round trip ( E M U , r t ) has to be covered from catenary of the allocated OHLE- and OHLI-sections as depicted in Equation (3):
E M U , r t i = 1 m P c a t , i Δ t d r i v i n g , i + P c a t , i   Δ t s t o p ,   i | O H L E + j = 1 n P c a t , j Δ t d r i v i n g , j + P c a t , j   Δ t s t o p , j | O H L I
where the energy drawn from catenary is given by the average power from catenary ( P c a t ) and the corresponding time of the multiple unit under catenary during driving or stop ( Δ t d r i v i n g / Δ t s t o p ) for each step i , j .
The energy demand of a multiple unit ( E M U , r t ) at catenary is calculated as the sum of energy charged to the battery ( E c h a r g e ), traction energy ( E a c c ), auxiliary energy ( E a u x ) minus the recuperated braking energy ( E r e c u p ) for each iterative step:
E M U , r t = i = 1 n E a c c , i + E a u x , i + E c h a r g e , i E r e c u p , i
The battery energy at each step ( E b a t , i ) is calculated by energy balance as follows:
E b a t , i = e t a c a t 2 b a t E c h a r g e , i + e t a b a t _ i n E r e c u p , i e t a b a t _ o u t ( E a c c , i + E a u x , i )
where e t a c a t 2 b a t is the efficiency from catenary to battery, − e t a b a t _ i n / e t a b a t _ o u t the efficiency for battery recharging/discharging, E r e c u p the recuperated energy, E c h a r g e the recharged energy, E a c c the acceleration energy and E a u x the auxiliary energy.
The detailed description of the operation strategy is in Appendix B. The resulting OHL extension for each electrified section has to be less than 50 km, otherwise a further feeding substation is required [24], preventing inacceptable voltage losses with regard to DIN EN 50 163 [15].

3.1.2. Dimensioning of Recharging Infrastructure

Based on the calculated additional OHL length for each electrification alternative, the energy demand and possible additional substations are derived. The substation contains a multi modular direct converters (MMDC) and required secondary equipment, such as control technology and protection devices. In the case of OHL extension (OHLE), we assume that the existing substation has additional capacity left feeding another OHL. In the case of OHL islands (OHLI), the construction of a substation or converter substation is necessary.
For the presented approach, we distinguish between energy supply from public grid (option B.1 in Table 1) or if the main energy supply is covered by local WPP (option B.2 in Table 1) incorporating a battery storage. In both options, the grid connection is at 50 Hz, while voltage level may vary depending on local conditions. Converting the electricity from grid to 16.7 Hz feeding frequency of the OHL requires usually a converter substation [25]. Under certain circumstances, a converter may not be needed, e.g., modern multiple units are generally able to be supplied at 50 Hz (this is no standardized feeding frequency in German railway energy supply as mentioned above). In this study, OHLI associated (converter) substations are realized based on multi modular direct converters (MMDC) [24,26], applying Siemens Sitras SFC [27] with inherent redundancy [28]. We assume a MMDC size of 15 MW being discussed as standard converter size in rail applications [24]. The technical characteristics of OHL equipment, substation and grid connection are listed in Table 2, assuming static efficiencies.
The substation installed capacity is derived from the hourly energy demand given by recharged BEMU. The maximum recharging power at substation ( P U w , o u t ) is calculated by Equation (6), based on the maximum feeding power for each OHL ( U c a t , n o m I c a t , m a x ), the OHL efficiency (etacat), the number of multiple-unit per trainset (multi-traction: m t ) and number of supplied tracks ( t r a c k s ). We assume that one trainset is recharging at a time per track.
P U w , o u t = t r a c k s m t   U c a t , n o m I c a t , m a x e t a c a t
The nominal power of substation ( P U w , i n ) is given by adding the assumed substation’s efficiency ( e t a U w ), as follows:
P U w , i n =   P U w , o u t e t a U w

3.1.3. On-Site Battery Storage and Local RES

In the case of energy supply from local RES (energy supply alternative B.2 in Table 1), an on-site battery storage is added to the OHLI substation. In this study, local WPP are connected by direct line to the substation which are contracted by an on-site PPA. We assume that the produced wind power of the contracted plants is purchased completely by the OHLI-substation operator.
The operation strategy of the on-site battery storage aims primary to secure the coverage of BEMU energy demand at all times buffering the fluctuating WPP energy production. The surplus of energy which is not used for the recharging of BEMU is fed into the public grid. In times of low actual wind power production and lacking energy reserves in the battery storage, the additionally needed recharging energy is supplied by the public grid.
The energy balance of the battery storage is modelled in 1 h timesteps, assuming static re-/discharging efficiency of the battery, calculating the annual grid feed-in energy and grid consumption. The hourly energy of the on-site battery storage is calculated:
E b a t , t = E b a t , t 1 + e t a i n ( E R E S , t + E f r o m g r i d , t ) e t a d o u t ( E B E M U , t + E t o g r i d , t )
where E R E S , t is the energy produced by RES, E f r o m g r i d , t the energy consumption from grid, E B E M U , t the energy consumption of BEMU, E t o g r i d , t the energy fed to the grid and E b a t , t 1 the battery energy of the precious timestep.
The on-site battery storage is operated within a defined SoC range, in order to maintain the defined battery cell life time. The battery storage is operated within S o C l o w = 0.5 and S o C u p p e r = 0.9 . Furthermore, in 10% of the hours during the analyzed period the SoC can drop under S o C l o w while always remaining above S o C m i n = 0.1 . When the S o C u p p e r is exceeded, the energy demand for BEMU recharging has to be higher than the forecasted wind power production of the following hour, otherwise the surplus is fed to the public grid. The useable capacity of the battery storage decreases by cyclic and calendric aging. The lithium battery storage EoL (End-of-Life) is assumed with 80% of the BoL (Begin-of-Life) installed battery capacity. We assume a lithium battery storage cyclic lifetime of 6000 cycles [31]. The cyclic aging is estimated by full cycle equivalents (FCE) [32]. The FCE of a defined battery capacity ( C b a t ) are calculated based on the re- and discharged energy ( E k ) by:
FCE = 1 2 C b a t k = 1 n | E k |  

3.1.4. Relevant Lifecycle Costs

In Germany, regional rail passenger transport is subsidized by federal funds. Railway undertaking transport services are tendered by the responsible public transport authorities. Further, we assume that the design of electrification has no impact on generated revenues from public railway undertaking, thus revenues are not subject to the assessment. We calculated the relative advantageousness of electrification alternatives, incorporating energy supply options, by comparing relevant lifecycle costs (LCC). Thus, the evaluation focuses on differential costs of the considered alternatives assuming equal track and station access charges and personnel expenditures for all analyzed electrification alternatives.
The presented LCC approach comprises CAPEX and OPEX of recharging infrastructure and vehicles for each electrification alternative. Of which, energy costs are calculated separately as a function of the energy supply option, including energy production costs and accruing levies and charges. Relevant LCC of each electrification alternative are calculated for an operating period of 30 years. The LCC-model parameters are given in Table 3. We assume that residual values of vehicles and components of recharging infrastructure are neglectable, thus zero.
In this study, energy costs from vehicle energy demand are allocated to OHLI and OHLE, distinguished by energy price based on the chosen energy supply option. The relevant LCC of each electrification alternative, containing CAPEX and OPEX of vehicles (Veh), OHLI/OHLE and battery storage (Stor), is calculated by:
L C C r e l = ( I 0 + t = 1 n O P E X t m a i n t . q t ) V e h + ( I 0 + t = 1 n O P E X t m a i n t . + O P E X t e n e r g y q t ) O H L I + ( I 0 + t = 1 n O P E X t m a i n t . + O P E X t e n e r g y q t ) O H L E + ( I 0 + t = 1 n O P E X t m a i n t . + O P E X t c c q t ) S t o r
where I 0 are the initial CAPEX, q is the effective interest rate, O P E X m a i n t . are the maintenance costs, O P E X e n e r g y are the energy costs and O P E X c c are the costs for battery cell change.
The vehicle (multiple units) associated CAPEX and OPEX for maintenance are listed in Table 4.
The relevant LCC of recharging infrastructure comprise CAPEX and OPEX for OHL equipment, substation and battery storage (see cost data in Table 5). The given CAPEX include costs for research and development, production, transport and construction [3]. Additional costs for land acquisition, decommissioning, dismantling and recycling are neglected.
In the case of energy supply from local RES, a battery storage is added to the substation. The CAPEX of the battery storage ( C A P E X B a t ) contain cost shares for battery capacity ( k C ) and power electronics ( k P ) and are calculated as follows [32]:
C A P E X B a t = C B a t k C P B a t , m a x k P
where k C are specific capacity costs, C B a t is the battery nominal capacity, k P are specific power electronic costs, P B a t , m a x is the battery nominal power.
The on-site battery storage CAPEX also include costs for battery management system (BMS), battery thermal management unit and periphery [36]. The additional costs for battery cell change are given by capacity related costs [32]. Battery modules are exchanged when they exceed the defined number of equivalent full cycles. The cost shares of the battery storage applied to the LCC-model are listed in Table 6.
Energy costs are calculated by multiplying consumed energy with energy price for each electrified section. Energy prices depend on the energy supply option, i.e., consumption from public grid (grid tariff) or local WPP (on-site PPA). End-user energy prices are composed of the energy production price, RES feed-in compensation for RES (“EEG-Umlage”), according to the German Renewable Energy Sources Act EEG [19], electricity taxes, grid charges, and further fees and levies (see Table 7).
The electricity production price depends on the contract with the responsible energy supply company or the contract specifications within an on-site PPA. In the case of grid tariff, we assumed the tariff conditions of DB Energie [41], which is the reference energy supply company in Germany for railway energy consumption.
In case of energy supply through local WPP, the electricity production price includes the levelized costs of electricity (LCOE) and the expected returns (0.75 ct/kWh) of the WPP operator. The RES feed-in compensation in Germany is set firm for 20 years. In the following third operation decade (“post EEG”), the LCOE for old WPP are assumed at 3.24 EUR/kWh according to [40].
Consuming energy from the grid, grid charges arise comprising a performance and an energy price component. In this study, grid charges for railway energy consumption are applied according to DB Energie [41] (see Appendix C for additional information).

3.2. Case-Study Regional Rail Passenger Transport—Rail Line RB26

The previously introduced model-based approach is applied to the regional rail passenger transport line RB26, running from Berlin, then mainly through the state of Brandenburg and finally crossing the border to Poland. The railway line RB26 is as of 2021 part of an ongoing tendering procedure of regional rail passenger transport network (“Netz Ostbrandenburg Los 2”). The operation with zero-tailpipe emission multiple-units (i.e., BEMU, FCEMU) will receive bonus evaluation in the application procedure.

3.2.1. Rail Line and Schedule Sided Boundary Conditions

The parameters of rail line and schedule (driving- and stop-times, service frequency) are displayed in Table 8 reproducing service in 2021, based on information of the currently operating railway undertaking (Niederbarnimer Eisenbahn—NEB) [42].

3.2.2. Multiple-Unit Specification

For the longitudinal simulation, based on [21], a generic BEMU is specified similar to Pesa Link II 2-car multiple-units with Jacobs bogie (BR632), which are currently employed at rail line RB26 [43]. The basic specification of the generic BEMU are simplified applied to the EMU longitudinal simulation, assuming a traction power of 1.2 MW for BEMU and EMU simulation for comparability reasons. The specifications of the generic BEMU and the drivetrain properties are summarized in Table 9. Currently presented BEMU trains of rail vehicle manufacturers vary with regard to the installed battery capacity according to [1]. Depending on the rail line characteristics (schedule and line topology), mass of multiple-unit, battery operation strategy and sizing of the traction battery is subject to optimization. For the generic BEMU, the nominal capacity of the traction battery is set to 500 kWh (at Begin-of-Life), of which the useable SoC range is assumed with 64%. The BEMU battery capacity is equal for all electrification alternatives.

3.2.3. Electrification and Energy Supply Alternatives

Based on the status-quo electrification of rail line RB26, EMU and BEMU operation alike are technically not feasible. Thus, an extension or new construction of OHL sections is required. Therefore, we set up electrification alternatives based on the requirements given by schedule, service frequency and rail line topology, as well as infrastructural conditions. The following trackside electrification alternatives are evaluated with the presented model-based approach:
  • “Full electrification”: Full electrification with OHL along the complete rail-line, equipping non-electrified track with OHL at otherwise already electrified Terminus stations Berlin–Ostkreuz (using existing substation), construction of new converter substation at stop Müncheberg
  • “OHLE max”: necessary additional electrification through extension of existing OHL starting from station Berlin–Lichtenberg
  • “OHLI Werbig”: OHL island and substation at station Werbig
  • “OHLI Müncheberg”: OHL island and substation at station Müncheberg
The electrification alternatives for “OHLE max”, “OHLI Werbig” and “OHLI Müncheberg” are depicted in Figure 5, where existing electrification is shaded in grey with connected OHLE sections in light blue. OHL islands, including substation and associated OHL sections, are highlighted in light green.
“OHLE max”, “OHLI Werbig” and “OHLI Müncheberg” assume BEMU operation, “Full electrification” enables EMU operation (without onboard traction storage unit). For all alternatives, we assume an electrification of the section between the existing electrification at stop Berlin-Lichtenberg to the end-stop Berlin-Ostkreuz (length of 2.2 km). The electrification of the relevant platform at the turnaround station Berlin-Ostkreuz enables a relevant additional recharging energy input due to turnaround time of 5 min. The majority of rail line RB26 is single-track [45], electrification of short encountering sections is not evaluated within the cost model.
For each OHLE and OHLI of the proposed electrification alternatives, we assume an energy supply option (given in Table 1 in Section 2.3). All of the resulting alternatives assume that the existing electrification section at stop Lichtenberg is subject to energy supply option A. The specification of the electrification and energy supply alternatives is given in Table 10.

3.2.4. Local Wind Power Production

Multiple suitable WPP are located in reasonable spatial distance to station Werbig according to the open source platform https://www.flosm.de/html/Stromnetz.html [46]. Out of these, we selected 5 WPP of type Vestas V80 with installed capacity of 2 MW (start of operation in 2002). We assume the availability of this 10 MW wind park for contracting purposes in terms of an on-site PPA, as an example for the proposed model-based approach. The production characteristic of the selected WPP type is given by the modelled data of https://www.renewables.ninja/ [47] (plant type specific hourly wind energy production). The modelled wind power production characteristic, based on year 2015 by example, results in 1850 full load hours and an annual production of 18.52 MWh for the selected plant type, being typical for central German WPP according to [39].
The modelled wind power production characteristic is applied to the energy supply option B.2 within electrification alternative “OHLI Werbig”. Further, we assume the wind power plant’s availability for direct marketing, both being in the feed-in compensation period and beyond (“post EEG” WPP).

4. Results

4.1. Energy Consumption and Recharging Characteristics

The energy consumption at OHL is modelled for the abovementioned electrification alternatives. Figure 6a visualizes the multiple-unit’s velocity profile, the speed limits and the elevation profile of railway line RB26.
In Figure 6b, the simulated trajectory of the generic 2-car BEMU is given by the power shares for acceleration, auxiliaries and recuperation at the DC-Link for one round trip. The simulated trajectory forms the basis for the analysis of electrification alternatives. Figure 6(c.1–c.3) show the SoC-sequence for the analyzed electrification alternatives, in which extended OHL sections are marked in blue and existing ones in orange (assuming an ambient temperature of −15 °C in the design case). Additional information on the BEMU trajectory and the SoC-characteristics can be found in the Supplementary Materials.
Table 11 shows the energy consumption per round trip (total, at OHLE and at OHLI) of the analyzed electrification alternatives and calculated necessary OHL extension for the electrified sections is presented (cp. Figure 6(c.1–c.3)). Estimating the required extension of OHL, the energy consumption is firstly modelled under worst-case conditions, assuming ambient temperature of −15 °C. Afterwards, the annual energy consumption is calculated based on ambient temperature of 5 °C.
Since the existing electrification covers only a short section around the station Berlin–Lichtenberg, all analyzed electrification alternatives include the OHL extension between the station Berlin-Lichtenberg and the final station (Berlin-Ostkreuz), accounting for an OHL length of 2.1 km. The extension of OHL is calculated to a minimum length of 30.4 km in the “OHLE max” scenario, whereas “OHLI Werbig” and “OHLI Müncheberg” the OHL length is reduced to 8.3 km and 8.4 km, respectively (including 2.1 km OHL extension at the final station). The share of electrified track on the full route varies from to 13% in the “OHLI Werbig” and “OHLI Müncheberg” scenarios to 39% in the “OHLE max” scenario.
Comparing the OHLI scenarios (i.e., “OHLI Werbig”, “OHLI Müncheberg”) to the “Full electrification” and “OHLE max” scenarios, the share of energy demand covered from traction-battery is higher and, thus, the efficiency losses due to battery-charging/-discharging are increased. This results in energy savings of 13.6% (“Full electrification” to “OHLI Werbig”) and 15.7% (“Full electrification” to “OHLI Müncheberg”) per round trip, whereas the “OHLE max” scenario accounts for energy savings of 4.4% compared to “OHLI Werbig”, and 6.7% to “OHLI Müncheberg” per round trip.
Regarding the BEMU-operated scenarios, the majority of the braking energy is recuperated to the traction-battery and reused for acceleration or auxiliary consumers. Hence, the energy recuperated to the OHL especially for the “OHLI Werbig” (7.9 kWh/rt) and “OHLI Müncheberg” (4 kWh/rt) is significantly lower compared to “Full electrification” (212.6 kWh/rt) and “OHLE max” (60.5 kWh/rt) scenarios. The recuperation to the OHL is remunerated. However, the remuneration fee is lower than the consumption price. Hence, the recuperation to the traction battery is favorable regarding energy costs and also in terms of energy efficiency.

4.2. Relevant LCC of the Electrification Alternatives

The assessment of the relevant LCC on a time horizon of 30 years indicates that BEMU-operation with partial electrification is favorable over full electrification with EMU-operation. Comparing the scenarios (defined in Table 10), the “Full electrification” scenario results in a relevant LCC of EUR 224.5 M, whereas the relevant LCC of the most favorable scenario “OHLI Werbig (WPP old)” (main energy supply from local WPP in third operation decade) accounts for EUR 173.4 M (Figure 7). At least 19.4% cost savings against the full electrification can be achieved by partial electrification and operation with BEMU. Comparing only the BEMU scenarios, the relevant LCC varies from EUR 181 M to EUR 173.4 M.
The benefits of partial electrification against full electrification arises from significantly lower CAPEX and OPEX of the energy infrastructure. The energy infrastructure CAPEX ranges from EUR 66.8 M in case of the scenario “Full electrification” scenario to EUR 14 M in the scenario “OHLI Müncheberg (grid)”. The associated OPEX accounts for EUR 25.4 M in case of the scenario “Full electrification” and EUR 5.3 M in case of the scenario “OHLI Müncheberg (grid)”, evaluating a 30-year period.
Comparing BEMU and EMU operation, the vehicle CAPEX increases by 30% and vehicle maintenance costs by 23% due to additional costs for battery changes. The energy costs vary from EUR 0.58 M/a in the “OHLI Werbig (WPP old)” (BEMU operation) to EUR 1.04 M/a in the “Full electrification” scenario (EMU operation), which is analyzed in the following section.

4.3. Site Specific Energy and Energy-Related Infrastructure Costs

The costs of energy and associated infrastructure (CAPEX and OPEX) have been modelled based on the site-specific energy consumption at the OHLE and OHLI of each scenario (see Figure 8). The given results are not broken down to the responsible companies (railway undertaking, infrastructure manager, energy supply manager), rather aiming for an overview of the overall differential costs associated with the operation of BEMU and EMU.
The average energy consumption costs of the analyzed scenarios with electricity drawn from public grid vary from 13.3 ct/kWh to 16.8 ct/kWh, depending on the amount of electricity recuperated to OHL and its renumeration. The average energy consumption costs at OHLI-sites range from 5.2 ct/kWh to 9.8 ct/kWh, if electricity is provided only from local WPP (on-site PPA) depending on the contracted energy production price. Those scenarios require the installation of an on-site battery storage accounting for additional 6.5 ct/kWh (CAPEX and OPEX).
This results in cost savings of 5.1 ct/kWh (30.4%) (energy and storage costs) when comparing “OHLI Werbig (WPP old)” to “OHLI Werbig (grid)”, assuming equal costs for the OHLI infrastructure (substation and OHL equipment). In the case of WPP operated in the first and second operation decade, the difference is decreased to 0.5 ct/kWh (3%).
The energy infrastructure CAPEX and OPEX in case of the full electrification scenario account for 39.2 ct/kWh (excluding renumeration from recuperated energy), whereas in the “OHLE max” scenario this cost share is reduced to 14.3 ct/kWh.
Regarding the scenarios containing an OHLI, the energy infrastructure costs at the OHLE account for 4.2 ct/kWh due to the small OHL extension of 2.1 km at the end station. The costs for the OHLI energy infrastructure account for about 20.7 ct/kWh, resulting mainly from substation costs.

4.4. Impact of Service Frequency

In this section, the model has been applied to analyze the impact of the number of trains per hour operated at the investigated train line. Figure 9 shows the relevant LCC of selected energy supply scenarios for service frequencies of 0.5, 1 and 2 trainsets per hour. In all operation cycles, the “Full electrification” scenario shows the highest relevant LCC. The share of costs associated with the vehicles (CAPEX, OPEX and energy) increases with growing service frequency, whereas the share of infrastructure costs remains constant.
The relevant LCC at a service frequency of 2 trainsets per hour varies from EUR 349.8 M (“Full electrification”) to EUR 321.5 M (“OHLI Werbig (WPP old)”), resulting in cost saving potentials of 8.1%.
The results show that BEMU operation with energy supply from local WPP is competitive in the analyzed variants and favorable even at higher service frequencies. Operating at a service frequency of 0.5 trainsets per hour, the relevant LCC of the compared scenarios varies from EUR 158.8 M (“Full electrification”) to EUR 97.7 M (“OHLI Werbig (grid)”). The most favorable energy supply scenario (at 0.5 trainsets per hour) is “OHLI Werbig (grid)”, due to lower infrastructure costs compared to scenario “OHLI Werbig (WPP old)”. The impact of varying service frequencies on the relative cost shares of vehicle, energy and infrastructure costs are presented in detail in Appendix D.

4.5. Sensitivity Analysis

The relevant LCC of selected energy supply scenarios for varying reference costs are depicted in Figure 10a shows the impact of varying vehicle CAPEX on the relevant LCC, indicating a higher sensitivity in BEMU operated scenarios due to higher reference costs per multiple-unit as compared to EMU (EUR 6.5 M to EUR 5.0 M). The decrease in vehicle CAPEX by 30% refers to EUR 18.0 M cost savings for EMU operation in scenario “Full electrification” and EUR 23.4 M cost savings for BEMU operated scenarios. For scenarios with BEMU operation (green, violet and orange curve), a 10%-change in vehicle CAPEX results in a 4.5%-change in overall costs. BEMU operation will benefit from cost reduction potentials, especially regarding costs associated to the traction battery, such as initial costs of battery pack and its integration. Battery cell change costs account for EUR 10.8 M during the 30-year period of evaluation, which are also subject to cost reduction due to battery cell cost reduction, optimized design and BMS aiming for extended cell lifetime.
Figure 10b shows the impact of varying energy production costs, assuming that energy taxes, charges and levies stay constant. A 40%-change in energy generation costs results in about 2% changed overall costs. The differences between the energy supply alternatives have only a marginal impact on the overall assessment.
Figure 10c visualizes the variation of OHL equipment costs. The “Full electrification” scenario shows the highest impact on the overall costs compared to the other scenarios with shorter OHL length. The “Full electrification” scenario accounts for 8% increased overall costs (over 30 years) due to OHL equipment costs increasing by 20%, whereas the scenarios containing an OHLI, and thus significantly less OHL extension, result in only 2% increased overall costs for doubled OHL equipment costs.

5. Discussion

5.1. General Findings

The results of the model-based investigation show that in our case-study, at a train service frequency of 1 trainset per hour, island electrification is favorable in terms of relevant LCC against a full electrification regarding an evaluation period of 30 years. Comparing “OHLI Müncheberg” to “OHLI Werbig” (with a relevant LCC of EUR 176.6 M and EUR 172.2 M, respectively, see Figure 7), both electrification options with energy supply from grid show only marginal differences accounting for a 30-year period. The “OHLE max” scenario results in modelled relevant LCC of 181 M, being slightly higher than the OHLI alternatives. The needed OHL extension is the main cost difference for the investigated alternatives. The “Full electrification” scenario results in relevant LCC of EUR 224.5 M, at the reference service frequency of 1 trainset per hour. Assuming frequency of 2 trainsets per hour, full electrification is still not favorable due to 4.8% higher relevant LCC as compared to the OHLI alternatives (with energy supply from public grid). If additional substations are required, the infrastructure costs contain a potential for step costs, however the advantageous alternatives of a specific rail line are used to require a minimum of OHLI and associated substations.

5.2. Recharging Infrastructure

The energy demand at the OHL of a single traction rail line operated at a train frequency of one trainset per hour can be estimated to a maximum of 8 MW (assuming double traction and two trainsets recharging in overlapping time windows). Hence, the assumed converter substation’s nominal capacity of 15 MW is oversized for the given energy demand, however this assumption has been done due to standard module sizes of converter substations. Reduced substation capacity may offer cost reduction potentials, also for the associated OPEX and grid charges. However, the potential cost savings in infrastructure CAPEX are relatively low compared to the overall relevant LCC, accounting for 5.1% in the reference case of “OHLI Werbig”. The 15 MW standard substation offers additional capacity, either to recharge larger multiple units or further tracks, e.g., in the case of rail line junctions. Additionally, the remaining substation capacity can be used to supply also public bus lines and networks or other consumers, aiming to improve the cost effectiveness of OHL islands.
The infrastructure CAPEX in the “Full electrification” scenario account for EUR 66.8 M for the investigated single-track rail line corresponding to average CAPEX of EUR 0.83 M/track-km. In the literature, CAPEX of OHL electrification are discussed in a broad range within the range of EUR 0.8 to 1.5 M/track-km (cp. [33,48,49]). In the presented study, the OHL infrastructure CAPEX are relatively low due to the assumption that no additional substation at the start station (Berlin-Ostkreuz) is needed. The extension of OHL and the charging infrastructure layout is designed according to rail-line specific requirements and may vary significantly due to trackside-based obstacles (e.g., bridges, tunnels), thus site-specific analysis of electrification alternatives has to be carried out. Additional obstacle based OHL costs occur with higher probability when OHL length increases. Double track rail lines require double OHL equipment resulting in almost doubled CAPEX of OHL equipment, while the CAPEX of the substation remain constant (for the design capacity). Hence, OHLI and reduced overall OHL extension constitutes a cost advantageous opportunity for single and double track rail lines which are or are planned to be operated with BEMU. Long stop or turnaround times are an indicator for cost effective OHLI and OHLE sites due to higher recharging capabilities.

5.3. Vehicle Costs

The BEMU CAPEX and OPEX (incl. energy costs) in the OHLI/OHLE scenarios account for 85.8% to 89.1% of the relevant LCC as compared to EMU operation, accounting for 59% in the “Full electrification” scenario. The CAPEX for BEMU (including battery cell change) result in 38% higher vehicle CAPEX per multiple unit compared to EMU operated in full electrification. Comparing the operation with BEMU against EMU, additional BEMU are needed due to additional recharging times and less overall operating hours. The resulting additional vehicle CAPEX in BEMU scenarios have not been included in the model-based approach. This effect is also partially compensated by reduced maintenance and traction battery exchange costs. The electrification alternatives have been analyzed assuming equal nominal battery capacities in all cases. The results in Figure 6 show that in the OHLI alternatives the minimum SoC is not reached with a buffer of about 15%, indicating that the traction battery is slightly oversized. A detailed design and optimization of the traction battery storage capacity for each electrification alternative would lead to CAPEX and weight reductions of the storage system, however this was not in the scope of this study. At the other hand, further oversizing of the battery extends the lifecycle and also grants flexibility in operation [12]. The detailed analysis of OHL length and the multiple unit’s battery design involving battery cell aging will be subject to optimization approaches in future studies.

5.4. Competitiveness of Sector Coupling with Local RES with Substation

The direct-use of electricity produced by local WPP is feasible and competitive in terms of cost assessment compared to energy supply from grid because of the energy costs depending on the electricity production costs. The dimensioning of the OHLI on-site battery storage is also subject to optimization in between (1) the local RES energy generation profile, given by plant type, installed capacity and site characteristics, and (2) the energy demand from multiple units. The presented case study shows that the direct coupling of WPP is already favorable for electricity production costs of lower or equal than 6.25 ct/kWh contracted by an on-site PPA due to avoided grid charges and reduced coupled fees. The approach requires WPP in reasonable distance to the substation and are feasible to contracting in terms of on-site PPAs. The direct marketing of RES with off-site PPAs, i.e., electricity from grid with green energy certification, usually results in higher energy prices compared to typical grid tariff prices [6], although the differences are not substantial. Improving the renumeration of the fed-in energy surplus, the OHLI battery storage operator may participate at Day-Ahead, intraday and balancing energy markets. Another opportunity of cost-efficient energy supply from local RES arises from the use of excess energy from local RES, which may be available for low or even negative prices.

5.5. Critical Review of Model-Based Approach and Case-Study

The presented approach can be applied to other railway lines or even networks for planned railway undertakings considering site specific characteristics. Application to other countries’ legislative boundary conditions may result in different results especially regarding the energy pricing. The analyzing period may also lead to other recommendations in favor of the infrastructure costs, when extending the evaluation period to 76 years as it is stipulated by German infrastructure manager (DB Netz).
The discussed train service frequency up to 2 trainsets per hour (per direction) may result in capacity bottlenecks for single-track rail-lines, if necessary encountering sections are not provided. We assumed that OHL equipment has no residual value at the end of the investigation period of 30 years, although infrastructure is usually used for longer periods. The electricity price of OHLI supplied with energy from local RES neglects additional charges for transmission and margin for the OHLI operator.
Hence, the direct marketing approach and improvement of economic advantage of operating a battery storage using local RES can be further detailed, optimized and adopted to other national energy legislation.
The accuracy of the model-based approach is limited by the given spatial resolution of the BEMU trajectory simulation and the following discretization of the rail line by a step size of 100. However, the model calculates spatial energy demand of multiple units and the production profile of local RES based on hourly average power.

6. Conclusions

The replacement of DMU by BEMU in railway transport will result in increased demand for appropriate recharging infrastructure solutions and, moreover, in the aim of granting energy supply with fossil-free production of electricity. With the example in Germany, it has been shown that BEMU recharging by energy from local WPP by using an on-site battery storage is feasible and also competitive with respect to grid supply. Sector coupling approaches involving multiple units or other railway vehicles recharged with locally produced electricity from RES will be subject to further analysis from the perspective of efficient recharging for multiple units and also from the perspective of the energy system. Decentral energy supply in the form of local RES allows for feasible and cost-effective alternatives compared to energy consumption from the public grid. The careful design of recharging infrastructure, considering site-specific aspects, and the interaction with the energy supply shows the need for integrated cost assessment, e.g., by means of LCC, also involving optimization approaches.

Outlook and Managerial Implications

Broader application of rail transport operation with BEMU and other rail train categories, such as locomotives, will accelerate the development of scalable recharging technologies and improve cost effectiveness of novel recharging infrastructure solutions. Moreover, there is a potential for synergetic use of (parts of) the recharging infrastructure by public transport buses and automotive fleets allowing for improved cost effectiveness of OHLI including on-site battery storage systems. The use of on-site battery storage systems also has the potential to reduce grid stress caused by punctual high energy demand at the recharging infrastructure connected to the public grid, especially at mid-voltage level. Sector coupling of local RES and rail transport, e.g., regional rail passenger transport, offers potential for the decarbonization of public transport. Recharging rail vehicles with timetable-bound energy demand may enable use cases for decentral energy systems and balance the fluctuating production from RES, thus relieving public electricity grids especially at mid-voltage levels. We propose that component industry, energy supply companies and rail infrastructure managers should consider introducing substations with smaller module sizes whereas policy makers are advised to enable a legislative framework for a smooth coupling of RES with BEMU recharging infrastructure.

Supplementary Materials

The following are available online at https://www.mdpi.com/article/10.3390/su13158234/s1, Input data: “Table S1 BEMU trajectory”, “Table S2 WPP profile”, BEMU energy consumption: “Table S3 electr alternatives”, LCC analysis: “Table S4 LCC main”, “Table S5 LCC service frequencies”, “Table S6 LCC sensitivities”.

Author Contributions

Conceptualization, C.S. and J.P.; methodology, C.S., J.P., K.L.; software, C.S., M.S., K.L., validation, C.S., J.P., M.S., K.L., formal analysis, C.S., M.S., J.P.; investigation, C.S., K.L., M.S., J.P.; resources, C.S., J.P.; data curation, K.L., C.S., M.S.; writing—original draft preparation: C.S., J.P.; writing—review and editing, C.S., J.P., M.S.; visualization, C.S., K.L.; supervision, J.P.; project administration, C.S.; funding acquisition, J.P. and C.S. All authors have read and agreed to the published version of the manuscript.

Funding

This work was funded by the Helmholtz Association of German Research Centres on behalf of the Federal Ministry for Economic Affairs and Energy.

Institutional Review Board Statement

Not applicable.

Informed Consent Statement

Not applicable.

Data Availability Statement

Data is contained within the Article, Appendix A, Appendix B, Appendix C, Appendix D or Supplementary Material.

Acknowledgments

The idea for this work was developed within the DLR-project Next Generation Train, implemented in the master thesis of Kim Lakeit.

Conflicts of Interest

The authors declare no conflict of interest.

Nomenclature

Variables
P H V A C Power demand of HVAC consumers
n c a r s Number of cars in the multiple unit
T Ambient temperature
P t r a c Actual traction power
P s e c Power demand of secondary auxiliary consumers
Δ t s t o p Stop time
Δ t d r i v i n g Driving time
P c a t Power at catenary
i Discretization step
E M U , r t Energy demand of the multiple unit per round trip
E a c c Energy demand for acceleration
E a u x Energy demand for auxiliaries
E c h a r g e Recharging energy to the traction battery
E r e c u p Energy recuperated to the catenary
E b a t Energy of the traction battery / on-site battery
e t a c a t 2 b a t Efficiency of the drivetrain from catenary to battery
e t a b a t _ i n / e t a b a t _ o u t Efficiency of battery re-/discharging (traction battery / on-site battery)
t r a c k s Number of tracks
m t Multi traction
U c a t , n o m Nominal catenary voltage
I c a t , m a x Maximum catenary current
e t a c a t Efficiency of catenary
P U w , o u t Maximum capacity feeding into the OHL
e t a U w Efficiency of substation
P U w , in Nominal capacity of substation (connected to the grid)
E R E S Energy produced by local RES
E f r o m g r i d Energy consumed from grid
E t o g r i d Energy fed to the grid
E B E M U Energy demand of recharged BEMU
C b a t Battery capacity
E k Energy re-/discharged to the on-site battery storage
FCE Full cycle equivalent
L C C r e l Relevant lifecycle costs
I 0 Initial CAPEX
q Effective interest rate
O P E X m a i n t . Maintenance costs
O P E X e n e r g y Energy costs
O P E X c c Costs for battery cell chance
C A P E X B a t CAPEX of the on-site battery storage
k C Specific battery capacity costs
k P Specific battery power electronic costs
P B a t , m a x Nominal power of the on-site battery storage

Abbreviations

ACalternating current
BEMUbattery electric multiple unit
BoLBegin-of-Life
CAPEXcapital expenditures
DCdirect current
DMUdiesel multiple unit
EMUelectric multiple unit
EoLEnd-of-Life
FCEMUfuel-cell electric multiple unit
HVACheating, ventilation and air conditioning
LCClifecycle costs/costing
LCOElevelized costs of electricity
MMDCmulti modular direct converters
OHLoverhead line
OHLEoverhead line extension
OHLIoverhead line island
OPEXoperational expenditures
PPApower purchase agreements
RESrenewable energy sources
StorBattery storage
VehVehicle, i.e., multiple unit
WPPwind power plants

Appendix A. Self-Consumption and Direct Marketing Opportunities

Covering BEMU energy demand from local RES, the following conditions for self-consumption have to be met according to German Renewable Energy Sources Act (EEG 2017) [19]: (1) the consumer (railway undertaking) and energy producer (e.g., operator of WPP) have to be a corporate entity, (2) energy consumption and production is in direct spatial neighborhood and (3) energy from RES is not transmitted through the public grid.
In the case of direct marketing by an off-site PPA, the consumer obtains the contracted amount of energy from public (or, respectively railway) grid, but financially from the RES plant operator feeding electricity into the grid at another location [20], thus grid charges and levies are not avoided. Hence, the main advantage is emission free energy production while energy costs, comparing off-site PPA and grid tariff, vary just in terms of energy production prices and are not analyzed in detail.

Appendix B. Train Battery Operation Strategy

Given parameters
  • Efficiencies (static)
  • Battery to traction inverter: e t a b a t 2 a c c
  • Battery to auxiliary consumers: e t a b a t 2 a u x
  • Catenary to traction inverter: e t a c a t 2 a c c
  • Catenary to auxiliary consumers: e t a c a t 2 a u x
  • Useable battery capacity: E b a t , m a x
  • Maximum power from catenary: P c a t , m a x
Input from trajectory
  • Duration from previous to actual position step: Δ t
  • Energy consumption at traction inverter: E w h , a c c
  • Braking energy at traction inverter: E w h , r e c
  • Energy consumption of HVAC: E h v a c
  • Energy consumption of secondary auxiliaries: E a u x , t r
If under catenary (for each position step i)
Max energy from catenary:
E c a t , m a x , i = P c a t , m a x Δ t i 3600
Energy for acceleration from catenary:
E c a t , a c c , i = min ( E w h , a c c , i e t a c a t 2 a c c , E c a t , m a x , i )
Energy for auxiliaries from catenary while driving:
E c a t , a u x , i | d r i v i n g = {   min ( E a u x , t r + E h v a c e t a c a t 2 a u x , E c a t , m a x E c a t , a c c ) | i ,     E c a t , a c c , i < E c a t , m a x , i 0   ,     e l s e
Energy for auxiliaries from catenary at station (standing):
E c a t , a u x , i | s t a t i o n =   min ( E h v a c , i e t a c a t 2 a u x , E c a t , m a x , i )
Remaining energy for acceleration covered from battery:
E b a t , a c c , i = ( E w h , a c c , i e t a c a t 2 w h E c a t , a c c , i )   1 / e t a b a t 2 a c c
Remaining energy for auxiliaries covered from battery (driving):
E b a t , a u x , i | d r i v i n g = ( E a u x , t r + E h v a c e t a c a t 2 a u x E c a t , a u x _ d r ) | i   1 / e t a b a t 2 a u x
Energy for auxiliaries covered from battery (at station):
E b a t , a u x , i | s t a t i o n = ( E h v a c e t a c a t 2 a u x E c a t , a u x _ s t ) | i   1 / e t a b a t 2 a u x
Else if without catenary (for each position step i)
Energy for acceleration covered from battery
E b a t , a c c , i = E w h , a c c , i   1 / e t a b a t 2 a c c
Energy for auxiliaries covered from battery
E b a t , a u x , i = ( E a u x , t r , i + E h v a c , i )   1 / e t a b a t 2 a u x
0
Boundary conditions
Battery storage is fully charged at a defined starting position i 0 at the line:
E b a t ( i = i 0 ) = E b a t _ m a x
Recuperated energy to battery is 0 (or defined to trajectory characteristics) at a defined starting position i 0 :
E b a t , r e c ( i = i 0 ) = 0
1
Recuperation to battery
Recuperated energy to battery ( E b a t , r e c , i ) at position step i ( E w h , r e c , i given):
E b a t , r e c , i =   min ( E b a t , m a x E b a t , i 1 E b a t , a u x , i E b a t , a c c , i , E w h , r e c , i )
2
Maximum charging energy (at station and driving)
E c h , m a x , i = max ( min ( E c a t , m a x   E c a t , a c c , i E c a t , a u x , i , E c a t , m a x , i ) , 0 )
3
Battery energy
E b a t , i = min ( E b a t , i 1 E b a t , a u x , i E b a t , a c c , i + E b a t , r e c , i + E c h , m a x , i , E b a t , m a x )
4
Charging energy
E c h , i = min ( max ( E b a t , i E b a t , i 1 , 0 ) , E c h , m a x , i )
5
State of charge
SoC i = E b a t , i E b a t , m a x
6
Energy recuperated to catenary
E c a t , r e c , i = E w h , r e c , i E b a t , r e c , i

Appendix C. Grid Charges

Grid charges are stipulated by the local distribution grid operator based on annual operating hours and voltage level (mid/high voltage).
Table A1. Grid charges depending on annual operating hours and voltage level of grid connection [41].
Grid ConnectionGrid Charges (ct)
(Operating Hours < 2500 h/a)
Grid Charges (ct)
(Operating Hours > 2500 h/a)
Mid voltage0.0 P kW−1 + 6.28 E kWh−111,002 P kW−1 + 1.87 E kWh−1
High voltage1963 P kW−1 + 6.00 E kWh−115,888 P kW−1 + 0.43 E kWh−1
With P: Power of connection in [kW], and E: annual consumed energy in [kWh].

Appendix D. Impact of Service Frequency

Table A2 shows the cost share between vehicle, energy and infrastructure costs. The share of infrastructure costs decreases with increasing number of trainsets per hour. For the scenarios with BEMU operation the share of vehicle costs (CAPEX and maintenance costs) increase from 64.4% (at 0.5 trainsets/h) to 80.4% (at 2.0 trainsets/h) in the “OHLE max” scenario and from 68.1% to 79.9% in “OHLI Werbig—grid” scenario. Whereas the costs for charging infrastructure account only for 5.8 to 7.7% of the relevant LCC at 2 trainsets per hour. The “Full electrification” scenario shows that the share of charging infrastructure costs is 58% of the relevant LCC on a 30 years assessment period at 0.5 trainsets per hour. This share is reduced to 26.3% when the operation is two trainsets per hour.
Table A2. Share of vehicle, energy and infrastructure costs of select scenarios for varying number of trainsets per hour.
Number of Trainsets Per Hour
ScenarioCost Share0.51.02.0
“Full electrification”vehicle 132.8%46.5%59.6%
energy consumption9.2%12.5%14.1%
infrastructure58.0%41.0%26.3%
“OHLE max”vehicle 164.4%73.6%80.4%
energy consumption10.8%12.3%11.9%
infrastructure24.7%14.1%7.7%
“OHLI Werbig—wind (old)”vehicle 166.7%76.8%82.8%
energy consumption8.5%9.0%9.5%
infrastructure24.7%14.2%7.7%
“OHLI Werbig—grid”vehicle 168.1%75.6%79.9%
energy consumption12.3%13.5%14.3%
infrastructure19.6%10.9%5.8%
1 vehicle costs contain CAPEX and maintenance costs.

References

  1. Pagenkopf, J.; Schirmer, T. Marktanalyse Alternativer Antriebe im Deutschen Schienenpersonennahverkehr; NOW GmbH: Berlin, Germany, 2019. [Google Scholar]
  2. Bundesministerium für Verkehr und Digitale Infrastruktur. Mit der Elektrobahn Klimaschonend in die Zukunft—Das Bahn-Elektrifizierungsporgramm des Bundes. Available online: https://www.bmvi.de/SharedDocs/DE/Artikel/E/schiene-aktuell/elektrobahn-klimaschonend-zukunft-bahn-elektrifizierungsprogramm.html (accessed on 31 March 2021).
  3. Müller, A. Wissenschaftliche Bewertung von Alternativen, Emissionsarmen Antriebskonzepten für den Bayerischen; SPNV: Dresden, Germany, 2017. [Google Scholar]
  4. Mueller, F.; Guerster, M.; Obrenović, N.; Bierlaire, M. Can regional railway become emission-free with recently announced vehicles?—A case study of Bavaria. Eur. J. Transp. Infrastruct. Res. 2020, 20, 286–305. [Google Scholar] [CrossRef]
  5. Herwartz, S.; Pagenkopf, J.; Streuling, C. Sector coupling potential of wind-based hydrogen production and fuel cell train operation in regional rail transport in Berlin and Brandenburg. Int. J. Hydrogen Energy 2021. [Google Scholar] [CrossRef]
  6. Klebsch, W.; Heininger, P.; Martin, J. Alternativen zu Dieseltriebzügen im Schienenpersonennahverkehr: Einschätzung der Systemischen Potenziale; VDE Verband der Elektrotechnik Elektronik Informationstechnik: Frankfurt, Germany, 2019. [Google Scholar]
  7. Ebrecht, B.; Walter, D.; Zedlitz, I.; Zimmermann, U. Methodik einer Machbarkeitsstudie zum Einsatz batterieelektrischer Triebwagen (BEMU) am Beispiel des VVO-Dieselnetzes. J. Mobil. Verk. 2020, 11–20. [Google Scholar] [CrossRef]
  8. Royston, S.J.; Gladwin, D.T.; Stone, D.A.; Ollerenshaw, R.; Clark, P. Development and Validation of a Battery Model for Battery Electric Multiple Unit Trains. In Proceedings of the IECON 2019, 45th Annual Conference of the IEEE Industrial Electronics Society, Lisbon, Portugal, 14–17 October 2019; pp. 4563–4568. [Google Scholar]
  9. Thielmann, A.; Sauer, A.; Isenmann, R.A.; Wietschel, M. Technologie-Roadmap Stationäre Energiespeicher 2030; Fraunhofer ISI: Karlsruhe, Germany, 2015. [Google Scholar]
  10. Kunith, A.; Mendelevitch, R.; Goehlich, D. Electrification of a city bus network—An optimization model for cost-effective placing of charging infrastructure and battery sizing of fast-charging electric bus systems. Int. J. Sustain. Transp. 2017, 11, 707–720. [Google Scholar] [CrossRef] [Green Version]
  11. Rogge, M.; Wollny, S.; Sauer, D. Fast Charging Battery Buses for the Electrification of Urban Public Transport—A Feasibility Study Focusing on Charging Infrastructure and Energy Storage Requirements. Energies 2015, 5, 4587–4606. [Google Scholar] [CrossRef] [Green Version]
  12. Vilppo, O.; Markkula, J. Feasibility of Electric Buses in Public Transport. World Electr. Veh. J. 2015, 7, 357–365. [Google Scholar] [CrossRef] [Green Version]
  13. Bundesministerium für Wirtschaft und Energie (BMWi). Zeitreihen zur Entwicklung der Erneuerbaren Energien in Deutschland; Bundesministerium für Wirtschaft und Energie: Berlin, Germany, 2021. [Google Scholar]
  14. Kiessling, F.; Puschmann, R.; Schmieder, A. Fahrleitungen Elektrischer Bahnen: Planung, Berechnung, Ausführung, Betrieb, 3rd ed.; Publicis Publishing: Erlangen, Germany, 2014. [Google Scholar]
  15. DIN EN 50163:2004. Bahnanwendungen-Speisespannungen von Bahnnetzen; Deutsches Institut für Normung e.V.: Berlin, Germany, 2005.
  16. Steimel, A. Electric Traction—Motion Power and Energy Supply: Basics and Practical Experience; Oldenbourg Industrieverlag: Essen, Germany, 2007. [Google Scholar]
  17. Dschung, F. Laden von Batterietriebzügen mit 50 Hz. Eb Elektrische Bahnen 2019, 11, 442–450. [Google Scholar]
  18. Herz, S.; Hennig, B. Eigenversorgung, Direktlieferung, Power-to-X und Regelenergie-Sonstige Erlösoptionen Außerhalb EEG; German Wind Energy Association: Berlin, Germany, 2017. [Google Scholar]
  19. Bundesministerium für Wirtschaft und Energie. Erneuerbare Energien Gesetz (EEG 2017); Bundesministerium für Wirtschaft und Energie: Berlin, Germany, 2017. [Google Scholar]
  20. Uibeleisen, M.; Groneberg, S. Der wirtschaftliche Betrieb von Erneuerbare-Energien-Anlagen außerhalb des EEG-Förderrahmens—PPAs als Konkurrenz zum System staatlicher Fördergelder. RdE Recht Der Energiewirtschaft. 2018, 18, 114–122. [Google Scholar] [CrossRef]
  21. Schenker, M.; Schirmer, T.; Dittus, H. Application and improvement of a direct method optimization approach for battery electric railway vehicle operation. J. Rail Rapid Transit 2020. [Google Scholar] [CrossRef]
  22. Bomhauer-Beins, A.; Schranil, S.; Weidmann, U. Einflüsse auf den Bahnenergiebedarf und diesbezügliche Potentiale der Automatisierung. Eisenb. Rev. Int. 2018, 3, 140–144. [Google Scholar]
  23. Melzer, M. Entwicklung von Werkzeugen zur Automatisierten Traktionsspeicherdimensionierung auf Dieselelektrisch Angetriebenen Schienenfahrzeugen. Ph.D. Dissertation, Technische Universität Dresden, Dresden, Germany, 2013. [Google Scholar]
  24. Stephan, I.A.; Hammer, S.; Albrecht, A.; Holfeld, M.; Körner, S. Machbarkeitsstudie zur Verknüpfung von Bahn und Energieleitungsinfrastrukturen: Ergebnisbericht zu Los 2 “Technische Machbarkeit der Dezentralisierung des Bahntsromnetzes”; Technische Universität Dresden: Dresden, Germany, 2012. [Google Scholar]
  25. Gerhardt, N.; Valov, B.; Trost, T.; Degner, T.; Lehnert, W.; Rostankowski, A. Bahnstrom Regenerativ—Analyse und Konzept zur Erhöhung des Anteils der Regenerativer Energie des Bahnstroms; Fraunhofer IWES: Kassel, Germany, 2011. [Google Scholar]
  26. Steimel, A. Power-electronic grid supply of AC railway systems. In Proceedings of the OPTIM—13th International Conference on Optimization of Electrical and Electronic Equipment, Brasov, Romania, 24–26 May 2012; pp. 16–25. [Google Scholar] [CrossRef]
  27. Siemens AG Mobility Division. Produktinformation Sitras SFC Plus: Statischer Frequenzumrichter Für Die AC-Bahnstromversorgung No. 1.0.3; Siemens: München, Germany, 2016. [Google Scholar]
  28. Cupertino, A.F.; Pereira, H.A.; Seleme, S.I.; Teodorescu, R. On Inherent Redundancy of MMC-Based STATCOMs in the Overmodulation Region. IEEE Trans. Power Deliv. 2020, 35, 1169–1179. [Google Scholar] [CrossRef]
  29. DIN EN 50367:2012. Bahnanwendungen—Zusammenwirken der Systeme: Technische Kriterien Für Das Zusammenwirken zwischen Stromabnehmer und Oberleitung Für Einen Freien Zugang; Deutsches Institut für Normung e.V.: Berlin, Germany, 2013.
  30. Mofair e.V; Netzwerk Privatbahnen e.V. Kurzstudie: Wie Die Deutsche Bahn Wettbewerber Beim Bahnstrom Diskriminiert. 2010. Available online: https://www.netzwerk-bahnen.de/assets/files/veroeffentlichungen/pdf/2010-09-14_Kurzstudie_mofair_und_NP_Bahnstrom.pdf (accessed on 31 March 2021).
  31. Swierczynski, M.; Stroe, D.I.; Stan, A.-I.; Teodorescu, R.; Sauer, D.U. Selection and Performance-Degradation Modeling of LiMO2/Li4Ti5O12 and LiFePO4/C Battery Cells as Suitable Energy Storage Systems for Grid Integration with Wind Power Plants: An Example for the Primary Frequency Regulation Service. IEEE Trans. Sustain. Energy 2014, 5, 90–101. [Google Scholar] [CrossRef]
  32. Hauer, I.; Balischewski, S.; Ziegler, C. Design and operation strategy for multi-use application of battery energy storage in wind farms. J. Energy Storage 2020, 31. [Google Scholar] [CrossRef]
  33. Klebsch, W.; Guckes, N.; Heininger, P. Bewertung Klimaneutraler Alternativen zu Dieseltriebzügen; VDE Verband der Elektrotechnik Elektronik Informationstechnik: Frankfurt, Germany, 2020. [Google Scholar]
  34. ITP Intraplan Consult GmbH. Standardisierte Bewertung von Verkehrswegeinvestitionen im Schienengebunden Öffentlichen Personennahverkehr; ITP Intraplan Consult GmbH: München, Germany, 2016. [Google Scholar]
  35. Statistisches Bundesamt. Verbraucherpreisindex Für Deutschland. Available online: https://www.destatis.de/DE/Themen/Wirtschaft/Preise/Verbraucherpreisindex/Publikationen/Downloads-Verbraucherpreise/verbraucherpreisindex-lange-reihen-pdf-5611103.html (accessed on 22 February 2021).
  36. Fleer, J.; Zurmühlen, S.; Badeda, J.; Stenzel, P.; Hake, J.-F.; Sauer, D.U. Model-based Economic Assessment of Stationary Battery Systems Providing Primary Control Reserve. Energy Procedia 2016, 99, 11–24. [Google Scholar] [CrossRef] [Green Version]
  37. Komarnicki, P. Energy storage systems: Power grid and energy market use cases. Arch. Electr. Eng. 2016, 65, 495–511. [Google Scholar] [CrossRef]
  38. DB Netze. Bahnstrompreisregelung ab 01.01.2020 Für Die Rückfallversorgung. Available online: https://www.dbenergie.de/resource/blob/4716334/7cac268bb5adc192bcb29f0e905bae30/Bahnstrom-PB-Rueckfallversorgung-2020-data.pdf (accessed on 31 March 2021).
  39. Kost, C.; Shammugam, S.; Jülch, V.; Nguyen, H.-T.; Schlegl, T. Stromgestehungskosten Erneuerbare Energien; Fraunhofer ISE: Freiburg, Germany, 2018. [Google Scholar]
  40. Wallasch, A.-K.; Lüers, S.; Rehfeldt, K. Weiterbetrieb von Windenergieanlagen Nach 2020; Deutsche WINDGUARD: Varel, Germany, 2016. [Google Scholar]
  41. DB Netze. Preisblatt für die Nutzung des 16,7-Hz-Bahnstromnetztes Gültig ab 01.01.2020. Available online: https://www.dbenergie.de/resource/blob/5286010/45c9cb79cfc3038b982f26229f80858d/Preisblatt-Netznutzung-2020-data.pdf (accessed on 31 March 2021).
  42. Niederbarnimer Eisenbahn Betriebsgesellschaft. Fahrplan RB26—Oderlandbahn (ab 13.12.2020). Available online: https://www.neb.de/fileadmin/redakteure/Fahrpl%C3%A4ne/2021/RB26_Fahrplan2021_web.pdf (accessed on 24 February 2021).
  43. Niederbarnimer Eisenbahn Betriebsgesellschaft. Fahrzeuge—Der Pesa Link. Available online: https://www.neb.de/unternehmen/fahrzeuge/link/ (accessed on 24 February 2021).
  44. Ernst, J. Energy Baseline: Report for the FINE1-Project (D3.1); European Commission: Brussels, Belgium, 2018. [Google Scholar]
  45. Open Street Map. Streckentopologie RB26. Available online: https://www.openstreetmap.org/way/423708103#map=17/52.56434/14.40985 (accessed on 24 February 2021).
  46. flOSM: Stromnetze Mit Umspannwerken und Detaillierter Infrastruktur. Available online: https://www.flosm.de/html/Stromnetz.html?lat=52.5550501&lon=14.3700936&r=6150.2762&st=0&sw=generator,powerbiofuel,powerbiogas,powerbiomass,powercoal,powergeothermal,powerhydro,powerline380k,powerline400k,powerline420k,powerline750k,powerline765k,powerlinedchigh,powernuclear,poweroil,powersolar,powertidal,powerwaste,powerwind (accessed on 26 February 2021).
  47. Staffell, I.; Pfenninger, S. Using bias-corrected reanalysis to simulate current and future wind power output. Energy 2016, 114, 1224–1239. [Google Scholar] [CrossRef] [Green Version]
  48. Zenith, F.; Isaac, R.; Hoffrichter, A.; Thomassen, M.; Møller-Holst, S. Techno-economic analysis of freight railway electrification by overhead line, hydrogen and batteries: Case studies in Norway and USA. J. Rail Rapid Transit 2019, 23, 791–802. [Google Scholar] [CrossRef] [Green Version]
  49. Aufschläger, F.; Stephan, A.; Dölling, A. Modellierung der Lebenszykluskosten von Oberleitungsanlagen. EI Der Eisenbahningenieur. 2019, 8, 12–17. [Google Scholar]
Figure 1. Alternatives of railway energy supply for BEMU recharging from catenary at the example of Germany.
Sustainability 13 08234 g001
Figure 2. Topologies of trackside electrification alternatives (derived from [17]).
Sustainability 13 08234 g002
Figure 3. Stepwise model-based approach.
Sustainability 13 08234 g003
Figure 4. Topology of BEMU-drivetrain components [21].
Sustainability 13 08234 g004
Figure 5. Rail line RB26 from Kostrzyn (PL) to Berlin–Ostkreuz (DE) with OHL sections for electrification alternatives (ac) (source: openrailwaymap.org, accessed on 22 April 2021).
Sustainability 13 08234 g005
Figure 6. 2car BEMU trajectory at rail line RB26 and SoC-characteristics (a) velocity profile of multiple unit and elevation profile, (b) power-consumption trajectory at the DC-Link, (c.1–3) SoC-characteristics of defined electrification alternatives.
Sustainability 13 08234 g006
Figure 7. Relevant LCC of the compared electrification and energy supply alternatives (operation period of 30 years).
Sustainability 13 08234 g007
Figure 8. Site-specific (OHLE/OHLI) costs per kWh for energy consumption, infrastructure (comprising OHL equipment and substation) and on-site battery storage.
Sustainability 13 08234 g008
Figure 9. Relevant LCC of selected energy supply scenarios for varying train operation cycles.
Sustainability 13 08234 g009
Figure 10. Impact of varying cost shares on the overall relevant LCC (ac) of analyzed energy supply scenarios.
Sustainability 13 08234 g010
Table 1. Energy supply alternatives for OHLE and OHLI.
CriterionOHLEOHLI
ID of alternative AB.1B.2
OHL system15 kV/16.7 Hz15 kV/16.7 Hz
Grid connection of substationMV/HV 1MVMV
Main energy supplypublic/railway gridpublic gridlocal RES
Energy tariff grid tariffgrid tariffon-site PPA
1 MV—mid voltage, HV—high voltage.
Table 2. Specifications of OHL system, transformer and converter.
ComponentUnitValueReference
OHL frequency(Hz)16.7DIN EN 50163 [15]
OHL voltage limit(kV)15DIN EN 50163 [15]
OHL current limit(A)80DIN EN 50367 [29]
Efficiency of OHL(%)97[30]
Efficiency of direct transformer(%)98.8[17]
Efficiency of converter(%)95.0[17]
Efficiency MMDC(%)93.9Calculated 1
1 MMDC efficiency is calculated assuming one transformation and one conversion stage.
Table 3. Parameter of the carried out LCC assessment.
ParameterUnitValueReference
Vehicle operating life(a)30[33]
Recharging infrastructure operating life(a)30[34]
Nominal interest rate(%)2.0[3,33]
Annual inflation (Germany)(%)1.3[35]
Effective interest rate(%)0.7-
Table 4. EMU and BEMU associated CAPEX and OPEX (excluding energy costs).
ParameterUnitEMUBEMUReference
CAPEXEUR M/p.5.06.5assumption
OPEX—mileage-dependent maintenanceEUR/(1000 t × km 1)5.85.8[34]
OPEX—time-dependent maintenance (main inspection)EUR/(t × a)390390[34]
Traction battery replacementEUR/km-0.35 [3]
1 vehicle mass (t), mileage (km).
Table 5. CAPEX and OPEX of recharging infrastructure.
ParameterUnitValueReference
CAPEX OHL equipment (for each track)(EUR M/km)0.61[3]
CAPEX—direct line (mid-voltage) 1(EUR/km)60,000[25]
CAPEX converter substation (15 MW module) 2(EUR M/module)8.0assumption
OPEX(%CAPEX/a)1.4[34]
1 connecting substation and wind power plants; 2 includes MMDC, grid connection, switchgear and secondary equipment (control technology, protection devices).
Table 6. CAPEX and OPEX of battery storage.
ParameterUnitValueReference
CAPEX—battery (EUR/kWh)400[32,36,37]
CAPEX—power electronics(EUR/kW)180[32,36,37]
CAPEX—storage connection to substation 1(EUR)350,000Based on [25]
OPEX—battery storage(%CAPEX/a)1.5[32]
1 converter costs for wind power plants are not allocated to battery storage CAPEX.
Table 7. Energy price, comparing grid tariff and on-site PPA.
Pricing ItemGrid Tariff (ct/kWh)On-Site PPA (ct/kWh)
Energy production pricedt: 6.9, nt: 5.8 [38] 1WPPnew: 6.25/WPPold: 3.24 [39,40] 2
“EEG-Umlage” (reduced 3)1.3512 [19]
Energy tax1.142
Cumulated fees and levies 40.222-
Feed-in renumeration2.73 [41]same as purchase price (assumption)
1 day tariff (dt): 6 a.m.–10 p.m., night tariff (nt): else; 2 WPPnew: plant age ≤ 20a, WPPold: plant age > 20a (“post EEG”); 3 reduced to 20% for railway applications (§65 in German Renewable Energy Sources Act); 4 calculated: levies [ct/kWh]: “StromNEV” = 0.025, “KWKG” = 0.04, “abLA” = 0.007, “Offshore” = 0.04; “Konzessionsabgabe” = 0.11 (from 1 GWh/a)/.
Table 8. Rail line characteristics and train service parameters.
ParameterUnitValueReference
Rail line length(km)83.5Openrailwaymap.org
Existing electrified section (length)(km)78.7–81.4 (2.7)Openrailwaymap.org
Start/end time of operation 04:00–0:00 (a.m.)[42]
Number of journeys per direction(1/h)1[42]
Number of trainsets in service 6assumption
Multi-traction 1 doubleassumption
Number of multiple-units 2 12assumption
Daily journeys per direction 3 19[42]
1 multi-traction: number of multiple-units per trainset; 2 includes vehicle reserve for maintenance; 3 part journeys are neglected, schedule is applied all year round.
Table 9. Specifications of generic multiple-unit based on [21].
ParameterUnitValue
Multiple unit length(m)42
Multiple unit empty mass(t)91
Multiple unit number of seats(t)120
Multiple unit max. velocity(km/h)140
Max. traction power (from battery/catenary)(kW)1200
Nominal battery capacity(kWh)500
Useable battery capacity 1(%)64
Max. PHVAC (at −15 °C) 2(kW)78.4
Average PHVAC (at 5 °C)(kW)30.4
Psec (% of traction Power)(%)6
Efficiencies of drivetrain components 3 [1]
Transformer()0.95
DCDC-converter()0.975
Line-converter()0.975
Battery—dis-/recharge()0.95
Auxiliary-converter()0.975
1 given by Depth of Discharge of 80% and 80%-End-of-Life criteria; 2 auxiliary power demand under worst-case conditions (−15 °C); 3 efficiency characteristics of asynchronous motor and traction converter are integrated to the longitudinal simulation [44].
Table 10. Specification of electrification and energy supply alternatives for case study rail line RB26.
ParameterUnitEnergy Supply Alternatives
Trackside electrification “Full electrification”“OHLE max”“OHLI Werbig”“OHLI Werbig”“OHLI Müncheberg”
Energy supply alternative (ID) AAB.1B.2B.1
Additional converter substation 1-111
OHL system 15 kV/16.7 Hz
Main energy supply public gridpublic gridpublic gridlocal RES 1public grid
On-site battery storage[MWh]---2.0-
Voltage level of grid connection mid voltage
(20 kV)
energy tariff grid tariffgrid tariffgrid tariffon-site PPAgrid tariff
OHLE number of tracks 1
OHLE charges per hour[1/h]2
OHLI number of tracks --111
OHLI charges per hour[1/h]--222
1 WPP connected to the substation: Wind park “Seelow” (estimated distance: 1 km).
Table 11. OHL extensions and train energy consumption per round trip at catenary for analyzed electrification alternatives.
Unit“Full electrification”“OHLE max”“OHLI Werbig” “OHLI Müncheberg”
Total (OHLE + OHLI)
Length OHL extension(km)80.830.48.38.4
Net energy consumption (Tamb = 5 °C) (kWh/rt)334.2369.9386.9396.3
Recuperation to OHL(kWh/rt)212.660.57.94
OHLE
OHL extended sections (OHL length)(km)
((km))
0.0–78.7,
81.4–83.5
(80.8)
50.4–78.7,
81.4–83.5
(30.4)
81.4–83.5
(2.1)
81.4–83.5
(2.1)
Gross energy consumption (Tamb = 5 °C)(kWh/rt)546.8430.4192.2178.7
OHLI
OHL extended sections (OHL length)(km)
((km))
--11.2–17.4 (6.2)36.6–42.9
(6.3)
Gross energy consumption (Tamb = 5 °C)(kWh/rt)--202.7221.6
Publisher’s Note: MDPI stays neutral with regard to jurisdictional claims in published maps and institutional affiliations.

