Article

Exploring the Factors Affecting Mobile Learning for Sustainability in Higher Education

by
Ali Mugahed Al-Rahmi
1,*,
Waleed Mugahed Al-Rahmi
2,
Uthman Alturki
3,*,
Ahmed Aldraiweesh
3,
Sultan Almutairy
3 and
Ahmad Samed Al-Adwan
4
1
Faculty of Technology Management and Business, Universiti Tun Hussein Onn Malaysia, Johor 86400, Malaysia
2
Self-Development Skills Department, College of Common First Year, King Saud University, Riyadh 11451, Saudi Arabia
3
Educational Technology Department, College of Education, King Saud University, Riyadh 11451, Saudi Arabia
4
Electronic Business and Commerce Department, Al Ahliyya Amman University Jordan, Balqa Governorate 19328, Jordan
*
Authors to whom correspondence should be addressed.
Sustainability 2021, 13(14), 7893; https://doi.org/10.3390/su13147893
Submission received: 5 June 2021 / Revised: 12 July 2021 / Accepted: 13 July 2021 / Published: 14 July 2021

Abstract

:
Mobile learning (M-learning) has become an important instructional technology component in higher education. The goal of this research is to determine how Malaysian university students use M-learning in higher education. The technology acceptance model (TAM) concept was used to construct a theoretical model of M-learning acceptability. In theory, five independent criteria were discovered as contributing to the actual usage of M-learning for educational sustainability by influencing students’ attitudes towards M-learning and their intention to use it. A questionnaire survey based on the technology acceptance model (TAM) was used as the primary data collection technique, with 200 students from UTHM University of Malaysia participating. The data were analyzed using SPSS and Structural Equation Modeling (SEM-Amos). The results of the students’ attitudes towards using M-learning and their behavioral intentions to use M-learning show a beneficial impact on the actual use of M-learning as well as the long-term sustainability of M-learning in higher education. In addition, both male and female students were satisfied with perceived usefulness, perceived ease of use, perceived enjoyment, attitude towards use, task-technology fit, behavioral intention to use, perceived resources and actual use of mobile learning for educational sustainability. This study contributes to the validation of the extended TAM for M-learning by demonstrating that the predicted model predicts students’ attitudes towards using M-learning and their behavioral intentions in Malaysian higher education.

1. Introduction

The term “sustainability” can be interpreted from many different viewpoints. Sustainability is defined by [1] as “the ability to continue an activity or a certain condition indefinitely”. Sustainability of education focuses on the implementation of sustainable forms of “successful” practice through educational development, leadership and innovation [2]. Sustainability is a crucial issue since educational institutions are usually required to make substantial investments in mobile learning and associated technologies to initiate mobile learning programs. In light of the literature, there are abilities that define the sustainability of M-learning: the capacity to respond to current educational needs and intent of M-learning; ability to have a high chance of being accepted by users; ability to adapt to possible changes; ability to maintain a certain condition indefinitely or make progress [3]. To build these issues into thinking about innovations in mobile learning, we need a more explicit model of sustainable practices with handheld computers in institutionalized education. There are few models of sustainability for mobile learning in higher education. Since mobile technology has made it feasible to study on the go, M-learning is a fast-growing trend in educational settings [4]. Sharma and Kitchens [5] define M-learning as a new type of learning facilitated by mobile devices that incorporates ubiquitous communication technology and sophisticated user interfaces. Students may now experience individualized learning on their mobile devices thanks to the advent of M-learning. Many innovative mobile services have emerged in recent years that incorporate mobile technologies with university educational systems as sustainable [6]. Thousands of educational institutions have been closed due to the COVID-19 pandemic to promote social distancing measures and thus limit the virus spread [7].
During COVID-19, universities started using mobile learning in education and learning processes. Given the adoption of creative teaching approaches (e.g., the usage of mobile learning applications), several researchers have focused on technology adoption in their research as a result of the COVID-19 pandemic. During the pandemic, it became important to consider students’ and educators’ thoughts on implementing a mobile learning platform. Therefore, the need for mobile learning platforms and the issues surrounding the COVID-19 pandemic need to be addressed [8]. As the usage of mobile learning platforms is a relatively new practice, there is a lack of research on how mobile learning can affect higher education [9]. The implementation of mobile learning must provide a relative advantage over traditional means of learning by utilizing best-in-class ICT tools and resources. The implementation must be governed under the principles of sustainability, which asserts that the current utilization of resources should not compromise the capacity for future generations. Cloud-based ICT infrastructure serves the cause of sustainability and will provide required on-demand scalability, cost optimization and innovative solutions [10]. It has been applied in many studies in the area of ICT [11,12] and very extensively in the area of sustainability. It has also been applied in the area of M-Learning [13]. Contextualized in a management system and supporting a sustainability gateway in a mobile application, the impact of M-learning tools to enhance competence in the sustainable education of university students has also been analyzed [14]. However, it should be noted that while some studies did not identify significant differences among students’ attitudes toward mobile-based learning in terms of their academic majors [15,16], other investigations showed that students’ attitude towards the sustainable use of mobile technology in the learning process is impacted by the academic major [17].
Ahmad et al. (2018) specified some managerial success factors such as security, access control and privileges and commitment to enhancing sustainability in M-learning [18]. Previous literature has investigated education sustainability from different perspectives such as education, technology, employment, teachers and curricula [19]. Viewing mobile devices as cultural resources, we address here the concept of sustainability from an ecological perspective. The term “sustainability” is traditionally associated with a debate of the utilization of M-learning in the classroom. Studies related to the use of M-learning in educational institutions examine students’ attitudes towards the use and implementation of M-learning techniques for the sustainability of learning, with special emphasis on the importance of M-learning design [20]. Students’ attitude towards the sustainability of learning demonstrates that it is necessary to understand the use of ICT-based learning, because the student’s attitude is crucial in contributing to sustainable learning [21]. There are studies that show that even students who have positive attitudes require a teacher for various reasons, some related to the sustainability of M-learning and the requirement of motivation [22,23]. M-learning can perhaps offer more possibilities in the teaching field in order to implement the sustainability of continuous learning [24]. As a result, the major conclusion is that the teacher’s function as an instructor for independent online learning in a process of sustainable distant education must be addressed to plan M-learning technologies. In this context, the teacher has a key role in self-directed learning, because self-directed learning is seen to be necessary for the sustainability of learning throughout life [25]. Previous research predicted that M-learning, along with other forms of ed-tech solutions such as e-learning, contribute in both quality and finance aspects to the sustainability of education [26]. In general, understanding various dimensions of sustainability has shown to be a challenge for students [27]. Mobile learning is a consequence of increasing information and communication technology development, which affect the learning environment. New pedagogical models are needed to guide the development of learning systems [28,29]. M-learning provides an opportunity for students to stay involved in their learning environments that cannot be obtained through static technology devices such as desktop computers. Now, a change in the philosophy of teaching and learning has been moving from teacher-centered learning to a student-centered approach.

2. Research Background

Several studies [30,31,32] have been carried out to investigate the elements that impact consumers’ adoption of M-learning. According to [33], academics did not take a thorough enough strategy while examining the attitudes of the pupils in a high school instructional situation. Several M-learning studies [34,35] focused on teachers and students. Despite the fact that mobile devices are now some of the most important tools for learning, entertainment and educational activities [36], with the field of mobile learning field is still in its infancy, there are few guidelines available to ensure the sustainability and transferability of mobile learning initiatives [37]. Furthermore, this model supports the sustainability of mobile learning by understanding the factors affecting students’ intention to use M-learning before applying this type of education to ensure its success and continuity. It is used to increase the learning motivation among students, enhance students’ engagement and increase the sustainability of learning in an effectively way [38].
Scholars have investigated sustainability in higher education from different perspectives such as focusing on educational systems, employment, curricula, teachers and technology [39]. Nevertheless, learners’ achievements, knowledge and skills are still discussed under the term education sustainability [40]. Sustainable M-learning requires that both the teachers and the students have unhindered access to the internet anywhere and at any time in the country [41]. Thus, for effective and sustainable M-learning in higher education in Malaysia, it is imperative to investigate the perceptions of students and academics regarding the possibility of a pedagogical shift. TAM and M-learning have also been studied separately in the past to understand e-learning system use. However, no research has attempted to potentially combine these three models for shaping students’ academic performance in the context of educational sustainability. The investigation of the integration of TTF, TAM and M-learning usage as a sustainable way to influence students’ academic performance is one of the research’s main contributions.
The results can help managers and academics better understand how M-learning system use affects students’ academic performance as well as educational sustainability in higher education by bridging the gap between acceptance and continuation streams of M-learning system use. In addition, this paper suggests a research paradigm for integrating the technology acceptance model (TAM) for M-learning system use in educational sustainability. M-learning is not fully utilized in Malaysian higher education, which is the reason why higher education teachers/student ATT learning through practical knowledge is at the lowest level. Therefore, the key purpose of this research is to explore the ATT using M-learning and BIM M-learning and their impact on students’ beliefs in higher education, such as their perception of MLS (M-learning as sustainable). In addition, the study aims to identify the major influencing factors in M-learning with student learning settings as a means of improving M-learning for educational sustainability. To achieve these goals, an expanded Technology Adoption Model (TAM) model has been developed, which draws on literature related to M-learning usage in Malaysian higher education.

3. Research Model and Hypotheses Development

In this study, we created a model (Figure 1) that depicts the effects of M-learning on perceived technology fit, PR and ATT use at UTHM in Malaysian higher education. Figure 1 shows the relationship between task-technology fit (TTF) and ATT, PR and BIM M-learning, PE and PEU, and PU of M-learning for BIM M-learning among students. This study created 13 hypotheses on how M-learning might affect the actual usage of M-learning for sustainability in Malaysian higher education, based on prior studies connected to the TAM model [42,43]. Furthermore, frameworks that indicate M-learning adoption are based on a temporary feature, and there is no evidence of its impact on higher education sustainability difficulties. As a result, the goal of this research is to combine essential characteristics of constructivism and TAM with educational sustainability. The scenario is depicted in Figure 1.

3.1. PU

According to Davis (1989), perceived usefulness refers to the degree to which a person believes that using a particular system would enhance his/her job performance [44]. In this study, perceived usefulness was defined as the student’s belief that adapting mobile learning methods will improve their performance. In this study, perceived utility was defined as the belief that M-learning improves learners’ performance in technology-related areas [42,44]. When the PU of M-learning is strong, it promotes a good ATT and, as a result, increases the intention of rural technology students and instructors to use it [42,45]. In the original TAM by Davis et al., PU influenced both perceived attitude and intention to use the information system (1989). PU is also an excellent predictor of both behavioral intention and ATT, according to recent studies [46,47] on the M-learning scenario.

3.2. PEU

Perceived ease of use is defined as “the degree to which a person believes that using a particular system would be free of physical and mental effort” [44]. In this study, perceived ease of use referred to how students experience less difficult or complex situations in an academic setting when using the M-learning system on their mobile device for educational purposes. In the context of M-learning, Mutambara and Bayaga [48] defined PEU as the degree to which consumers believe that adopting M-learning will be easy. When teachers use M-learning, their workload rises [34], and this increase is worsened if the M-learning platform is not user-friendly. According to Davis (1998), the idea that an information system is difficult to use can be a barrier that affects users’ attitudes, perceptions of usefulness and their behavioral intentions in the early stages of system adoption [31,49]. Rural high school technology students, professors and parents are all familiar with the use of mobile devices in daily activities. However, because they are inexperienced with the use of mobile devices for technology learning, the adoption of M-learning is still in its early stages. When rural high school tech students, instructors and parents believe that it is easy to use M-learning for technology learning, they will have a positive ATT, realize its usefulness and accept it.

3.3. PE

Perceived enjoyment is defined as “the degree to which individual enjoy the activities of using technology, while anticipating the performance consequences” (Davis et al., 1992). Individual learning and performance behavior are positively influenced by perceived enjoyment [50,51]. According to Heijden (2003) and HsuL and Lin (2008), perceived enjoyment has a significant impact on behavioral intention to use M-learning that improves user learning [52,53]. People engage in activities because they find them enjoyable [54]. Huang (2014) defined PE as the degree to which using technology is regarded to be enjoyable in and of itself, independently of any predicted performance effects [55]. PE in this study relates to how enjoyable or engaging M-learning is to a rural high school student or instructor [56]. Perceived enjoyment is an example of intrinsic motivation, and it has a significant influence on use intention [57]. Making learning activities more pleasurable can help rural high school technology students and instructors adopt and employ M-learning [58]. The reasoning for this is because teachers and students who love using M-learning are more psychologically prepared to utilize it widely than those who do not [59,60].

3.4. TTF

According to Goodhue and Thompson (1995), in terms of task-technology fit (TTF), the characteristics of technology are fitted with their task features just when people will accept a technology. Although people may observe that a technology is valuable, they cannot increase their performance if it is not properly matched with the task at hand [60]. Mobile learning technologies are often developed to enable users to conduct various learning-related tasks in an efficient manner. Therefore, task-technology fit is significant to explore M-learning acceptance from combining different views to the fit based on technology. The task technology fit may be assessed considering the individual’s satisfaction level with the extent to which a system’s operational activities meet his/her task needs [61,62,63]. The task-technology fit entails the association between task requirements, individual abilities and the functionality of the mobile technology system [64]. Furthermore, task-technology fit has been linked to the criterion of personal performance, which can be used in the larger context of considering the impact of information technology on individual performance [61,65].

3.5. PR

A perceived resource is defined as the extent to which an individual believes that “he or she has the personal and organizational resources needed to use an information system” [66]. The usage of mobile learning refers to the delivery of learning to students anytime from any location via the use of mobile devices (e.g., personal digital assistants, cellular phones or portable computers). When they are away from their normal place of learning, students can interact with educational resources by using mobile learning [67]. Mobile learning users can better design and justify their activities by utilizing a well-validated instrument, especially if they commit a significant portion of their resources to these activities [68]. The effect of a perceived resource on ATT was discovered to be favorable [69,70]. Researchers examined the impacts of resource availability on teachers’ adoption of ICT in the classroom in the studies [44,71]. They discovered that a scarcity of laptops and peer computer technical help hampered the adoption of ICT in the classroom. Mboweni [72] discovered that the majority of rural parents are financially disadvantaged and rely on social assistance. Money is needed to purchase equipment and data for M-learning. According to the findings of [73,74], rural parents’ PR has an impact on their willingness to utilize M-learning and actual BIM [75].

3.6. ATT Using M-Learning

In the context of technology adoption research, attitude is defined as an individual’s whole emotional reaction to the use of a new technology. According to the TAM paradigm, attitude is described as an individual’s positive or negative sentiments about performing the target behavior. Personal attitudes have a significant factor in determining how individuals use information technology [76]. The term “attitude” in this study refers to how eager students are to use mobile devices for language learning [77]. This was a departure from previous information technology acceptance theories and models including TRA, TPB, DTPB and TAM [78,79]. Empirical evidence from later studies also revealed that attitude has a significant impact on technology adoption. Attitude has been shown to have a direct effect on behavioral intention [80], as well as moderating the effects of performance expectations, effort expectation, social influence and behavior use [81,82]. In this study, we explore attitude towards M-learning to determine the actual use of M-learning for educational sustainability.

3.7. BIM M-Learning

The cognitive picture of a person’s preparedness to carry out a certain act was described is behavioral intention [82,83]. System adoption and consequently actual utilization are predicted by behavioral intention [81]. The behavioral intention of teachers or learners to use M-learning has been demonstrated to be substantially correlated with system acceptability and consequently utilization [84]. This study focused on forecasting M-learning acceptability in rural regions where it was not yet in use, resulting in no real M-learning usage [85]. As a result, the actual utilization of the notion was not incorporated in the study’s model. Seyal et al. [86], in their study to examine students’ attitude toward M-learning, found that there is a positive effect from the perceived ease of use and ease of use on the students’ intention to use mobile learning. On the other hand, behavioral intention is regarded to be the best single predictor of information system use [42,87]. According to Davis and Venkatesh [42,87], knowing the characteristics that predict the BIM M-learning of rural high school technology learners, their instructors and their parents leads to understanding the elements that predict M-learning acceptability and MLS.

3.8. MLS—Mobile Leanring as Sustainability

Due to a lack of clarity on how to evaluate the construct, M-learning was seldom included in prior TAM research [31,88]. Objective and subjective metrics can be used in general [89]. The former requires maintaining track of real-time technology/system usage, such as data from system logs, logins and system engagements [90]. On the other hand, the latter relates to customers’ self-reported technology usage, which might be influenced by response bias. Because students’ self-reported usage of mobile devices for M-learning might occur both in the classroom and in their own learning contexts where access to real-time data is limited, the current study focused on their usage behavior [91]. As a result, the present study will look at the nature and scope of the link between M-learning’s long-term sustainability and students’ academic performance.

4. Research Methodology

The analysis was divided into two phases to meet all of the research objectives. The first step, data collection, included a questionnaire survey of students at UTHM University of Malaysia. This research looked at how M-learning can impact using M-learning in higher education as a representative area of study at university, both in terms of ATT M-learning and BIM M-learning. Students were chosen because of the rising importance and relevance of M-learning in this discipline. The prepared questionnaire consisted of two main parts. The first part of the questionnaire consisted of a set of questions related to the respondent’s demographic information, such as gender, age group, major and usage of mobile applications on mobile devices. The second part contained statements related to the factors that influence M-learning acceptance and adoption. These statements were carefully chosen with the aim of testing the students’ acceptance and adoption of M-learning technology. All obtained data, including TAM components and demographic data, were evaluated using a 5-point Likert scale, with Strongly Agree (5), Agree (4), Undecided (3), Disagree (2) and Strongly Disagree (1) being used to measure the items in this part. All of these statements had been selected from the literature from previous studies in the same field (M-learning). Appendix A shows all constructs, items and their sources (see Appendix A for more information). The data were analyzed using IBM SPSS and Structural Equation Modeling (SEM-Amos). The main statistical techniques used were IBM SPSS and SEM-Amos. Constructing the validity of the measures, the convergent validity of the measurements and the discriminant validity of the calculations were all examined in the structural model that is recommended for this method [92].

4.1. Sample Characteristics and Data Collection

A total of 215 questionnaires were circulated, of which 200 were sent back by respondents, demonstrating a 93% return rate. In this study, a quantitative approach was employed using a questionnaire survey. The data collection was performed during March–April 2021 by distributing self-administrated questionnaires among students at Universiti Tun Hussein Onn Malaysia (UTHM) in Malaysia. According to Krejcie and Morgan [93], the table of sampling respondents should include 2021 academic students and 420 from four specializations: social science, engineering, science and technology, management and others. Because 2021 is very close to 420, the researcher approximated the statistics to give a sample of 200. Since the sample consists of students with different ethnicities, cultures and religions from different parts in Malaysia, this study represented the different religions and ethnicities of Malaysia’s population. Thus, the Malaysian context can be generalized from this finding. When compared to other students in higher education, the convenience sample representatives have higher probability to be the first group of students to adapt to M-learning. By collecting data from them, it can help to ensure the validity of sample selection in this study. With the approval of the participating university, the survey was distributed to various classes in one of the public universities in Malaysia. To test the theoretically developed model, data were collected from currently enrolled students of UTHM using a structured physically survey. The sample size was determined by using the following formula.
s s = x 2 ( p ) ( q ) e 2  
where SS = sample size; Z = 1.40 (95% confidence level); P = prevalence level (0.5 used for sample size needed); Q = (1 − p); E = error term (0.05). By inserting values into the formula, the sample size would be:
s s = 1.40 2   ( 0.50 ) ( 0.50 ) 0.05 2
s s = 1.96   ( 0.25 ) 0.0025
s s = 0.49 0.0025
ss = 196
Sample size plays an important role in the estimation and interpretation of SEM results [94]. In general, the literature suggests that sample sizes for structural equation models commonly run in the 200 to 400 range for models with 10 to 15 indicators. At least 100 cases are required for SEM, preferably 200 [95]. With more than 10 variables, sample sizes under 200 generally cause parameter estimates to be unstable and the tests of statistical significance to lack power.
The questionnaires were evaluated and 15 were not returned and thus excluded. The respondents’ demographic details are as follows. A total of 200 completed questionnaires were obtained from students, of whom 138 (69.0%) were male and 62 (31.0%) were female. From the respondents, 11 (5.5%) were in the age range of 18–22, 51 (25.5%) were in the age range of 23–29, 79 (39.5%) were in the age range of 30–35, 37 (18.5%) were in the age range of 36–40, and 22 (11.0%) were over 41 years of age. The distribution of respondents based on specialization was as follows: 23 respondents were from engineering (11.5%), 91 respondents were from management (45.5%), 45 respondents were from science and technology (22.5%), 32 respondents were from social science (16.0%) and 9 respondents were from other specializations (4.5%). Regarding the frequency of mobile learning used, 159 (79.5%) of the participants indicated that they use mobile learning several times a day, 19 (9.5%) of the participants indicated that they use mobile learning once a day, 17 (8.5%) of the participants indicated that they use mobile learning several times in a month and 5 (2.5%) of the respondents indicated that they use mobile learning once in a month. The demographic profile, which includes gender, age, specialization and usage of mobile applications, is shown in Table 1.

4.2. Measurement Instruments

As previously mentioned, 215 sample questionnaires were distributed to university students, with 200 of them proving to be useful. The construction elements used in previous studies verified the validity of the material of the measuring scales. The study’s questionnaire items were calculated as follows: PU (PU) adapted 5 items from [96,97], PEU adapted 5 items from [96,97], PE adapted 5 items from [98,99], task-technology fit adapted 5 items from [61,100], PR was a 5-item adaptation from [74,89,101], ATT M-learning was a 5-item adaptation from [102,103], BIM M-learning (BIM) was a 5-item adaptation from [69,102,104] and finally, MLS (M-learning as sustainability) adapted 6 items from [102,104].

4.3. Normality Testing

The normality of the distribution was validated based on skewness and kurtosis as well as histogram, normal P–P plots and Kolmogorov–Smirnov test, whereas the linearity and homoscedasticity were verified based on R2 of the matrix scatter plot and scatter plot of standardized residual and predicted values, respectively. Finally, normality was based on the values of Variance Inflation Factor (VIF < 10) and Tolerance (>0.1) as well as Pearson’s product-moment correlation coefficients of less than 0.90 (see Table 2 and Table 3).

5. Result and Analysis

The associated factors influenced ATT M-learning and BIM for M-learning considering use behavior. As a result, all the variables meet the criteria of the Cronbach alpha coefficient ranging between 0.70 and 0.90. Cronbach’s reliability coefficient of 0.971 is discussed in the reliability analysis. The study also tested the discriminant validity according to three criteria: the index value of the variable is below 0.80 [92], the average variance extracted rate is assumed to be equal to or greater than 0.5 and the AVE square is greater than the factors related to inter-construct correlations (IC) [105,106]. In addition, confirmatory factor loadings were equal to 0.7 and greater. The Cronbach’s alpha and composite reliability rating equal to or greater than 0.70 were accepted [92].
Cronbach’s reliability
After recalculating the item-to-total correlation for all 41 items, the item-to-total correlation values for all the items were found to have a high value above the acceptable limit of 0.3 and the correlation ranged from 0.389 to 0.792. Afterward, Cronbach’s alpha was recalculated, and it was discovered that not only all the research measures had a coefficient alpha value that was significantly higher than the acceptable level of 0.70, ranging from 0.790 to 0.936, but that the coefficient alpha values also showed improved reliability, and the factor loadings of the 41 items were improved. Table 4 illustrates the results of the item-to-total correlation and coefficient alpha (Cronbach alpha) analysis. These findings confirm that the research instruments and scales used in this study possess a high level of reliability and are satisfactory acceptable for conducting further data analysis through inferential statistics to test the research hypothesis.

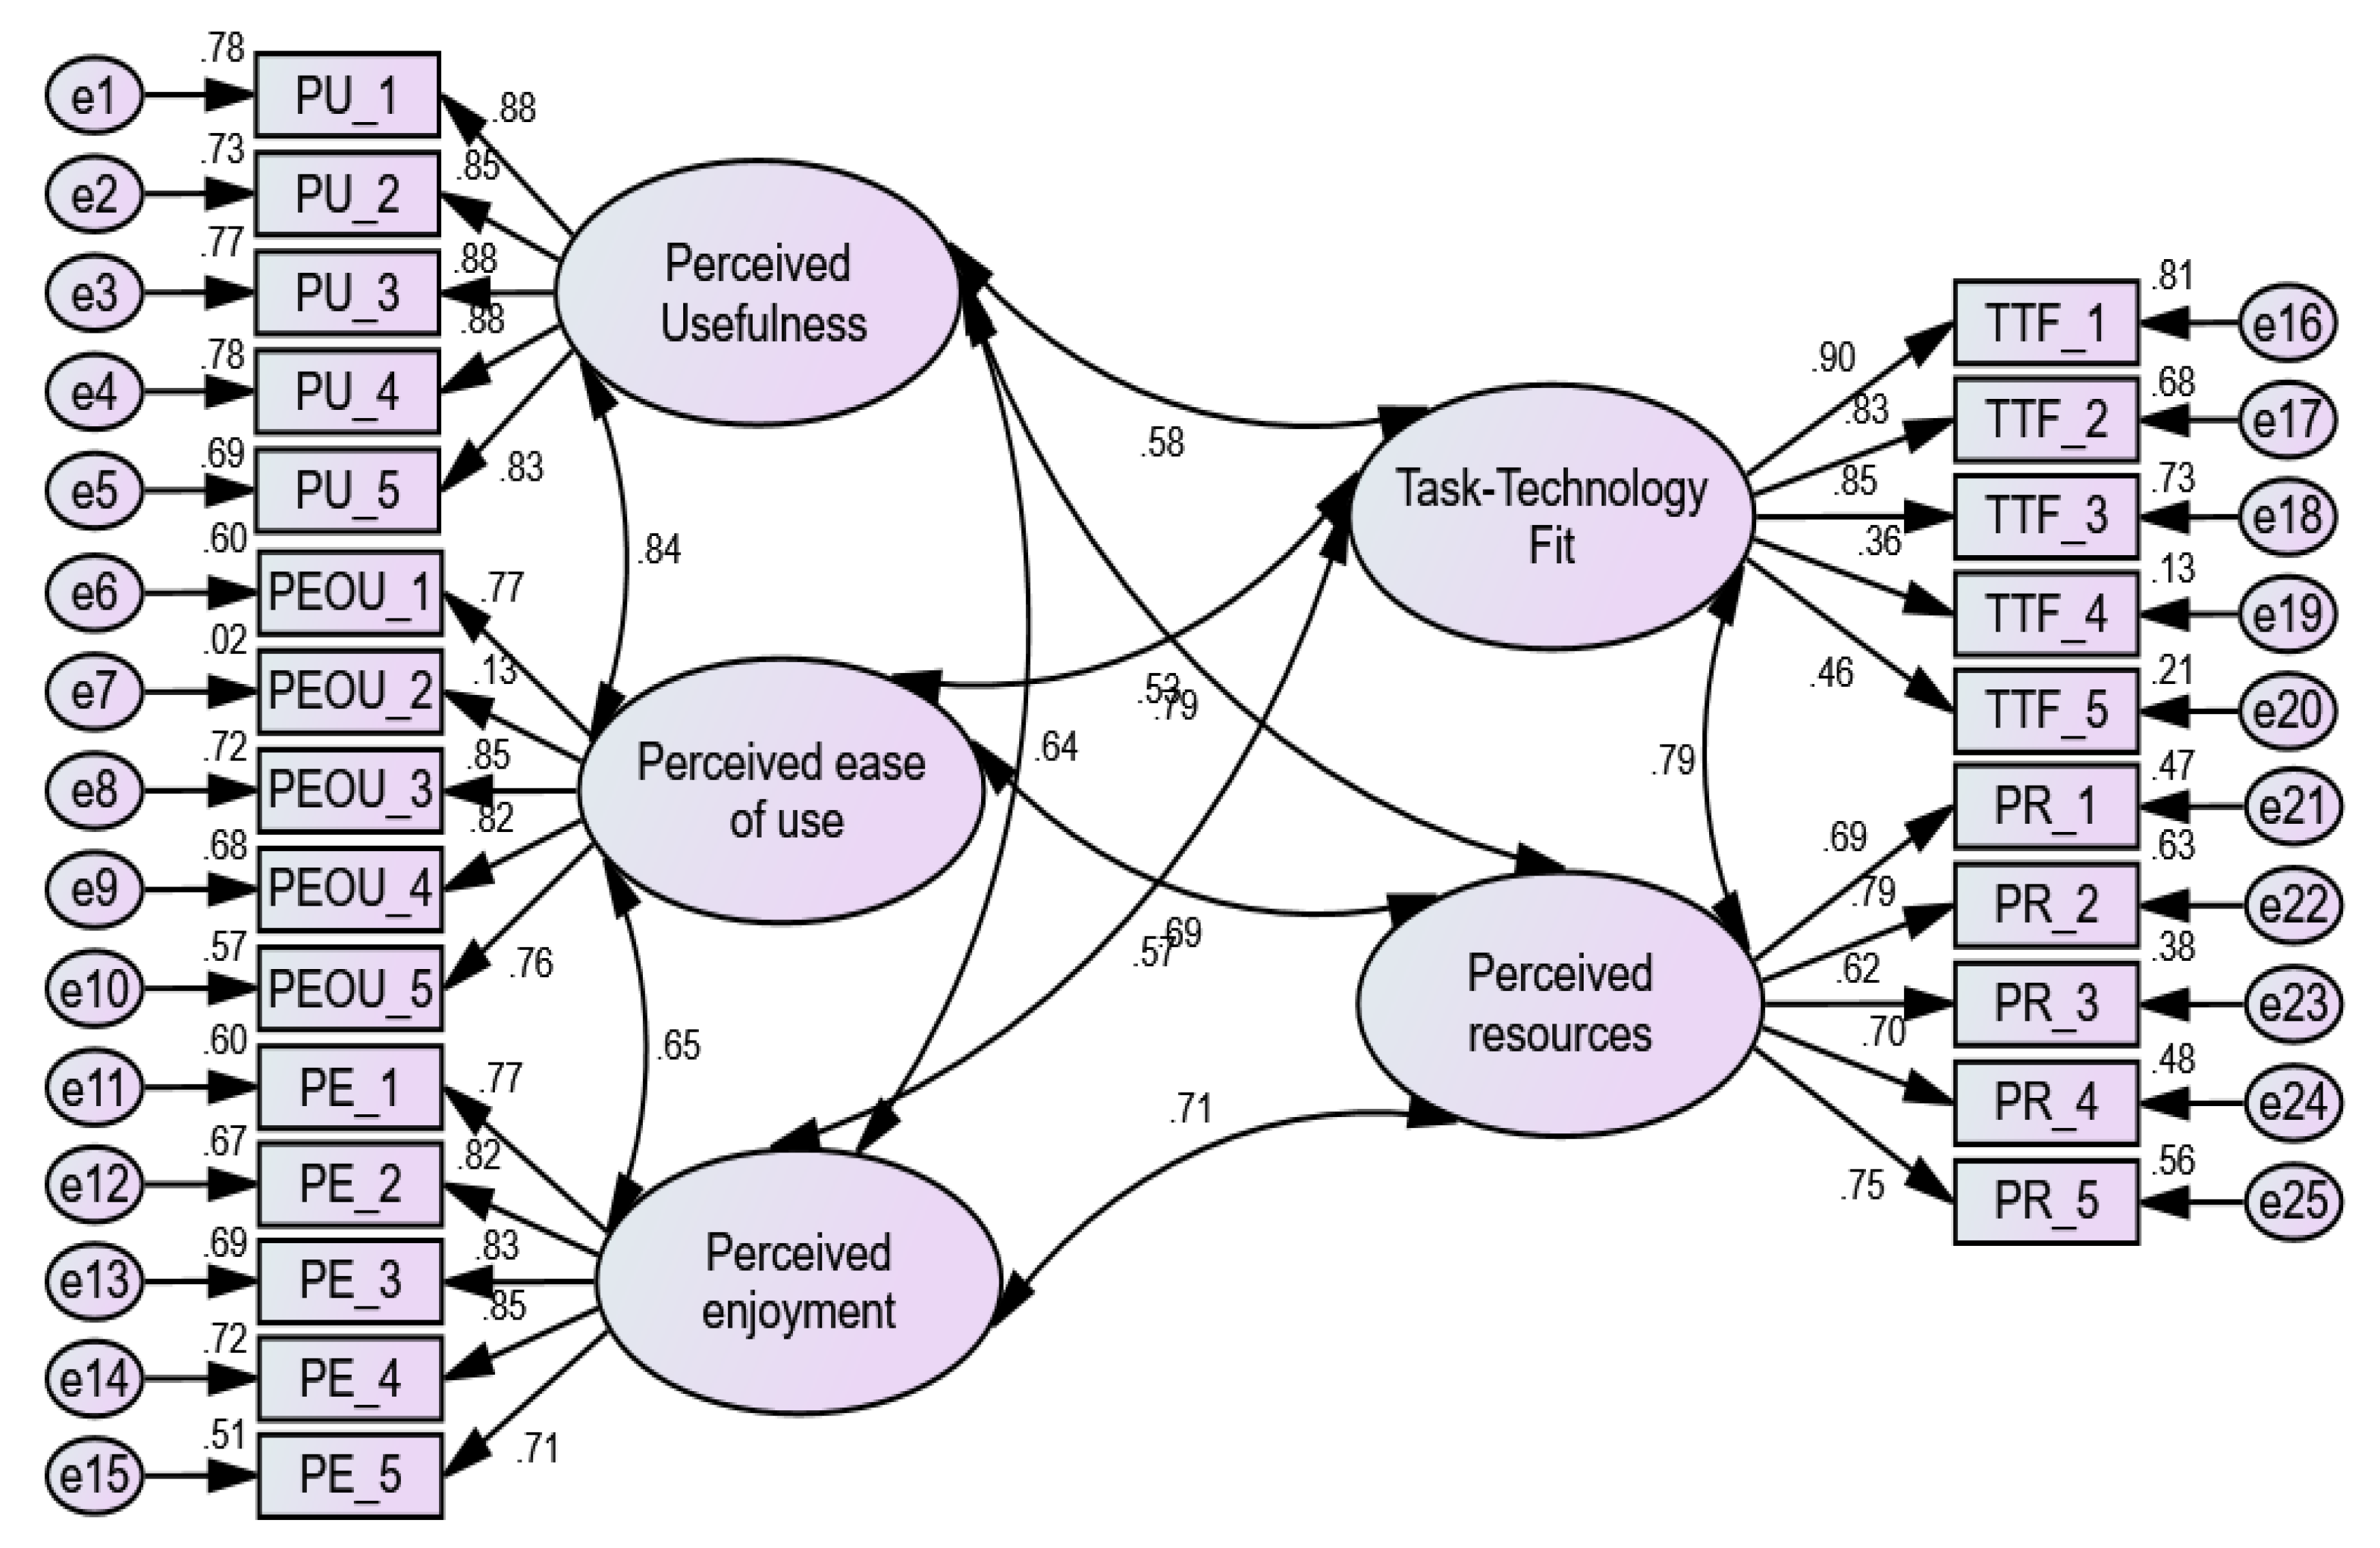
5.1. Measurement Model Analysis

In this research, SEM was used as a key statistical tool in AMOS 23 to evaluate the outcomes based on confirmatory factor analysis (CFA). Discriminating validity, consistency and uni-dimensionality, this model analyzed over convergent [107]. Furthermore, Hair et al. [92,108] suggested that the score model be measured using “goodness-of-fit” strategies, such as chi-square, standard chi-square, the IFI (Incremental-Fit Index), the relative fit index (RFI) and the Tucker-Lewis coefficient (TLI). The model fits well when the comparative fit index (CFI) is equal to or greater than 0.90. In addition, the root mean square approximation error (RMSEA) that satisfies the proposed criterion as suggested by [92,109] is less than or equal to 0.08 to support the required suit, and the residual root mean quarter residual (RMR) is accepted, as shown in Table 5. The suitability indexes that confirm the model, specifically CR and CA, meet all requirements and AVE are accepted. In addition, the AVE values ranged from 0.501 to 0.748, above the estimated value of 0.50, while Cronbach’s alpha values varied from 0.790 to 0.936, all over 0.70. The TAM measurement theory is seen in Figure 2. Furthermore, as indicated in Table 6, for the dependent variables and assessment of the mediator described in Figure 3, constructs, items and confirmatory factor analysis yields factor loading of 0.5 or above is acceptable [92,105,107].

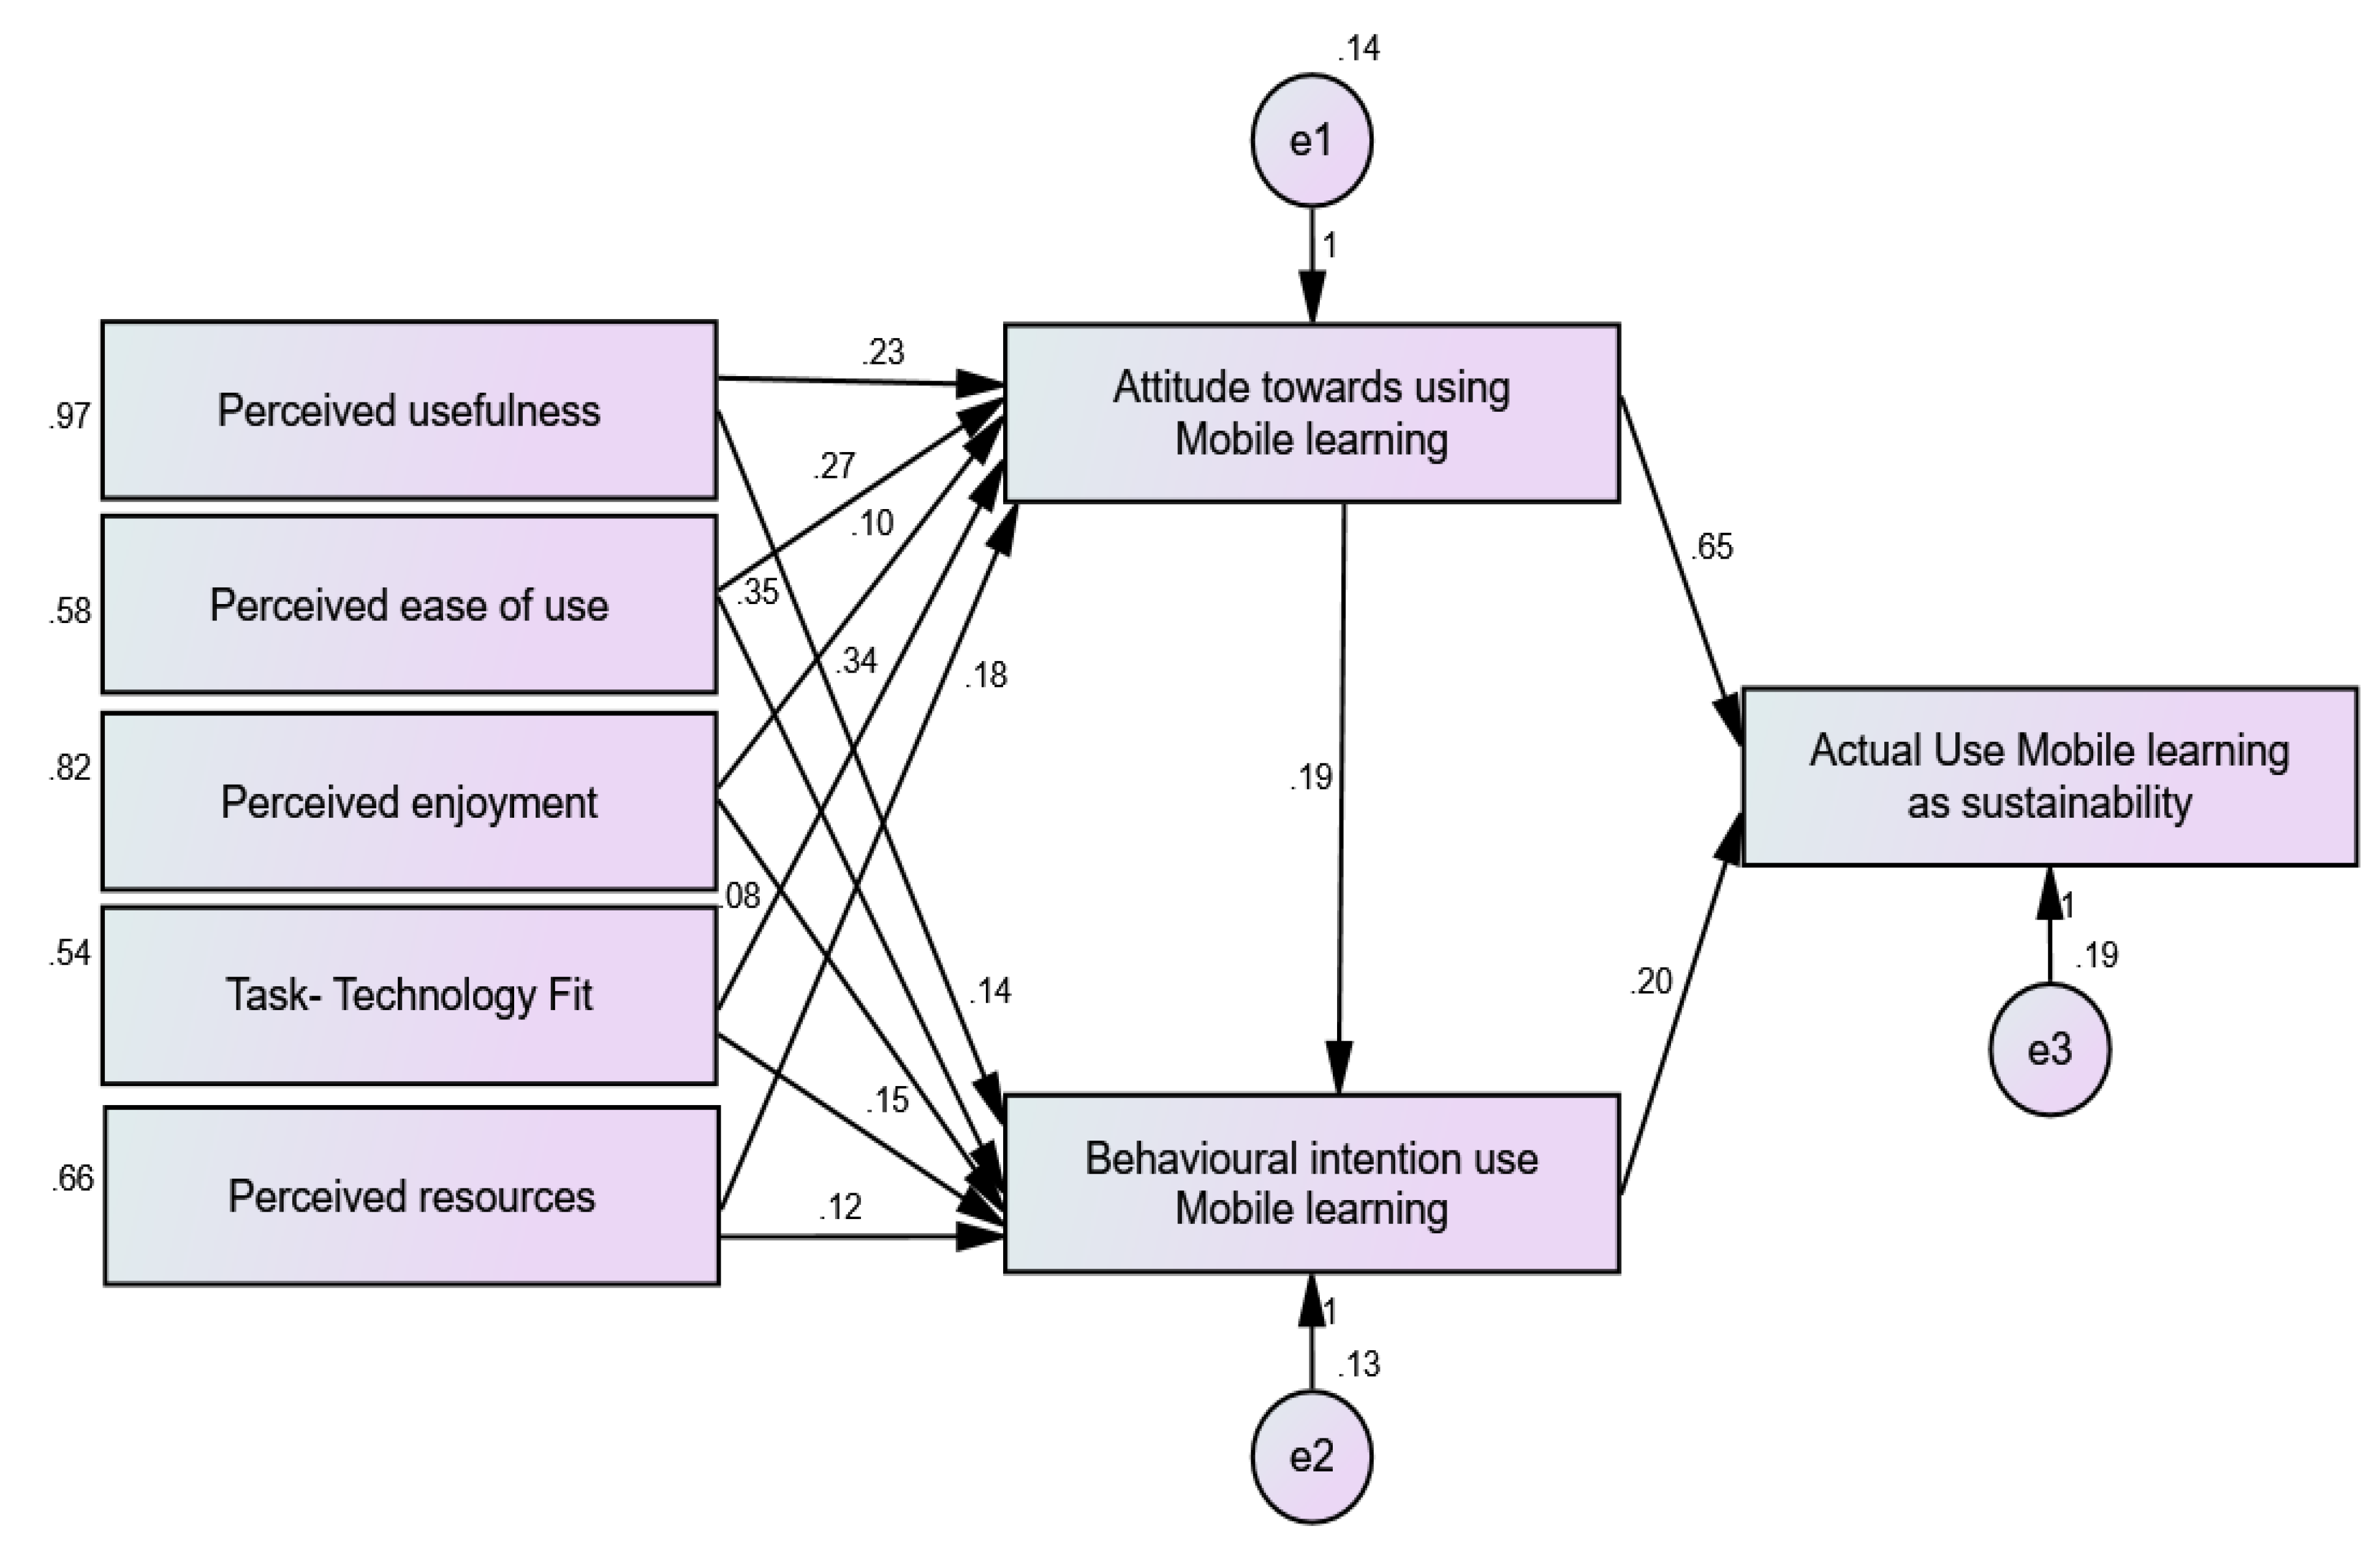
5.2. Structural Equation Model Analysis

A path modeling study was used to investigate the impact of task-technology fit and PR variables on use behavior, as well as the impact of TAM model variables on M-learning usage for ATT M-learning and BIM M-learning. In accordance with the hypothesis testing results, the results are presented and explained. The authors used CFA to evaluate the structural equation model in the following phase of the process. As a result, Figure 4 depicts the structural model and indicates that all thirteen assumptions between the thirteen key constructs were accepted. The structural model is depicted in Table 7 it is clear from the table that the model’s major statistics are excellent, indicating that it is a feasible model and suitability for testing the hypotheses. The results of this study show that M-learning has a positive influence on real use of M-learning as a long-term adoption model in education, and that all of the assumptions were correct. Furthermore, the data support hypotheses concerning the directional relationship between the model’s variables as well as the structural model. Table 7 and Figure 4 displays the parameters of the unstandardized coefficients as well as the standard errors of the structural model.

5.3. Results of Hypothesis Testing

Table 7 and Figure 4 demonstrate that PU is positively and substantially associated to attitudes toward M-learning (β = 0.232, t = 5.058, p < 0.001). As a result, Hypothesis 1 is validated, demonstrating that the usage of M-learning has an influence on PU and attitudes toward using M-learning for education. Furthermore, PU was shown to be positively and substantially associated with BIM M-learning (β = 0.136, t = 2.908, p < 0.001). As a result, Hypothesis 2 holds true, demonstrating that M-learning has an influence on PU and BIM. In addition, the findings revealed that PEU was positively and substantially connected to ATT M-learning (β = 0.274, t = 5.215, p < 0.001). As a result, Hypothesis 3 is validated, demonstrating that M-learning has an influence on PEU and attitudes toward using M-learning in the classroom. Furthermore, the findings revealed that PEU was positively and substantially associated with BIM M-learning (β = 0.349, t = 6.485, p < 0.001). As a result, Hypothesis 4 is validated, demonstrating that the PEU of M-learning has an influence on BIM it. Moving on to the fifth hypothesis, the findings reveal that PE is positively and substantially associated to ATT M-learning (β = 0.096, t = 2.411, p < 0.001). As a result, Hypothesis 5 is validated, demonstrating that the convenience of using M-learning influences students’ attitudes toward using M-learning for education. Similarly, the results demonstrate that BIM M-learning is positively and substantially associated with PE (B = 0.083, t = 2.120, p < 0.001). As a result, Hypothesis 6 is confirmed. The seventh hypothesis indicated that task-technology fit was positively and substantially associated with attitudes toward M-learning (β = 0.336, t = 7.049, p < 0.001). As a result, Hypothesis 7 is validated, suggesting the simplicity with which M-learning may be used for educational purposes. Hypothesis 8 validated that task-technology fit was positively and substantially associated with BIM M-learning (β = 0.145, t = 2.840, p < 0.001). As a result, Hypothesis 8 is validated, implying that BIM M-learning is beneficial for task-technology fit adoption in education. The findings also reveal that PR are favorably and substantially associated with attitudes toward M-learning (β = 0.180, t = 3.409, p < 0.001). As a result, Hypothesis 9 is accepted. Similarly, Hypothesis 10 found a positive and significant relationship between PR and BIM M-learning (β = 0.119, t = 2.291, p < 0.001). As a result, Hypothesis 10 is confirmed, demonstrating that BIM M-learning is beneficial to perceived educational resources. Moving on to the model’s mediator components, the findings demonstrate that BIM M-learning is positively and substantially associated to ATT using M-learning (B = 0.187, t = 2.751, p < 0.001). As a result, Hypothesis 11 is validated, demonstrating that BIM M-learning has an impact on student attitudes towards M-learning. Furthermore, the findings demonstrate that students’ attitudes towards M-learning are favorably and substantially connected to their MLS of M-learning as a source of sustainability (B = 0.647, t = 9.936, p < 0.001). As a result, Hypothesis 12 is validated, demonstrating that behavioral intention to use M-learning has an impact on student attitudes toward M-learning. Finally, Hypothesis 13 stated that BIM M-learning for sustainability is positively and substantially connected to MLS (β = 0.199, t = 2.869, p < 0.001). As a result, Hypothesis 14 is validated, suggesting that the relationship between BIM M-learning and MLS favorably influences the adoption of MLS for educational sustainability (see Table 7).

6. Discussion and Implementation

All hypotheses had a significant positive influence on MLS, according to the study’s findings, via ATT using M-learning and BIM M-learning. Similar findings have been observed in previous studies on technology adoption [110] and in the context of mobile services [6]. In addition, the traits demonstrated a strong direct relationship with M-learning attitudes and BIM M-learning. This might be due to the fact that students rely more on the M-learning version that is already installed on their computers, and therefore their perceptions of use are both accurate and skewed. Intentions to use M-learning are also boosted by these factors. Increased PU leads to more M-learning use because of the nature of the link. A lot of researchers have looked at the significance of PU in the context of M-learning. The findings of this investigation corroborate those of other studies [111,112,113,114,115,116]. In the context of education, the findings also provide two key contributions to the TAM model [117]. As a result, they recommend boosting M-learning adoption for education, as well as PU, ease of use, enjoyment, task-technology fit and PR, in order to improve students’ use of M-learning for education. Managers should also assist students in adopting M-learning for educational purposes. When compared to face-to-face courses, previous researchers found evidence of a positive impact on MLS, noting that the majority of students reported positive perceptions in their courses, including increased ATT using M-learning, BIM M-learning and information exchange. This study makes theoretical, implementation and empirical contributions in a variety of fields. In the context of Malaysia’s usage of M-learning for education, it is worth mentioning that theories originate from and are positioned inside practice, which acts as a foundation for the development of new ideas and practices. It should be noted that this might be the first time the TAM theory has been used in Malaysian higher education, primarily to explore the impact of students’ attitudes and behavioral intentions towards M-learning for educational sustainability.
Previous research [111,113,114,116,118,119,120] has looked into the use of a mobile phone for learning and found that PU, PEU, attitude, social influence and facilitating conditions are the most important constructs and explanatory variables for M-learning system adoption. The current study finds that just six elements (PU, PEU, task-technology fit, PR, ATT using M-learning and BIM) are the most relevant elements in M-learning adoption. As a result, the research model identifies TTF and TAM variables as having the largest impact on student academic performance by using M-learning as sustainability for an educational strategy. Among the constructs examined in the modified TAM model, attitude toward actual use of mobile learning for education sustainability was found to be the most powerful predictor of students’ behavior intention to use mobile learning and to partially mediate the effects of all the exogenous variables on behavioral intention. Therefore, it was found in this study that attitude did directly influence learners’ actual use of mobile learning for education sustainability; its effect on the use behavior was fully mediated by learners’ behavioral intention to use M-learning. These findings implied that once students became aware of the effectiveness of mobile devices and the ease with which they could use them for learning, as well as the availability of the technical and organizational support and the influence from others, they would form a positive attitude toward M-learning and subsequently the intention to use it. Moreover, the findings of this research strongly support the M-learning system as a sustainability variable, indicating that attitudes towards and intention to use an M-learning system for sustainability has a positive impact on students’ MLS M-learning system for education.

6.1. Limitations of the Research

Regardless of the contribution of this research to the field, its shortcomings must be addressed. We were conscious of the work’s limits. To begin, we only evaluated the study methodology and hypotheses with university students in Malaysia. Consequently, the results’ generalizability to other nations is yet to be determined. Second, due to the small sample size employed, this study may be constrained.

6.2. Conclusion and Future Work

A theoretical model for M-learning was developed and practically evaluated with the help of a thorough literature study. Five constructs were identified as contributing the most to the use of MLS (M-learning as sustainability) by university students, namely PU, PEU, task-technology fit, PR, ATT using M-learning, and BIM M-learning, which were extracted from the technology acceptance model (TAM). So far, no study in Malaysian higher education has used M-learning to analyze attitudes towards it and usage intentions by way of the TAM model. Thus, the use of the TAM model in this research could be considered a major contribution and strongly suggests the use of PU, PEU and PE among universities to encourage students’ adoption of M-learning for educational sustainability. Another point to consider from the study is that it is based on students’ views, which do not necessarily reflect real-world consequences. Future studies should look at planning recommendations for instructors on PE and task-technology fit with the usage of M-learning in many sectors, as well as their favorable judgment of its potential educational application. Future research in this area should consider the views of instructors and other higher education stakeholders on the usage of M-learning in the classroom. Finally, comparing and examining perspectives from and with other nations might help to expand the findings of this study and provide a larger picture of how this issue can be addressed in higher education.

Author Contributions

Conceptualization, A.M.A.-R., W.M.A.-R., U.A. and A.A.; methodology, A.M.A.-R., W.M.A.-R., S.A. and A.A.; software, A.M.A.-R. and W.M.A.-R.; validation, A.M.A.-R., W.M.A.-R., U.A. and A.S.A.-A.; formal analysis, A.M.A.-R. and W.M.A.-R.; investigation, A.M.A.-R., U.A., S.A. and A.A.; resources, A.M.A.-R., U.A., S.A., A.A. and W.M.A.-R.; data curation, A.M.A.-R., W.M.A.-R. and A.A.; writing—original draft preparation, A.M.A.-R., A.A. and W.M.A.-R.; writing review and editing, A.M.A.-R., U.A., S.A., A.A. and A.S.A.-A.; visualization, A.M.A.-R., A.A., U.A., S.A. and W.M.A.-R.; supervision, W.M.A.-R. project administration, A.M.A.-R., W.M.A.-R. and A.A.; funding acquisition, U.A., A.A. and S.A. All authors have read and agreed to the published version of the manuscript.

Funding

The authors extend their appreciation to the Deanship of Scientific Research at King Saud University for funding this work through research group No (RGP-1435-003).

Institutional Review Board Statement

Not applicable.

Informed Consent Statement

Not applicable.

Data Availability Statement

Not applicable.

Acknowledgments

The authors acknowledge the Deanship of Scientific Research at King Saud University for funding this work through research group No (RGP- 1435-003).

Conflicts of Interest

The authors declare no conflict of interest.

Appendix A. Construct Measurements and Sources

Table A1. The questionnaire.
ConstructItemMeasure
Perceived UsefulnessPU1Using mobile learning can save me a lot of time to learn the course materials.
PU2Mobile learning helps me get my work done more quickly.
PU3Mobile learning is easy to operate.
PU4Mobile learning would make me understand the course materials better.
PU5Mobile learning would enhance my teamwork with classmates on group assignments.
Perceived Ease of UsePEOU1Mobile learning makes it easy to access course material for my learning.
PEOU2I would be willing to make use of a mobile learning tool if someone showed me a thorough tutorial.
PEOU3Mobile learning would help me study my courses anywhere and anytime.
PEOU4Using mobile learning is straightforward.
PEOU5It is easy to become skillful at using M-learning.
Perceived EnjoymentPE1I believe that using M-learning will be interesting to me.
PE2I believe that using M-learning system will not be intimidating.
PE3I believe that M-learning will stimulate my curiosity.
PE4I will use the M-learning system for different academic purpose.
PE5I believe M-learning will make me become skillful at using a mobile learning system.
Task-Technology FitTTF1I think that using M-learning is well suited for the way to learn.
TTF2I would like to gain critical thinking skills.
TTF3I would like to solve academic tasks through active engagement with peer students and facilitators.
TTF4M-learning is a good tool to support the way I like to study tasks.
TTF5I would like to learn anytime and anywhere.
Perceived ResourcesPR1I have the resources I would need to use M-learning in my course.
PR2There are no barriers to my using M-learning in my course.
PR3I would be able to use M-learning in my course if I wanted to.
PR4Others can help me with M-learning.
PR5I have access to the resources I would need to use M-learning in my course.
Attitude Towards Using Mobile LearningATT1I believe it is beneficial to use mobile learning to learn technology management.
ATT2I feel positive about using mobile learning for learning.
ATT3My experience with mobile learning to learn technology management will be good.
ATT4I like my technology-related subjects more when I use mobile learning.
ATT5Using M-learning to learn technology-related subjects will be a pleasant experience.
Behavioral Intention to Use Mobile learningBIM1I intend to use the mobile learning system in the future.
BIM2I predict I will use the mobile learning system in the future.
BIM3I plan to use the mobile learning system in the future.
BIM4I will recommend other students to use M-learning technology.
BIM5I would like to use many different mobile applications for learning in the future.
Actual Use of Mobile LearningAUML1I use M-learning daily.
AUML2I plan to use M-learning in my studies.
AUML3I recommend M-learning for others’ use.
AUML4I believe that using M-learning is always a pleasurable experience for me.
AUML5I spend a lot of time on using mobile learning for academic use.
AUML6I use the mobile learning quite often for academic use.

References

  1. Tilbury, D. Learning based change for sustainability: Perspectives and pathways. In Social Learning towards a Sustainable World; Arjen, E.J., Ed.; Wageningen Academic Publishers: Wageningen, The Netherlands, 2007; pp. 117–132. [Google Scholar]
  2. Lopes, A.L.; Almeida, F.; Figueiredo, V. Online-Learning at ISCTE-IUL: Towards a Sustainable Education Paradigm. 2019, pp. 59–66. Available online: https://ciencia.iscte-iul.pt/publications/online-learning-at-iscte-iul-towards-a-sustainable-education-paradigm/59945 (accessed on 17 May 2021).
  3. Setirek, A.C.; Tanrikulu, Z. Significant developmental factors that can affect the sustainability of mobile learning. Procedia Soc. Behav. Sci. 2015, 191, 2089–2096. [Google Scholar] [CrossRef] [Green Version]
  4. Han, I.; Shin, W.S. The use of a mobile learning management system and academic achievement of online students. Comput. Educ. 2016, 102, 79–89. [Google Scholar] [CrossRef]
  5. Sharma, S.K.; Kitchens, F.L. Web services architecture for m-learning. Electron. J. e-Learn. 2004, 2, 203–216. [Google Scholar]
  6. Gao, S.; Krogstie, J.; Siau, K. Adoption of mobile information services: An empirical study. Mob. Inf. Syst. 2014, 10, 147–171. [Google Scholar] [CrossRef] [Green Version]
  7. Naciri, A.; Baba, M.A.; Achbani, A.; Kharbach, A. Mobile learning in Higher education: Unavoidable alternative during COVID-19. Aquademia 2020, 4, ep20016. [Google Scholar] [CrossRef]
  8. Al-Emran, M. Mobile learning during the era of COVID-19. Rev. Virtual Univ. Católica Norte 2020, 61, 1–2. [Google Scholar]
  9. Althunibat, A. Determining the factors influencing students’ intention to use m-learning in Jordan higher education. Comput. Hum. Behav. 2015, 52, 65–71. [Google Scholar] [CrossRef]
  10. Ahmad, N.; Hoda, N.; Alahmari, F. Developing a cloud-based mobile learning adoption model to promote sustainable education. Sustainability 2020, 12, 3126. [Google Scholar] [CrossRef] [Green Version]
  11. Baykasoğlu, A.; Gölcük, İ. Development of a two-phase structural model for evaluating ERP critical success factors along with a case study. Comput. Ind. Eng. 2017, 106, 256–274. [Google Scholar] [CrossRef]
  12. Raut, R.D.; Gardas, B.B.; Jha, M.K.; Priyadarshinee, P. Examining the critical success factors of cloud computing adoption in the MSMEs by using ISM model. J. High. Technol. Manag. Res. 2017, 28, 125–141. [Google Scholar] [CrossRef]
  13. Naveed, Q.N.; Qureshi, M.R.N.; Alsayed, A.O.; Ahmad, N.; Sanober, S.; Shah, A. Assimilating e-learning barriers using an interpretive structural modeling (ISM). In Proceedings of the 4th IEEE International Conference on Engineering Technologies and Applied Sciences (ICETAS), Salmabad, Bahrain, 29 November–1 December 2017; pp. 1–7. [Google Scholar]
  14. Altomonte, S.; Logan, B.; Feisst, M.; Rutherford, P.; Wilson, R. Interactive and situated learning in education for sustainability. Int. J. Sustain. High. Educ. 2016, 17, 417–443. [Google Scholar] [CrossRef]
  15. Al-Emran, M.; Elsherif, H.M.; Shaalan, K. Investigating attitudes towards the use of mobile learning in higher education. Comput. Hum. Behav. 2016, 56, 93–102. [Google Scholar] [CrossRef]
  16. García-Martínez, I.; Fernández-Batanero, J.M.; CobosSanchiz, D.; de la Rosa, A.L. Using mobile devices for improving learning outcomes and teachers’ professionalization. Sustainability 2019, 11, 6917. [Google Scholar] [CrossRef] [Green Version]
  17. Ahmad, N.; Quadri, N.; Qureshi, M.; Alam, M. Relationship modeling of critical success factors for enhancing sustainability and performance in e-learning. Sustainability 2018, 10, 4776. [Google Scholar] [CrossRef] [Green Version]
  18. Orozco-Messana, J.; Martínez-Rubio, J.M. Gonzálvez-Pons, A.M. Sustainable higher education development through technology enhanced learning. Sustainability 2020, 12, 3600. [Google Scholar] [CrossRef]
  19. Yang, J.W.M.; Maresova, P. Sustainable development at higher education in China: A comparative study of students’ perception in public and private universities. Sustainability 2020, 12, 2158. [Google Scholar]
  20. Hossain, S.F.A.; Shan, X.; Nurunnabi, M. Is m-learning a challenge? Students attitudes toward the sustainable learning and performance. Int. J. e-Collab. 2019, 15, 21–37. [Google Scholar]
  21. Ruangvanich, S.; Piriyasurawong, P. Structural equation model of acceptance cloud learning for sustainability usage in higher education institutes. Int. J. Emerg. Technol. Learn. 2019, 14, 18–33. [Google Scholar] [CrossRef] [Green Version]
  22. Chen, I.Y.; Chen, N.S.; Kinshuk. Examining the factors influencing participants’ knowledge sharing behavior in virtual learning communities. J. Educ. Technol. Soc. 2009, 12, 134. [Google Scholar]
  23. Zhan, X.; Sun, D.; Qiang, C.; Song, R.; Wan, Z.H. Propensity score analysis of the impacts of junior secondary students’ participation in engineering practices on their attitudes toward engineering. J. Math. Sci. Technol. Educ. 2019, 15, 11. [Google Scholar]
  24. Kamrozzaman, N.A.; Badusah, J.; Ruzanna, W.M. Development of heutagogy approach in M-learning for sustainability education. Educ. Inf. Technol. 2020, 25, 3035–3047. [Google Scholar] [CrossRef]
  25. Herrador-Alcaide, T.C.; Hernández-Solís, M.; Hontoria, J.F. Online learning tools in the era of m-learning: Utility and attitudes in accounting college students. Sustainability 2020, 12, 5171. [Google Scholar] [CrossRef]
  26. Thao, T.T.P.; Thai, L.D.; Thanh, H.T.; Tran, T.; Vuong, Q.H. Mobile learning for high-school mathematics as a path to better sustainability in a fast-changing society: An exploratory study from Vietnam. Probl. Perspect. Manag. 2020, 17, 392–403. [Google Scholar]
  27. Burmeister, M.; Schmidt-Jacob, S.; Eilks, I. German chemistry teachers’ understanding of sustainability and education for sustainable development—An interview case study. Chem. Educ. Res. Pract. 2013, 14, 169–176. [Google Scholar] [CrossRef]
  28. Aresta, M.; Pedro, L.; Santos, C. Mobile learning and higher education: A theoretical overview. J. Mob. Multimed. 2015, 11, 147–156. [Google Scholar]
  29. Bhardwaj, R.K.; Jain, P.K. Research trends in mobile learning: A global perspective. Collnet. J. Scientometr. Inf. Manag. 2015, 9, 205–224. [Google Scholar] [CrossRef]
  30. Li, R.; Meng, Z.; Tian, M.; Zhang, Z.; Ni, C.; Xiao, W. Examining EFL learners’ individual antecedents on the adoption of automated writing evaluation in China. Comput. Assist. Lang. Learn. 2019, 32, 784–804. [Google Scholar] [CrossRef]
  31. Sánchez-Prieto, J.C.; Hernández-García, Á.; García-Peñalvo, F.J.; Chaparro-Peláez, J.; Olmos-Migueláñez, S. Break the walls! Second-Order barriers and the acceptance of mLearning by first-year pre-service teachers. Comput. Hum. Behav. 2019, 95, 158–167. [Google Scholar] [CrossRef]
  32. Saif, N.; Khan IUShaheen, I. Investigating the impact of mobile application on learning among teachers based on technology acceptance model (TAM). Glob. Educ. Stud. Rev. 2020, 2, 45–54. [Google Scholar] [CrossRef]
  33. Bourgonjon, J.; Valcke, M.; Soetaert, R.; De Wever, B.; Schellens, T. Parental acceptance of digital game-based learning. Comput. Educ. 2011, 57, 1434–1444. [Google Scholar] [CrossRef]
  34. Mutambara, D.; Bayaga, A. Rural-based science, technology, engineering and mathematics teachers’ and learners’ acceptance of mobile learning. S. Afr. J. Inf. Manag. 2020, 22. [Google Scholar] [CrossRef]
  35. Nikou, S.A.; Economides, A.A. Mobile-based micro-learning and assessment: Impact on learning performance and motivation of high school students. J. Comput. Assist. Learn. 2018, 34, 269–278. [Google Scholar] [CrossRef]
  36. Hoi, V.N.; Mu, G.M. Perceived teacher support and students’ acceptance of mobile-assisted language learning: Evidence from Vietnamese higher education context. Br. J. Educ. Technol. 2021, 52, 879–898. [Google Scholar] [CrossRef]
  37. Farley, H.; Murphy, A. Mobile learning in higher education: Moving towards a framework for efficacy and sustainability. Chin. Distance Educ. 2013, 9, 16–24. [Google Scholar]
  38. Alghazi, S.S.; Kamsin, A.; Almaiah, M.A.; Wong, S.Y.; Shuib, L. For sustainable application of mobile learning: An extended UTAUT model to examine the effect of technical factors on the usage of mobile devices as a learning tool. Sustainability 2021, 13, 1856. [Google Scholar] [CrossRef]
  39. Vykydal, D.; Folta, M.; Nenadál, J. A study of quality assessment in higher education within the context of sustainable development: A case study from Czech Republic. Sustainability 2020, 12, 4769. [Google Scholar] [CrossRef]
  40. Samuelsson, I.P.; Park, E. How to educate children for sustainable learning and for a sustainable world. Int. J. Early Child. 2017, 49, 273–285. [Google Scholar] [CrossRef]
  41. Kola, A.J.; Sunday, O.S. Mobile-learning (M-learning) through WhatsApp messaging, Facebook, and YouTube, Nigeria. Educ. J. 2018, 1, 111–121. [Google Scholar]
  42. Davis, F.D. Perceived usefulness, perceived ease of use and user acceptance of information technology. MIS Q. 1989, 13, 319–340. [Google Scholar] [CrossRef] [Green Version]
  43. Al-Rahmi, W.M.; Yahaya, N.; Alamri, M.M.; Aljarboa, N.A.; Kamin, Y.B.; Moafa, F.A. A model of factors affecting cyber bullying behaviors among university students. IEEE Access 2018, 7, 2978–2985. [Google Scholar] [CrossRef]
  44. Davis, F.D.; Bagozzi, R.P.; Warshaw, P.R. User acceptance of computer technology: A comparison of two theoretical models. Manag. Sci. 1989, 35, 982–1003. [Google Scholar] [CrossRef] [Green Version]
  45. Alalwan, N.; Al-Rahmi, W.M.; Alfarraj, O.; Alzahrani, A.; Yahaya, N.; Al-Rahmi, A.M. Integrated three theories to develop a model of factors affecting students’ academic performance in higher education. IEEE Access 2019, 7, 98725–98742. [Google Scholar] [CrossRef]
  46. Cheng, S.C.; Hwang, G.J.; Chen, C.H. From reflective observation to active learning: A mobile experiential learning approach for environmental science education. Br. J. Educ. Technol. 2019, 50, 2251–2270. [Google Scholar] [CrossRef]
  47. Yorganci, S. Investigating students’ self-efficacy and attitudes towards the use of mobile learning. J. Educ. Pract. 2017, 8, 181–185. [Google Scholar]
  48. Mutambara, D.; Bayaga, A. Understanding rural parents’ behavioral intention to allow their children to use mobile learning. In Conference on E-Business, E-Services and E-Society; Springer: Berlin/Heidelberg, Germany, 2020; pp. 520–531. [Google Scholar]
  49. Al-Rahmi, A.M.; Ramin, A.K.; Alamri, M.M.; Al-Rahmi, W.M.; Yahaya, N.; Abualrejal, H.; Al-Maatouk, Q. Evaluating the intended use of Decision Support System (DSS) via academic staff: An applying Technology Acceptance Model (TAM). Int. J. Recent Technol. Eng. 2019, 8, 268–275. [Google Scholar]
  50. Asmi, F.; Zhou, R.; He, T.; Han, F. Factors affecting customer satisfaction and intentions to adopt m-service in China. In Proceedings of the 2016 IEEE 13th International Conference on E-Business Engineering (ICEBE), Macau, China, 4–6 November 2016; pp. 305–310. [Google Scholar]
  51. Pe-Than, E.P.P.; Goh, D.H.L.; Lee, C.S. Making work fun: Investigating antecedents of perceived enjoyment in human computation games for information sharing. Comput. Hum. Behav. 2014, 39, 88–99. [Google Scholar] [CrossRef]
  52. Van der Heijden, H. Factors influencing the usage of websites: The case of a generic portal in The Netherlands. Inf. Manag. 2003, 40, 541–549. [Google Scholar] [CrossRef] [Green Version]
  53. Hsu, C.L.; Lin, J.C.C. Acceptance of blog usage: The roles of technology acceptance, social influence and knowledge sharing motivation. Inf. Manag. 2008, 45, 65–74. [Google Scholar] [CrossRef]
  54. Huang, Y. Empirical Analysis on Factors Impacting Mobile Learning Acceptance in Higher Engineering Education. Doctor Dissertation, University of Tennessee, Knoxville, TN, USA, 2014. [Google Scholar]
  55. Ahn, S. Korean EFL college students’ acceptance of smartphone applications for english language learning. In CALL Theory Applications for Online TESOL Education; IGI Global: Hershey, PA, USA, 2021; pp. 100–126. [Google Scholar]
  56. Aznar-Díaz, I.; Hinojo-Lucena, F.J.; Caceres-Reche, M.P.; Romero-Rodríguez, J.M. Analysis of the determining factors of good teaching practices of mobile learning at the Spanish University. An explanatory model. Comput. Educ. 2020, 159, 104007. [Google Scholar] [CrossRef]
  57. Mubuuke, A.G.; Louw, A.J.; Van Schalkwyk, S. Cognitive and social factors influencing students׳ response and utilization of facilitator feedback in a problem based learning context. Health Prof. Educ. 2017, 3, 85–98. [Google Scholar] [CrossRef] [Green Version]
  58. Nurkhin, A.; Saputro, I.H. Teacher’s intention to use online learning; an extended technology acceptance model (TAM) investigation. In Proceedings of the Annual Conference on Science and Technology Research (ACOSTER), Medan, Indonesia, 20–21 June 2020; IOP Publishing: Bristol, UK, 2020; Volume 1783, p. 012123. [Google Scholar]
  59. Darvishi, M.; Seif, M.H.; Sarmadi, M.R.; Farajollahi, M. An investigation into the factors affecting perceived enjoyment of learning in augmented reality: A path analysis. Interdiscip. J. Virtual Learn. Med. Sci. 2020, 11, 224–235. [Google Scholar]
  60. Qashou, A. Influencing factors in M-learning adoption in higher education. Educ. Inf. Technol. 2021, 26, 1755–1785. [Google Scholar] [CrossRef]
  61. Goodhue, D.L.; Thompson, R.L. Task-technology fit and individual performance. MIS Q. 1995, 19, 213–236. [Google Scholar] [CrossRef]
  62. Bere, A. Applying an extended task-technology fit for establishing determinants of mobile learning: An instant messaging initiative. J. Inf. Syst. Educ. 2018, 29, 239–252. [Google Scholar]
  63. Al-Rahmi, A.M.; Shamsuddin, A.; Alismaiel, O.A. Task-technology fit model: The factors affecting students’ academic performance in higher education. Univers. J. Educ. Res. 2020, 8, 6831–6843. [Google Scholar] [CrossRef]
  64. Hizam, S.M.; Akter, H.; Sentosa, I.; Ahmed, W. Digital competency of educators in the virtual learning environment: A structural equation modeling analysis. In IOP Conference Series: Earth and Environmental Science; IOP Publishing: Bristol, UK, 2021; Volume 704, p. 12023. [Google Scholar]
  65. Chipangura, B. Conceptualizing factors that influence south african students’ intention to choose mobile devices as tools for learning. In International Conference on Innovative Technologies and Learning; Springer: Cham, Switzerland, 2019; pp. 537–546. [Google Scholar]
  66. Mathieson, K.; Peacock, E.; Chin, W.W. Extending the technology acceptance model: The influence of perceived user resources. ACM SIGMIS Database Database Adv. Inf. Syst. 2001, 32, 86–112. [Google Scholar] [CrossRef]
  67. Hwang, G.J.; Tsai, C.C. Research trends in mobile and ubiquitous learning: A review of publications in selected journals from 2001 to 2010. Br. J. Educ. Technol. 2011, 42, E65–E70. [Google Scholar] [CrossRef]
  68. Lin, H.H.; Wang, Y.S.; Li, C.R. Assessing mobile learning systems success. Int. J. Inf. Educ. Technol. 2016, 6, 576. [Google Scholar] [CrossRef] [Green Version]
  69. Chung, H.H.; Chen, S.C.; Kuo, M.H. A study of EFL college students’ acceptance of mobile learning. Procedia Soc. Behav. Sci. 2015, 176, 333–339. [Google Scholar] [CrossRef] [Green Version]
  70. Batmetan, J.R.; Palilingan, V.R. Higher education students’ behaviour to adopt mobile learning. In IOP Conference Series: Materials Science and Engineering; IOP Publishing: Bristol, UK, 2018; Volume 306, p. 12067. [Google Scholar]
  71. Al-Rahmi, W.M.; Alzahrani, A.I.; Yahaya, N.; Alalwan, N.; Kamin, Y.B. Digital communication: Information and communication technology (ICT) usage for education sustainability. Sustainability 2020, 12, 5052. [Google Scholar] [CrossRef]
  72. Mboweni, L. Challenges and Factors Contributing to Learner Absenteeism in Selected Primary Schools in Acornhoek. Doctor Dissertation, University of South Africa, Pretoria, South Africa, 2014. [Google Scholar]
  73. Alenazy, W.M.; Al-Rahmi, W.M.; Khan, M.S. Validation of TAM model on social media use for collaborative learning to enhance collaborative authoring. IEEE Access 2019, 7, 71550–71562. [Google Scholar] [CrossRef]
  74. Sivo, S.A.; Ku, C.H.; Acharya, P. Understanding how university student perceptions of resources affect technology acceptance in online learning courses. Australas. J. Educ. Technol. 2018, 34. [Google Scholar] [CrossRef]
  75. Nurkhin, A.; Arief, S.; Kardoyo, K. The determinant of student’s intention to use mobile learning. PEOPLE Int. J. Soc. Sci. 2015, 1, 102–117. [Google Scholar]
  76. Fishbein, M.; Ajzen, I. Belief, attitude, intention, and behavior: An introduction to theory and research. Philos. Rhetor. 1977, 10, 130–132. [Google Scholar]
  77. Ardies, J.; De Maeyer, S.; Gijbels, D.; van Keulen, H. Students attitudes towards technology. Int. J. Technol. Des. Educ. 2015, 25, 43–65. [Google Scholar] [CrossRef]
  78. Guo, B.; Zhou, S. Re-examining the role of attitude in information system acceptance: A model from the satisfaction–dissatisfaction perspective. Enterp. Inf. Syst. 2016, 10, 444–466. [Google Scholar] [CrossRef]
  79. Al-Rahmi, W.M.; Yahaya, N.; Aldraiweesh, A.A.; Alturki, U.; Alamri, M.M.; Saud, M.S.B.; Alhamed, O.A. Big data adoption and knowledge management sharing: An empirical investigation on their adoption and sustainability as a purpose of education. IEEE Access 2019, 7, 47245–47258. [Google Scholar] [CrossRef]
  80. Ajzen, I. The theory of planned behavior. Organ. Behav. Hum. Decis. Process. 1991, 50, 179–211. [Google Scholar] [CrossRef]
  81. Alharthi, S.H.; Awaji, M.H.; Levy, Y. Empirical Assessment of the Factors that Influence Instructors’ Usage of E-Learning Systems in Saudi Arabia; Nova Southeastern University: Fort Lauderdale, FL, USA, 2017. [Google Scholar]
  82. Alamri, M.M.; Almaiah, M.A.; Al-Rahmi, W.M. The role of compatibility and Task-Technology Fit (TTF): On Social Networking Applications (SNAs) usage as sustainability in higher education. IEEE Access 2020, 8, 161668–161681. [Google Scholar] [CrossRef]
  83. Chao, C.M. Factors determining the behavioral intention to use mobile learning: An application and extension of the UTAUT model. Front. Psychol. 2019, 10, 1652. [Google Scholar] [CrossRef] [Green Version]
  84. Shin, W.S.; Kang, M. The use of a mobile learning management system at an online university and its effect on learning satisfaction and achievement. Int. Rev. Res. Open Distrib. Learn. 2015, 16, 110–130. [Google Scholar] [CrossRef]
  85. Mutambara, D.; Bayaga, A. Determinants of mobile learning acceptance for STEM education in rural areas. Comput. Educ. 2021, 160, 104010. [Google Scholar] [CrossRef]
  86. Seyal, A.H.; Rahman, M.N.A.; Ramlie, R.; Rahman, A.A. A preliminary study of students’ attitude on m-learning: An application of technology acceptance model. Int. J. Inf. Educ. Technol. 2015, 5, 609–614. [Google Scholar]
  87. Venkatesh, V. Determinants of perceived ease of use: Integrating control, intrinsic motivation, and emotion into the technology acceptance model. Inf. Syst. Res. 2000, 11, 342–365. [Google Scholar] [CrossRef] [Green Version]
  88. Sánchez-Prieto, J.C.; Olmos-Migueláñez, S.; García-Peñalvo, F.J. MLearning and pre-service teachers: An assessment of the behavioral intention using an expanded TAM model. Comput. Hum. Behav. 2017, 72, 644–654. [Google Scholar] [CrossRef]
  89. Alhussain, T.; Al-Rahmi, W.M.; Othman, M.S. Students’ perceptions of social networks platforms use in higher education: A qualitative research. Int. J. Adv. Trends Comput. Sci. Eng. 2020, 9. [Google Scholar] [CrossRef]
  90. Chang, C.T.; Hajiyev, J.; Su, C.R. Examining the students’ behavioral intention to use e-learning in Azerbaijan? The general extended technology acceptance model for e-learning approach. Comput. Educ. 2017, 111, 128–143. [Google Scholar] [CrossRef]
  91. Heflin, H.; Shewmaker, J.; Nguyen, J. Impact of mobile technology on student attitudes, engagement, and learning. Comput. Educ. 2017, 107, 91–99. [Google Scholar] [CrossRef]
  92. Hair, J.F.; Sarstedt, M.; Ringle, C.M.; Mena, J.A. An assessment of the use of partial least squares structural equation modeling in marketing research. J. Acad. Mark. Sci. 2012, 40, 414–433. [Google Scholar] [CrossRef]
  93. Krejcie, R.V.; Morgan, D.W. Determining sample size for research activities. Educ. Psychol. Meas. 1970, 30, 607–610. [Google Scholar] [CrossRef]
  94. Hair, J.F.; Anderson, R.E.; Babin, B.J.; Black, W.C. Multivariate data analysis: A global perspective. J. Res. Methodol. JRM 2015, 22, 265–268. [Google Scholar]
  95. Loehlin, J.C. Latent Variable Models: A Guidelines for Sample Size Estimation Needed for Statistical Introduction to Factor, Path and Structural Analysis Techniques rather than Mathematical Computation; Routledge: Oxfordshire, UK, 1992. [Google Scholar]
  96. Alrajawy, I.; Isaac, O.; Ghosh, A.; Nusari, M.; Al-Shibami, A.H.; Ameen, A.A. Determinants of Student’s intention to use Mobile learning in Yemeni public universities: Extending the technology acceptance model (TAM) with anxiety. Int. J. Manag. Hum. Sci. 2018, 2, 1–9. [Google Scholar]
  97. Almaiah, M.A.; Alismaiel, O.A. Examination of factors influencing the use of mobile learning system: An empirical study. Educ. Inf. Technol. 2019, 24, 885–909. [Google Scholar] [CrossRef]
  98. Mubuke, F.; Ogenmungu, C.; Masaba, A.K.; Andrew, W. The predictability of perceived enjoyment and its impact on the intention to use mobile learning systems. Asian J. Comput. Sci. Inf. Technol. 2017, 1, 7. [Google Scholar]
  99. Al-Adwan, A.S.; Al-Madadha, A.; Zvirzdinaite, Z. Modeling students’ readiness to adopt mobile learning in higher education: An empirical study. Int. Rev. Res. Open Distrib. Learn. 2018, 19. [Google Scholar] [CrossRef] [Green Version]
  100. So, S. Mobile instant messaging support for teaching and learning in higher education. Internet High. Educ. 2016, 31, 32–42. [Google Scholar] [CrossRef]
  101. Ku, C.H. Extending the Technology Acceptance Model. Using Perceived User Resources in Higher Education Web-Based Online Learning Courses; University of Central Florida: Orlando, FL, USA, 2009. [Google Scholar]
  102. Botero, G.G.; Questier, F.; Cincinnato, S.; He, T.; Zhu, C. Acceptance and usage of mobile assisted language learning by higher education students. J. Comput. High. Educ. 2018, 30, 426–451. [Google Scholar] [CrossRef]
  103. Mugo, D.G.; Njagi, K.; Chemwei, B.; Motanya, J.O. The technology acceptance model (TAM) and its application to the utilization of mobile learning technologies. J. Adv. Math. Comput. Sci. 2017. [Google Scholar] [CrossRef]
  104. Thomas, T.; Singh, L.; Gaffar, K. The utility of the UTAUT model in explaining mobile learning adoption in higher education in Guyana. Int. J. Educ. Dev. Using ICT 2013, 9, 71–85. [Google Scholar]
  105. Fornell, C.; Larcker, D.F. Evaluating structural equation models with unobservable variables and measurement. J. Mark. Res. 1981, 18, 39–50. [Google Scholar] [CrossRef]
  106. Bagozzi, R.P.; Yi, Y. On the evaluation of structural equation models. J. Acad. Mark. Sci. 1988, 16, 74–94. [Google Scholar] [CrossRef]
  107. Chow, Y.S.; Teicher, H. Probability Theory: Independence, Interchangeability, Martingales; Springer Science & Business Media: Berlin/Heidelberg, Germany, 2012. [Google Scholar]
  108. Byrne, B.M. Structural Equation Modeling with Mplus: Basic Concepts, Applications, and Programming; Routledge: Oxfordshire, UK, 2013. [Google Scholar]
  109. Kline, R.B. Response to leslie hayduk’s review of principles and practice of structural equation modeling. Can. Stud. Popul. ARCHIVES 2018, 45, 188–195. [Google Scholar] [CrossRef]
  110. Venkatesh, V.; Morris, M.G.; Davis, G.B.; Davis, F.D. User acceptance of information technology: Toward a unified view. MIS Q. 2003, 27, 425–478. [Google Scholar] [CrossRef] [Green Version]
  111. Saroia, A.I.; Shang, G. Investigating university students’ intention to use mobile learning management systems in Sweden. Innov. Educ. Teach. Int. 2018, 56, 569–580. [Google Scholar] [CrossRef]
  112. Hamidi, H.; Jahanshaheefard, M. Essential factors for the application of education information system using mobile learning: A case study of students of the university of technology. Telemat. Inform. 2019, 38, 207–224. [Google Scholar] [CrossRef]
  113. Chavoshi, A.; Hamidi, H. Social, individual, technological and pedagogical factors influencing mobile learning acceptance in higher education: A case from Iran. Telemat. Inform. 2019, 38, 133–165. [Google Scholar] [CrossRef]
  114. Raza, S.A.; Umer, A.; Qazi, W.; Makhdoom, M. The effects of attitudinal, normative, and control beliefs on m-learning adoption among the students of higher education in Pakistan. J. Educ. Comput. Res. 2018, 56, 563–588. [Google Scholar] [CrossRef]
  115. Bakhsh, M.; Mahmood, A.; Sangi, N.A. Examination of factors influencing students and faculty behavior towards m-learning acceptance. Int. J. Inf. Learn. Technol. 2017. [Google Scholar] [CrossRef]
  116. Cheng, Y.M. Towards an understanding of the factors affecting m-learning acceptance: Roles of technological characteristics and compatibility. Asia Pac. Manag. Rev. 2015, 20, 109–119. [Google Scholar] [CrossRef]
  117. Huang, J.H.; Lin, Y.R.; Chuang, S.T. Elucidating user behavior of mobile learning. Electron. Libr. 2007, 34, 166–188. [Google Scholar] [CrossRef] [Green Version]
  118. Alrasheedi, M.; Capretz, L.F.; Raza, A. Management’s perspective on critical success factors affecting mobile learning in higher education institutions—An empirical study. J. Educ. Comput. Res. 2016, 54, 253–274. [Google Scholar] [CrossRef] [Green Version]
  119. Milošević, I.; Živković, D.; Manasijević, D.; Nikolić, D. The effects of the intended behavior of students in the use of M-learning. Comput. Hum. Behav. 2015, 51, 207–215. [Google Scholar] [CrossRef]
  120. Viberg, O.; Andersson, A.; Wiklund, M. Designing for sustainable mobile learning–re-evaluating the concepts “formal” and “informal”. Interact. Learn. Environ. 2021, 29, 130–141. [Google Scholar] [CrossRef] [Green Version]
Figure 1. Research model.
Sustainability 13 07893 g001
Figure 2. TAM model measurement.
Sustainability 13 07893 g002
Figure 3. Measurement of mediator and dependent.
Sustainability 13 07893 g003
Figure 4. Results of all students group for the proposed model.
Sustainability 13 07893 g004
Table 1. Demographic profile.
ItemsDescriptionN%Cumulative %
GenderMale1386962.7
Female6231100
Age18–22115.55.5
23–295125.531
30–357939.570.5
36–403718.589
41–Above2211100
SpecializationSocial Science321673
Engineering2311.511.5
Science and Technology4522.595.5
Management9145.557
Other94.5100
Use _MASeveral times a day15979.579.5
Once in a day199.589
Several times in a month178.597.5
Once in a month52.5100
Table 2. Correlation analysis by SPSS.
Coefficients a
ModelCollinearity Statistics
ToleranceVIF
1PE0.5002.001
PR0.3512.851
TTF0.4322.316
PU0.2903.452
PEOU0.3163.167
BIM0.2024.941
ATT0.1885.328
a Dependent variable: MLS.
Table 3. Correlation analysis by AMOS.
VariableMinMaxSkewc.r.Kurtosisc.r.2
PU150.5923.419−0.284−0.819
PR150.5072.925−0.07−0.202
TTF1.450.4662.692−0.298−0.86
PE150.1971.139−0.439−0.998
PEOU150.4962.8620.1180.342
ATT150.7894.5530.5040.811
BI150.6323.650.2350.678
UML150.5483.1630.3190.922
Multivariate 15.8191.843
Table 4. Reliability analysis for the research variables.
CodItemItem-Total Correlation AnalysisCronbach’s Alpha If Item DeletedFactor LoadingsCronbach’s Alpha Analysis
PUPerceived usefulness 0.936
PU10.7920.9690.88
PU20.7410.9700.85
PU30.7540.9690.88
PU40.7580.9690.88
PU50.7340.9700.83
PEOUPerceived ease of use 0.790
PEOU10.6540.9700.77
PEOU20.7910.9720.73
PEOU30.7200.9700.85
PEOU40.6770.9700.85
PEOU50.6650.9700.82
PEPerceived enjoyment 0.894
PE10.6630.9700.77
PE20.6270.9700.82
PE30.6130.9700.83
PE40.6260.9700.85
PE50.5950.9700.71
TTFTask-technology fit 0.795
TTF10.7120.9700.90
TTF20.7150.9700.83
TTF30.6740.9700.85
TTF40.3890.9710.36
TTF50.2680.9710.46
PRPerceived resource 0.835
PR10.6410.9700.69
PR20.7450.9700.79
PR30.5390.9700.62
PR40.6090.9700.70
PR50.6860.9700.75
ATTAttitude toward using M-learning 0.864
ATT10.7320.9700.69
ATT20.6880.9700.72
ATT30.7240.9700.80
ATT40.7340.9700.76
ATT50.7720.9690.78
BIBehavioral intention to use M-learning 0.829
BI10.6910.9700.68
BI20.7030.9700.67
BI30.6970.9700.78
BI40.6290.9700.72
BI50.6750.9700.68
UMLActual use of M-learning as sustainability 0.884
UML10.7480.9700.71
UML20.7020.9700.79
UML30.7270.9700.83
UML40.6450.9700.71
UML50.7450.9700.77
UML60.6690.9700.71
Table 5. Goodness of fit indices for the measurement model.
Type of MeasureAcceptable Level of FitValues
“Root-Mean Residual” (RMR)Near to 0 (perfect fit)0.042
“Normed Fit Index” (NFI)>0.900.913
“Relative Fit Index” (RFI)>0.900.919
“Incremental Fit Index” (IFI)>0.900.933
“Tucker Lewis Index” (TLI)>0.900.912
“Comparative Fit Index” (CFI)>0.900.904
“Root-Mean Square Error of Approximation” (RMSEA)<0.05 indicates a good fit0.041
Table 6. Overall validity and reliability for students (male and female).
PUPEOUPETTFPRATTBIMMLSAVECRCA
PU0.972 0.7480.9370.936
PEOU0.5470.577 0.5180.8210.790
PE0.5370.4000.825 0.6360.8970.894
TTF0.3870.2550.3260.545 0.5110.8250.795
PR0.5540.3430.4540.3860.656 0.5030.8340.835
ATT0.6560.4710.5050.4430.5140.709 0.5660.8660.864
BIM0.6120.4750.4760.3760.4630.5530.628 0.5010.8330.829
MLS0.5670.3550.4520.5120.5300.5690.4830.6520.5730.8890.884
Table 7. Structural model for hypothesis testing results.
HIndependentRelationshipDependentEstimateS.E.C.R.PResult
H1PU Sustainability 13 07893 i001ATT0.2320.0465.0580.000Supported
H2PU Sustainability 13 07893 i001BIM0.1360.0472.9080.004Supported
H3PEOU Sustainability 13 07893 i001ATT0.2740.0535.2150.000Supported
H4PEOU Sustainability 13 07893 i001BIM0.3490.0546.4850.000supported
H5PE Sustainability 13 07893 i001ATT0.0960.0402.4110.016Supported
H6PE Sustainability 13 07893 i001BIM0.0830.0392.1200.034Supported
H7TTF Sustainability 13 07893 i001ATT0.3360.0487.0490.000Supported
H8TTF Sustainability 13 07893 i001BIM0.1450.0512.8400.005Supported
H9PR Sustainability 13 07893 i001ATT0.1800.0533.4090.000Supported
H10PR Sustainability 13 07893 i001BIM0.1190.0522.2910.022Supported
H11ATT Sustainability 13 07893 i001BIM0.1870.0682.7510.006Supported
H12ATT Sustainability 13 07893 i001MLS0.6470.0659.9360.000Supported
H13BIM Sustainability 13 07893 i001MLS0.1990.0692.8690.004Supported
Publisher’s Note: MDPI stays neutral with regard to jurisdictional claims in published maps and institutional affiliations.

