
Corporate Social and Financial Performance: The Role of Firm Life Cycle in Business Groups


Department of Business Administration, Soonchunhyang University, Unitopia Building No. 710, 22 Soonchunhyangro, Shinchang-myeon, Asan-si 31538, Chungcheongnam-do, Korea
Sustainability 2021, 13(13), 7445; https://doi.org/10.3390/su13137445
Submission received: 14 May 2021
/
Revised: 24 June 2021
/
Accepted: 29 June 2021
/
Published: 2 July 2021
Abstract
:Drawing on agency theory concerning corporate social responsibility (CSR) activities, this study investigates the relationship between corporate social performance (CSP) and corporate financial performance (CFP) at each stage of the firm life cycle (FLC). It also verifies how this relationship is affected by large business groups. This study shows a significant positive relationship between CSP and CFP at the growth and mature stages. This relationship is more pronounced in mature firms than in growth firms. This result indicates that CSR activities increase CFP in the long-term perspective by mitigating the agency problem. Furthermore, at the growth and mature stages, the positive relationship between CSP and CFP changed to be negative in firms of large business groups. This result indicates that the degree to which CSP leads to an increase in CFP is more weakened in large business groups where the agency problem between controlling and other shareholders can be more severe. Finally, this study contributes to prior research by presenting consistent results on the relationship between CSP and CFP using the FLC and large business groups.
1. Introduction
Although the effect of corporate social responsibility (CSR) activities on corporate management has been discussed for over 40 years, previous studies have not been able to provide consistent results on the effect of corporate social performance (CSP) on corporate financial performance (CFP). This study uses agency theory as the theoretical lens to examine the relationship between CSP and CFP. The effect of CSR on agency problems can be explained from two perspectives. If managers use CSR activities to reduce information asymmetry between managers and shareholders, CSR activities will also alleviate the agency problem between managers and shareholders. Therefore, the interests between managers and shareholders will align in firms where the agency problem is low, and the manager’s efforts on CSR will increase CFP [1,2,3,4,5,6,7,8]. On the other hand, if managers use CSR activities as an opportunistic tool to promote information asymmetry, CSR activities will intensify the agency problem. The interests between managers and shareholders are conflicted in firms where the agency problem has deepened, and the manager’s efforts on CSR will lower CFP [9,10,11,12,13]. Consequently, the effect of CSP on CFP will vary depending on managerial incentives to engage in CSR activities.
A manager is just an economic man who acts reasonably to obtain maximum profits according to economic theory. Managers with an edge over business information have substantial discretionary power that allows them to achieve their goals and thus are more likely to drive CSR activities to their advantage [7,14]. Since managerial discretion can affect the agency problem in two directions, an increase or decrease, the effects of these two opposite forms depend on the business situation that the managers face. Managers act in their best interests to maximize their wealth and minimize the risk of dismissals [15,16,17]. If managers believe that reducing agency problems helps them achieve their goals, they will engage in CSR activities to reduce agency problems. Otherwise, they will use CSR activities to deepen the agency problem.
The firm life cycle (FLC) theory divides the evolutionary process into several stages and argues that the business environment, organizational structure, and management strategy are different across the FLC stages [18,19]. According to this theory, firms at the introduction and growth stages would actively expand their market share, secure competitive advantage, and increase facility investment. However, mature firms that focus on production efficiency would reduce costs and improve capacity utilization. Firms at the decline stage would choose a strategy to withdraw from existing businesses, such as disposing of unnecessary facilities in response to a decrease in market demand. Therefore, the business situation that managers can face, and the conflicts between managers and shareholders would vary across FLC stages [20]. In a life cycle stage where the interests between managers and shareholders are aligned, managers will engage in CSR activities to alleviate the agency problem, and CSP would contribute to enhancing CFP. On the other hand, in a life cycle stage where the interests between the managers and shareholders are not aligned, managers will engage in CSR activities to conceal opportunistic behavior, and CSP would have a negative effect on CFP. Overall, the relationship between CSP and CFP can be affected by the intensity of the agency problem across FLC stages [1,2,3,7,14].
While corporate ownership in Western countries (e.g., the United States and the United Kingdom) is diffuse, corporate ownership in Asian countries is concentrated [7,21,22,23]. Thus, the separation of ownership and control barely exists for Korean firms. The agency problem in Korean firms arises from conflicts between controlling and minority shareholders [7,14,24,25]. Furthermore, Korean firms belonging to a large business group called a “Chaebol” are closely intertwined with each other via pyramidal ownership structures and cross-holdings. Thus, the controlling shareholders of Chaebols are more likely to engage in tunneling activities that benefit them at the expense of other shareholders [7,14,26,27,28]. The agency problem may be more severe in Chaebols than in non-Chaebols, and the sensitivity between CSP and CFP would be more pronounced in Chaebols. Previous studies have overlooked that the mixed results on the relationship between CSP and CFP may be attributed to the FLC and large business groups that can affect the intensity of the agency problem.
This study aims to show the firm’s strategy for CSR by analyzing the sensitivity between CSP and CFP across FLC stages. Furthermore, by examining whether this sensitivity differs between Chaebol and non-Chaebol groups, it verifies how the investment strategy for CSR is affected by large business groups (Chaebols). The investment strategy for CSR activities will build on the economic theory that firms should benefit most from improvements in efficiency. These purposes are addressed through a regression analysis using 1929 Korean non-financing firms in the period 2013–2018. Since Korean regulatory authorities designate large business groups that can intensify the agency problem between controlling and minority shareholders every year, Korea provides an optimal laboratory to verify whether the relationship between CSP and CFP across FLC stages is related to the agency problem. The results show that there is a significantly positive relationship between CSP and CFP. This relationship was significantly positive only at the growth and mature stages of the FLC. In addition, the positive relationship between CSP and CFP strengthens at the mature stage rather than at the growth stage. These results indicate that CSR activities increase CFP in the long term by alleviating the agency problem. Furthermore, at the growth and mature stages, the positive relationship between CSP and CFP changed to be negative in firms belonging to large business groups (Chaebols). These results suggest that the degree to which CSP leads to an increase in CFP weakens in large business groups where the agency problem between controlling and other shareholders can be severe. In conclusion, CSR activities effectively lead to an increase in CFP when the agency problems reduce. This study adds to prior research by presenting consistent results on the relationship between CSP and CFP using the FLC and large business groups. In addition, this study suggests investment strategies for CSR that firms should select at each stage to improve CFP. Furthermore, to increase CFP, it is necessary to seek managerial compensation schemes that can align the interests of managers and shareholders and safeguards that can control the influence of controlling shareholders over corporate management.
2. Hypotheses Development
2.1. Corporate Social and Financial Performance
This study uses agency theory as the primary theory lens to examine the relationship between CSP and CFP. There are still conflicting views on the relationship between CSP and CFP. First, from the positive perspective, managers can use CSR activities to reduce information asymmetry between managers and shareholders [1,2,3,7]. CSR activities will thus alleviate the agency problem between managers and shareholders. High CSP relieves concerns of external monitors, such as activists, shareholders, and NGOs [29], and enhances corporate reputation [6]. In addition, CSR activities can facilitate corporate innovation by easing regulatory pressures, and thus they will help expand business scope [5,8]. Orlitzky et al. [6] argue that the reputation improved by CSR activities increases the future CFP. Choi et al. [2], Cho et al. [3], and Lev et al. [5] claim that the manager’s efforts in CSR contributes to future sales growth by reducing information asymmetry. Dhaliwal et al. [4] find that the managers involved in CSR activities tend to voluntarily disclose a lot to highlight the positive image of the firm, thereby reducing information asymmetry. Benlemlih and Bitar [1] document that high CSR involvement increases investment efficiency. Platonova et al. [8] prove that CSR disclosure improves future financial performance by alleviating information asymmetry. Park and Lee [7] reveal that the long-term managerial incentive for compensation reduces the agency problem and thus enhances the positive relationship between CSP and CFP. Therefore, the interests between managers and shareholders will align in firms where the agency problem is not severe, and the manager’s efforts in CSR will increase CFP. However, from a negative perspective, managers can use CSR activities as an opportunistic tool to promote information asymmetry [9,10,12,13]. CSR activities would thus intensify the agency problem. These socially responsible activities can lead to the misuse of resources in the process of satisfying the conflicting interests of managers and shareholders, which can reduce corporate performance [11]. Hemingway and Maclagan [9] argue that managers can use CSR activities to hide corporate misconduct or mismanagement. McWilliams et al. [12] suggest that the manager’s efforts for CSR may lead to the misuse of resources that would be returned to shareholders. Prior et al. [13] argue that managers engage in CSR to cover up opportunistic earnings management. Kim and Venkatachalam [10] claim that managers in sin industries (e.g., gaming, tobacco, alcohol, and adult entertainment, etc.) engage in CSR activities to improve the negative image of the sin firm. Krüger [11] finds that investors react negatively to good CSR news which may result from agency problems. Overall, if high CSP helps alleviate the agency problem, it will have a positive effect on enhancing CFP. However, if CSR activities create a severe agency problem, it will have a negative impact on CFP.
2.2. The CSP–CFP Sensitivity and Firm Life Cycle Stages
Strategic choices for corporate growth vary across FLC stages. CSR activities could be directed as a management strategy used by a firm to moderate the agency problem between managers and shareholders. Thus, the relationship between CSP and CFP would vary across FLC stages. Specifically, the business situation that a firm faces at each stage is as follows: firms at the introduction stage are usually small in size and do not have much financial capacity, making it difficult to differentiate products through business diversification and innovation [30,31]. Their financial performance also fluctuates or incurs losses, resulting in lower CFP than those at other FLC stages [18,32]. They cannot afford to invest in CSR activities, and their future sustainability is uncertain. Managers may engage in CSR activities to hide opportunistic behaviors, deepening the agency problem. Thus, the weights of CSP on CFP is smaller than those of other FLC stages. Firms at the growth stage may be innovators that succeeded in finding their market among the firms at the introduction stage. They increase sales and employment through product diversification and innovation [19,20,32]. Thus, they still must invest in infrastructure to maintain high growth and returns [33] and evaluate managers in the long-term perspective [34]. They also invest heavily in CSR activities to reduce the agency problem, and CSP begins to be reflected significantly in CFP. Firms at the mature stage adopt strategies for long-term growth due to more sustainable revenue than firms at other FLC stages [9,16,19]. They increase efficiency in the production process through accumulated know-how and knowledge, resulting in the highest profitability among all life cycle stages [18,32,35]. Thus, they continue to invest in CSR activities to alleviate the agency problem, and the extent to which CSP affects CFP is greater. Firms at the shake-out stage do their best to find new growth opportunities, as growth rates slow down sharply [18]. If they fail to find new growth opportunities, they experience a steep fall in the growth rate and face considerable uncertainty on whether they can continue as a going concern. Thus, they do not invest heavily in CSR activities, and CSP has less impact on CFP. Firms at the decline stage did not find any further growth opportunities in the market, resulting in a decline in their market share, worsening profitability, increased debt, and decreased liquidity [18,19,32]. They focus on restructuring or merging with other firms by reducing operating costs rather than growth-oriented investment [19,36]. They invest very little in CSR activities, and even if they do, they use them to achieve opportunistic goals. Therefore, CSP does not lead to an increase in CFP. Miller and Friesen [19] argue that firms tend to move in a linear progression through the five life cycle stages. Govindarajan and Shank [35] explain the FLC using the product portfolio matrix and emphasize the importance of the management control system to carry out strategies for each life cycle. Anthony and Ramesh [36] find that the market reaction to accounting performance is a function of the FLC stage. Koberg et al. [33] attempt to explain why the innovativeness of a firm changes as the FLC develops. Black [32] finds that the informativeness of earnings and cash flow measures differ across FLC stages. Dickinson [18] argues that future profitability differs across FLC stages. Consequently, the CSP–CFP sensitivity varies depending on the effect of CSP on the agency problem for each FLC stage. Therefore, this study proposes the following hypothesis.
Hypothesis 1.
The sensitivity of CSP to CFP depends on the firm life cycle stages.
2.3. The CSP–CFP Sensitivity and Chaebol Firm Effects
Unlike firms in Western countries where the agency problem traditionally arises from conflicts of interest between managers and shareholders (“Agent–Principal” conflicts), the agency problem in Asian firms arises from those between controlling and minority shareholders (“Principal–Principal” conflicts) [7,14,21,23,25]. In Korean firms, where ownership is not separated from control, the controlling shareholder can either directly act as a manager or appoint a manager whom they can control. Therefore, the controlling shareholder can exercise significant influence over corporate management. This unique feature is prominent in Korean Chaebol firms owned by families and makes it easier for owner-managers to exploit other shareholders. Chaebols indicate, in strict terms, a large business group subject to the regulations of the Korean Fair Trade Commission to prevent the concentration of economic power via pyramidal ownership structures and cross-holdings among affiliated firms. The controlling shareholders of Chaebols can exercise greater voting rights than cash flow rights and are more likely to pursue their interests by using the wedge between voting rights and cash-flow rights. However, controlling shareholders cannot overlook the importance of CSR as they have an incentive to run a firm from a long-term perspective. Therefore, CSR activities can be a safety device to alleviate the agency problem between controlling and minority shareholders.
If managers of Chaebols engage in CSR activities to achieve opportunistic goals, CSR activities only incur costs that intensify the agency problem and reduce CFP [3,7,37]. On the other hand, if they use CSR activities to reduce information asymmetry in the long-term perspective, CSR activities will alleviate agency problems and increase CFP. However, the controlling shareholders of Chaebol firms have been known to create a severe agency problem by engaging in tunneling activities that benefit them at the expense of other shareholders. Bae et al. [26] prove that the controlling shareholders of Chaebols benefit from acquisitions by tunneling activities. Baek et al. [28] find that Chaebol firms tend to sell their securities at lower prices when the controlling shareholders in the issuing firms can gain benefits from selling securities at a discount. Bae and Jeong [27] show that the value-relevance of earnings and book value is significantly smaller for Chaebol firms. Park [14] reveals that managerial influence to reduce audit quality is higher among Chaebol firms. Park and Lee [7] show that the short-term incentive for compensation that exacerbates the agency problem drives the sensitivity of CSP to CFP in Chaebol firms. Taken together, Chaebols are passive to CSR, and the cost of CSR activities do not contribute to the increase in CFP. The CSP–CFP sensitivity will be relatively lower in Chaebol firms, and this sensitivity will depend on the FLC stage. Therefore, this study proposes the following hypothesis.
Hypothesis 2.
The sensitivity of CSP to CFP across the firm life cycle stages can be affected by Chaebol firms.
3. Sample Selection and Model
3.1. Sample Selection
As shown in Table 1, 4560 firm-year observations listed on the Korea Stock Price Index (KOSPI) between 2013 and 2018 were selected to obtain a final sample (N = 1929). (1) To control the business environment and industry characteristics, 344 firms that have a closing month other than December or are in the finance sector were excluded from the final sample. (2) The KEJI Index, which the Korea Economic Justice Institute (KEJI) publishes annually, was used to measure CSP. The KEJI excludes firms that fail to meet several financial requirements from the evaluation of CSP, and thus, not all firms have the KEJI Index. Therefore, 2259 firms without the KEJI Index were excluded from the final sample. (3) The financial data needed for this study were collected from FnGuide’s DataGuide database. However, 28 firms whose financial data were unavailable in the database were excluded from the final sample. All continuous variables were winsorized at the top 1% and bottom 1% to control the effect of extreme values.
3.2. Identification of FLC Stages
I used the method proposed by Dickinson [18] to identify the FLC stages. Some studies have sought a way to determine the FLC stages. Anthony and Ramesh [36] used dividend propensity, sales growth, capital expenditure, and firm age to divide FLC stages and investigated whether the effects of sales growth and capital expenditure on stock prices depended on the FLC stages. Black [32] demonstrated that the value relevance of accounting information (net book value, cash flow from operating activities, cash flow from financial activities, cash flow from investment activities, and accounting profits) differs across FLC stages. However, this approach was questionable because of the arbitrary selection of indicators to gauge the features of the FLC stage. To overcome these drawbacks, Dickinson [18] identified FLC stages using a combination of each sign of the firm’s operating, investing, and financing cash flows. Specifically, since the cash flow from each of the three activities has a positive or negative sign, there are eight possible cash flow pattern combinations. As shown in Table 2, the FLC stages were divided into introduction, growth, mature, shake-out, and decline using the eight combinations of cash flow signs based on previous research.
3.3. CSP Measurement
This study used the KEJI Index, which is the most widely used CSP measure in Korea. The KEJI evaluated CSP in 7 categories out of 75 until 2010, but since 2011, it has chosen 6 categories out of 100 (soundness (25), fairness (20), contribution to social service (15), customer protection satisfaction (15), environmental protection satisfaction (10), and employee satisfaction (15)) to evaluate CSP. Therefore, this study used the KEJI Index from 2013 to ensure the homogeneity of the evaluation categories. This study used two measures of CSP based on previous studies [2,7,38]. The first is the natural logarithm of the KEJI Index (NW: non-weighted). However, this measure does not consider the relative importance of stakeholders to categories by each industry-year group. To address this issue, I first calculated the weight for every industry-year (=kit/kit), in which the average of scores of each category for each industry-year group was divided by the sum of the average of six categories. Here, x is the score, k is the category, i is the firm, and t is the year. Next, the score of each category of individual firms was multiplied by the weight for each industry-year group and then the scores of six categories adjusted by the weights were summed to one value (=kit × weightkit). This aggregate score was the second measure (SW: stakeholder-weighted) to capture CSP.
3.4. Model
The following regression models based on previous studies were estimated to verify the hypotheses [2,7,38]. The models included ROA as a dependent variable to represent CFP. There were two reasons for using ROA as the primary performance measure. First, most Korean firms adopt the accounting-based compensation system to encourage managers to improve short-term performance [17]. Second, the accounting-based indicators, rather than market-based indicators, are more sensible to evaluate what managers accomplish [2,6,7,39]. As described above, I employed the two CSP measures (NW, SW). If CSP contributes to the increase in CFP by mitigating the agency problem, the coefficients on β1 will be significant and positive (β1 > 0). However, if it has different weights on CFP across FLC stages, the coefficients on β1 for them will differ in significance levels. I included firm size as the variable to control for potential factors that affect CFP (β2 > 0 or β2 < 0). As the sales growth rate increases, net income also increases. Thus, high sales growth would positively affect CFP (β3 > 0). High debt ratios would increase capital costs and worsen profitability. Thus, a high debt ratio (LEV) would negatively affect CFP (β4 < 0). Expenditure on research and development activities provides firms with a sustainable growth opportunity. Thus, high R&D expenditure (RND) would positively affect CFP (β5 > 0). I included year and industry dummy variables to control for fixed effects caused by different years and industries.
where,
CFP = α0 + β1CSP (NW, SW) + β2SIZE + β3GRW + β4LEV + β5RND + ∑IND + ∑IND + ε
CFP = α0 + β1CSP + β2Chaebol + β3CSP × Chaebol + Controls + ε
| CFP | = | Earnings before interest and taxes divided by total assets |
| NW | = | Natural logarithm of the KEJI Index |
| SW | = | Stakeholder-weighted KEJI Index |
| Chaebol | = | A dummy variable equal to one for firms belonging to business groups and zero otherwise |
| SIZE | = | Natural logarithm of total assets |
| GRW | = | Sales growth rate over the previous year |
| LEV | = | Ratio of debt to total assets |
| RND | = | R&D expenses deflated by total assets |
| IND | = | Industry dummy |
| YD | = | Year dummy |
4. Empirical Results
4.1. Descriptive Statistics
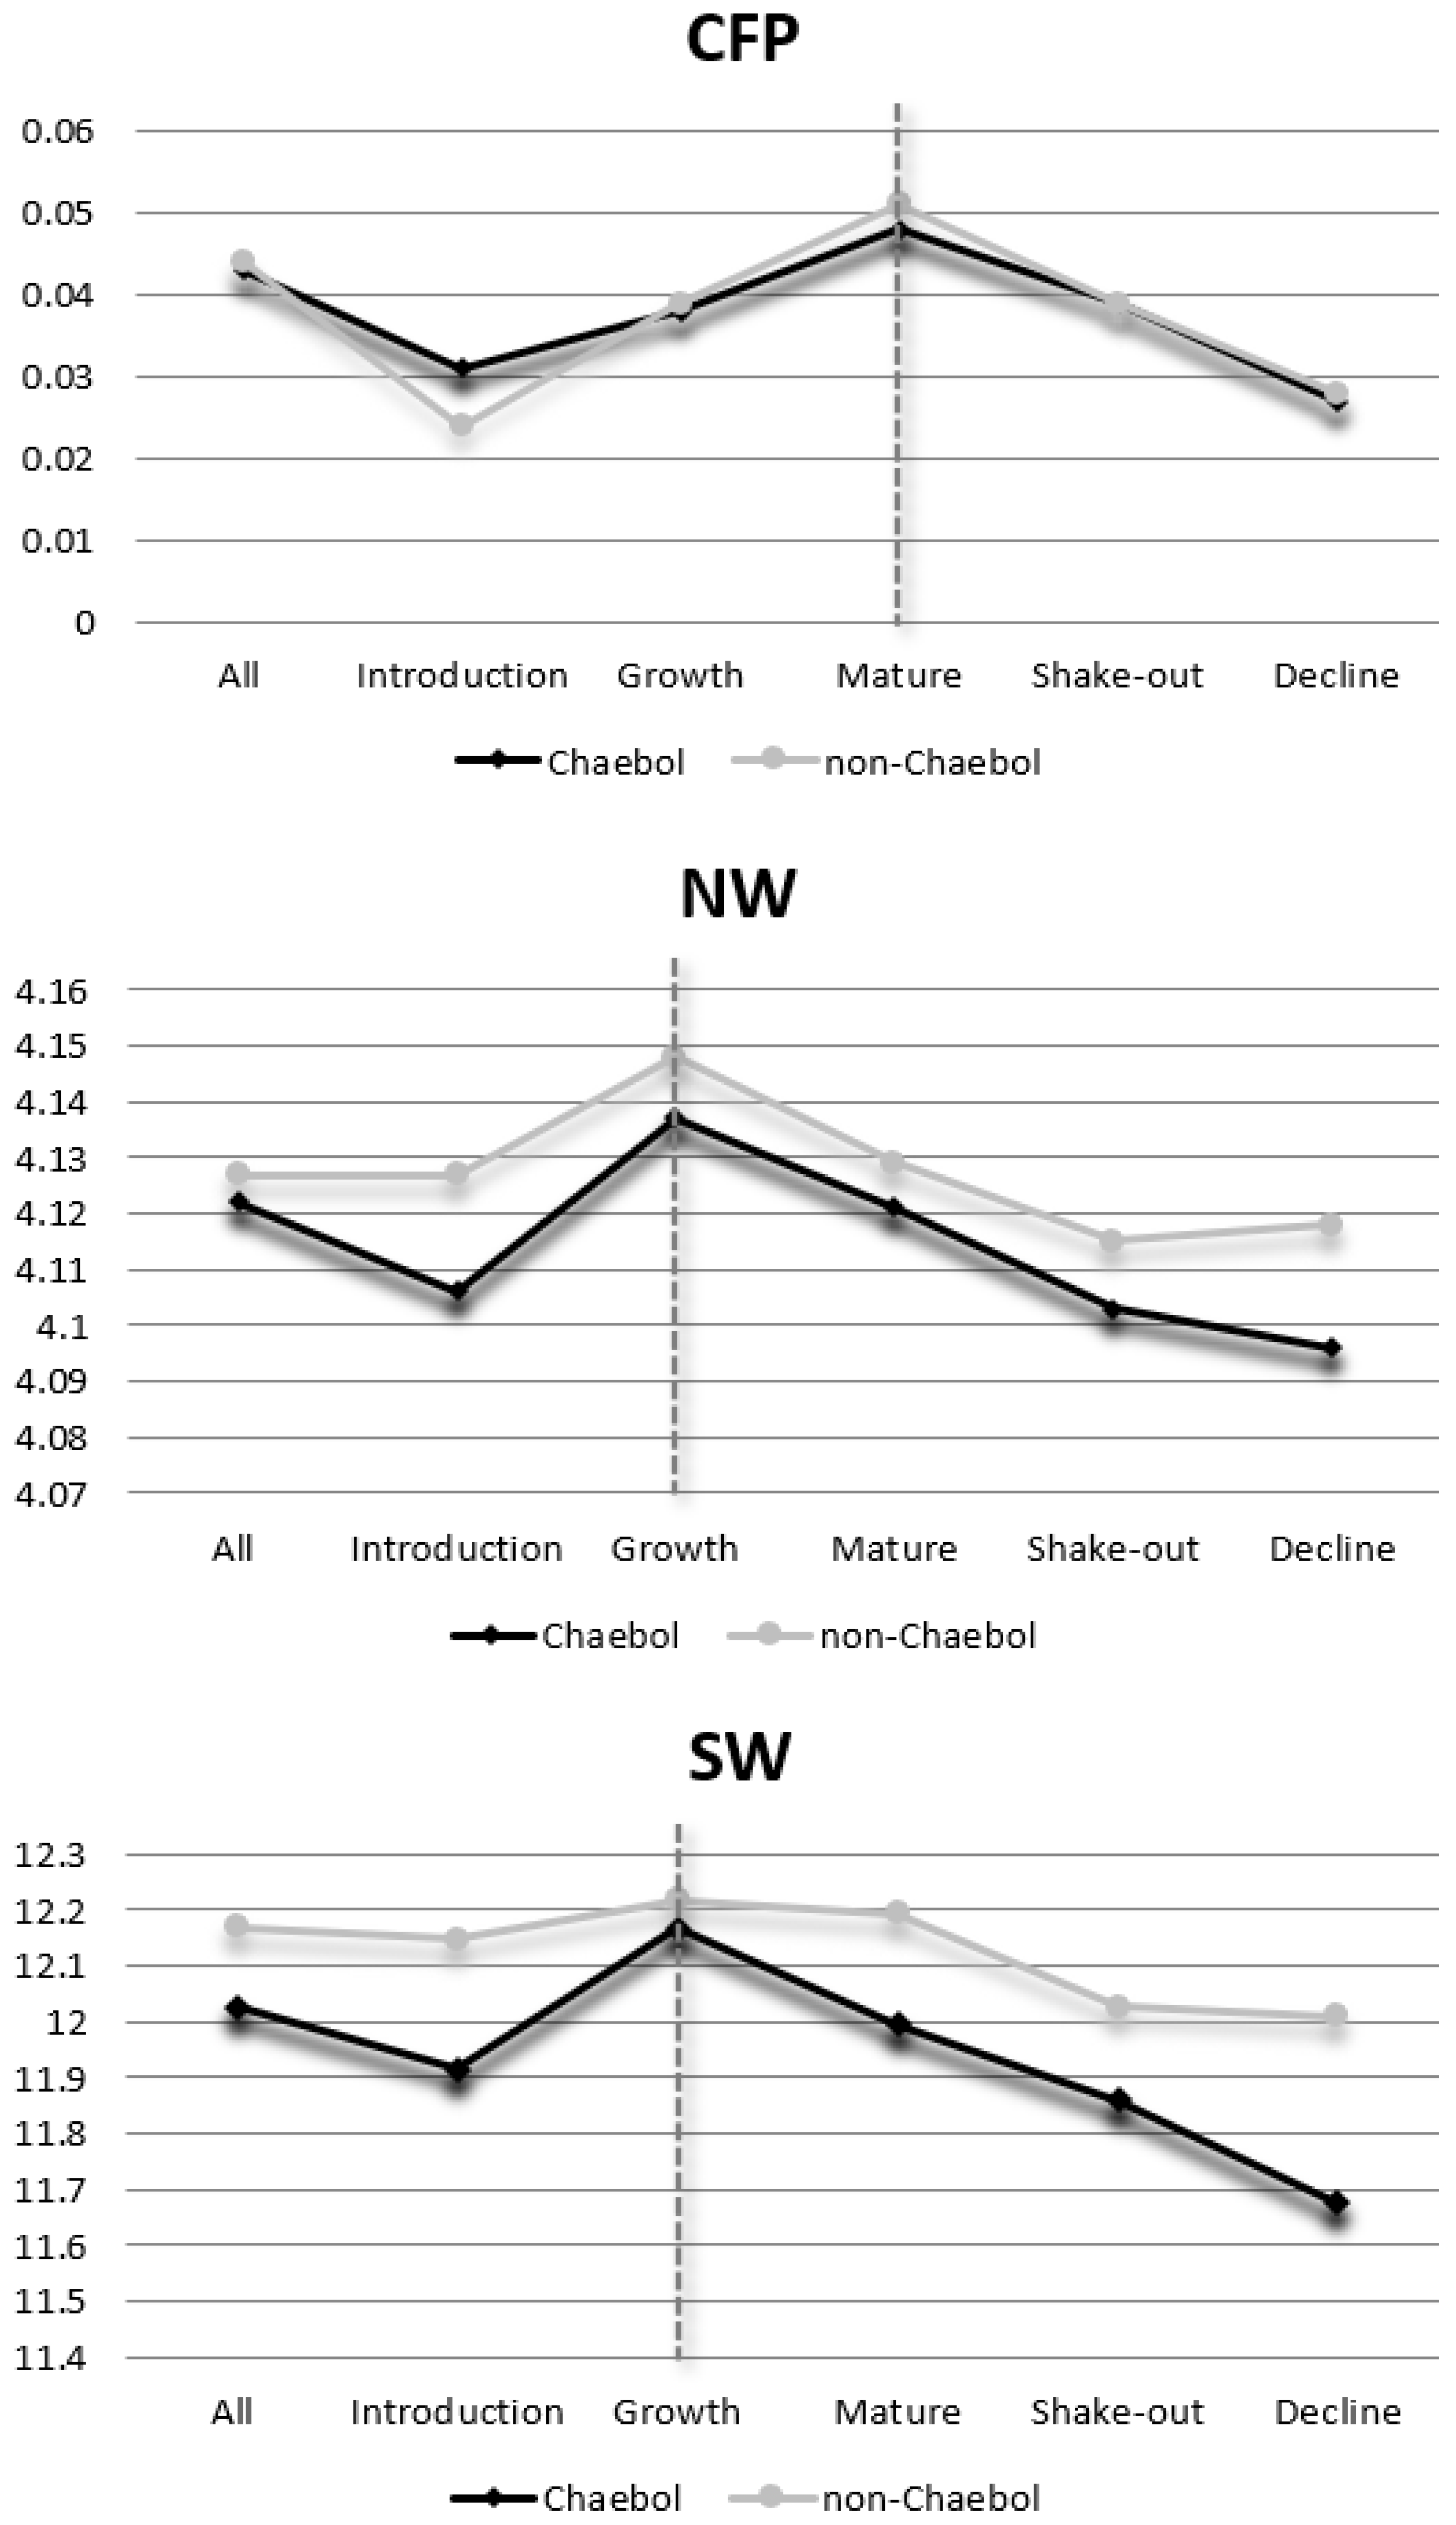
Panel A of Table 3 shows the descriptive statistics of the variables. The average and median CFP were 4.3% and 3.8%, respectively, and there was no significant difference between them. The mean (median) of NW and SW to capture CSP were 4.126 (4.127) and 12.133 (12.166), respectively. The mean and median of the SIZE were 26.692 and 26.510, respectively. The mean (median) of GRW, LEV, and RND were 4.6 (2.3) %, 38.5 (38.2) %, and 0.6 (0.0) %, respectively. Panel B shows how the differences in CFP, NW, and SW by Chaebols varied across the FLC stages. For the full sample, NW and SW were significantly higher in non-Chaebol firms. These results remain unchanged for the introduction and mature stages. Although not significant, NW and SW were higher in non-Chaebol firms, even at other FLC stages. CFP, on the other hand, did not depend on whether a firm belonged to a Chaebol. These results show that although both NW and SW were significantly lower in Chaebol firms, CFP was not affected by Chaebol firms. Therefore, it is necessary to analyze how the sensitivity of CSP to CFP varies by Chaebols and the FLC stages. This new approach would allow us to identify strategies that a firm should adopt for CSR by the FLC stages and Chaebols.
In Figure 1, CFP was the highest at the mature stage. CSP was the highest at the growth stage. These results indicate that managers at the growth stage put most of their efforts into CSR activities to satisfy the interests of shareholders, and shareholders at the mature stage return as loyal friends who help managers improve CFP. The timeliness in which CSP affects CFP may vary depending on the business situation which a firm is facing. Figure 1 indicates that the sensitivity of CSP to CFP can vary across the FLC stages. The CSP–CFP sensitivity would be the highest during the mature stage when CSR activities align the interests of managers and shareholders and thus significantly affect CFP. While the difference in CFP between Chaebol and non-Chaebol firms was not significant, CSP was higher in non-Chaebol firms. The CSP–CFP sensitivity would be higher in non-Chaebol firms where the agency problem is not severe. Taken together, the degree to which a manager’s efforts in CSR lead to an increase in CFP would be the highest in non-Chaebol firms at the mature stage.
Table 4 shows the results of the correlation analysis between the variables. CFP positively correlated with NW and SW. These results indicate that NW and SW can increase CFP by alleviating the potential agency problems between management and shareholders. CFP, on the other hand, did not show a significant correlation with Chaebols (not reported). These results suggest that Chaebols do not directly affect CFP. Thus, this study extends previous research on CSR by examining the moderating effect of Chaebols on the relationship between CSP and CFP. As expected, CFP had a significant positive correlation with GRW and RND, whereas it had a significant negative correlation with LEV.
4.2. Correlations between CSP and CFP across FLC Stages
Table 5 shows the correlation between CSP and CFP across the FLC stages. This analysis shows how the weightings of CSP on CFP vary across the FLC stages.
First, the correlation between CSP and CFP for the full sample was significantly positive only at growth, mature, and shake-out stages. The correlation between CSP and CFP for the Chaebol firms was significantly positive at the growth and mature stages, whereas for that of the non-Chaebol groups, it was significantly positive at the growth, mature, and shake-out stages. These results show that the positive correlation between CSP and CFP was more pronounced in non-Chaebol firms. As shown in Figure 1, the CSP–CFP sensitivity is higher in non-Chaebol firms.
4.3. Relationships between CSP and CFP across FLC Stages
Many potential factors can affect CFP. Thus, the relationship between CSP and CFP had to be analyzed more strictly by controlling the effects of potential factors on CFP. Panel A of Table 6 shows the result on the relationship between NW and CFP. Panel B shows the result on the relationship between SW and CFP across the FLC stages, respectively. The adjusted R2 of all models ranged from 3.9% to 17.6% and the statistical significance of all models was at the 1% level.
As shown in Panel A, the coefficient of NW was significant and positive for the full sample (β = 0.156, p < 0.01). In addition, that of NW was significant and positive for firms at the growth and mature stages (β = 0.146/0.202, p < 0.01). These results suggest that firms at the growth and mature stages should be more actively involved in CSR activities to alleviate the agency problem and thus improve their CFP. The potential effect of NW on CFP at the introduction stage may substantially appear at the growth and mature stages. Therefore, CSR activities may have a positive effect on CFP from a long-term perspective. However, CSP at the shake-out and decline stages did not affect CFP. Since firms at the shake-out and decline stages face high uncertainty about future sustainability, their CSP would not contribute to increasing CFP and can even be used to achieve opportunistic goals, exacerbating the agency problem. As expected, the coefficients of SIZE, GRW, and RND were significant and positive, whereas the coefficient of LEV was significant and negative. As shown in Panel B, the coefficient of SW was significant and positive for the full sample (β = 0.009, p < 0.01). This coefficient appears to be the same at the growth and mature stages (β = 0.009/0.011, p < 0.01). Finally, as indicated in Panels A and B, the chow tests [40] showed that the coefficient of CSP at the growth stage was different from that at the mature stage. These results indicate that the CSP–CFP sensitivity is significantly higher at the mature stage than at the growth stage. Consequently, at the mature stage, managers would produce big results with little effort on CSR.
4.4. Chaebols as CSR Commitment
The CSP measure used in this study was the CSR score evaluated by the KEJI. The large business group should be a demonstration of stakeholder commitment to CSR. Therefore, the sensitivity between CSP and CFP will be more pronounced in Chaebol firms. Panel A of Table 7 shows the NW–CFP relationship across the FLC stages for Chaebol firms. Panel B shows the NW–CFP relationship across the FLC stages for non-Chaebol firms. Panel C shows the moderating effects of Chaebol firms on CSP–CFP sensitivity across the FLC stages. The adjusted R2 of all models ranged from 2.3% to 34.0%, and the statistical significance of all models was at the 1% level. As shown in Panel A of Table 7, the coefficient of NW was positive for the firms that belong to Chaebols (β = 0.149, p < 0.01), and that of NW was significantly positive at the growth and mature stages (β = 0.148/0.158, p < 0.05 and 0.01). As seen in Panel B, the coefficient of NW was significantly positive for the firms that do not belong to Chaebols (β = 0.171, p < 0.01), and that of NW was significantly positive at the growth and mature stages (β = 0.110/0.249, p < 0.05 and 0.01). The Chow tests in each panel showed that the coefficients of NW across the FLC stages did not differ significantly between the Chaebol and non-Chaebol firms.
Panels A and B show the analysis results of the Chaebol and the non-Chaebol firms, respectively. To understand the moderating effects of Chaebols on the CSP–CFP sensitivity, we would need the analyses for the full sample. The results for SW were the same as those for NW and thus are omitted here for brevity. As shown Panel C, the coefficients on the interaction terms, NW × Chaebol and SW × Chaebol, were both significantly negative at the mature stage (β = −0.109/−0.006, both p < 0.10). These results indicate that the positive effect of CSP on CFP is weakened in Chaebol firms. Consequently, the CSP of Chaebol firms may be used as a tool for managers to attain opportunistic goals, exacerbating the agency problem, and therefore, the weight of CSP reflected in CFP would be relatively lower in Chaebol firms.
4.5. Endogeneity Tests
CSR activities are more active in firms with high financial performance. Such firms try to satisfy the interests of various shareholders to maintain a high performance. In contrast, high CSP can improve corporate reputation and value, resulting in increasing CFP. Taken together, CSP may be co-determined by CFP. Table 6 and Table 7 did not statistically control the potential endogeneity between CSP and CFP.
In Table 8, to address this issue, regression models were re-estimated after controlling for the potential endogeneity between CSP and CFP. Panel A shows the results on the CSP–CFP sensitivity by using 2SLS (two-stage squares). Panel B shows the results on whether the CSP–CFP sensitivity depends on Chaebol and non-Chaebol firms after controlling for the endogeneity of CSP and CFP. Panel C shows the moderating effects of Chaebols on the CSP–CFP sensitivity across the FLC stages after controlling for the endogeneity of CSP and CFP. The predicted CSP (NWHAT and SWHAT) was estimated in the first stage of Panel A, and the models were re-estimated in the second stage after replacing the existing CSP with the predicted CSP. The coefficients of NWHAT and SWHAT were both significant and positive (β = 0.555/0.025, both p < 0.01). These results show that the results for the full sample in Table 6 were robust in controlling for the endogeneity between CSP and CFP. Panel B shows that the results for the FLC stages in Table 6 were robust in controlling for the potential endogeneity. Panel C shows that the results of Panel C in Table 7 were robust in controlling for the potential endogeneity.
5. Conclusions
There are still conflicting views on the effect of CSP on CFP. If managers engage in CSR activities to reduce information asymmetry, CSP will play a crucial role in aligning the interests between managers and shareholders from a long-term perspective, thus increasing CFP. However, if managers engage in CSR activities to hide opportunistic behaviors, CSP will negatively affect CFP from a short-term perspective. Therefore, depending on managerial incentives to engage in CSR activities, CSP may or may not intensify the agency problem. The agency problem between managers and shareholders may vary depending on the business situation and, consequently, the FLC stages. In addition, the agency problem would intensify in large business groups where controlling shareholders’ control over affiliated firms is relatively high. Previous studies did not consider the FLC stages and large business groups that could affect the agency problem for conflicting views on the relationship between CSP and CFP. This study aimed to analyze the relationship between CSP and CFP across the FLC stages and verify how this relationship is affected by large business groups (Chaebols) that could deepen the agency problem. This study covered six years from 2013–2018. The final sample included 1929 firm-year observations with the KEJI Index.
The results can be divided into four categories as follows. First, there was a significant positive relationship between CSP and CFP. This result indicates that the agency problems between managers and shareholders are alleviated in firms with good social performance. That is, CSP can align the interests of managers and shareholders in the long-term perspective and lead to an increase in CFP. Second, a positive relationship between CSP and CFP was significant at the growth and mature stages, and the significance of this relationship was higher at the mature stage. Moreover, the level of CSP was the highest at the growth stage, but the sensitivity between CSP and CFP was the highest at the mature stage. These results show that the degree to which CSR activities alleviate the agency problem varies across the FLC stages. Third, these relationships are weakened in Chaebol firms where the agency problem can be more severe. Therefore, there is a need for incentives to encourage large business groups to fulfill their social responsibilities. Finally, the relationship described above remains unchanged even after controlling for the endogeneity of CSP and CFP. Thus, the results were robust in considering the potential endogeneity of CSP and CFP.
This study has contributed to research on CSR in several ways. First, this study expands prior research by considering the FLC stages and large business groups that could affect the agency problem, thus providing consistent results. Second, this study suggests that managerial compensation schemes that consider CSP are needed to alleviate the agency problem. Manager compensation schemes, which reduce the agency problem, will drive managers to improve CSP. Third, this study provides a guideline on investment strategies for CSR that firms should choose at each stage of the FLC to improve CFP. Finally, this study suggests that policymakers should seek safety devices that control the influence of controlling shareholders over corporate management to alleviate the agency problem in a large business group.
Although the study makes significant contributions, it also has several limitations. First, it could not find a way to isolate firms focusing on environmentally and socially responsible business practices from the final sample. Their CSP investment might lead to better financial performance, even at the introduction stage, because CSP is their core. Second, the relationship between CSP and CFP is too complicated to be depicted through a linear relationship. Many potential factors could affect the sensitivity of CSP to CFP. However, this study employed only the FLC stage and Chaebols as factors that may affect the sensitivity of CSP to CFP. Third, this study could not conduct a statistical test for whether the difference between CSP coefficients at different FLC stages was significantly different because the sample differed across FLC stages. Finally, the findings cannot be generalized to all firms because the analyses were limited to only firms with KEJI Index.
Funding
This work was supported by the Soonchunhyang University Research Fund.
Institutional Review Board Statement
Not applicable.
Informed Consent Statement
Not applicable.
Data Availability Statement
Not applicable.
Conflicts of Interest
The author declares no conflict of interest.
References
- Benlemlih, M.; Bitar, M. Corporate social responsibility and investment efficiency. J. Bus. Ethics 2018, 148, 647–671. [Google Scholar] [CrossRef]
- Choi, J.S.; Kwark, Y.M.; Choe, C.W. Corporate social responsibility and corporate financial performance: Evidence from Korea. Aust. J. Manag. 2010, 35, 291–311. [Google Scholar] [CrossRef] [Green Version]
- Cho, S.Y.; Lee, C.; Pfeiffer, R.J., Jr. Corporate social responsibility performance and information asymmetry. J. Account. Public Policy 2013, 32, 71–83. [Google Scholar] [CrossRef]
- Dhaliwal, D.S.; Li, O.Z.; Yang, A.T. Voluntary non-financial disclosure and the cost of equity capital: The initiation of corporate social responsibility reporting. Account. Rev. 2011, 86, 59–100. [Google Scholar] [CrossRef]
- Lev, B.I.; Petrovits, C.; Radhakrishnan, S. Is doing good for you? How corporate charitable contributions enhance revenue growth. Strateg. Manag. J. 2010, 31, 182–200. [Google Scholar] [CrossRef]
- Orlitzky, M.; Schmidt, F.L.; Rynes, S.L. Corporate social and financial performance: A meta-analysis. Organ. Stud. 2003, 24, 403–441. [Google Scholar] [CrossRef]
- Park, B.-J.; Lee, K.-H. The sensitivity of corporate social performance to corporate financial performance: A “time-based” agency theory perspective. Aust. J. Manag. 2021, 46, 224–247. [Google Scholar] [CrossRef]
- Platonova, E.; Asutay, M.; Dixon, R.; Mohammad, S. The impact of corporate social responsibility disclosure on financial performance: Evidence from the GCC Islamic banking sector. J. Bus. Ethics 2018, 151, 451–471. [Google Scholar] [CrossRef] [Green Version]
- Hemingway, C.; Maclagan, P. Managers’ personal values as drivers of corporate social responsibility. J. Bus. Ethics 2004, 50, 33–44. [Google Scholar] [CrossRef]
- Kim, I.; Venkatachalam, M. Are sin stocks paying the price for accounting sins? J. Account. Audit. Financ. 2011, 26, 415–442. [Google Scholar] [CrossRef]
- Krüger, P. Corporate goodness and shareholder wealth. J. Financ. Econ. 2015, 115, 304–329. [Google Scholar] [CrossRef]
- McWilliams, A.; Siegel, D.; Wright, P. Guest editors’ introduction corporate social responsibility: Strategic implications. J. Manag. Stud. 2006, 43, 1–18. [Google Scholar] [CrossRef] [Green Version]
- Prior, D.; Surroca, J.; Tribo, J. Are socially responsible managers really ethical? Exploring the relationship between earnings management and corporate social responsibility. Corp. Gov. Int. Rev. 2008, 16, 160–177. [Google Scholar] [CrossRef] [Green Version]
- Park, B.-J. Audit committees and managerial influence on audit quality: ‘Voluntary’ versus ‘mandatory’ approach to corporate governance. Aust. Account. Rev. 2019, 29, 266–280. [Google Scholar] [CrossRef]
- Balsam, S. Discretionary accounting choices and CEO compensation. Contemp. Account. Res. 1998, 15, 229–252. [Google Scholar] [CrossRef]
- Gaver, J.J.; Gaver, K.M. The relation between nonrecurring accounting transactions and CEO cash compensation. Account. Rev. 1998, 73, 235–253. [Google Scholar]
- Park, B.-J. Auditors’ economic incentives and the sensitivity of managerial pay to accounting performance. Aust. Account. Rev. 2017, 27, 266–280. [Google Scholar] [CrossRef]
- Dickinson, V. Cash flow patterns as a proxy for firm life cycle. Account. Rev. 2011, 86, 1969–1994. [Google Scholar] [CrossRef]
- Miller, D.; Friesen, P.H. A longitudinal study of the corporate life cycle. Manag. Sci. 1984, 30, 1161–1183. [Google Scholar] [CrossRef]
- Wang, G.; Singh, P. The evolution of CEO compensation over the organizational life cycle: A contingency explanation. Hum. Resour. Manag. Rev. 2014, 24, 144–159. [Google Scholar] [CrossRef]
- Cheng, P.; Su, L.; Zhu, X. Managerial ownership, board monitoring and firm performance in a family-concentrated corporate environment. Account. Financ. 2012, 52, 1061–1081. [Google Scholar] [CrossRef]
- Morck, R.; Shleifer, A.; Vishny, R. Management ownership and market valuation: An empirical analysis. J. Financ. Econ. 1988, 20, 293–315. [Google Scholar] [CrossRef]
- Ng, C.Y.M. An empirical study on the relationship between ownership and performance in a family-based corporate environment. J. Account. Audit. Financ. 2005, 20, 121–146. [Google Scholar] [CrossRef]
- Claessens, S.; Djankov, S.; Lang, L. The separation of ownership and control in East Asian corporations. J. Financ. Econ. 2000, 58, 81–112. [Google Scholar] [CrossRef]
- La Porta, R.; Lopez-de-Silanes, F.; Shleifer, A. Corporate ownership around the world. J. Financ. 1999, 54, 471–518. [Google Scholar] [CrossRef]
- Bae, K.-H.; Kang, J.-K.; Kim, J.-M. Tunneling or value Added? Evidence from mergers by Korean business group. J. Financ. 2002, 57, 2695–2740. [Google Scholar] [CrossRef]
- Bae, K.-H.; Jeong, S.W. The value-relevance of earnings and book value, ownership structure, and business group affiliation: Evidence from Korean business groups. J. Bus. Financ. Account. 2007, 34, 740–766. [Google Scholar] [CrossRef]
- Baek, J.-S.; Kang, J.-K.; Lee, I.-M. Business groups and tunneling: Evidence from private securities offerings by Korean Chaebols. J. Financ. 2006, 61, 2415–2449. [Google Scholar] [CrossRef] [Green Version]
- Baron, D. Private politics, corporate social responsibility and integrated strategy. J. Econ. Manag. Strategy 2001, 10, 7–45. [Google Scholar] [CrossRef]
- Lester, D.L.; Parnell, J.A.; Crandall, W.; Menefee, M. Organizational life cycle and innovation among entrepreneurial enterprises. J. Small Bus. Strategy 2008, 19, 37–49. [Google Scholar]
- Lynall, M.; Golden, B.; Hillman, A. Board composition from adolescence to maturity: A multi-theoretic view. Acad. Manag. Rev. 2003, 28, 416–431. [Google Scholar] [CrossRef]
- Black, E.L. Life-cycle impacts on the incremental value-relevance of earnings and cash flow measures. J. Financ. Statement Anal. 1998, 4, 40–56. [Google Scholar]
- Koberg, C.S.; Uhlenbruck, N.; Sarason, Y. Facilitators of organizational innovation: The role of life-cycle stage. J. Bus. Ventur. 1996, 11, 133–149. [Google Scholar] [CrossRef]
- Singh, P.; Agarwal, N.C. Executive compensation: Examining an old issue from new perspectives. Compens. Benefits Rev. 2003, 35, 48–54. [Google Scholar] [CrossRef]
- Govindarajan, V.; Shank, J.K. Strategic cost management: Tailoring controls to strategies. J. Cost Manag. 1992, 6, 14–24. [Google Scholar]
- Anthony, J.H.; Ramesh, K. Association between accounting performance measures and stock prices: A test of the life cycle hypothesis. J. Account. Econ. 1992, 15, 203–227. [Google Scholar] [CrossRef]
- Jensen, M.; Meckling, W. Theory of the firm: Managerial behavior, agency cost and capital structure. J. Financ. Econ. 1976, 3, 305–360. [Google Scholar] [CrossRef]
- Akpinar, A.; Jiang, Y.; Gomez-Mejia, L.R.; Berrone, P.; Walls, J.L. Strategic Use of CSR as a Signal for Good Management; IE Business School Working Paper; IE Business School: Madrid, Spain, 2008. [Google Scholar]
- Demsetz, H.; Villalonga, B. Ownership structure and corporate performance. J. Corp. Financ. 2001, 7, 209–233. [Google Scholar] [CrossRef]
- Chow, G.C. Tests of equality between sets of coefficients in two linear regressions. Econom. J. Econom. Soc. 1960, 28, 591–605. [Google Scholar] [CrossRef]
Figure 1.
Trend changes of CFP and CSP across FLC stages.


Table 1.
Sample selection.
| Companies traded in the Korea Stock Price Index (KOSPI) market from 2013 to 2018 | 4560 | |
| (1) | Exclude companies that are not manufacturing industries and have closing months other than December | (344) |
| (2) | Exclude companies that do not have the KEJI Index disclosed by the Economic Justice Institute | (2259) |
| (3) | Exclude companies that cannot obtain financial data from FnGuide database | (28) |
| Final sample | 1929 |
Table 2.
Firm life cycle stages.
| Cash Flows | FLC Stage | |||||||
|---|---|---|---|---|---|---|---|---|
| Introduction | Growth | Mature | Shake-Out | Shake-Out | Shake-Out | Decline | Decline | |
| Operating | - | + | + | - | + | + | - | - |
| Investing | - | - | - | - | + | + | + | + |
| Financing | + | + | - | - | + | - | + | - |
Table 3.
Descriptive statistics.
| Panel A. Descriptive on Full Sample | |||||||||
| Variable | Mean | Std. Dev. | Min | Quartile | Max | ||||
| 25% | Median | 75% | |||||||
| CFP | 0.043 | 0.047 | −0.424 | 0.019 | 0.038 | 0.063 | 0.604 | ||
| NW | 4.126 | 0.049 | 3.944 | 4.094 | 4.127 | 4.160 | 4.279 | ||
| SW | 12.133 | 0.634 | 9.966 | 11.724 | 12.166 | 12.568 | 14.408 | ||
| SIZE | 26.692 | 1.315 | 23.224 | 25.830 | 26.510 | 27.289 | 32.731 | ||
| GRW | 0.046 | 0.316 | −0.731 | −0.049 | 0.023 | 0.100 | 6.805 | ||
| LEV | 0.385 | 0.187 | 0.001 | 0.236 | 0.382 | 0.535 | 0.958 | ||
| RND | 0.006 | 0.013 | 0.000 | 0.000 | 0.000 | 0.004 | 0.105 | ||
| Panel B. Difference Tests of Variables by FLC Stages and Chaebol | |||||||||
| Variable | CFP | NW | SW | ||||||
| Chaebol | Yes | No | t-Value | Yes | No | t-Value | Yes | No | t-Value |
| All | 0.043 (457) | 0.044 (1472) | −0.36 | 4.122 (457) | 4.127 (1472) | −1.85 * | 12.027 (457) | 12.168 (1472) | −4.47 *** |
| Introduction | 0.031 (27) | 0.024 (96) | 1.10 | 4.106 (27) | 4.127 (96) | −2.14 ** | 11.916 (27) | 12.146 (96) | −1.89 * |
| Growth | 0.038 (123) | 0.039 (365) | −0.16 | 4.137 (123) | 4.148 (365) | −1.12 | 12.167 (123) | 12.218 (365) | −0.80 |
| Mature | 0.048 (257) | 0.051 (765) | −0.97 | 4.121 (257) | 4.129 (765) | −2.32 ** | 11.994 (257) | 12.194 (765) | −4.32 *** |
| Shake-out | 0.039 (40) | 0.039 (209) | −0.34 | 4.103 (40) | 4.115 (209) | −1.36 | 11.860 (40) | 12.027 (209) | −1.53 |
| Decline | 0.027 (10) | 0.028 (37) | −0.94 | 4.096 (10) | 4.118 (37) | −1.49 | 11.675 (10) | 12.009 (37) | −1.69 * |
Note: The number in panel B represents the mean value of each group, and the numbers in parentheses indicate the sample size. *** p < 0.01, ** p < 0.05, and * p < 0.10 (all two-tailed tests).
Table 4.
Correlation matrix.
| Variable | CFP | NW | SW | SIZE | GRW | LEV | RND |
|---|---|---|---|---|---|---|---|
| CFP | 1.000 | ||||||
| NW | 0.211 *** | 1.000 | |||||
| SW | 0.182 *** | 0.924 *** | 1.000 | ||||
| SIZE | 0.024 | 0.147 *** | 0.077 ** | 1.000 | |||
| GRW | 0.077 *** | 0.063 *** | 0.068 *** | −0.011 | 1.000 | ||
| LEV | −0.268 *** | −0.094 *** | −0.115 *** | 0.190 *** | 0.054 ** | 1.000 | |
| RND | 0.070 *** | 0.256 *** | 0.250 *** | 0.060 *** | 0.062 *** | −0.047 ** | 1.000 |
Note: *** p < 0.01 and ** p < 0.05 (all two-tailed tests).
Table 5.
Correlations between CSP and CFP across FLC stages.
| FLC | All | Chaebol | Non-Chaebol | ||||||
|---|---|---|---|---|---|---|---|---|---|
| NW–CFP | SW–CFP | N | NW–CFP | SW–CFP | N | NW–CFP | SW–CFP | N | |
| Introduction | 0.108 | 0.103 | 123 | 0.122 | 0.125 | 27 | 0.142 | 0.130 | 96 |
| Growth | 0.180 *** | 0.169 *** | 488 | 0.279 *** | 0.280 *** | 123 | 0.149 *** | 0.132 ** | 365 |
| Mature | 0.263 *** | 0.223 *** | 1022 | 0.253 *** | 0.218 *** | 257 | 0.269 *** | 0.227 *** | 765 |
| Shake-out | 0.140 ** | 0.104 * | 249 | 0.147 | 0.176 | 40 | 0.145 ** | 0.097 | 209 |
| Decline | 0.085 | 0.101 | 47 | 0.321 | 0.370 | 10 | 0.034 | 0.038 | 37 |
Note: *** p < 0.01, ** p < 0.05, and * p < 0.10 (all two-tailed tests).
Table 6.
Relationship between CSP and CFP across FLC stages.
| Panel A. NW as CSP Measure | ||||||
| CFP = α0 + β1NW + β2SIZE + β3GRW + β4LEV + β5RND + ∑IND + ∑IND + ε | ||||||
| Variables | Exp. Sign | All | FLC Stage | |||
| Introduction | Growth | Mature | Shake-Out | |||
| Estimate (t-Value) | Estimate (t-Value) | Estimate (t-Value) | Estimate (t-Value) | Estimate (t-Value) | ||
| NW | +/− | 0.156 (6.859) *** | 0.036 (0.502) | 0.146 (3.540) *** | 0.202 (6.754) *** | 0.107 (1.303) |
| SIZE
| + | 0.002 (2.328) *** | 0.006 (2.114) ** | 0.002 (1.393) | 0.002 (1.303) | −0.004 (−0.904) |
| GRW
| + | 0.013 (3.738) *** | 0.026 (1.859) * | 0.029 (4.233) *** | 0.009 (2.193) ** | 0.006 (0.441) |
| LEV
| − | −0.068 (−11.785) *** | −0.049 (−2.598) ** | −0.066 (−5.863) *** | −0.075 (−9.618) *** | −0.026 (−1.283) |
| RND
| + | −0.011 (−0.134) | −0.071 (−0.221) | −0.122 (−0.906) | −0.061 (−0.608) | 0.585 (1.713) * |
| Intercept | +/− | −0.618 (−6.669) *** | −0.241 (−0.811) | −0.570 (−3.368) *** | −0.780 (−6.510) *** | −0.328 (−0.959) |
| ID | +/− | Yes | Yes | Yes | Yes | Yes |
| YD | +/− | Yes | Yes | Yes | Yes | Yes |
| Adjusted R2 | 12.0% | 9.4% | 12.3% | 17.6% | 4.4% | |
| F-value | 12.969 *** | 1.578 * | 4.101 *** | 10.881 *** | 1.522 * | |
| H0: β1Gro = β1Mat | 27.925 *** | |||||
| N | 1929 | 123 | 488 | 1022 | 249 | |
| Panel B. SW as CSP Measure | ||||||
| CFP = α0 + β1SW + Controls + ε | ||||||
| Variables | Exp. Sign | All | FLC Stage | |||
| Introduction | Growth | Mature | Shake-Out | |||
| Estimate (t-Value) | Estimate (t-Value) | Estimate (t-Value) | Estimate (t-Value) | Estimate (t-Value) | ||
| SW | +/− | 0.009 (5.029) *** | 0.002 (0.321) | 0.009 (2.820) *** | 0.011 (4.700) *** | 0.005 (0.757) |
| Controls | +/− | Yes | Yes | Yes | Yes | Yes |
| Adjusted R2 | 11.0% | 9.3% | 11.4% | 15.7% | 3.9% | |
| F-value | 11.859 *** | 1.569 * | 3.859 *** | 9.614 *** | 1.463 * | |
| H0: β1Gro = β1Mat | 27.228 *** | |||||
| N | 1929 | 123 | 488 | 1022 | 249 | |
Note: Variable definitions appear below Equation (1). *** p < 0.01, ** p < 0.05, and * p < 0.10 (all two-tailed tests).
Table 7.
Relationship between CSP and CFP across life cycle stages in Chaebol and non-Chaebol firms.
Table 7.
Relationship between CSP and CFP across life cycle stages in Chaebol and non-Chaebol firms.
| Panel A. Chaebol Firms | |||||||
| Variables | Exp. Sign | Chaebol | FLC Stages | ||||
| Introduction | Growth | Mature | Shake-Out | ||||
| Estimate (t-Value) | Estimate (t-Value) | Estimate (t-Value) | Estimate (t-Value) | Estimate (t-Value) | |||
| NW
| +/− | 0.149 (4.309) *** | 0.035 (0.204) | 0.148 (1.999) ** | 0.158 (3.222) *** | 0.034 (0.236) | |
| SIZE
| + | 0.001 (0.905) | 0.005 (0.399) | 0.002 (0.778) | 0.001 (0.722) | 0.005 (0.554) | |
| GRW
| + | 0.024 (2.550) ** | 0.009 (0.102) | 0.026 (1.540) | 0.025 (1.880) * | 0.003 (0.057) | |
| LEV
| − | −0.064 (−6.440) *** | −0.175 (−2.190) * | −0.035 (−1.840) * | −0.069 (−4.903) *** | −0.018 (−0.287) | |
| RND
| + | 0.082 (0.469) | −0.538 (−0.284) | 0.595 (1.888) * | 0.144 (0.653) | 1.166 (0.212) | |
| Intercept
| +/− | −0.503 (−3.666) *** | 0.135 (0.218) | −0.489 (−1.533) | −0.532 (−2.799) *** | 0.295 (0.478) | |
| ID | +/− | Yes | Yes | Yes | Yes | Yes | |
| YD | +/− | Yes | Yes | Yes | Yes | Yes | |
| Adjusted R2 | 21.7% | 2.7% | 34.0% | 23.3% | 2.3% | ||
| F-value | 6.757 *** | 1.708 * | 3.853 *** | 4.694 *** | 1.617 * | ||
| H0: β1Gro = β1Mat | 8.269 *** | ||||||
| N | 457 | 27 | 123 | 257 | 40 | ||
| Panel B. Non-Chaebol Firms | |||||||
| Variables | Exp. Sign | Non-Chaebol | FLC Stages | ||||
| Introduction | Growth | Mature | Shake-Out | ||||
| Estimate (t-Value) | Estimate (t-Value) | Estimate (t-Value) | Estimate (t-Value) | Estimate (t-Value) | |||
| NW
| +/− | 0.171 (5.871) *** | 0.098 (0.917) | 0.110 (2.187) ** | 0.249 (6.494) *** | 0.122 (1.152) | |
| Controls | +/− | Yes | Yes | Yes | Yes | Yes | |
| Adjusted R2 | 11.1% | 9.2% | 11.1% | 16.7% | 4.8% | ||
| F-value | 9.362 *** | 1.438 * | 3.064 *** | 7.973 *** | 1.480 * | ||
| H0: β1Gro = β1Mat | 19.427 *** | ||||||
| N | 1472 | 96 | 365 | 765 | 209 | ||
| Panel C. Moderating Effect of Chaebol Firms | |||||||
| CFP = α0 + β1CSP + β2Chaebol + β3CSP × Chaebol + Controls + ε | |||||||
| Variable | Exp. Sign | A11 | Growth | Mature | |||
| Estimate (t-Value) | Estimate (t-Value) | Estimate (t-Value) | Estimate (t-Value) | Estimate (t-Value) | Estimate (t-Value) | ||
| NW
| + | 0.179 (6.61) *** | 0.141 (2.96) *** | 0.242 (6.82) *** | |||
| SW
| + | 0.011 (4.67) *** | 0.009 (2.28) ** | 0.014 (4.77) *** | |||
| Chaebol
| − | 0.004 (1.28) | 0.004 (1.29) | 0.001 (0.16) | 0.003 (0.34) | 0.003 (0.74) | 0.003 (0.64) |
| NW ×
Chaebol | +/− | −0.060 (−1.34) | 0.017 (0.19) | −0.109 (−1.92) * | |||
| SW ×
Chaebol | +/− | −0.002 (−0.53) | 0.003 (0.34) | −0.006 (−1.65) * | |||
| Controls | +/− | Yes | Yes | Yes | Yes | Yes | Yes |
| Adjusted R2 | 12.1% | 11.0% | 11.9% | 11.1% | 17.8% | 15.7% | |
| F-value | 12.052 *** | 10.956 *** | 3.746 *** | 3.535 *** | 10.190 *** | 8.918 *** | |
| N | 1929 | 1929 | 488 | 488 | 1022 | 1022 | |
Note: Variable definitions appear below Equation (1). *** p < 0.01, ** p < 0.05, and * p < 0.10 (all two-tailed tests).
Table 8.
Endogeneity tests.
| Panel A. 2SLS (Two-Stage Square) | |||||||||
| First Stage Equation: CSP = α0 + β1CFP + β2Pre_CSP + β3SIZE + ∑IND + ∑IND + ε Second Stage Equation: CFP = α0 + β1CSPHAT + β2SIZE + β3GRW + β4LEV + β5RND + ∑IND + ∑IND + ε | |||||||||
| Variable | Exp. Sign | The First Stage | The Second Stage | ||||||
| Estimate | (t-Value) | Estimate | (t-Value) | Estimate | (t-Value) | Estimate | (t-Value) | ||
| CFP | + | 0.101 | (3.86) *** | 0.939 | (2.97) *** | ||||
| Pre_NW | + | 0.468 | (18.15) *** | ||||||
| Pre_SW | + | 0.545 | (22.24) *** | ||||||
| NWHAT | + | 0.555 | (9.89) *** | ||||||
| SWHAT | + | 0.025 | (6.22) *** | ||||||
| SIZE | + | 0.003 | (2.31) ** | 0.013 | (1.09) | −0.001 | (−0.01) | 0.003 | (2.00) ** |
| GRW | + | 0.048 | (5.66) *** | 0.051 | (5.95) *** | ||||
| LEV | − | −0.069 | (−9.77) *** | −0.072 | (−9.94) *** | ||||
| RND | + | −0.111 | (−1.24) | −0.070 | (−0.75) | ||||
| Intercept | +/− | 2.119 | (20.20) *** | 5.432 | (13.57) *** | −2.201 | (−9.86) *** | −0.288 | (−5.49) *** |
| ID | +/− | Yes | Yes | Yes | Yes | ||||
| YD | +/− | Yes | Yes | Yes | Yes | ||||
| Adjusted R2 | 36.7% | 44.3% | 21.9% | 16.5% | |||||
| F-value | 36.196 *** | 49.191 *** | 15.136 *** | 11.815 *** | |||||
| Panel B. Growth vs. Mature | |||||||||
| CFP = α0 + β1CSPHAT + Controls + ε | |||||||||
| Variable | Exp. Sign | Growth | Mature | Growth | Mature | ||||
| Estimate | (t-Value) | Estimate | (t-Value) | Estimate | (t-Value) | Estimate | (t-Value) | ||
| NWHAT | + | 0.424 | (3.75) *** | 0.658 | (8.57) *** | ||||
| SWHAT | + | 0.016 | (1.91) * | 0.030 | (5.57) *** | ||||
| Controls | +/− | Yes | Yes | Yes | Yes | ||||
| Adjusted R2 | 22.8% | 24.2% | 13.1% | 19.3% | |||||
| F-value | 3.619 *** | 10.807 *** | 3.008 *** | 8.341 *** | |||||
| H0: β1Gro = β1Mat | 13.489 *** | 16.028 *** | |||||||
| N | 488 | 1022 | 488 | 1022 | |||||
| Panel C. Moderating Effect of Chaebol Firms | |||||||||
| CFP = α0 + β1CSPHAT + β2Chaebol + β3CSPHAT × Chaebol + Controls + ε | |||||||||
| Variable | Exp. Sign | All | Growth | Mature | |||||
| Estimate (t-Value) | Estimate (t-Value) | Estimate (t-Value) | Estimate (t-Value) | Estimate (t-Value) | Estimate (t-Value) | ||||
| NWHAT
| + | 0.562 (9.99) *** | 0.424 (3.76) *** | 0.666 (8.67) *** | |||||
| SWHAT
| + | 0.028 (6.16) *** | 0.013 (1.38) | 0.036 (5.87) *** | |||||
| Chaebol
| − | 0.004 (1.28) | 0.086 (1.09) | −0.003 (−0.22) | −0.125 (−0.83) | −0.003 (−0.25) | −0.003 (−0.32) | ||
| NWHAT ×
Chaebol | +/− | −0.001 (−0.87) | 0.002 (1.12) | −0.001 (−1.95) ** | |||||
| SWHAT ×
Chaebol | +/− | −0.007 (−1.01) | 0.011 (0.88) | −0.016 (−1.79) * | |||||
| Controls | +/− | Yes | Yes | Yes | Yes | Yes | Yes | ||
| Adjusted R2 | 20.6% | 16.6% | 16.6% | 13.2% | 24.2% | 19.5% | |||
| F-value | 14.612 *** | 10.973 *** | 3.516 *** | 2.842 *** | 10.355 *** | 7.811 *** | |||
| N | 1929 | 1929 | 488 | 488 | 1022 | 1022 | |||
Note: Variable definitions appear below Equation (1). *** p < 0.01, ** p < 0.05, and * p < 0.10 (all two-tailed tests).
Publisher’s Note: MDPI stays neutral with regard to jurisdictional claims in published maps and institutional affiliations. |
© 2021 by the author. Licensee MDPI, Basel, Switzerland. This article is an open access article distributed under the terms and conditions of the Creative Commons Attribution (CC BY) license (https://creativecommons.org/licenses/by/4.0/).
Share and Cite
MDPI and ACS Style
Park, B.-J. Corporate Social and Financial Performance: The Role of Firm Life Cycle in Business Groups. Sustainability 2021, 13, 7445. https://doi.org/10.3390/su13137445
AMA Style
Park B-J. Corporate Social and Financial Performance: The Role of Firm Life Cycle in Business Groups. Sustainability. 2021; 13(13):7445. https://doi.org/10.3390/su13137445
Chicago/Turabian StylePark, Bum-Jin. 2021. "Corporate Social and Financial Performance: The Role of Firm Life Cycle in Business Groups" Sustainability 13, no. 13: 7445. https://doi.org/10.3390/su13137445
Note that from the first issue of 2016, this journal uses article numbers instead of page numbers. See further details here.