Article

Spatial Modelling of Modal Shift Due to COVID-19

Faculty of Logistics Celje, University of Maribor, 3000 Celje, Slovenia
*
Author to whom correspondence should be addressed.
Sustainability 2021, 13(13), 7116; https://doi.org/10.3390/su13137116
Submission received: 17 May 2021 / Revised: 11 June 2021 / Accepted: 23 June 2021 / Published: 24 June 2021
(This article belongs to the Collection Sustainability in Urban Transportation Planning)

Abstract

:
The outbreak of COVID-19 caused many changes in people’s life. One of the most significant is the travel behaviour and transport mode choice. This study focus on the changes that the inhabitants of Vienna made in their travel choices because of the virus. The same research about spatial modelling the transport mode choice of commuters in Vienna was completed in 2019 and is a topic addressed in our previous work. Based on our developed methodology, this article indicates that public transport is not a dominant transport mode choice as it was before the virus outbreak. The main result of this paper is geographically defined areas of application of individual alternatives shown on the final map of modal shift in Vienna, which could provide theoretical support for policymakers and transportation planners. For the city of Vienna, we found that the area of the city where cars are now used has increased, which certainly has a negative impact on air quality and life in the city. The advantage of the methodology is that it can also be applied to other cities in the world.

1. Introduction

In December 2019, the Chinese city of Wuhan experienced an outbreak of a contagious coronavirus, COVID-19 (2019-nCoV or SARS-CoV-2) [1]. The virus spread rapidly worldwide, and on March 11, 2020, the World Health Organisation (WHO) announced a global pandemic [2]. Measures have been taken worldwide to curb the virus; most countries implemented social distancing measures and recommended their citizens to stay home (with online education and promotion of teleworking). The way of life for most people has changed noticeably [3], and the effects can be seen from socio-economics to politics.
In the past, transport decision-making research has focused on sustainable transport issues in urban areas and quality of life, as most countries face an increased need for mobility [4]. In order to achieve sustainability in mobility and transport, the key is in encouraging the use of public transport [5] and other sustainable, active transport modes. Prior to the coronavirus outbreak, the transport system planning was primarily focused on efficiency, i.e., maximising the volume of passengers with the smallest number of vehicles to minimise adverse environmental problems such as pollution [6]. Essential factors for transport system planning are the variability of travel demand and the level of service of public transport line [7]. Both mentioned factors were drastically changed during the pandemic.
The consequences of measures taken during a pandemic have significantly affect urban mobility [5]. The areas most affected are travel patterns [3] and day-to-day transport choice decisions. Individual transport choice decisions can contribute to pollution and congestion or be a path to sustainable opportunities [8]. The changes in transport decisions happen because the mode of transport is chosen based on various factors that changed significantly during the pandemic due to the measures taken [9].
The effect is different for a particular transport mode, but the most significant effect is detected for public transport [2,3,10]. Additionally, public transport has an important role in transmitting the virus [11], especially in urban, densely populated environments [6]. In Italy, the initial analysis revealed that trips performed by public transport significantly impacted the new COVID-19 situation only 1 week later [12].
Analyses reveal that because of the virus transmission, many public transport users, despite higher costs, may now use a car [13,14]. Other authors report that many people will prefer to choose transport modes where the risk of virus infection is lower in the future. The actual changes (which will be visible and measurable) in the use of individual transport modes will depend on the habits that people had before the coronavirus outbreak [15], based on the available transport network, different socio-economic status, and other factors. In the environments where the residents mostly used active modes of transport (walking, bicycles, scooters) or automobiles before the pandemic, the change will be very small or non-existent. Meanwhile, in environments where residents primarily relied on public transportation before the pandemic, the change will be pronounced.
It is clear that the spatial distribution of favoured modes of transport is changing due to the coronavirus epidemic. For more accessible and more reliable transportation, planning is necessary to know these spatial changes. Understanding mode choice is an important factor in the process of transport planning and management policy [8].
The motivation for the research is the development of a methodology that would help in deciding transport planning—especially given the fact that the outbreak of the virus has changed people’s transport habits. Decision-makers need a tool to help them plan and make strategic decisions. However, the methodology presented in the article provides just that—an insight into changes in decision-making.
This paper aims to investigate the changes in transport mode choice in Vienna city to present the spatial changes in the transport mode choice. More precisely, the aim is to find and compare the difference between pre-COVID-19 and the COVID-19 situation on habitants’ mode choices. Spatial changes were recorded after the first wave of the epidemic and might significantly affect future spatial management, including transportation.
The paper is organised as follows. Section 2 provides an overview of the literature in three steps. The first covers the most significant changes in travel behaviour due to COVID-19 worldwide, from which we can highlight the reduction in public transport. In the second step, the literature review focuses on analyses of changes in mobility before and after the outbreak of COVID-19, which confirms that the methodology we present in this article is a novelty. Additionally, the third step is a brief overview of the authors’ methodologies, which further confirms the originality of the methodology adopted. Section 3 reports methods and materials discussing the data collection and model formulation; the adopted model consists of Analytic Hierarchy Process (AHP) and geographic data. Section 4 describes the main results with some descriptive statistic and the map of the selected city. Section 5 provides a discussion of the main findings. Finally, conclusions are reported in Section 6.

2. Literature Review

2.1. Reported Changes in Travel Behavior Because of COVID-19

One of the first analyses of changes in public mobility patterns because of the virus outbreak was performed in the United States, based on the location data from mobile devices, and showed the reduction of personal mobility [16]. In Italy, by far the most affected European country in terms of infection and mortality in the first wave, the average daily mobility rate has decreased by 42% compared to the period before COVID-19 lockdown [12].
In some observed cities (Augsburg in Germany, Vienna in Austria), the number of public transport users decreased by 80% in the first wave of the epidemic. The decrease in Spain was 75%, in Paris (France) 70%, and in bigger cities in Germany (Berlin, Hamburg and Munich), about 40–60% [17]. Fear of contracting the virus while using public transport is one of the main reasons for the decrease [3]. Recent research in Turkey has shown that women have expressed a higher level of fear of infection than men. The results were based on the statistical t-test comparing the differences in a filling of fear between genders. Perceptions of the virus also differ according to different demographic characteristics (age, education level, and vulnerability) [18].
Due to the pandemic, the factors which determine the mode choice have changed [10]. With the increasing use of automobiles for personal use, some countries have increased the use of alternative transport modes (walking and cycling), where and when the areas allow sufficient distance (for prevention of spreading virus) [19].

2.2. Modelling Changes in Travel Behaviors

In the current time of the pandemic, many authors prepared analyses on travel behaviour modelling. In Table 1, we present some of the most related to our research.
As seen in the literature review, the transportation modal shift was nowhere presented with the spatial modelling such as in our paper. The other authors tested whether the differences between the transportation data in conjunction with sociodemographic data are statistically significant. Some of them [12,20] used the data about transportations flows from some statistical institutes and transportation agencies and determined differences in mobility behaviour based on statistical data. In [21], authors combined stated preference (SP) and revealed preference (RP) data, and they used a questionnaire to obtain data. A survey in [22] also based data gathered from a survey conducted during pandemic time, but as in [20], they do not have comparable data before the COVID-19 outbreak. The pre-pandemic data are thus the result of people’s memory about their habits before the outbreak. The ones who had collected data before the pandemic time and could repeat the survey between the first wave are [6], with the results of their best–worst method being weight scores for specific transport mode. Another who collected data before the outbreak is given in [23], who only used descriptive statistics to determine the changes in the modal shift. The results from [6,23] offer a good insight into what has changed in human mobility behaviour, but they are not related to geographical data such as ours.
On the contrary, we have used the pre-pandemic RP and SP data obtained through our previous research and compared them to the data obtained during the pandemic time in the same area of Vienna city.

2.3. Mode Choice Models

The study of transport choice is not a popular topic only because of the outbreak of COVID-19 but has been studied by the authors before. Various methods have been used for the purpose of modelling transport decisions. A brief literature review in the field of methodologies has already been made in [24]. The methods used in the latest research are presented in Table 2.
Among the more recent contributions to the study of transport choice, logit models predominate [25,26,27,28,29]. Logit models are a good method for evaluating the effect of different factors of mode choice and for understanding individual choices [28]. For example, to study the option for the shift to public transport in a car-oriented city with logit model using a spatial analysis approach [30]. Use the hybrid model to analyse the attitudes towards physical activity on mode choice. The hybrid models enable integrating some variables, which are not used in the conventional mode choice models, such as comfort, convenience, attitude, etc. This is their advantage over the traditional mode choice models. For example, authors used binary logit models [31] and multiple linear and binary logistic models [32] but to a much lesser extent.
The first time was best–worst method used for transport decision making [6,33], which is also based on some personal aspects but have fewer pairwise comparisons than other methods based on AHP. However, like other described methods, the results are not related to the geographical presentation and cannot be directly helpful in the planning or adaptation of the transport network. Addressing this gap, our methodology was developed.

3. Materials and Methods

The method used in the paper is based on the methodology presented by Šinko et al. in one of the recent papers [24]. The methodology’s core is a trade-off between measurable costs (time) and subjective decision-making factors changed during the COVID-19 pandemic period.
The steps in the methodology are presented in Figure 1 and discussed in the subsections further.

3.1. Survey and AHP Calculation

The pre-COVID-19 survey was performed in the summer of 2019 and is described in detail in [24]. The continued research, realised during the COVID-19 period, tackled specific additional questions and was conducted in January 2021 using an online questionnaire. The first part of the questionnaire conducted information regarding gender, age, the type of respondents daily outside activity (job, education, shopping), whether he/she possesses an automobile, the main reason for daily outside activity, and the distance to outdoor activity. The second part of the questionnaire was intended to capture one’s subjective opinion about changes in traffic behaviour because of COVID-19. Data from that part of the survey were not used as an input in the spatial model of differences between the mode choice before and between COVID-19 measures. Instead, the results from that part of the questionnaire were used to check if our model’s results show differences in the same way that people perceive in their daily use of transportation. The third part of the questionnaire was designed to collect data for our model. The survey was realised with the help of an Austrian company specialised in data collections with its own access panel. A total of 200 people fulfilled the questionnaire. The company did not provide the number of people who were invited to complete the questionnaire. Survey respondents were selected randomly within Vienna city. RP data were analysed using the AHP method, which is, due to its simplicity and effectiveness, a widely used method for multi-criteria decision-making [20] and is suitable for decision-making problems such as transportation mode choice.
The respondents were asked to grade the predetermined decisions factors (which was the same three as in 2019) compared of all possible pairs (Figure 2) on the 9-grade Likert scale propped by Saaty (1980).
From each response, we constructed a judgement matrix of pairwise comparisons. Later, with the geometric mean of all constructed matrices, the group judgement matrix was calculated for each question to obtain the factor ranking. Since the consistency ratio (CI) for all matrix used for AHP calculation were <0.1, it implies that the respondents’ evaluation of mode choice factors preference is consistent. For more detailed AHP methodology, reader is redirected to [21].

3.2. Creation of GEO Dataset and OD Cost Matrix Calculation

The detailed process of creating the GEO dataset and Origin–Destination (OD) Cost Matrix calculation is described in [24]. In short, creating a GEO dataset consisted of two steps. First, preparation of a map with spatial layers for map visualisation (e.g., city boundary, districts, main roads, main river) and a fishnet layer of 250 by 250 m cell size. Second, the preparation of a so-called network dataset wasconducted, which is an ArcGIS dataset that is designed to support network analysis. For the presentation of geographic data and for calculations, an ArcGIS for Desktop 10.8.1 software with Network Analyst extension was used. The software is widely used for different optimisations and display of various analyses related to COVID-19 [28,34,35,36,37]. For creating a network dataset, an Intermodal Traffic Reference System Austria dataset (GIP.at) (gip.gv.at, 2019) was used. Over the Vienna area, a network with 6648 origin points was created. Each of those points represents the origin point j for travel decision. OD cost matrix presents the travel times from each individual of the 6648 points of origin to the selected goal destination for all five included alternatives. The selected goal destination could be any destination within the observed city, under the condition that the group under the study of inhabitants is not targeted by trip purpose. In such a case, we generally perform modal split (meaning modal share presenting the percentage of passengers using a particular mode of transport or the number of trips with a specific type of transport mode) or modal shift situation (meaning the switching from one transport mode to another).

3.3. Calculation of the Trade-Off

The final solution is the combination of subjective and objective elements. As seen in (1), the final decision is the product of the time (gathered from OD cost matrix based on time, described in Section 2.2) and the multiplicative inverse of P R value for specific mode i (calculated with AHP method, described in Section 2.1).
w i j = 1 P R i · t j ;  
where w i j presents the final weight for a decision on a specific transport mode i for an individual point on the map j . When all weights are calculated, the minimal weight (2) is selected for the final result.
min   w i

3.4. Examined Study Area

The city of Vienna is the largest city in Austria, with about 1.9 million inhabitants. The city has a well-developed public transportation network [23]. Inhabitants of Vienna use private motorised traffic only to a small extent, according to the data from 2019. As many as 30% of them prefer to walk, 7% to cycle, and 38% to use public transport for daily travels. Only 25% of inhabitants use automobiles for their transportation. Vienna has the lowest car ownership rate (37 cars per 100 inhabitants) of all provincial capital cities in the country. The fact that Vienna residents favour public transport is also confirmed by the number of annual passes sold in 2019 (852,300) [22].
At the time of conducting the survey, Austria had a third lockdown (from 26 December to 7 February). Inhabitants were required to wear FFP2 mask; curfew lasted the entire day (exceptions were: work, buying essentials, helping others, individual physical activity); shops, personal services, restaurants, and hotels were closed [38].

4. Results

4.1. Sociodemographic Characteristics of the Study Sample

This section highlights the quantitative analysis of a sample of 200 participants. As shown in Table 3, the representations of men and woman are equal. The respondents’ age ranged between 17 and 55 (mean average value: μ = 38.39, standard deviation: σ = 10.41 years). Most of the daily activities of the respondents (almost half) were work; the following are purchases and shopping (about 30%) and shopping. The smallest share of respondents have some other activities (such as taking kids to kindergarten and school, walking, etc.) every day, and fewer respondents were travelling to various educational activities every day. The reason for that distribution could be in the age structure of respondents. Among other activities, respondents stated everyday walks and taking children to the kindergarten. The average distance for daily travel was 11.355 kilometres (with the standard deviation σ = 19.23), with a maximum of 200 and a minimum of 0 kilometres.

4.2. Changes in Behavior Because of COVID-19

Respondents have evaluated their agreement with the statement: “For myself, I can say that the situation with the COVID-19 pandemic has changed my travel habits” according to the Likert scale from 1 to 9 (Figure 3).
The analysis revealed that 43% of respondents strongly agree that they changed travel habits (Figure 3). In total, 69.5% of all respondents agree with this statement. Only 25% of respondent maintain that their travel habits have not changed, and 5.5% are undecided. The average grade for the first statement was 6.55 (with the standard deviation σ = 2.89).
More than 50% of respondents stated that they strongly disagree that they used a completely different mode of transport before the epidemic (Figure 4). In total, 74% of all respondents disagree with the statement. Only 17.5% of respondents have changed transport modes completely. The arithmetic mean for this statement was 2.87 ( σ =2.53).
The crucial question is whether the respondents avoid public transport because of the risk of infection (Figure 5). In total, 53% of respondent stated that they do not avoid public transport, and 40.5% prefers not to use public transport because of the risk of infection. The average mean of answers was 4.51 ( σ = 3.21).

4.3. Comparison in Factors before and during the COVID-19 Situation

As aforementioned, we need the priority weight for each of the alternatives and decision factors included in a survey for the final mode choice map. Calculation based on Saaty methodology [21] on three selected factors revealed that the ecological aspect has become more important than convenience (Table 4). The least important remain accessibility and interchanges.

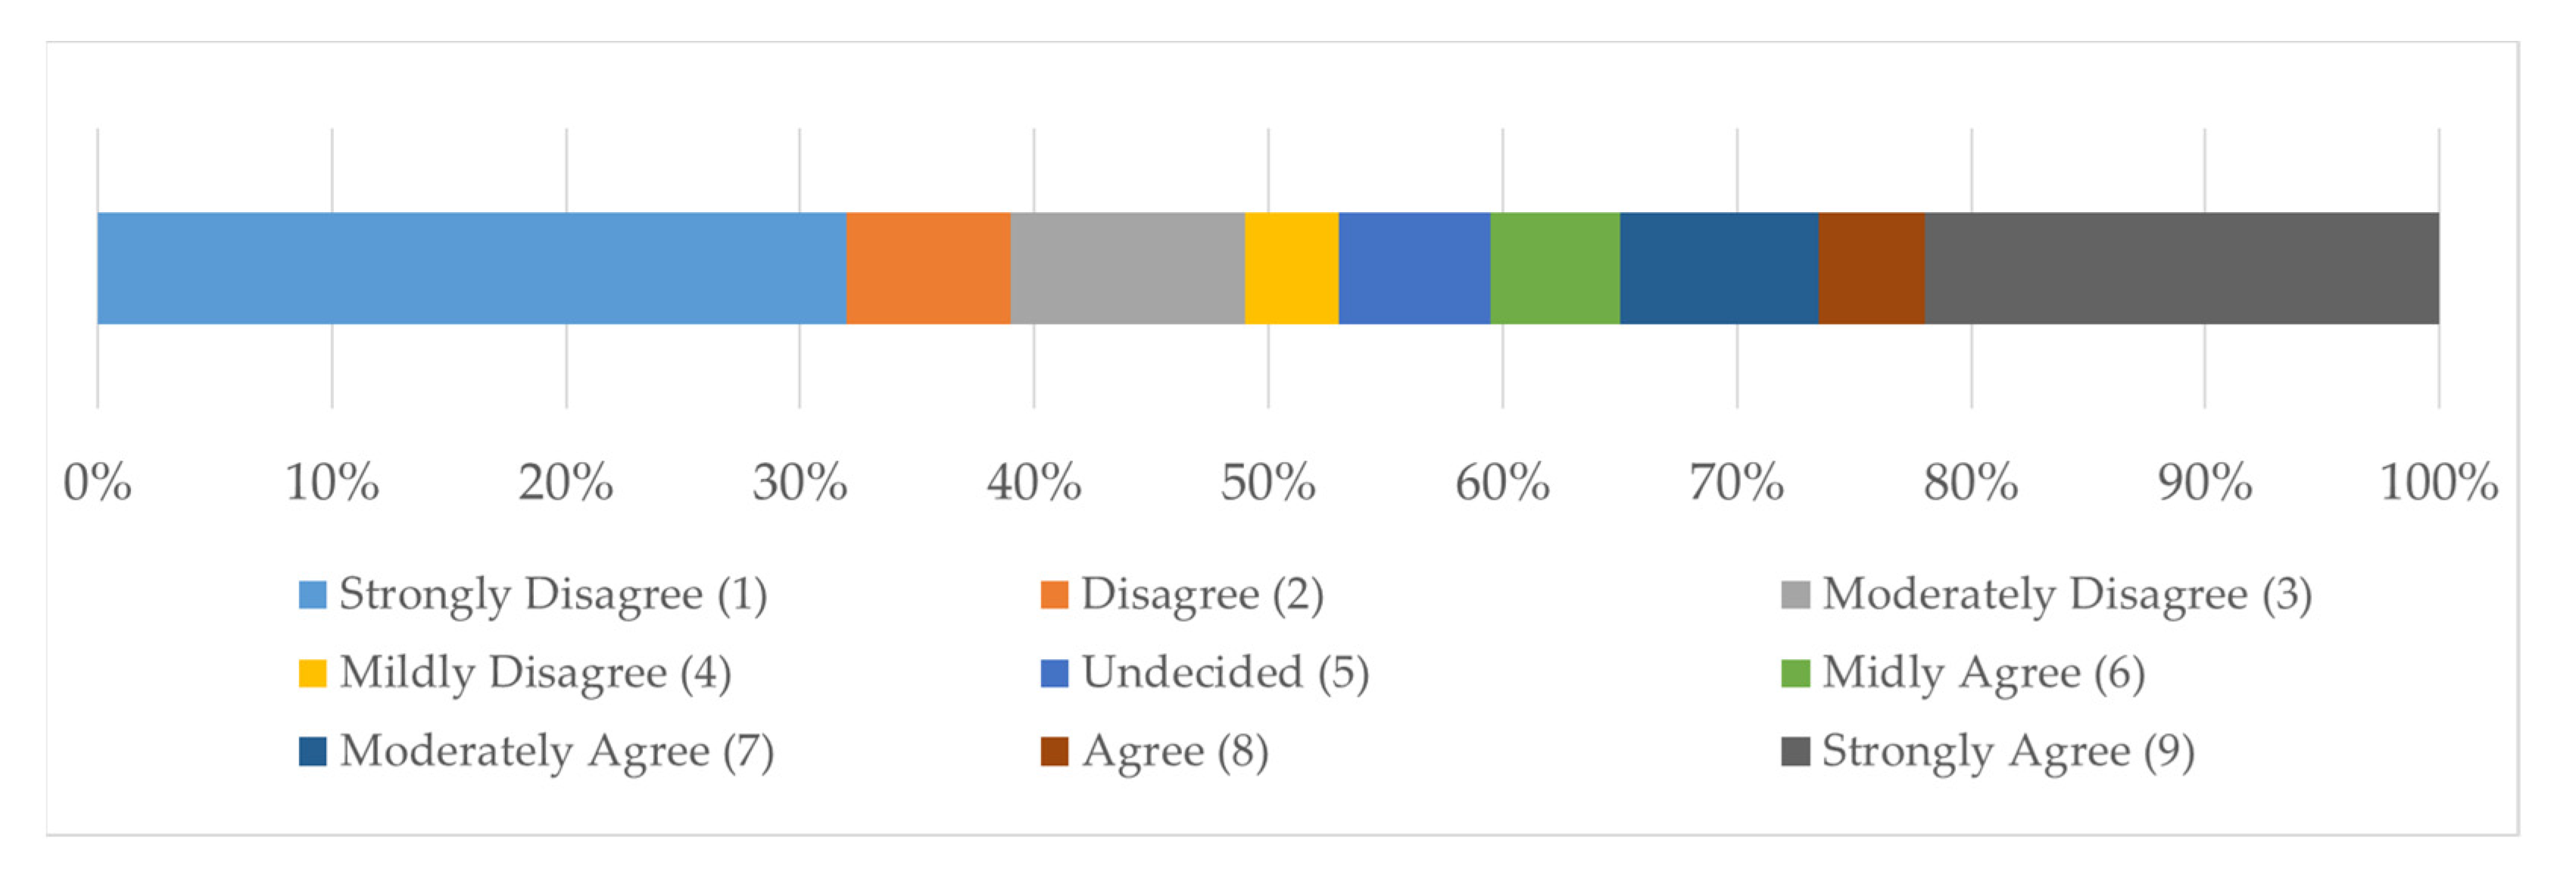
4.4. Preference Rate for Selected Alternatives

The local weights were calculated after pairwise comparison for all included transport mode from the perspective of individual decision factors. Later, the products from the local weights of the alternatives matrix and factor weights were calculated to obtain the preference rate for alternatives (Table 5).
Before the COVID-19 breakout, public transport was the most popular transport mode. In researchconducted during the pandemic, it has lost popularity and is now in third place. Walking and bicycling overtook public transport.

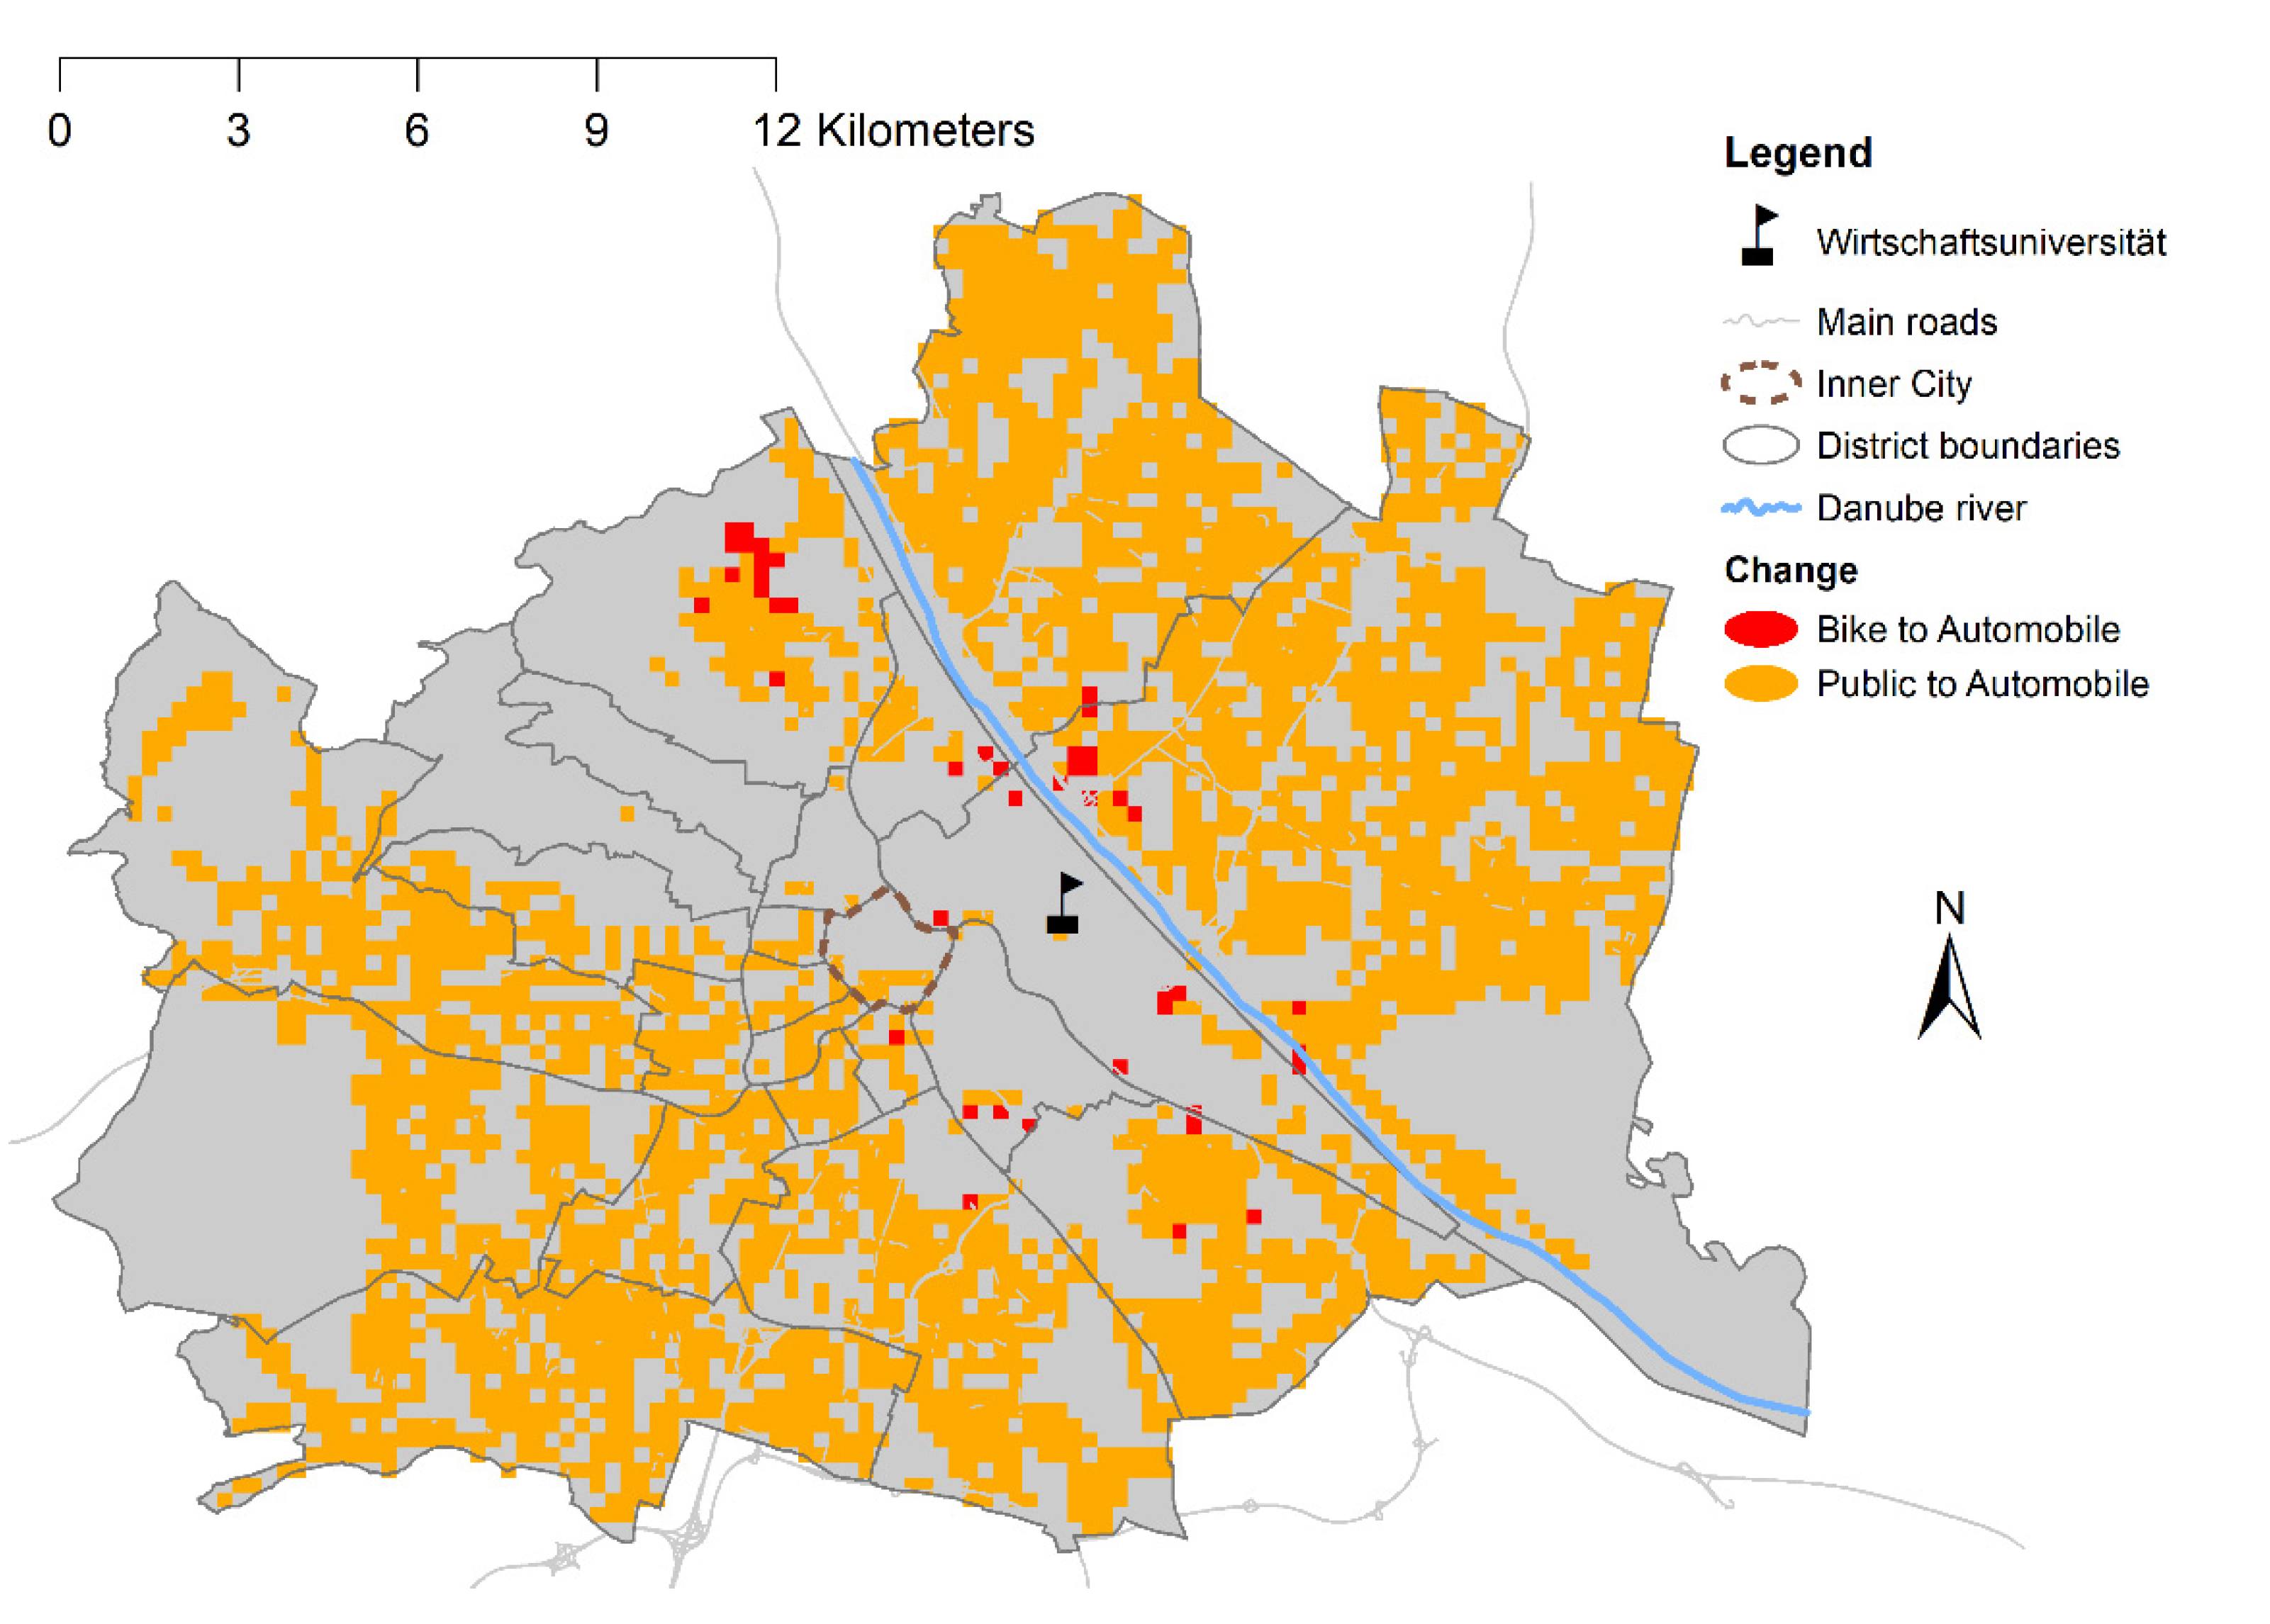
4.5. Mode Choice Map

Our method’s main goal is to combine the objective factor (travel time) and the calculated stated preference and show the results on the map. To show the difference that the pandemic of coronavirus caused, Figure 6a presents the situation in 2019 (before the virus outbreak), and Figure 6b presents the situation in 2021 (middle of the pandemic).
It is seen that the inhabitants of Vienna are much more active in 2021 than they were in 2019. They use more modes of transport in which active participation is required. People who live in the area around the determined goal for trips use the bicycle to travel daily in both observed periods. Only a smaller area near the University makes trips by foot in both cases. However, it is seen that people living in the area along the Danube river became even more active. Generally, in 2019, most of the population used public transport (combined with walking and biking), which in the year 2021 is compensated by bicycling and even more by automobile. From the perspective of sustainable transport, the situation in Figure 6b (2021) is very worrying. In the past, public transport was one of the very commonly used sustainable modes. In the event of a continuation of the COVID virus situation, it will undoubtedly be necessary to consider developing new or different sustainable transport which will not involve close contact and which people will be willing to use. The Inner City, which is the historical heart of Vienna, remains active in terms of transport mode, although it is located relatively far from the selected goal destination. It means that active modes of travel combined with public transport still prevail there. Automobile use has increased slightly but is in the minority.
The trend in the use of individual transport mode is more precisely seen in Table 6. The growth of the areas whose major decision were automobiles is more than 1000% compared to the year 2019, and around 200% more areas’ major decision is now using bicycles. On the other hand, using public transport combined with walking fell by about 70% and combined with the bicycle fell by about 50%.

5. Discussion

Like other recent studies, this study represents an approach to address the changes in travel habits and changed travel mode choices. The advantage is the geographical presentation of the transport choice for the individual areas in the city. However, it can be a helpful input in urban mobilisation planning and strategic responses to the changes brought about by COVID-19.
The Austrian Government has taken strict measures to prevent the spread of the coronavirus. Despite restrictions, public transport in Vienna was never interrupted. It was only advised to avoid public transportation insofar as use is not necessary [39].
The selection and final ranking of index preferences of alternatives from the survey in 2021 were expected based on the inhabitants’ habits before the COVID-19 outbreak. As we noted in the Introduction, residents made extensive use of public transportation before the outbreak [22]. The use of public transport has decreased by two ranks compared to 2019 (Table 2) and was replaced by walking and bicycling. The reasons for the bigger share of automobile users in the final map is in the accessibility with walking and cycling, due to long distances between origin and selected destination areas. Although some countries report an increased share of driving with automobiles, only a small percentage of Vienna’s inhabitants own a car [22]. Those who do not have an automobile have no other alternative to exchange the prior use of public transport if they want to avoid the public transport. Due to the relatively good connections with public transport in the city centre [23] and its immediate vicinity, the inhabitants do not own a car. Due to that, the change in the Inner City to bicycles is expected. The inhabitants, who live farther away from the city centre, probably need automobiles and have the opportunity to change from public transport to automobile.
For a better insight, we analysed the shift in modal split for individual modes in Vienna in Table 7.
The active modes are walking and bicycling, and there were no changes at all—only the one closest area to the selected goal area uses walking for trips completed. There were no shifts because of the long city distances, and the ones that used bicycles before the pandemic continue to use them. Since public transport represents the most significant opportunity to become infected with the virus [11], no shifts were made from other modes of transport to public transport. On the other hand, a large percentage of areas that use public transport before the pandemic now use automobiles (43.67%). Shift from public transport to an active mode (bicycle) is also significant (12.44%). Less than 1% made the change from one active mode to automobile and from one combination of public transport to another, but these shifts are not made because of the COVID-19-related changes.
Other authors reported some different changes and shifts. In Germany, there was a significant reduction in the use of automobiles and buses. At the same time, the rise of walking was detected [40]; other research in Germany [41] reports about the modal split shift away from public transport (a reduction of about 18%). At the same time, an increase in the active mode (of about 20%) and the use of an automobile (of about 3%) has been detected. In Greece [42], the drop in use of public transport is around 21%, and growth in trips made on foot is about 34%. Additionally, in Italy [6], there is a significant shift from public to individual transport modes such as walking, using automobiles and ride-sharing.
In Figure 7, only COVID-19-related changes are shown. We have only shown changes that we find worrying in terms of pollution. Previously sustainable areas, where now residents are expected to choose automobiles for proposed trips, are coloured. Residents in areas closer to the city centre and areas closer to the final destination still choose active transports due to their proximity. Those from more remote places where they used to use public transport are now mostly more inclined to drive an automobile.
The outbreak of COVID-19 changed the way people live. At that moment, it is hard to say what the development of the disease will be and if the use of public transportation as we know today will continue or the researchers will be forced to find new directions of public transport, especially for people who cannot afford their own private transport for various reasons. In the case that a new way will not be found, there is a threat that pandemic will cause the use of older and environmentally damaging automobiles, the use of which is typical for Asia [13]. A similar situation may happen in Europe since the average age of automobiles in Europe is 11.5 years old in 2021 [43].
In our research, we have shown that the automobile becomes the dominant transport mode in Vienna. In Figure 7, it is seen that inhabitants of the large geographical area make less-sustainable decisions about transport modes than prior to COVID-19. Based on the research in Istanbul, the authors are concerned that the automobile will remain the dominant mode of transport even after the pandemic [5]. If the map of modal split (Figure 7) will remain the same in Vienna for a long time after the pandemic, the pollution of the city due to transport will be much higher.
To prevent excessive pollution due to changing decisions about transport mode, the city’s municipal managers will have to make critical strategic orientations about city mobility. The results from this article could be helpful in this process.
The methodology adopted was shown in the example of Vienna city but could be used in any other city in the world. However, travel mode choice results will differ and perceived differences because COVID-19 will be different in different parts of the world. However, for all, it is considered that with the help of our mode-choice map, the decision at the strategic level can be made in the future about network planning.

6. Conclusions

While the number of trips and shorter routes has decreased due to the outbreak of COVID-19, which has had a positive effect on the environment, life is returning to normal. With the release of social measures and the improvement of the pandemic situation, people are starting to travel again, embark on leisure trips, and perform daily duties. The period when the pollution situation has improved is over. In this article, we wanted to check how the changed transportation decisions during the pandemic will shape the mobility of a larger city. The applicability of the methodology was shown in the example of Vienna, where before the outbreak of the pandemic, a large share of residents used public transportation.
The evidence is clear: due to the fear of being infected with the virus (when the virus has not yet been completely eradicated), more people choose to use an automobile than before. In the study case, about 40% of participants agree that the pandemic has changed their travel habits. Moreover, around 40% argue that they now have been avoiding public transport. We confirm the modal shift from sustainable modes to the use of automobiles with the methodology presented in the paper. Compared to 2019, before the virus outbreak, in 2021, there is a larger area of the city where people now prefer automobiles and bicycles usage, while the area where residents opt for public transport is much lower.
It is also important to address that these changes may not be constant, for there is high uncertainty about how the situation with COVID-19 will develop. In the future, more in-detail factors and the impact that the virus will have on future transport choices shall be analysed. The changed situation and different conditions will create a new map of mode choice in cities. Therefore, our results in a small percentage could differ from the actual situation of transport use. We, as with other authors, study the existing situation. We do not even dare to guess much about the future.
The methodology presented considers only preference rate in one part, not how individuals actually decide every day about transport modes. An individual’s hypothetical choice may differ from his actual one.
The added value of our work, in addition to the shown changes about the modal split, is the presented methodology, which can be used to model the spatial distribution of transport mode choice in any large or small city. Moreover, it can be used to model the modal split because of various changes and condition worldwide, not just a COVID-19 outbreak. Such models could be helpful for city authorities in strategic decisions about transport networks.
In our opinion, the field of transport during a pandemic should not slide down on the list of priorities of individual governments (either urban or national). However, it can even be an opportunity to maintain (safe) public transport by encouraging active forms of mobility as much as possible (because of the health benefits they have), and we recommend the use of an automobile only for urgent, otherwise unsolvable situations. COVID-19 is not the only situation that has surprised us. Therefore, we must not compromise on transport policies, but we must take the opportunity to regulate them better.

Author Contributions

Conceptualisation, S.Š., K.P., and T.K.; methodology, S.Š. and T.K.; validation, T.K.; formal analysis, S.Š.; literature review, S.Š.; data curation, S.Š.; writing—original draft preparation, S.Š.; writing—review and editing, S.Š., K.P., and T.K.; visualisation, K.P. and S.Š.; supervision, T.K. All authors have read and agreed to the published version of the manuscript.

Funding

This research received no external funding.

Informed Consent Statement

Informed consent was obtained from all subjects involved in the study.

Conflicts of Interest

The authors declare no conflict of interest.

References

  1. Zhu, N.; Zhang, D.; Wang, W.; Li, X.; Yang, B.; Song, J.; Zhao, X.; Huang, B.; Shi, W.; Lu, R.; et al. A novel coronavirus from patients with pneumonia in China, 2019. N. Engl. J. Med. 2020, 382, 727–733. [Google Scholar] [CrossRef]
  2. Aloi, A.; Alonso, B.; Benavente, J.; Cordera, R.; Echániz, E.; González, F.; Ladisa, C.; Lezama-Romanelli, R.; López-Parra, Á.; Mazzei, V.; et al. Effects of the COVID-19 lockdown on urban mobil-ity: Empirical evidence from the city of santander. Sustainability 2020, 12, 3870. (In Spain) [Google Scholar] [CrossRef]
  3. de Haas, M.; Faber, R.; Hamersma, M. How COVID-19 and the dutch ‘intelligent lockdown’ change activities, work and travel behaviour: Evidence from longitudinal data in the Netherlands. Transp. Res. Interdiscip. Perspect. 2020, 6, 100150. [Google Scholar] [CrossRef]
  4. Canitez, F.; Alpkokin, P.; Kiremitci, S.T. Sustainable urban mobility in istanbul: Challenges and prospects. Case Stud. Transp. Policy 2020, 8, 1148–1157. [Google Scholar] [CrossRef]
  5. Shakibaei, S.; de Jong, G.C.; Alpkökin, P.; Rashidi, T.H. Impact of the COVID-19 pandemic on travel behavior in Istanbul: A panel data analysis. Sustain. Cities Soc. 2021, 65, 102619. [Google Scholar] [CrossRef]
  6. Moslem, S.; Campisi, T.; Szmelter-Jarosz, A.; Duleba, S.; Nahiduzzaman, K.; Tesoriere, G. Best–worst method for modelling mobility choice after COVID-19: Evidence from Italy. Sustainability 2020, 12, 6824. [Google Scholar] [CrossRef]
  7. Marseglia, G.; Medaglia, C.M.; Ortega, F.A.; Mesa, J.A. Optimal alignments for designing urban transport systems: Application to seville. Sustainability 2019, 11, 5058. [Google Scholar] [CrossRef] [Green Version]
  8. Sultan, B.; Katar, I.; Al-Atroush, M. Towards sustainable pedestrian mobility in Riyadh city, Saudi Arabia: A case study. Sustain. Cities Soc. 2021, 69, 102831. [Google Scholar] [CrossRef]
  9. Paulley, N.; Balcombe, R.; Mackett, R.; Titheridge, H.; Preston, J.; Wardman, M.; Shires, J.; White, P. The demand for public transport: The effects of fares, quality of service, income and car ownership. Transp. Policy 2006, 13, 295–306. [Google Scholar] [CrossRef] [Green Version]
  10. Bucsky, P. Modal share changes due to COVID-19: The case of budapest. Transp. Res. Interdiscip. Perspect. 2020, 8, 100141. [Google Scholar] [CrossRef]
  11. Sirkeci, I.; Yucesahin, M.M. Coronavirus and migration: Analysis of human mobility and the spread of Covid-19. Migr. Lett. 2020, 17, 379–398. [Google Scholar] [CrossRef] [Green Version]
  12. Cartenì, A.; Di Francesco, L.; Martino, M. How mobility habits influenced the spread of the COVID-19 pandemic: Results from the Italian case study. Sci. Total Environ. 2020, 741, 140489. [Google Scholar] [CrossRef] [PubMed]
  13. Falchetta, G.; Noussan, M. The Impact of COVID-19 on Transport Demand, Modal Choices, and Sectoral Energy Consumption in Europe. Available online: https://iaee.org/en/publications/newsletterdl.aspx?id=884 (accessed on 24 March 2021).
  14. Zhang, R.; Zhang, J. Long-term pathways to deep decarbonization of the transport sector in the post-COVID world. Transp. Policy 2021, 110, 28–36. [Google Scholar] [CrossRef]
  15. McKinsey & Company Automotive & Assembly. The Impact of COVID-19 on Future Mobility Solutions; McKinsey & Company: New York, NY, USA, 2020. [Google Scholar]
  16. Lee, M.; Zhao, J.; Sun, Q.; Pan, Y.; Zhou, W.; Xiong, C.; Zhang, L. Human mobility trends during the COVID-19 pandemic in the United States. arXiv 2005, arXiv:2005.01215. [Google Scholar]
  17. Bernhardt, J. Decline in Ridership, Adapted Timetables and Disinfection-Robots—The Impact of Corona/Covid-10 on Public Transport. Available online: https://www.urban-transport-magazine.com/en/decline-in-ridership-adapted-timetables-and-disinfection-robots-the-impact-of-corona-Covid-10-on-public-transport/ (accessed on 24 April 2021).
  18. Yıldırım, M.; Geçer, E.; Akgül, Ö. The impacts of vulnerability, perceived risk, and fear on preventive behaviours against COVID-19. Psychol. Health Med. 2021, 26, 35–43. [Google Scholar] [CrossRef]
  19. Lai, S.; Leone, F.; Zoppi, C. Covid-19 and spatial planning. TeMA 2020. [Google Scholar] [CrossRef]
  20. Russo, R.; Camanho, R. Criteria in AHP: A systematic review of literature. Procedia Comput. Sci. 2015, 55, 1123–1132. [Google Scholar] [CrossRef] [Green Version]
  21. Saaty, T.L. The Analytic Hierarchy Process; McGraw-Hill: New York, NY, USA, 1980. [Google Scholar]
  22. Vienna, S. Vienna in Figures 2020. Available online: https://www.wien.gv.at/statistik/pdf/viennainfigures-2020.pdf (accessed on 25 March 2021).
  23. Vienna Public Transport. Available online: https://www.wien.gv.at/english/transportation-urbanplanning/public-transport/ (accessed on 20 April 2021).
  24. Šinko, S.; Rupnik, B.; Prah, K.; Kramberger, T. Spatial modelling of the transport mode choice: Application on the Vienna transport network. Transport 2021, in press. [Google Scholar]
  25. Abe, R. Preferences of urban rail users for first- and last-mile autonomous vehicles: Price and service elasticities of demand in a multimodal environment. Transp. Res. Part C Emerg. Technol. 2021, 126, 103105. [Google Scholar] [CrossRef]
  26. Rahman, F.I.; Bari, M.; Islam, M.; Joyanto, T.P. Analysis of mode choice behavior and value of time in Dhaka city, Bangladesh. Int. J. Traffic Transp. Eng. 2020, 10, 138–152. [Google Scholar] [CrossRef]
  27. Guo, J.; Susilo, Y.; Antoniou, C.; Pernestål, A. When and why do people choose automated buses over conventional buses? Results of a context-dependent stated choice experiment. Sustain. Cities Soc. 2021, 69, 102842. [Google Scholar] [CrossRef]
  28. Halawani, A.T.; Rehimi, F. Evaluation of the intention to shift to public transit in Saudi Arabia. Transp. Res. Part D Transp. Environ. 2021, 94, 102809. [Google Scholar] [CrossRef]
  29. Priya, G.N.; Mathew, S.; Subbaiyan, G. Household structure and the travel pattern of senior citizens for leisure trips. In Transportation Research; Springer: Singapore, 2019; pp. 325–340. [Google Scholar]
  30. Tran, Y.; Yamamoto, T.; Sato, H.; Miwa, T.; Morikawa, T. The analysis of influences of attitudes on mode choice under highly unbalanced mode share patterns. J. Choice Model. 2020, 36, 100227. [Google Scholar] [CrossRef]
  31. Tuan, V.A.; Huong, N.T.T. Analysis of mode choice behavior under adverse weather conditions using ra and sa surveys—A case study from Ho Chi Minh City (HCMC), Vietnam. Lect. Notes Civ. Eng. 2019, 959–964. [Google Scholar] [CrossRef]
  32. Zannat, K.E.; Islam, K.M.A.; Sunny, D.S.; Moury, T.; Das Tuli, R.; Dewan, A.; Adnan, M.S.G. Nonmotorized commuting behavior of middle-income working adults in a developing country. J. Urban Plan. Dev. 2021, 147, 1. [Google Scholar] [CrossRef]
  33. Duleba, S.; Moslem, S.; Esztergár-Kiss, D. Estimating commuting modal split by using the best–worst method. Eur. Transp. Res. Rev. 2021, 13, 1–12. [Google Scholar] [CrossRef]
  34. Carrese, S.; Cuneo, V.; Nigro, M.; Pizzuti, R.; Ardito, C.F.; Marseglia, G. Optimization of downstream fuel logistics based on road infrastructure conditions and exposure to accident events. Transp. Policy 2019. [Google Scholar] [CrossRef]
  35. Fan, S.; Zhang, Z. Predicting spatial distribution of plant functional traits in a forest-steppe zone. Pol. J. Ecol. 2021, 69, 1–13. [Google Scholar] [CrossRef]
  36. Bushira, K.M. Modeling the effectiveness of social distancing interventions on the epidemic curve of coronavirus disease in Ethiopia. Model. Earth Syst. Environ. 2021, 1–11. [Google Scholar] [CrossRef]
  37. Tusa, B.S.; Kebede, S.A.; Weldesenbet, A.B. Spatial distribution and determinant factors of anemia among adults aged 15–59 in Ethiopia; using mixed-effects ordinal logistic regression model. BMC Nutr. 2021, 7, 1–12. [Google Scholar] [CrossRef]
  38. Frassl, A. The Rules of Austria’s Third Lockdown. Metropole, 22 December 2020. Metropole. Available online: https://metropole.at/third-lockdown-in-austria/ (accessed on 23 March 2021).
  39. Hero, L. Vienna Coronavirus Updates. Available online: https://luggagehero.com/covid-19-information/vienna/ (accessed on 20 April 2021).
  40. König, A.; Dreßler, A. A mixed-methods analysis of mobility behavior changes in the COVID-19 era in a rural case study. Eur. Transp. Res. Rev. 2021, 13, 1–13. [Google Scholar] [CrossRef]
  41. Anke, J.; Francke, A.; Schaefer, L.-M.; Petzoldt, T. Impact of SARS-CoV-2 on the mobility behaviour in Germany. Eur. Transp. Res. Rev. 2021, 13, 1–13. [Google Scholar] [CrossRef]
  42. Politis, I.; Georgiadis, G.; Papadopoulos, E.; Fyrogenis, I.; Nikolaidou, A.; Kopsacheilis, A.; Sdoukopoulos, A.; Verani, E. COVID-19 lockdown measures and travel behavior: The case of Thessaloniki, Greece. Transp. Res. Interdiscip. Perspect. 2021, 10, 100345. [Google Scholar] [CrossRef]
  43. EAM Association. Average Age of the EU Vehicle Fleet, by EU Country. Available online: https://www.acea.be/statistics/article/average-vehicle-age (accessed on 19 April 2021).
Figure 1. Methodology adapted in article.
Sustainability 13 07116 g001
Figure 2. Example of the Likert scale based question in the survey.
Sustainability 13 07116 g002
Figure 3. For myself, I can say that the situation with the COVID-19 pandemic has changed my travel habits.
Sustainability 13 07116 g003
Figure 4. During the pandemic, I used a completely different mode of transport before the epidemic.
Sustainability 13 07116 g004
Figure 5. I avoid public transport because of the risk of infection.
Sustainability 13 07116 g005
Figure 6. (a). Mode choice in the Vienna for year 2019. (b). Mode choice in the Vienna for year 2021.
Sustainability 13 07116 g006aSustainability 13 07116 g006b
Figure 7. Areas of changes in Vienna.
Sustainability 13 07116 g007
Table 1. Literature overview of changes in mobility and transport mode choice caused by COVID-19 pandemic.
ArticleYearCountryData CollectingMethod
Cartenì, Di Francesco, and Martino2020ItalyData from Italian national census (ISTAT),
Automatic sensors data
Multiple linear regression model
Shakibaei, De Jong, Alpkökin, and Rashidi2021IstanbulPanel survey during the epidemic (comparison of phase 1, 2, and 3)Descriptive statistics
Shamshiripour, Rahimi, R. Shabanpour, and Mohammadian2020Illinois (US)Longitudinal analysis encompassing multiple survey waves
Travel behaviour survey
Survey about habits, prior to and during the coronavirus
Combining stated preference (SP) and revealed preference (RP) methods
Engle, Stromme, and Zhou2020USCounty-level panel data GPS dataSimple model that relates an individual’s travel decision to perceived disease prevalence
Moslem, Campisi, Szmelter-Jarosz, Duleba, Nahiduzzaman, and Tesorier2020Southernmost ItalyOnline survey prior to COVID outbreak (Nov and Dec 2021) and March and April 2020Best–worst method
Shakibaei, De Jong, Alpkökin, and Rashidi2021IstanbulPanel survey during the epidemic (comparison of phase 1, 2, and 3)Descriptive statistics
Anke, Francke, Schaefer, and Petzoldt2021GermanyOnline survey about mobility habits before and during pandemicDescriptive statistics
Politis, Georgiadis, Papadopoulos et al.2021GreeceOn-field survey before COVID (2019) and online survey after outbreak in 2021Descriptive statistics
Table 2. Literature overview of mode choice models.
Used MethodologyAuthors
Multinomial logit and mixed logit modelsAbe, 2021; Guo, Susilo, Antoniou, and Penestal, 2021; Halawani and Rehimi, 2021; Priya, Mathew, and Subbaiyan, 2020; Rahman, Islam, and Joyanto, 2020
Binary logit modelTuan and Thanh Huong, 2020
Multiple linear and binary logistic modelsZannat, Islam, Sunny, Moury, Da Tuli, Dewan, and Adnan, 2021
Hybrid models or integrated choice and latent variable (ICLV)Tran, Yamamoto, Sato, Miwa, and Morikawa, 2020
Best–worst methodDuleba, Moslem, and Esztergár-Kiss, 2021
Table 3. Sociodemographic characteristics (sample n = 200).
Sociodemographic VariableCharacteristicsn%
GenderMale10050
Female10050
Age15–1942
20–294020
30–395628
40–497035
50–593015
Daily outside activityJob8643
Education168
Shopping5829
Sport2211
Other189
Table 4. Differences in factors.
20192021
FactorPriority WeightRankPriority WeightRank
Convenience0.362610.30692
Ecological aspect0.339820.38851
Accessibility and interchanges0.297630.30463
Table 5. Differences in preference rate for selected alternatives.
20192021
AlternativePreference RateRankPreference RateRank
Walk0.222330.339771
Bicycle0.236120.241342
Automobile0.204740.224364
Public transport0.336910.235803
Table 6. Trend of individual transport mode use (comparison between 2019 and 2021).
Change%
Bike+195.01
Automobile+1390.57
Walk0
Public transport combined with walking−72.68
Public transport combined with biking−48.05
Table 7. Modal choice shifting because of the COVID-19 pandemic.
Shift in Transport Moden%
Active–Active00
Active–Public00
Active–Automobile450.68
Public–Active82712.44
Public–Automobile290343.67
Public–Public250.38
Automobile–Public00
Automobile–Active00
Publisher’s Note: MDPI stays neutral with regard to jurisdictional claims in published maps and institutional affiliations.

