1. Introduction
Digitalization is often seen as a megatrend of our time. However, this trend began several decades ago with the use of the first industrial computers. Nevertheless, due to the exponentially accelerating developments of digital technology and its transformative speed and impact, digitalization is now one of the main drivers for change in our industry and society. The technological developments are often mutually reinforcing; thus, the trend is expected to continue to accelerate. This fundamental socio-economic transformation is envisioned in [
1] and described from an economic perspective in [
2]. Some areas of economy and society, such as commerce, banking, and communication, have already undergone significant changes and are today the digital leaders, while others remain mostly unchanged as identified in a survey among German companies [
3]. In fact, the energy sector was a pioneer of digitalization in using early digital monitoring and control systems in power plants and the transmission network, as explained in the educational publication on power supply systems [
4], decades before the term digitalization became widely used. Today, many digital solutions have already been implemented on all energy value stream steps, yet the value stream itself remains mostly unchanged. Looking forward, a wide variety of future potential digital applications can already be identified. An overview of applications is presented in [
5]. Numerous publications describe specific applications, e.g., a concept of universal smart machines for the energy sector consisting of electric protection equipment, and electricity quality measuring and monitoring devices is recently presented in [
6]. These applications offer enormous potential to positively impact all three aspects of the energy sector “target triangle” (cost, system stability, environmental impact) and might even affect the value stream itself. Whether or not the energy value stream fundamentally changes, digitalization will likely play an essential role in the changes of the energy sector within the next decades [
7].
For companies, regulators, and non-governmental stakeholders, a good understanding of the developments, the digital applications available now and in the future, and their associated impacts, benefits, and risks is essential. On the one hand, this transparency is needed for broad societal and political discussions about the targets and pathways of the digitalization. On the other hand, it is an essential piece of information for companies to develop and sustainably implement digital applications.
Therefore, a framework suitable for the evaluation of digital applications in the energy system is required. Digital applications in the energy sector can be extremely diverse (see definition in
Appendix A) and a large number of stakeholders are potentially involved. A broad range of potential technical, economic, ecological, and social impacts can be caused [
5]. In particular, ecological impacts can be quite substantial and often require a lifecycle perspective for full coverage. Furthermore, the development of new applications can be rapid. Due to the described nature of digital applications, an evaluation framework needs to be highly flexible, on the one hand, yet provide sufficient guidance to make alternatives comparable on the other. It needs to cover the wide range of potential impacts and be able to cope with qualitative as well as quantitative evaluation criteria. The integration of a life cycle perspective must be possible, at least for parts of the evaluation. Furthermore, the perspectives of different stakeholders need to be integrated. Besides that, the level of detail of the assessment needs to be flexible to cope with the varying availability of data and data of varying quality. The flexibility on the level of detail is also important to allow the user to decide if an initial “Quick Check” is desired or rather a “Deep Analysis”.
A variety of methods are applied in the assessment and evaluation of technologies, for example, the technology assessment (TA), the cost benefit analysis (CBA), the multi criteria analysis (MCA), and the life cycle assessment (LCA). In the following paragraphs, we analyze whether and how these methods could be used for the intended purpose.
The technological assessment (TA) is a tool to systematically study unintended, indirect, or delayed impacts of technological developments on society [
8]. In general, the TA is open to different ways of assessing the content matter; however, it provides guidelines regarding the overall process. Several types of TA are discussed in the edited volume [
9]. The advantage of the TA is its very flexible approach, which can be applied to any technology and can cover all impacts. The disadvantage is that no specific methods for assessments are given such that the result heavily depends on the skill and experience of the person/organization conducting the TA, e.g., ref. [
10] states that one success factor is to ensure dedicated academic capacity. Although the method gained high popularity already in the 1970s when the U.S. Office of Technology Assessment was established, it is still frequently applied today in the context of supporting public and parliament discourses, and continues to be refined for this purpose as, for example, in [
11]. It is also applied in the field of digital technologies and in the energy sector. An application of the method for theich isture of t of the digitalizationsocialheate than the expert interviews.ange the tendency of the rsult.e aspects of grid and assessment of “clean energy” is, for example, presented by the International Energy Agency (IEA) in [
12]. In [
13], the method was recently used to assess the future of industry 4.0, which is a key part of the digitalization, and in [
14], TA is used to identify and evaluate digitalization measures for battery cell production. Due to the open nature of the approach, however, TA does not give sufficient guidance on which assessment tools to use and which criteria to consider for the intended purpose of a digital application evaluation framework.
The cost benefit analysis (CBA) is based on the monetary value of efforts and impacts and makes the monetary implications of different alternatives comparable. Non-quantifiable effects can only be included informatively. Although, in theory, a holistic approach is possible, in some assessment areas, such as social acceptance or human safety, it is more difficult to calculate the monetary value as the authors explain in [
15]. CBA guidelines for specific applications, including digitalization topics, are provided by the European Commission and are publicly accessible. For example, ref. [
16] gives guidance on performing a CBA for smart meters, ref. [
17] for smart grids, and [
18] for investment projects. Examples of the use of CBAs in the energy industry are numerous. In the context of this study especially, the CBAs focusing on smart meters are relevant. Reference [
19] presents a CBA for the German smart meter roll-out, ref. [
20,
21] provide CBAs for the roll-out in Great Britain, and [
22] is a review study of the different CBAs performed of smart meter roll-outs in Europe. Of course, the CBA method can also be applied to other topics in the energy sector, such as energy planning [
23] and, more recently, the evaluation of digital condition monitoring for remote maintenance systems in power plants [
24]. Due to the limitation to impacts, which can be quantified as monetary values, however, the CBA is not suitable for holistically evaluating digital applications.
The multi criteria analysis (MCA) method consists of a range of different impact methods, which all use multiple criteria to evaluate alternatives and support the decision-making process, among them being multi attribute utility and value theories (MAUT and MAVT), simple additive weighting (SAW), and the analytical hierarchy process (AHP), as well as outranking methods. A short and concise overview including the advantages and disadvantages per method is presented in [
25]. MCA methods are especially suitable for complex subject matters with multiple objectives and multiple stakeholders with different perspectives. It is possible to integrate qualitative as well as quantitative criteria and take the entire life cycle into account [
26]. The MCA method has been used in the energy sector for several decades and has become even more popular in recent years [
27]. An extensive literature review regarding MCA methods, the area of application, the stepwise approach, strengths and weaknesses as well as used criteria is performed in [
28]. The context of the presented literature review is the sustainability assessment of renewable energy development. The authors conclude that no single impact method can be identified as the best or worst and that hybrid methods, therefore, are becoming increasingly applied. A recent practical example of the use of MCA methods in the energy sector is [
29]. Here, multi-actor adoption of the MCA is used to evaluate different energy options for a German village. Multi-actor adoption allows for the determination of stakeholder-specific criteria, besides stakeholder-specific weights. A recent non-energy-related example of an MCA application is performed in [
30]. Here, a multiple criteria approach is used to assess investment projects, including risk factors where different risk components are included as criteria. Furthermore, the MCA is also already applied to assess specific topics of the digitalization in the energy sector. In [
31], the AHP is used to assess digital energy services regarding energy efficiency. In [
32], an MCA approach is used to identify the most beneficial robotics technology for the power industry. Due to its well-proven use for energy and digital topics and the possibility to include perspectives of various stakeholders and qualitative as well as quantitative data, the MCA is found to provide a suitable basis for the intended digital application evaluation framework.
The life cycle assessment (LCA) follows a cradle-to-grave approach with a focus on identifying and quantifying environmental impacts [
33]. Depending on the quality of the input information, it can provide precise information as to where along the life cycle environmental impacts occur. The LCA is defined by the standards in [
34,
35]. Guidelines for the application of the method are given in [
36,
37]. In a broader sense, the life cycle approach can be used for a life cycle sustainability assessment (LCSA) as a combination of LCA, life cycle costing (LCC), and social life cycle assessment (S-LCA) [
38]. Two LCA approaches can be distinguished: attributional and consequential LCA. While the attributional LCA looks at impacts directly attributed to a product/service, the consequential LCA also takes into account the consequence (marginal effects) in the wider system caused by the product/service (e.g., change of use patterns) as stated in [
33]. Tools and databases are publicly and commercially available and make the LCA easily applicable. However, the skill and experience of the practitioner has a direct effect on the modeling as stated by [
39]; therefore, in-depth knowledge about the assessed life cycle as well as the analysis methods are required to yield meaningful results. Applications of LCA methods in the energy sector are very common. The energy sector is the main contributor to environmental effects, such as the emission of GHG [
40]; therefore, a detailed understanding of the impacts along the life cycle in the energy sector is of outstanding importance. A literature review of LCA studies regarding electricity generation technologies is published in [
41]. An assessment of LCA applications to assess GHG removal technologies is recently discussed in [
42]. The LCA of the deployment of smart meters in the Californian energy system, presented in [
43], is frequently referenced in this paper. LCA methods have already been applied to a variety of digital topics. An assessment of different home energy management applications is presented in [
44]. In [
45], a LCA concept for assessing new industry 4.0 applications is proposed, which uses ICT to automatically gather and monitor relevant mass and energy flows. Overall, the LCA is a well-established method for assessments with a life-cycle perspective of energy and digital topics and enables the inclusion of effects along the entire life cycle. Therefore, it is found to be a suitable assessment tool to be used in the context of the proposed framework.
Some of the methods described above can be combined. A recent example of the combination of MCA and LCA is [
46], wherein a surface treatment process is evaluated. Eight criteria in the categories of economy, ecology, and technology are assessed in an LCA. The results are aggregated, using three different MCA methods. All criteria are quantitative. The authors conclude that the combination of MCA and LCA has a high potential while not finding any significant differences in the outcome between the three MCA methods. The prosuite project, documented in [
47,
48], aimed at developing a new methodology for the sustainability impact assessment of new technologies. A combination of LCA and MCA is proposed. The authors suggest a new hierarchical structure of impact categories, criteria, and so-called contributors. A LCA is used to assess the criteria. All criteria are quantitative. For the aggregation, the MCA methods of weighted sum and outranking are used. The project shows how LCA and MCA can be combined as a powerful assessment and evaluation tool. In the energy sector, a combination of the LCA and MCA methods is used by [
49] to assess and evaluate 11 energy mix scenarios for Mexico until 2050, along 17 criteria in the categories of environment, economy, and society. The combination of MCA and LCA is well established. However, without further assessment methods, the combination lacks the possibility to cope with non-quantifiable data and is, therefore, not suitable for the intended purpose.
Furthermore, the MCA is also commonly combined with stakeholder/expert interactions. A recent example in the energy sector is [
50], where a participatory MCA is conducted (and combined with system modeling) to assess linkages between water resources and energy technologies in Morocco and evaluate water-saving measures. Digitalization topics have also already been evaluated based on a combination of MCA and stakeholder/expert interactions. In [
51], most recently, the authors use an MCA method as well as expert interactions to identify the relevance for the sustainability of different enablers of the industry 4.0 development. An approach to assess countries’ industry 4.0 readiness level based on MCA methods and expert interactions is recently presented in [
52]. The assessment via expert interactions is suitable for qualitative information; however, results may have higher uncertainty. In the context of the evaluation of digital applications in the energy sector, the long-term environmental impacts, in particular, require a more thorough life-cycle assessment.
In [
53], the authors conduct an MCA to compare electricity generation technologies combining the MCA with both LCAs (for qualitative data) and expert judgment (for qualitative data). For each criterion, a specific assessment method, i.e., LCA or expert judgment, is determined. This approach offers many of the characteristics required for the intended purpose of the study presented here. However, the clear allocation of assessment methods to criteria does not provide sufficient flexibility for the purpose of evaluating the wide variety of digital applications with different availabilities of data.
As revealed by the discussed literature, the application of evaluation methods in the energy sector is frequently used and well-proven, especially the combination of MCA and LCA. Besides that, first applications of the discussed evaluation methods for specific digital topics are identified. None of the discussed methods or combinations of methods, however, are directly suitable as an evaluation framework for the variety of digital applications in the energy sector. Although the approach presented in [
53] already shows several important characteristics, it does not meet the required specifications described above. Furthermore, the promising combination of MCA, LCA, and expert interactions has not yet been applied to digital applications. Therefore, the aim of this paper is to provide an evaluation framework for digital applications with the required properties and to demonstrate it on a selected example.
The remainder of the article is organized as follows: the proposed evaluation framework and its adaption are described in
Section 2. In
Section 3, the application to a German smart meter roll-out is evaluated as a first test of the framework’s suitability. Finally, the results of the evaluation are discussed in
Section 4, whilst a critical reflection of the suitability of the proposed framework is performed and potential adaptions are suggested in
Section 5.
3. Test of the Proposed Framework
After the development of the evaluation framework and its adaption to digital applications in the energy sector described in Section 0, a digital application is evaluated as a first test of the framework’s suitability. The evaluated digital application is the smart meter roll-out in Germany. This application is well defined by a German federal law [
68]. As it is one of the main topics of the digitalization of the energy sector, it offers reasonably good availability of data.
3.1. Analysis of Boundaries and Assumptions
In the following section, the smart meter roll-out, the analysis boundaries, and key assumptions are described.
The subject of the evaluation is the smart meter in comparison to the conventional meter. The comparison is conducted in the context of the German national smart-meter roll-out over a time period of 20 years. Operational roll-out effects (e.g., replacing still-functional conventional meters, system effects which require a minimum number of smart meters to become effective) are not considered, but rather a steady-state of using smart meters vs. using conventional meters.
The basic functionalities of the smart meter and its components (§21) as well as the smart meter roll-out (§29) in Germany are defined by the federal law for “digitalization of the energy transition” [
68]. According to §21, a smart meter needs to have the functionality to measure the electricity used or produced and relevant grid parameters to store and manage the data, to provide an option to visualize energy-related data, to establish secure connections to transmit energy-related data, to connect further devices and to provide an option to implement different types of tariffs. The smart meter herein is called the intelligent measuring system (iMSys) and consists of the modern measuring device (mMe) and the gateway (GW), which is the communication unit. At this point in time (26 November 2020), there are four producers of smart meters offer devices, which meet the above criteria and are certified as defined by the German federal office for information security, while five others are still awaiting certification. The smart meter configuration modeled in this study is based on the information provided by two manufacturers exclusively to this research project.
The list of assumptions on aspects of the smart and conventional meters, such as the electricity consumption per device, lifetime, and the recycling share, is displayed in
Table A1 (
Appendix B). As no reliable information could be obtained on the maintenance need, the maintenance processes are not included in the LCA model. Several assumptions are taken regarding the as-is and future development of key aspects of the energy sector, including the number of metering points, the electricity demand, and the electricity GHG intensity.
The above-mentioned federal law also describes the roll-out plan. Energy consumers of more than 6000 kWh/year are required to receive an iMSys, while all smaller consumers receive only the mMe without the communication device. Energy producers with a bigger capacity than 7 kW are also required to install an iMSys. However, a revision of the German law for renewable energies [
69], which is currently debated, envisions a roll-out of iMSys to generation assets of above 1 kW. The present study assumes a roll-out as described in the “Rollout Scenario Plus” of [
19]. Based on this scenario, there will be installed 16.2 Mio iMSys and 35.4 Mio mMe, thus a total of 51.6 million meters in Germany. One difference between the used scenario and the currently planned roll-out exists. In the “Rollout Scenario Plus”, it is assumed that all generation assets with >0.2 kW receive an iMSys instead of the currently planned limit of >1 kW. However, the difference in terms of number of smart meters as well as in terms of system impact is believed to be small enough to be disregarded. According to data of the German registry for electricity generators available at [
70] in 2020, there are only ~29 thousand generation assets that fall into the described range versus a total of 1.52 million assets under the definition of [
69].
The electricity demand in Germany is modeled based on the “Energy market prognosis” [
71] of the German Federal Ministry for Economic Affairs and Energy. On the one hand, efficiency increases have reduced the demand in recent years and further efficiency increases can be expected during the next decades. On the other hand, a strong electrification trend is expected, e.g., electric cars, electric heating, which would increase electricity demand. Therefore, overall demand is expected to remain constant over the next 20 years.
The development of the GHG intensity of the German electricity mix is estimated based on historic emission and energy consumption data from the European GHG Inventory [
72] and yearly report of the specific CO
2 emissions of the German energy mix published by the German Environment Agency [
73] as well as the reference prognosis and trend scenario for future energy generation in [
71] adopted for the 2019 developed coal exit path described in the final report of the German “Coal Commission” [
74]. In contrast to the referenced climate reports, in this LCA, the GHG intensity is calculated as the global warming potential over 100 years (GWP100—calculated according to the “AR5” dataset given in [
75]). The GWP100 also includes effects of upstream value stream steps, e.g., the proportionate use of the electricity grid. Thus, the GHG intensity values calculated based on the GWP100 are higher than those ones of the referenced data. The GWP100 is measured in kg CO
2 eq. emissions (kg CO
2 eq.), which means that also GHG emissions other than CO
2, e.g., methane, are included, normalized to the effect of CO
2. Hence, in the following, if CO
2 eq. emissions are mentioned, the underlying calculation is the GWP100. This approach leads to an GWP100 of the German electricity mix of 0.460 (2020), 0.330 (2030) and 0.257 kg CO
2 eq./kWh (2040) as stated in
Table A1. For all production process steps, the energy mix of 2020 is used; for the use-phase steps, the energy mix of 2030 is used; and for the end-of-life phase, the energy mix of 2040 is used.
In order to include the impacts of the smart meter on the energy system, a consequential LCA is performed. The question of how smart meters impact the energy system is discussed widely and several studies have come to different conclusions. In this study, two technical impacts on the energy system are considered: a reduction of the energy demand and a reduction of the required grid reinforcements. These are described as the most relevant technical impacts in the German smart meter cost–benefit analysis [
19]. The reduction in energy demand is believed to be due to increased transparency on energy consumption of different appliances, leading to a behavioral change. The magnitude of behavioral change seems to depend on the level of feedback that a user gets from the smart meter, i.e., feedback via in-house displays or online platforms accessible via mobile devices result in more energy savings compared to feedback via the integrated display of the meter, which is usually located in a non-living area of the building. A good overview of different evaluations of the expected energy savings is given in ([
20], p. 19 Part II). The authors cite 57 different studies indicating energy savings between 0 and 19.5%, with the most reliable studies ranging between 1 and 4%. The authors conclude to use 2.8% for the British cost–benefit analysis. For Germany, the authors of [
19] conclude to take a more conservative approach due to the high level of uncertainty and assume an average energy saving of 1.8%. This study follows this overall conclusion. However, several aspects that may influence the overall energy savings are not modeled separately, such as different types of user feedback, the difference in savings between mMes and iMSys and the size (in kWh) and location of the smart meter user. Since the uncertainty of this assumption is high, especially because it is unclear whether the energy savings are time persistent, a sensitivity analysis with a focus on the energy savings assumption is conducted.
Besides the potential energy savings, the smart meters could also reduce the necessity for grid reinforcements. Grid reinforcements could be avoided due to improved planning based on more data points from the smart meters, due to reduced peak loads based on remotely controllable, small-scale distributed generation assets, and due to the reduction in energy demand. In [
19], the authors quantify the reduction based on these three effects as 1% in the high voltage transmission grid and 30% in the low and medium voltage distribution grid. The reduction potential in the distribution grid is much greater, as the controllable small-scale generation assets are usually connected to the low voltage grid. This study follows the conclusion on grid reinforcement reduction taken by the authors of [
19].
Although a variety of other impacts are likely to materialize, they are not included in the LCA as they are difficult to quantify, and no consistent values are found in the literature. Among these impacts is the increased integration of renewable energies, which could lead to a CO2 eq. emission reduction and the effects of improved load shifting, which could further increase the reduction of the required grid reinforcements. Instead, these effects are reflected in the qualitative expert interview evaluations.
3.2. Life Cycle Assessment
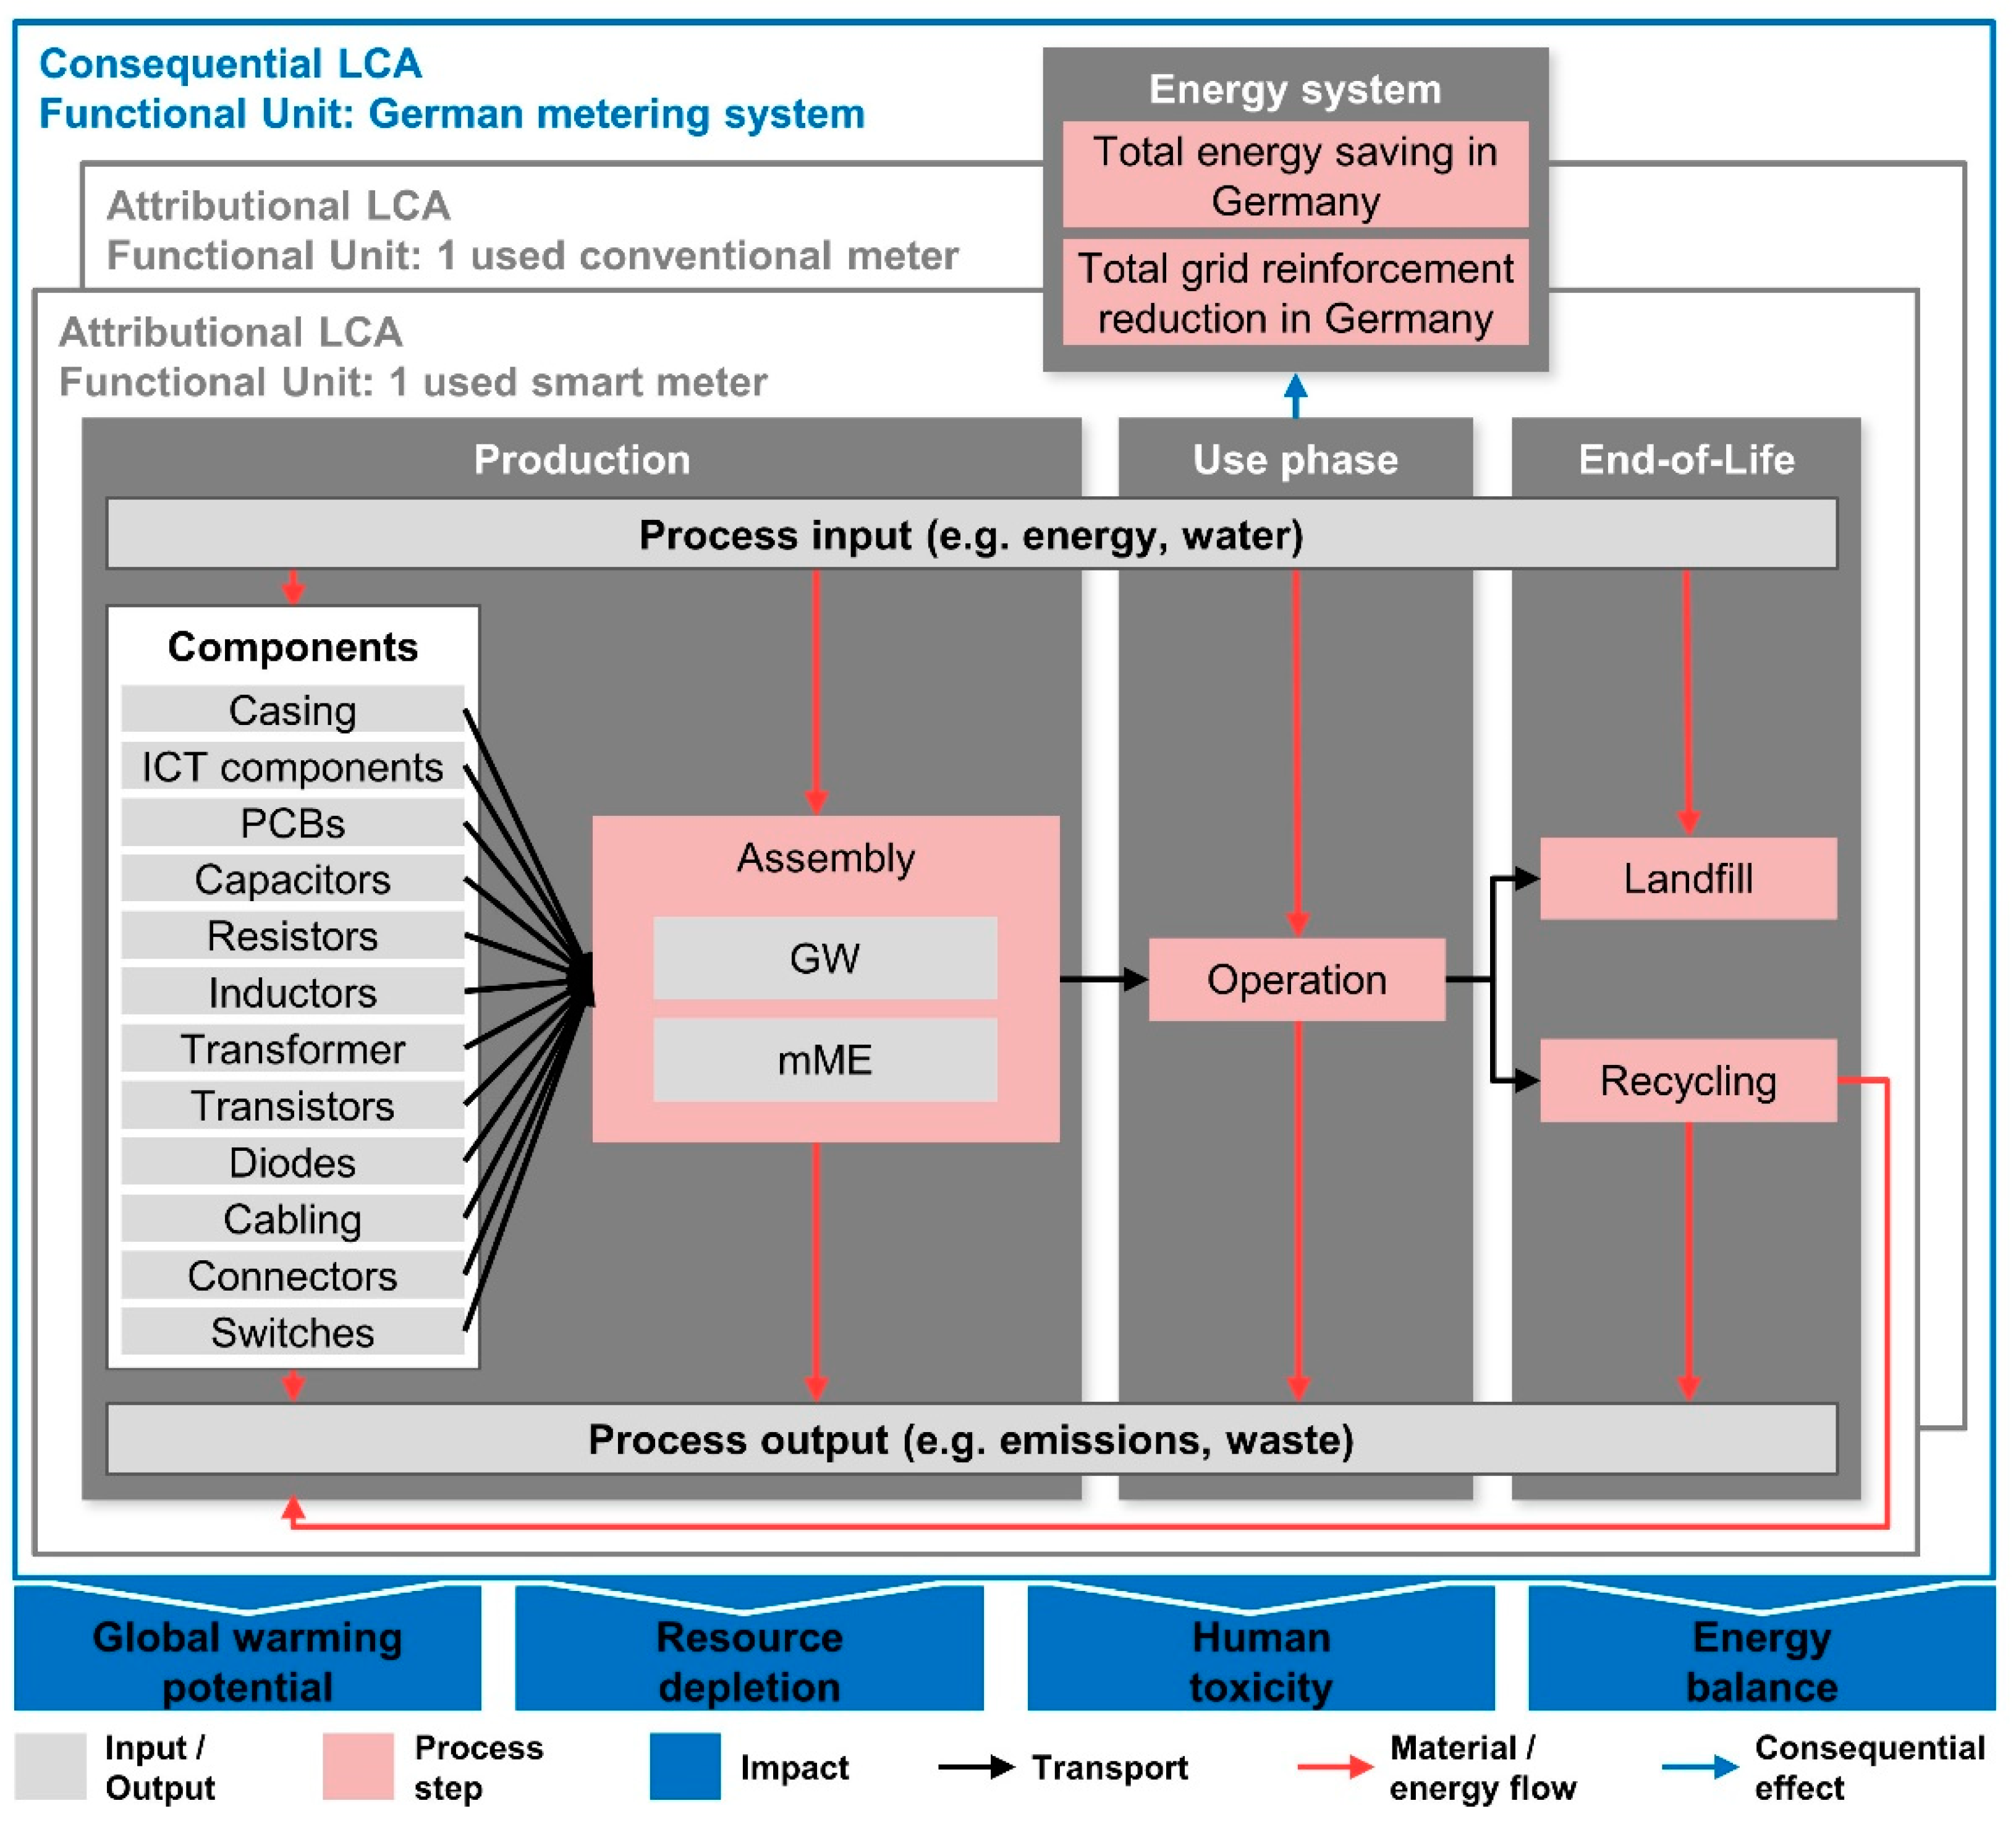
A consequential life-cycle assessment is performed for the smart meter roll-out. For this purpose, first, the life cycle of one individual smart meter and one conventional meter (as a comparison) is analyzed. In a second step, these findings are put into the context of the German electricity system over an analysis period of 20 years, which roughly resembles the lifetime of electricity meters. In a last and final step, the effects (consequences) that the smart meters cause in the energy system regarding energy demand and the need for grid reinforcements are included. A schematic overview is depicted in
Figure 4.
The life-cycle analysis of an individual smart meter (consisting of a mMe and a GW) is conducted in cooperation with two smart meter manufacturers. While one shared rather high-level results of the previous internal life-cycle analysis, the second one provided full transparency on the list of components assembled in the devices and their geographic origin (data supplied in several iterations between January 2019 and December 2020). All standard components, such as resistors, capacitors, and transistors (see
Figure 4), are detailed based on the specific components’ datasheets. All custom components, such as the device case, are detailed by the smart meter manufacturer.
The entire list of components and their origins is modeled in OpenLCA (1.10.1), using the ecoinvent (3.3-cut-off) database and a slightly modified version of the CML 2001 impact assessment method. The standard settings for production of the identified components are mostly used; however, the geographic location is adapted and the required transport is added. For some components, no standard settings are available; here, new settings based on literature and web research about the components’ production process are implemented.
The main impact category discussed in the following section is the global warming potential over 100 years (GWP100). Further analyzed parameters are the energy balance, human toxicity (HTP100), and the depletion of resources as the most relevant expected ecological impacts caused by digital applications in the energy sector.
The life cycle analysis results reveal that 75% of the GWP100 of the smart meter’s production is caused by the gateway, with the biggest contributor for both devices, GW and mMe being the ICT components. The total production-related GWP of one smart meter is found to be 82 kg CO
2 eq. When the use phase as well as the recycling/landfilling are added to the LCA, the total smart meter lifetime GWP is calculated to be 558 kg CO
2 eq. Similarly, to the smart meter, the conventional meter is modeled. However here, data of incorporated materials from [
43] are used for the life-cycle assessment. The overall production GHG footprint of a conventional meter is found to be 11 kg CO
2 eq., and therefore much smaller than the footprint of the smart meter. The total conventional meter lifetime GWP is 211 kg CO
2 eq.
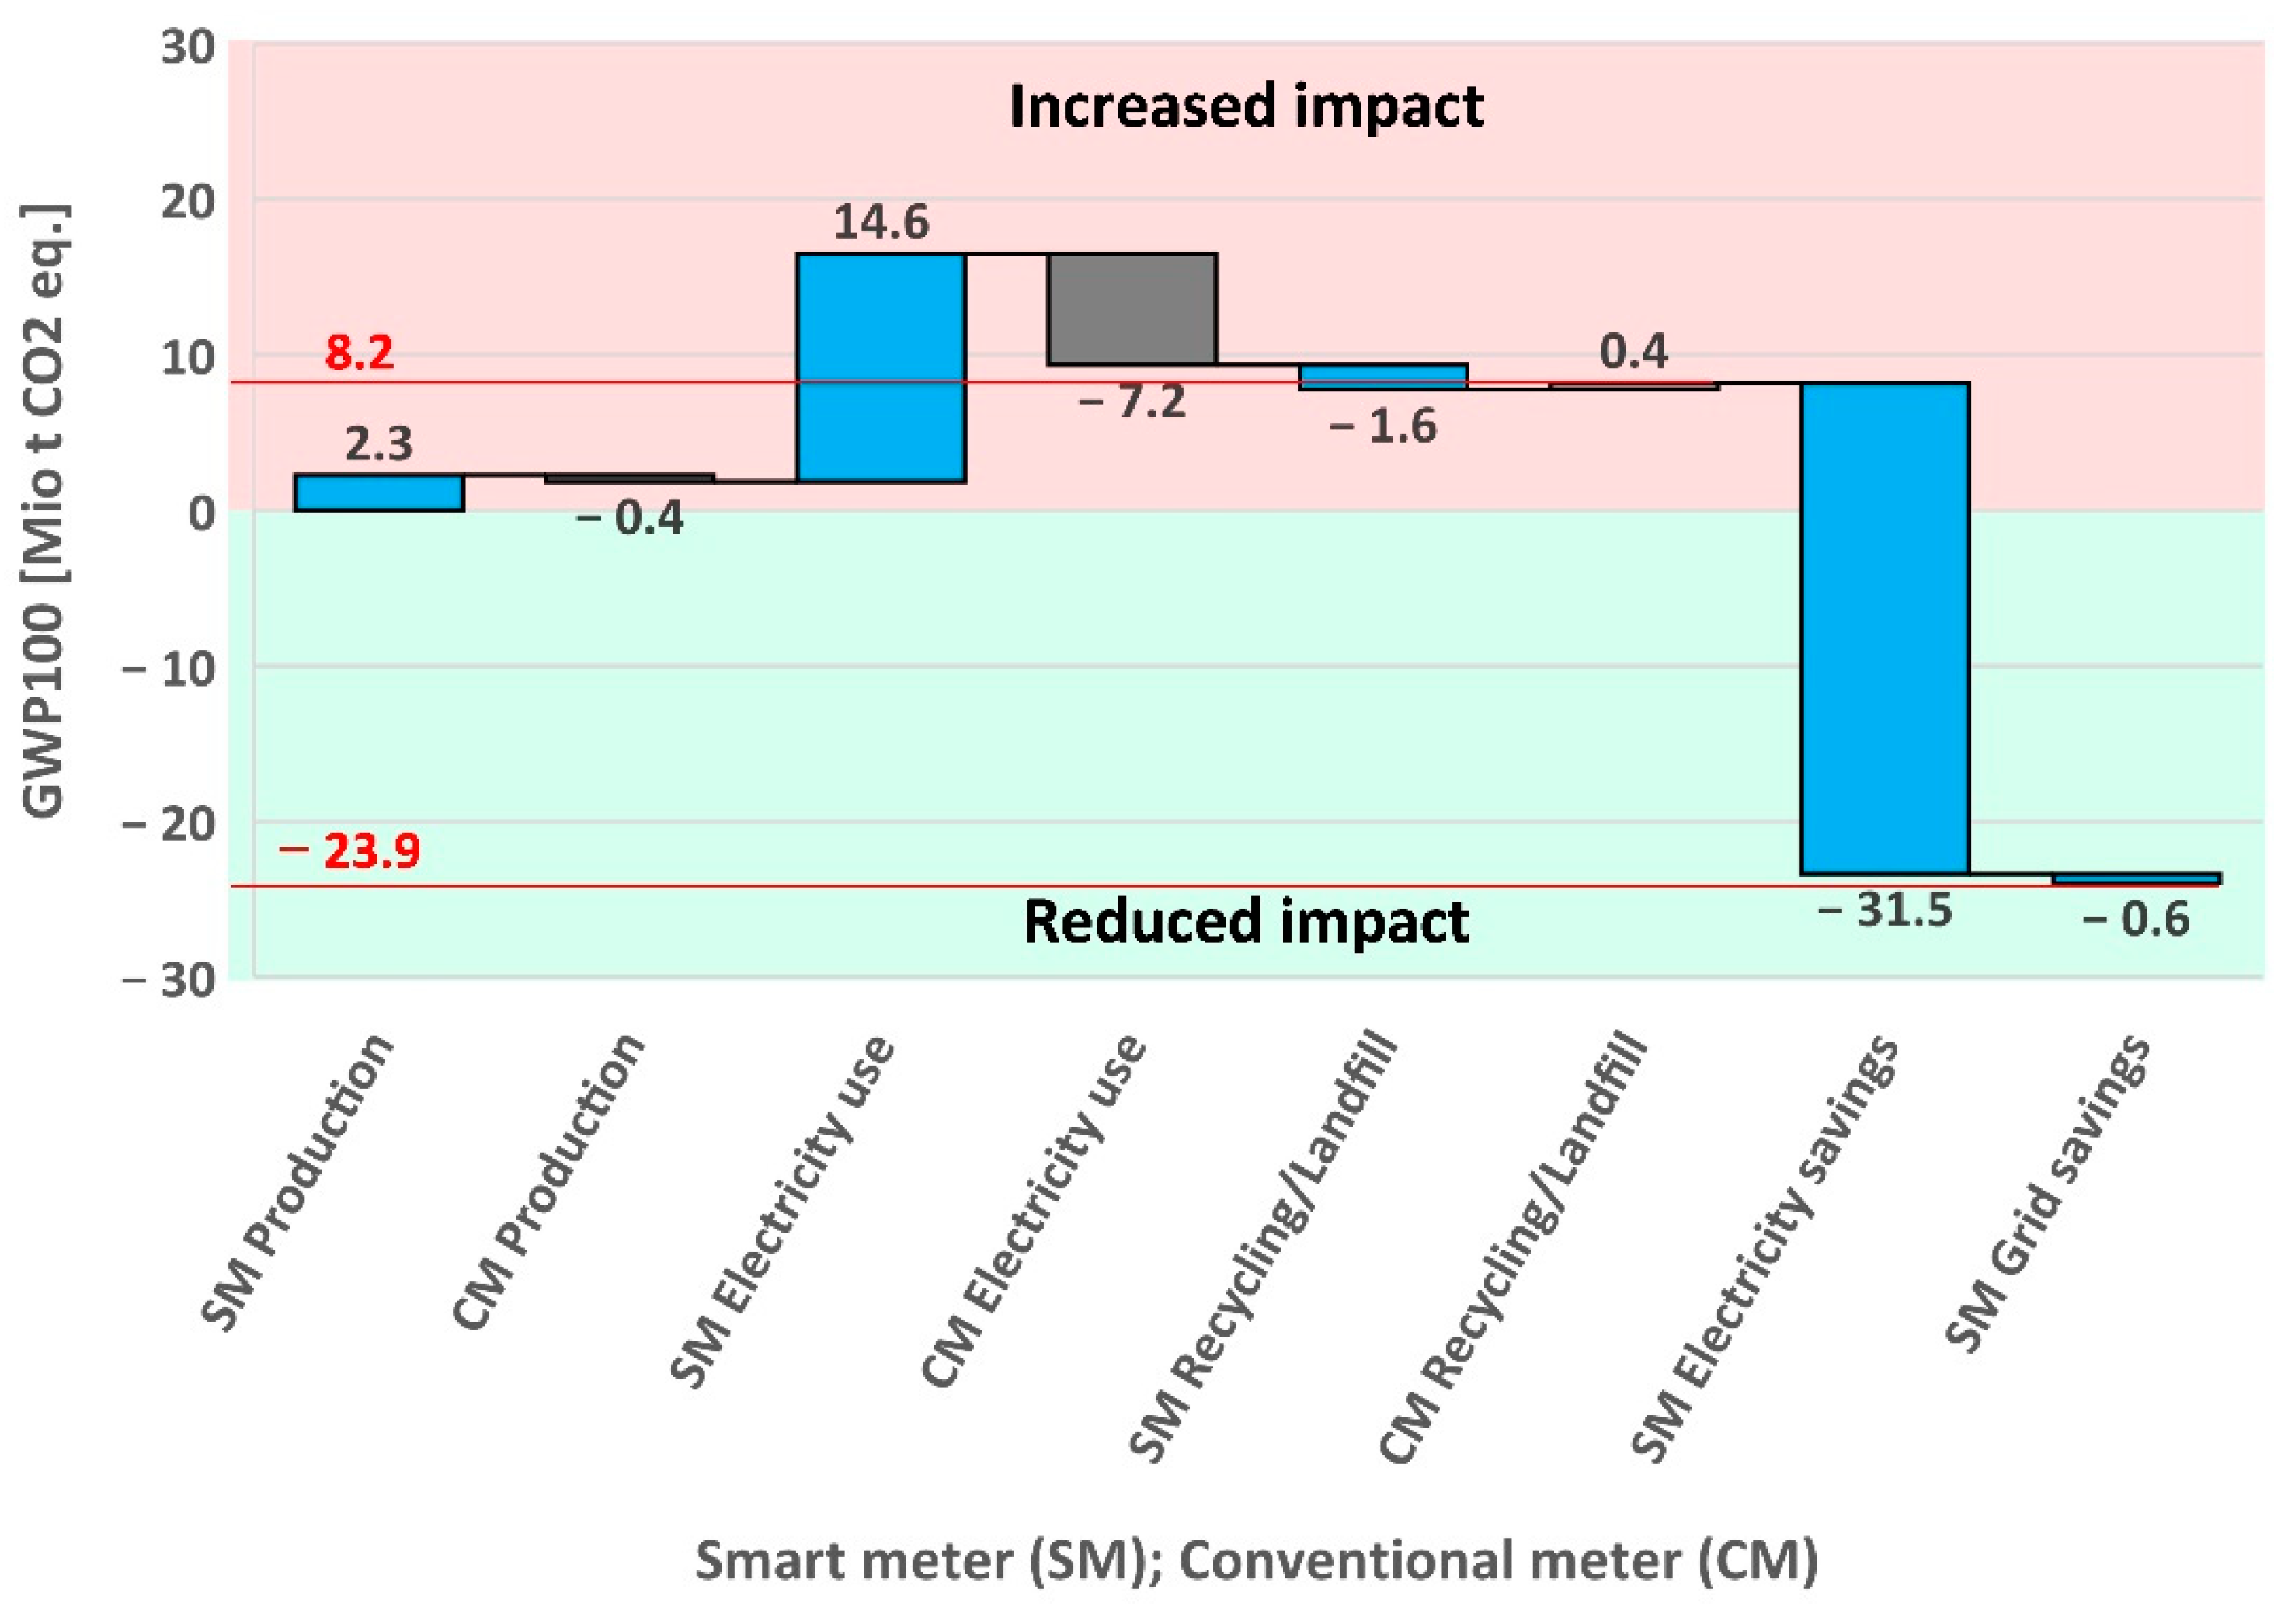
In order to directly compare the smart meter and the conventional meter, their lifetime needs to be proportionally considered, i.e., 20/18 = 1.11 smart meters and 20/30 = 0.67 conventional meters are required during the 20-year analysis period. The result shows that the use of a smart meter causes an increased GWP100 impact of about 489 kg CO2 eq., more than the use of a conventional meter over 20 years. However, not all consumers will receive fully-fledged smart meters; some, depending on their consumption, will only receive a mMe without the GW. Therefore, the roll-out assumption about the number of mMes and full smart meters (iMSys) described in Section 0 need to be considered. Approximately 35.4 million mMes and 16.2 million smart meters (iMSys), instead of a total of 51.6 million conventional meters, are assumed to be in use during the analysis period of 2020–2040. The life cycle impact (including production, use-phase, and end-of-life) of the smart meter roll-out, compared to using conventional meters, is an increase in the GWP100 of 8.2 × 10⁹ kg CO2 eq., i.e., 8.2 Mio t CO2 eq. over 20 years.
However, the use of smart meters also causes effects within the energy system, which need to be included in the consequential LCA. As discussed in Section 0, the two system effects of electricity savings and reduction of grid reinforcements are modeled. Taking into account the life cycle impact of smart and conventional meters and the positive system effects of smart meters, overall, a GWP100 reduction of 23.9 Mio t CO2 eq. over the analysis period of 20 years is identified.
The GWP100 results of the LCA of the live cycle comparison between smart and conventional meters are depicted in
Figure 5. GWP100 impacts of the conventional meter are regarded as negative, as they are seen as avoided impacts.
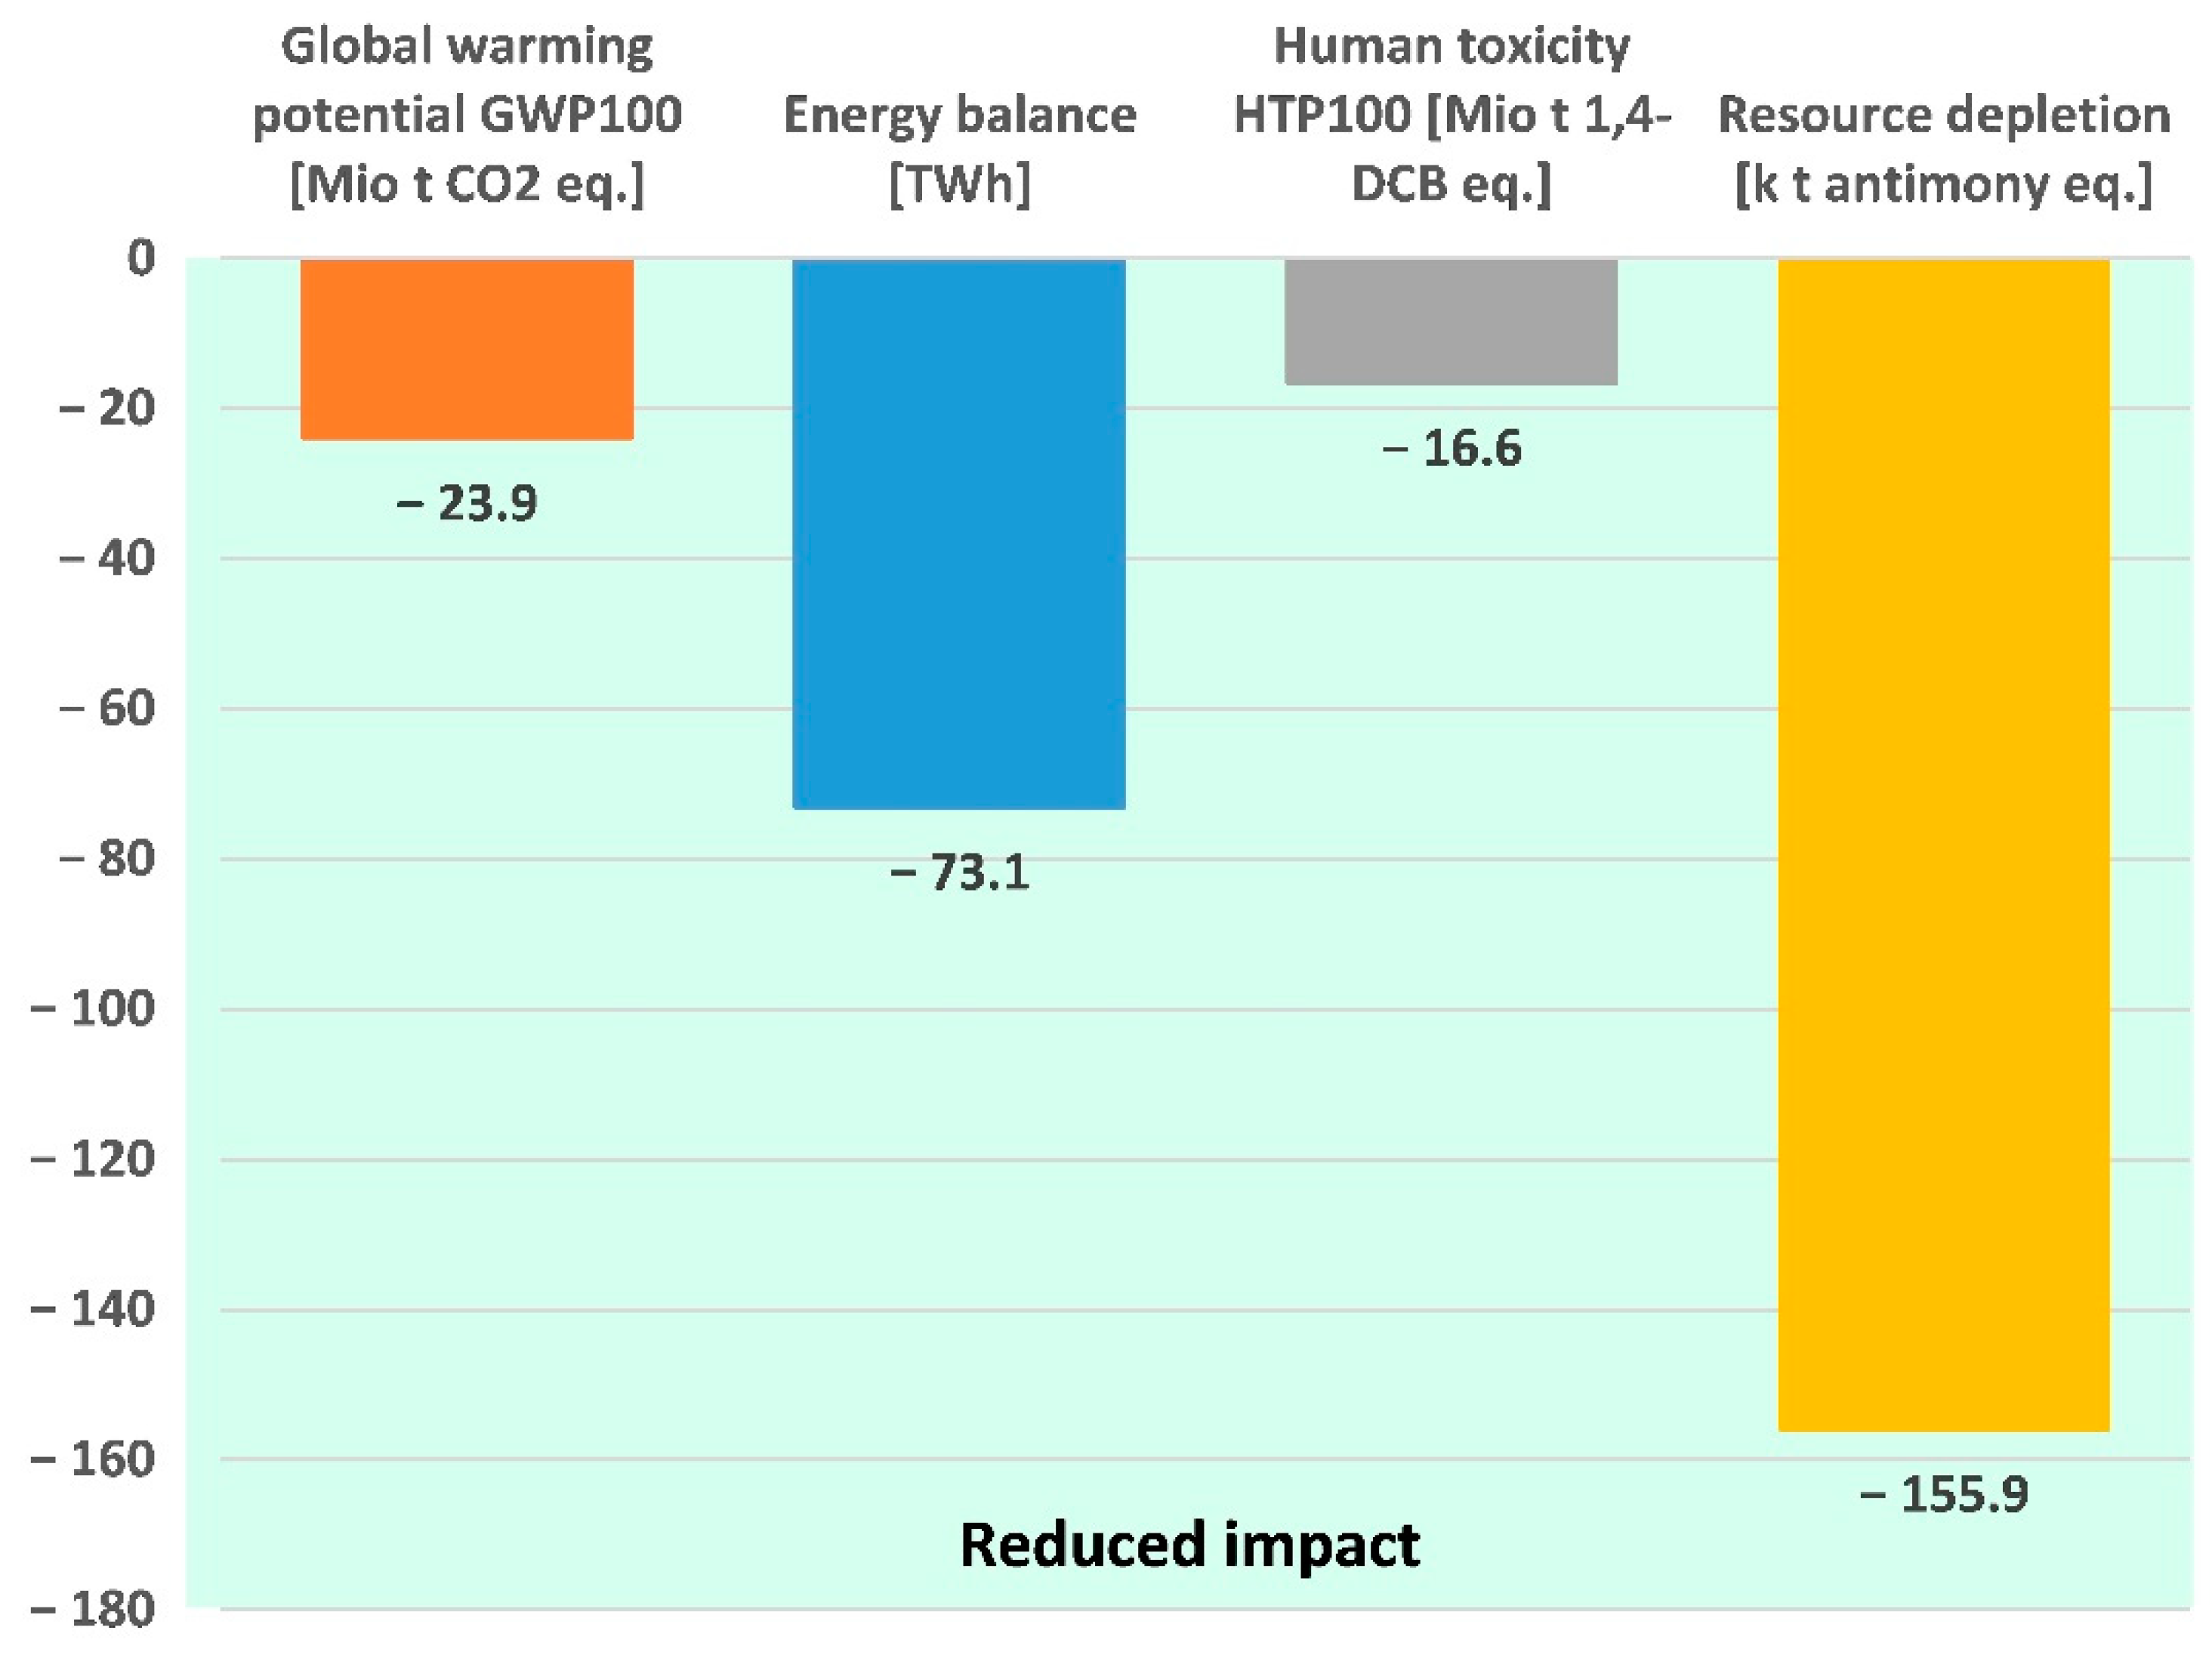
Besides the GWP100, two further LCA impact categories, human toxicity, and resource depletion, as well as the LCA energy balance, are analyzed. Under the above-described assumptions (base scenario), all parameters show a significantly positive impact of the smart meter roll-out (see
Figure 6).
The sensitivity of the results to different assumptions is discussed in
Section 3.4 (see Figures 9 and 10).
3.3. Expert Interviews and MCA Evaluation
The expert interviews to evaluate the smart meter roll-out in Germany are conducted with the same seven experts already consulted to develop the weighting profiles (see Section 0). In some cases, weighting and evaluation are performed within one session. For every criterion, the experts could decide whether they want to provide any evaluation at all and, if so, if they want to evaluate on the criteria level or, in case they feel sufficiently knowledgeable, on the sub-criteria level. This approach ensures that experts can evaluate criteria in-depth in their area of expertise, while avoiding evaluating criteria where they lack the required expertise.
For the aggregation of results, the SAW method is applied (see
Section 2.4), using the weights of the defined weighting profiles (see
Figure 3).
As one of the goals of the presented evaluation framework is to combine the views of different stakeholders, the overall evaluation is calculated based on the arithmetic average of each sub-criterion, criterion, and category across all experts. One adaption, however, is made. Since two of the experts are representatives of a regional energy utility, their results are averaged first such that they only contribute as one expert to the overall result (same procedure as conducted for calculating the weighting average).
For LCA criteria, i.e., energy balance, GWP100, resource depletion, and human toxicity, only the normalized LCA results are used for the MCA evaluation. The quantitative LCA results need to be translated into the qualitative MCA evaluation scale from −3 to +3. As described in
Section 2.4, the reference for this normalization needs to be determined for each criterion and for each assessment of a digital application. In this case, the results are translated against an internal value, the results of the “2.25% electricity savings” scenario, which reflects a very positive scenario. The scale is set to be +3 for the results of the “2.25% electricity savings” scenario and 0 for zero effect on the impact category. For the base scenario, this translates into MCA evaluations of +2.3 for the energy balance, the GWP100, and the resource depletion and a +2.5 for human toxicity.
Overall, the above approach leads to the results depicted in
Figure 7 and
Figure 8. While
Figure 8 provides a better overview of aggregated results,
Figure 7 is particularly important to understand which benefits are generated by the application and where risks of negative impacts appear. This knowledge can start a solution-finding process to resolve the causes of negative evaluations.
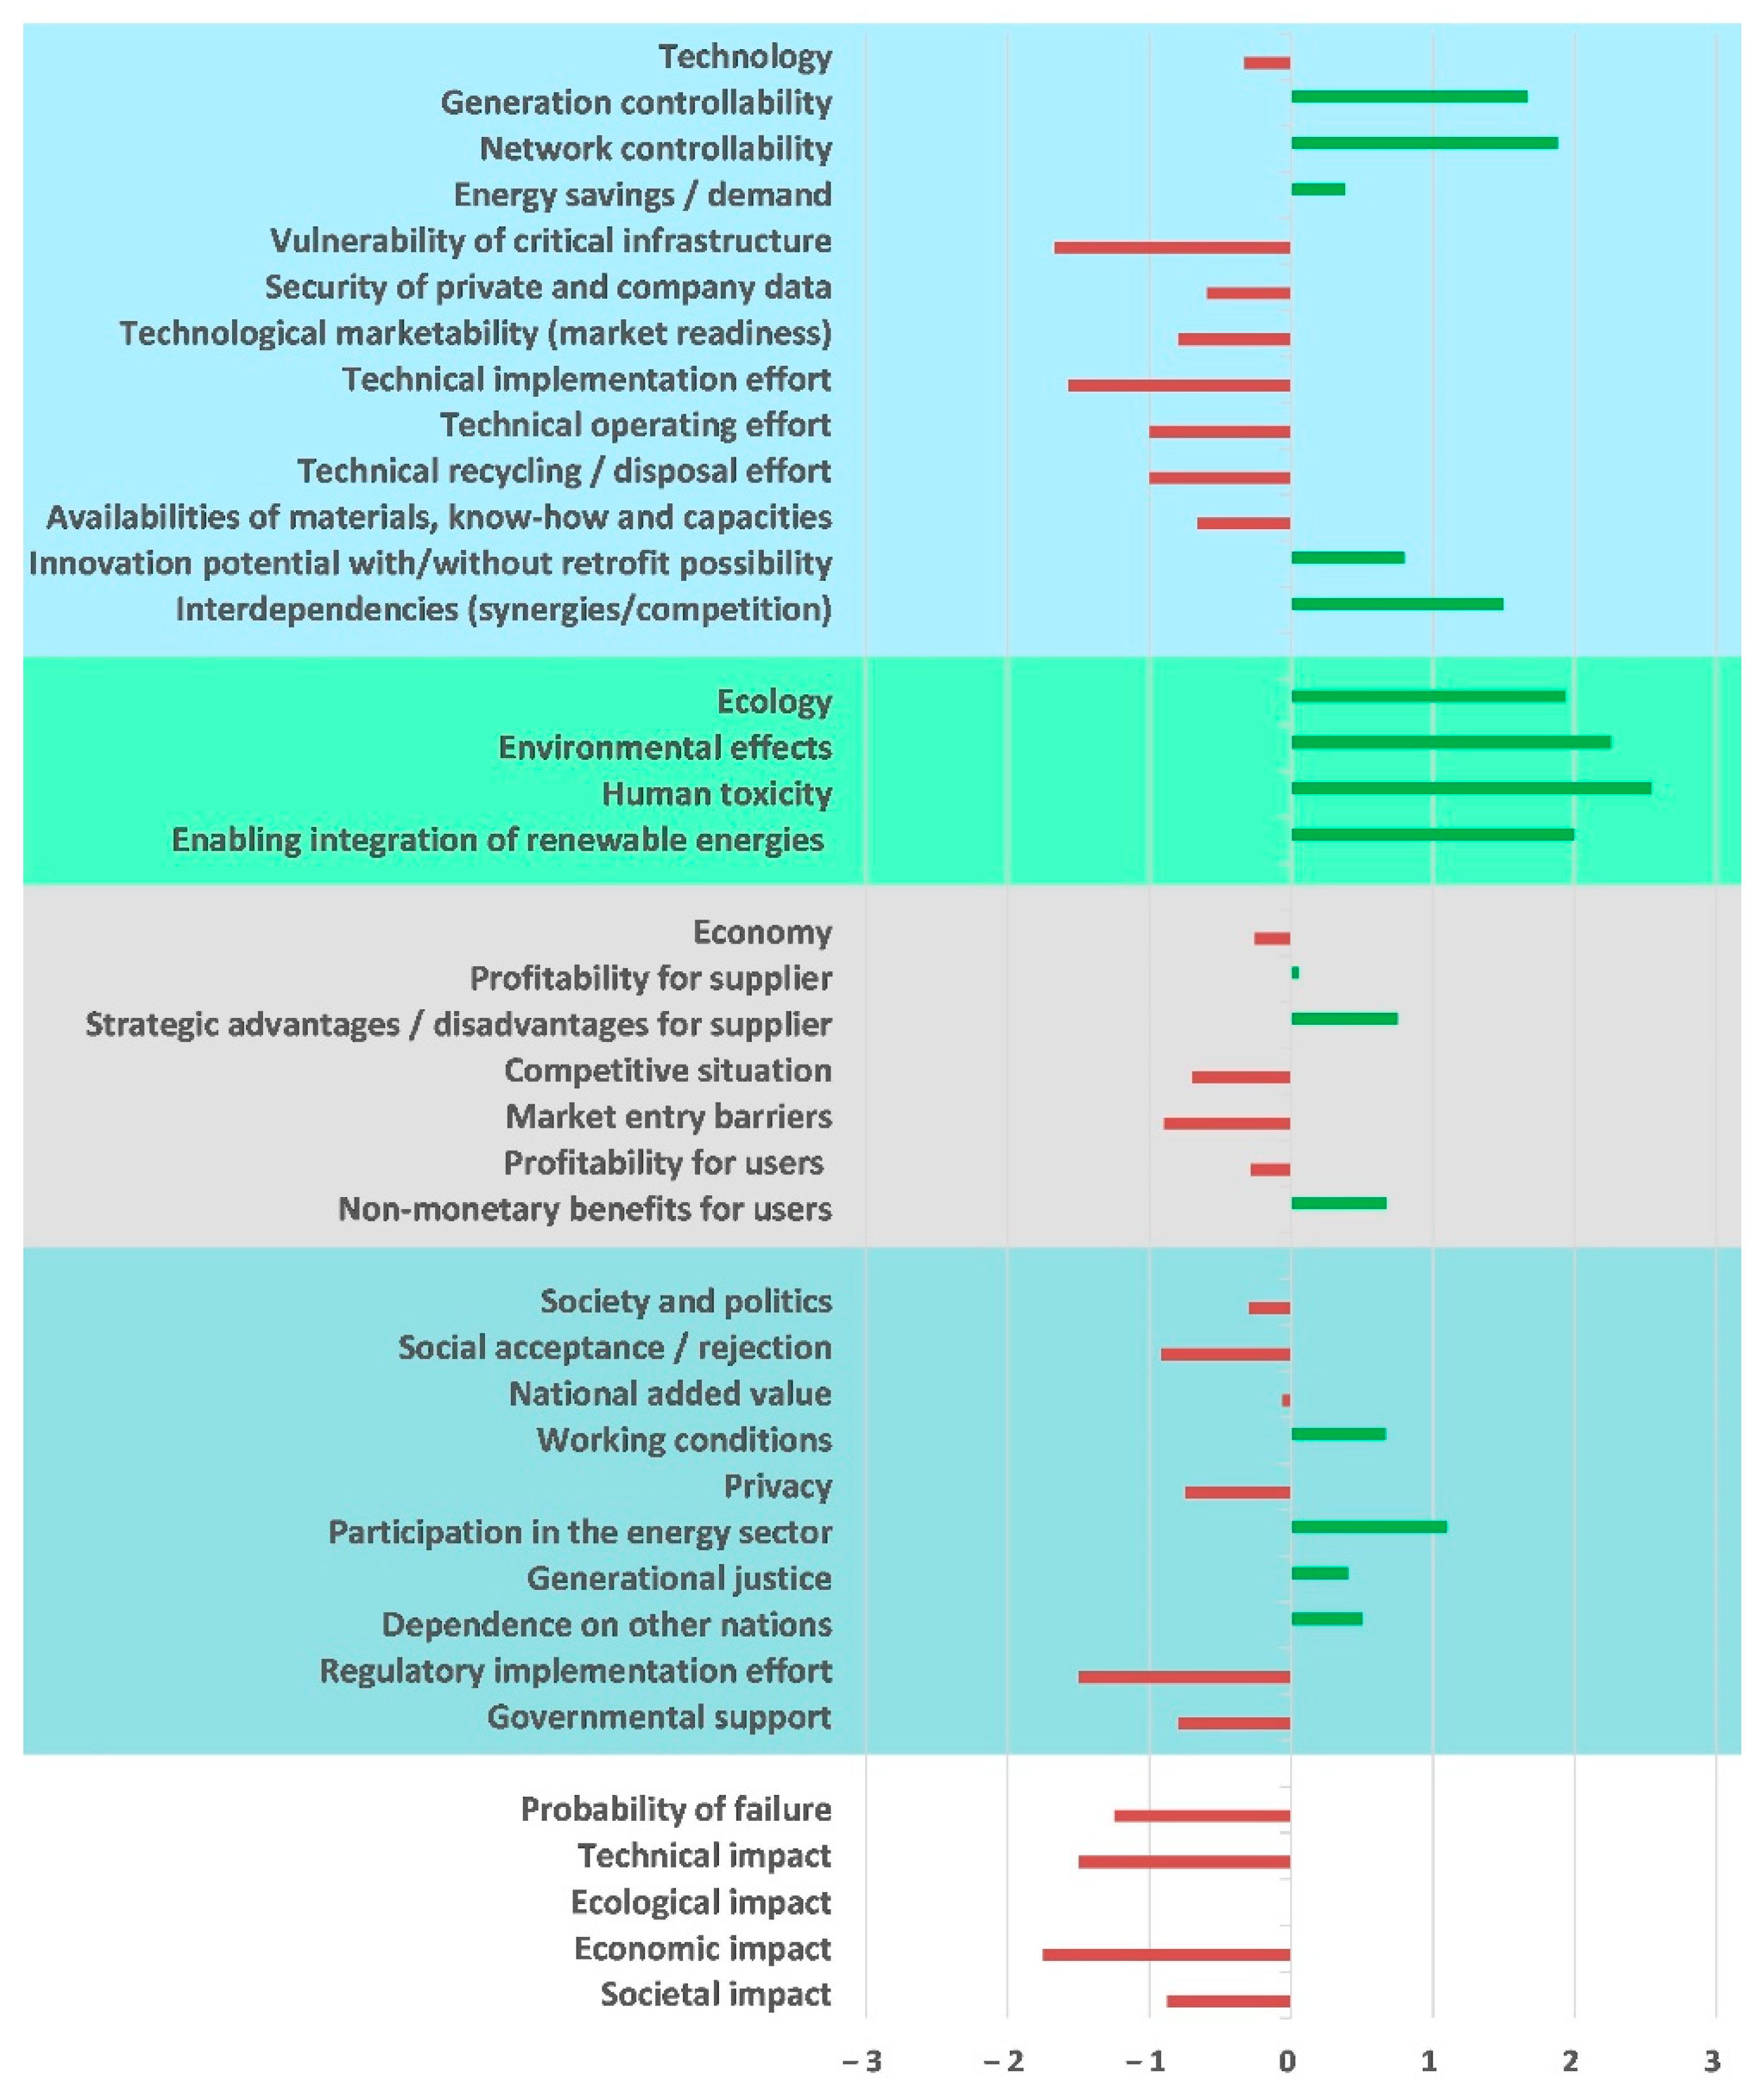
The results per criterion for the national economy weighting profile are depicted in
Figure 7. The categories technology, economy, and society and politics show an overall negative evaluation while ecology overall is evaluated positively.
In particular, the category technology reveals a negative result. The main negatively evaluated criteria are the impact on the vulnerability of the critical infrastructure and the technical implementation effort. On the side of positively evaluated criteria, the effects on the controllability of the generation and the grid are among the most positive. Further positively evaluated criteria are the innovation potential and interdependencies.
The ecology result is significantly positive across all criteria and sub-criteria.
The economy category is evaluated as slightly negative, mainly due to high market entry barriers and expected future increased competition. The most positive criteria of this category are the non-monetary benefits for the supplier and the user. For the supplier, the potential to reach new customer segments and for the user an increase in convenience are the most positive non-monetary benefits. The monetary profitability for the supplier is very slightly positive. On the other side, the profitability for the user is negative.
In the category of society and politics, the experts see a significant need for regulatory implementation effort and the need for governmental support. Furthermore, it is expected that the smart meters will be met with rejection rather than with acceptance. The main positive criterion of this category is the increase in participation of formerly passive consumers in the energy sector.
For the evaluation of the probability and impact of potential failures, the worst technical malfunction is considered. For the smart meter roll-out, this worst case is assumed to be a widespread malfunction of the meters, delivering no or wrong consumption, generation, and grid data. The case of an intentional attack on smart meters is already covered in the criterion vulnerability of the critical infrastructure. The biggest negative impacts are believed to be of an economic and technical nature, while the societal impact is only slightly negative, and no ecological impact is expected. As risk is a cross-functional category, no category score is calculated, but the evaluations are allocated to the respective category where the impact occurs.
As discussed in
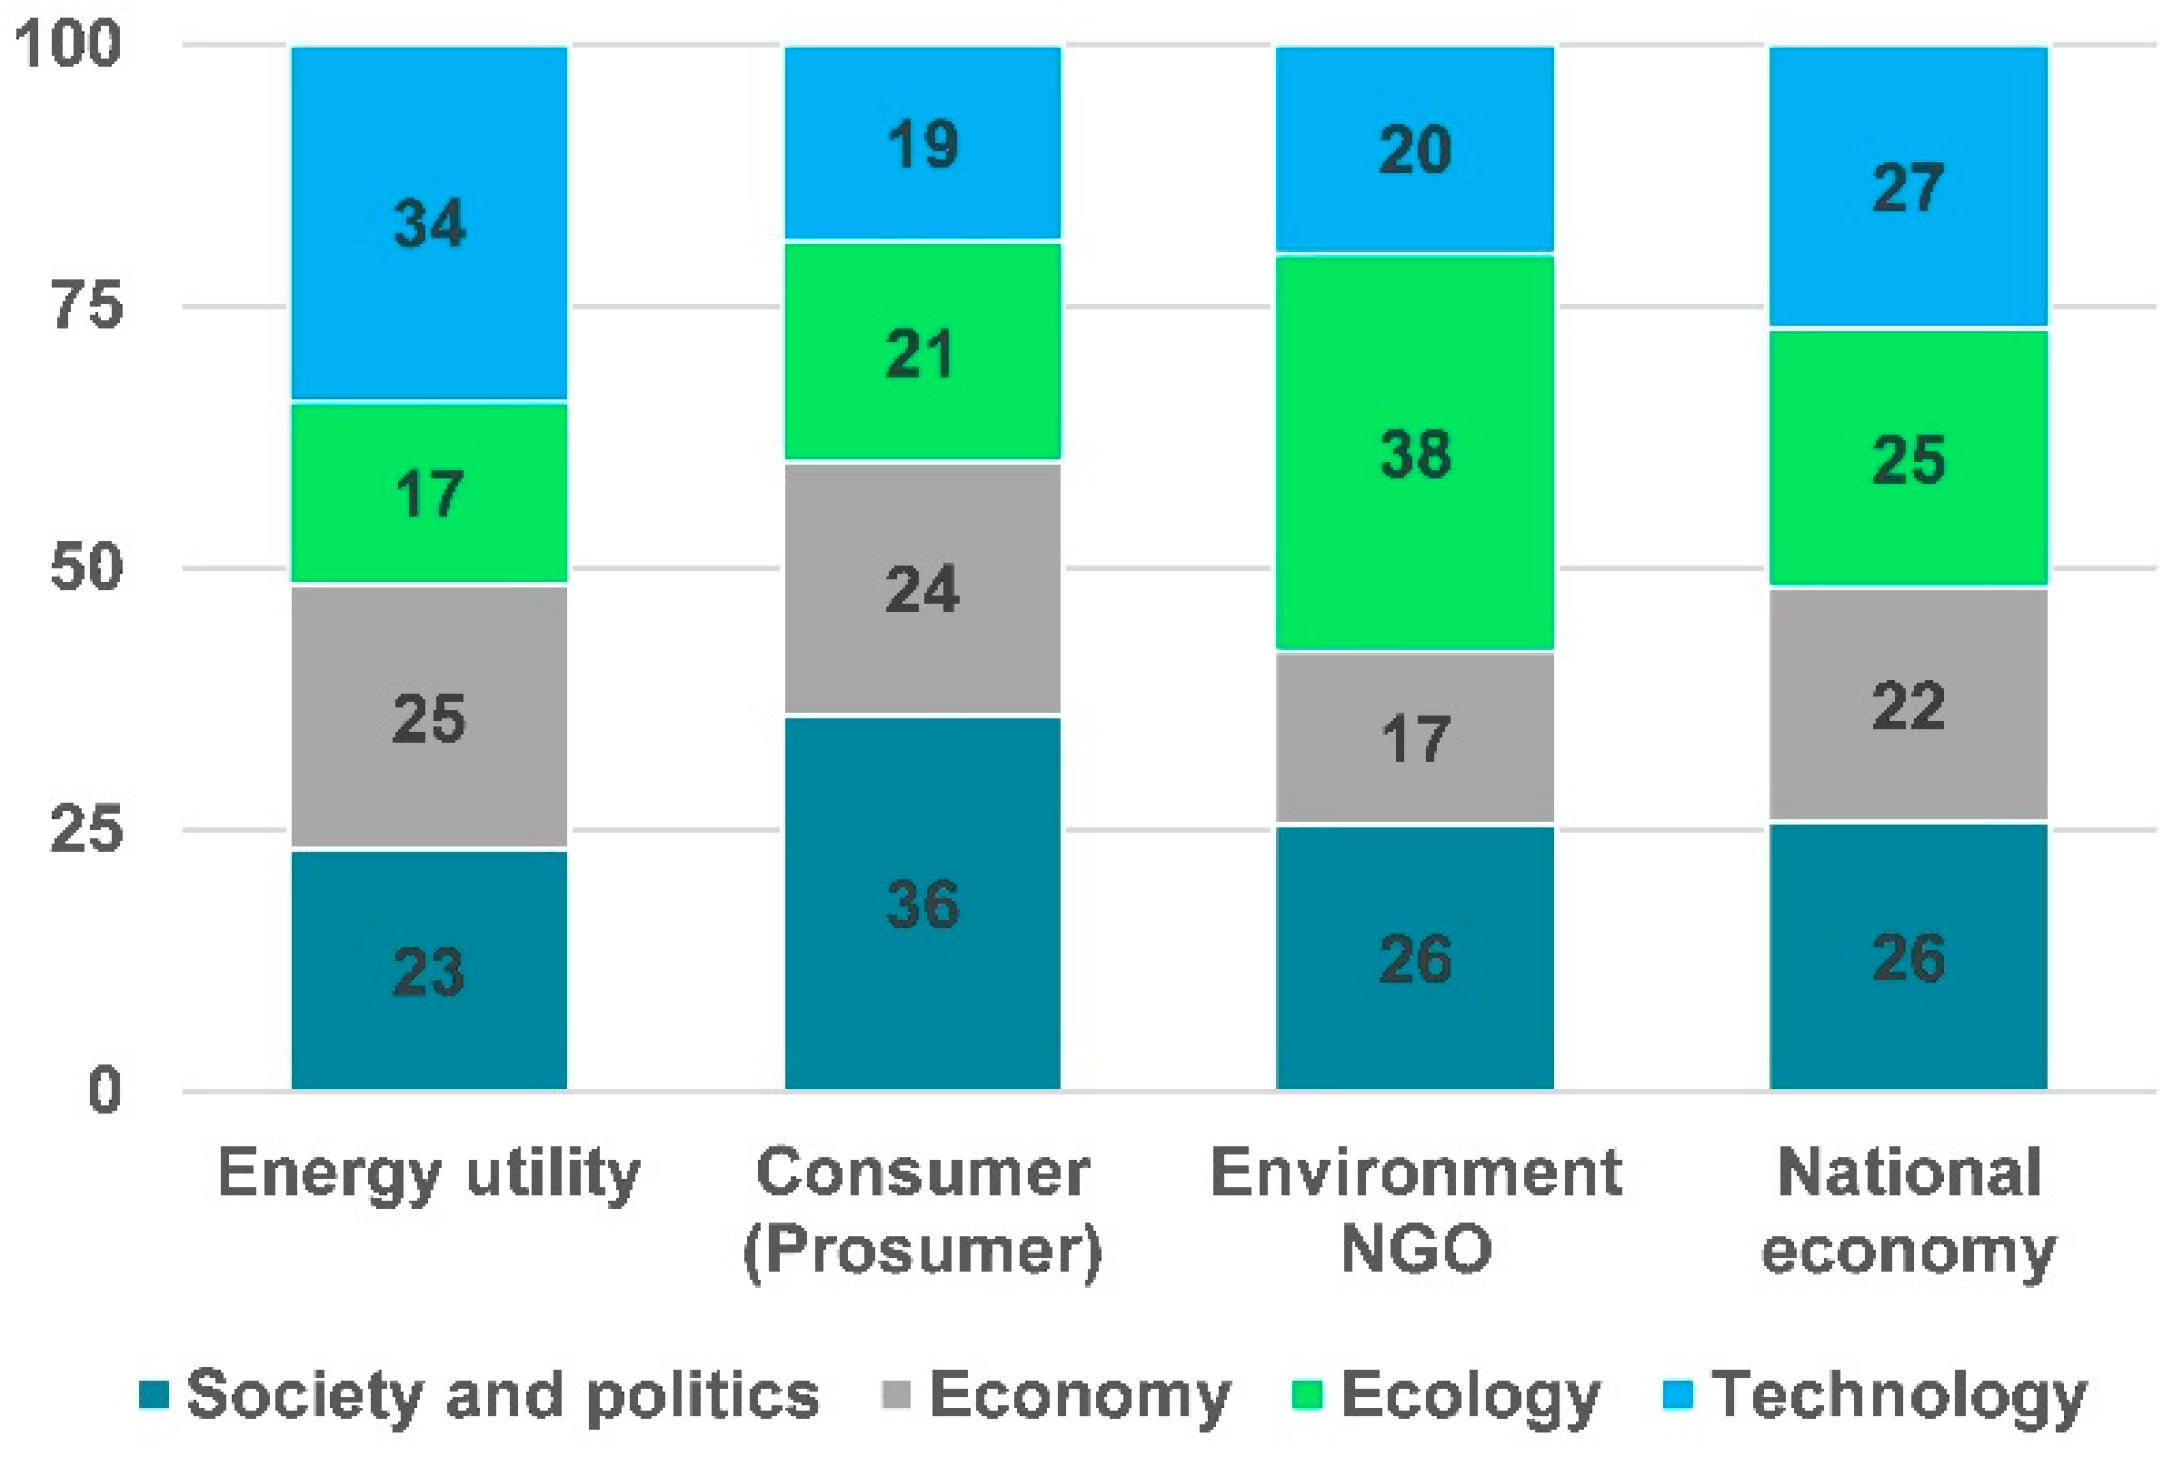
Section 2.3, different weighting profiles are derived from the weighting expert interviews (see
Figure 3). These weighting profiles influence the overall MCA results, as they represent the perspectives of different stakeholders. The different results are depicted in
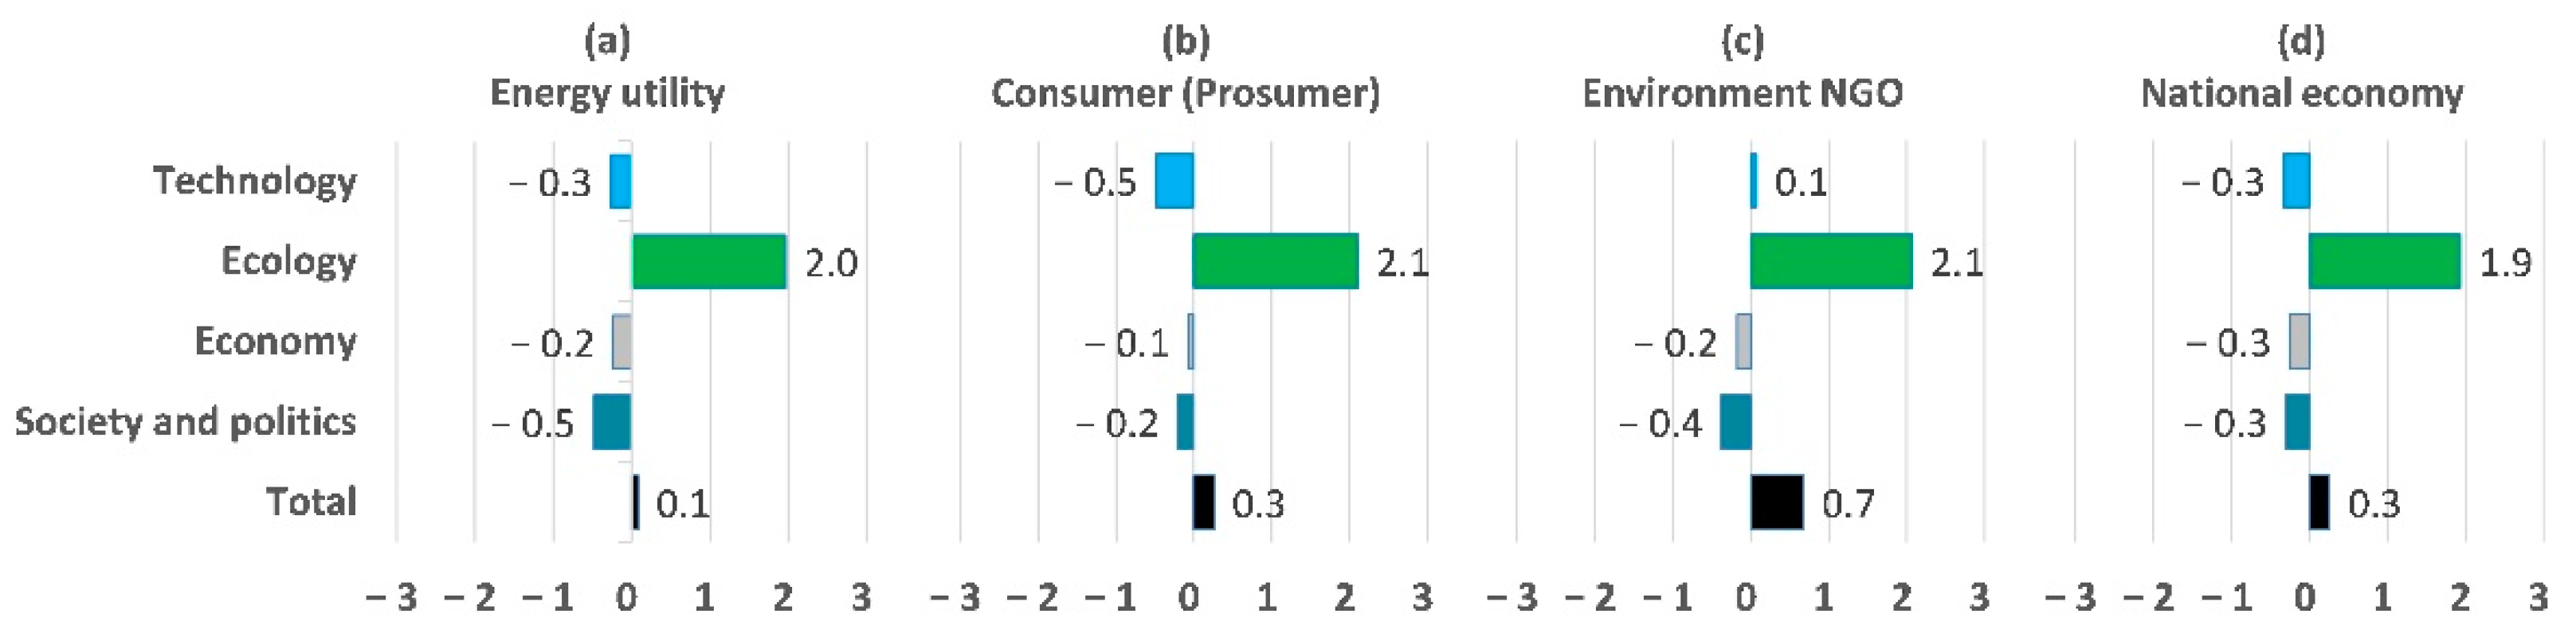
Figure 8.
Figure 8d, “National economy”, shows the same weighting profile used for the results in
Figure 7. The energy utility perspective (a) is notably similar to the national economy perspective. The main difference is in the evaluation of the category society and politics. Here, the energy utilities give more weight to the regulatory implementation effort, which causes a more negative overall result. The consumer perspective (b) reveals a more negative result in the technology category. This is mainly due to the higher weighting of the IT and data security criteria. The environmental NGO perspective (c) is the only one with a positive result in the technology category, due to the much lower weighting of the technological effort criteria (e.g., implementation effort, operation, and maintenance effort); this gives more relative weight to the positively evaluated generation and grid controllability. The positive technology evaluation and more weight on the ecological category cause the more positive evaluation of this weighting profile.
Overall, the total result is slightly positive for all weighting profiles. The environmental impact category is evaluated positively for all weighting profiles, while the economy and society and politics categories are evaluated negatively for all weighting profiles. The technology category is only positive when evaluated with the environmental NGO weighting profile.
The different weighting profiles could be seen as a sensitivity analysis regarding the impact of weighting. However, in the proposed framework, the use of different weighting profiles is an integral part, thus these weighting profiles and their effects are seen as part of the results rather than a sensitivity analysis.
3.4. Sensitivity Analysis
First, the sensitivity of the LCA results to two central assumptions (potential contribution to energy savings, decarbonization paths of the German energy mix) is analyzed, and subsequently, the impact of different LCA results on the overall MCA evaluation is assessed.
Although the LCA is based on a detailed technical analysis of the components of a mMe and a GW, several assumptions need to be made when the findings of these devices are put into the context of a nationwide roll-out with effects on the broader energy system. The main assumptions are discussed in
Section 3.1. An overview of all explicit assumptions is presented in
Table A1.
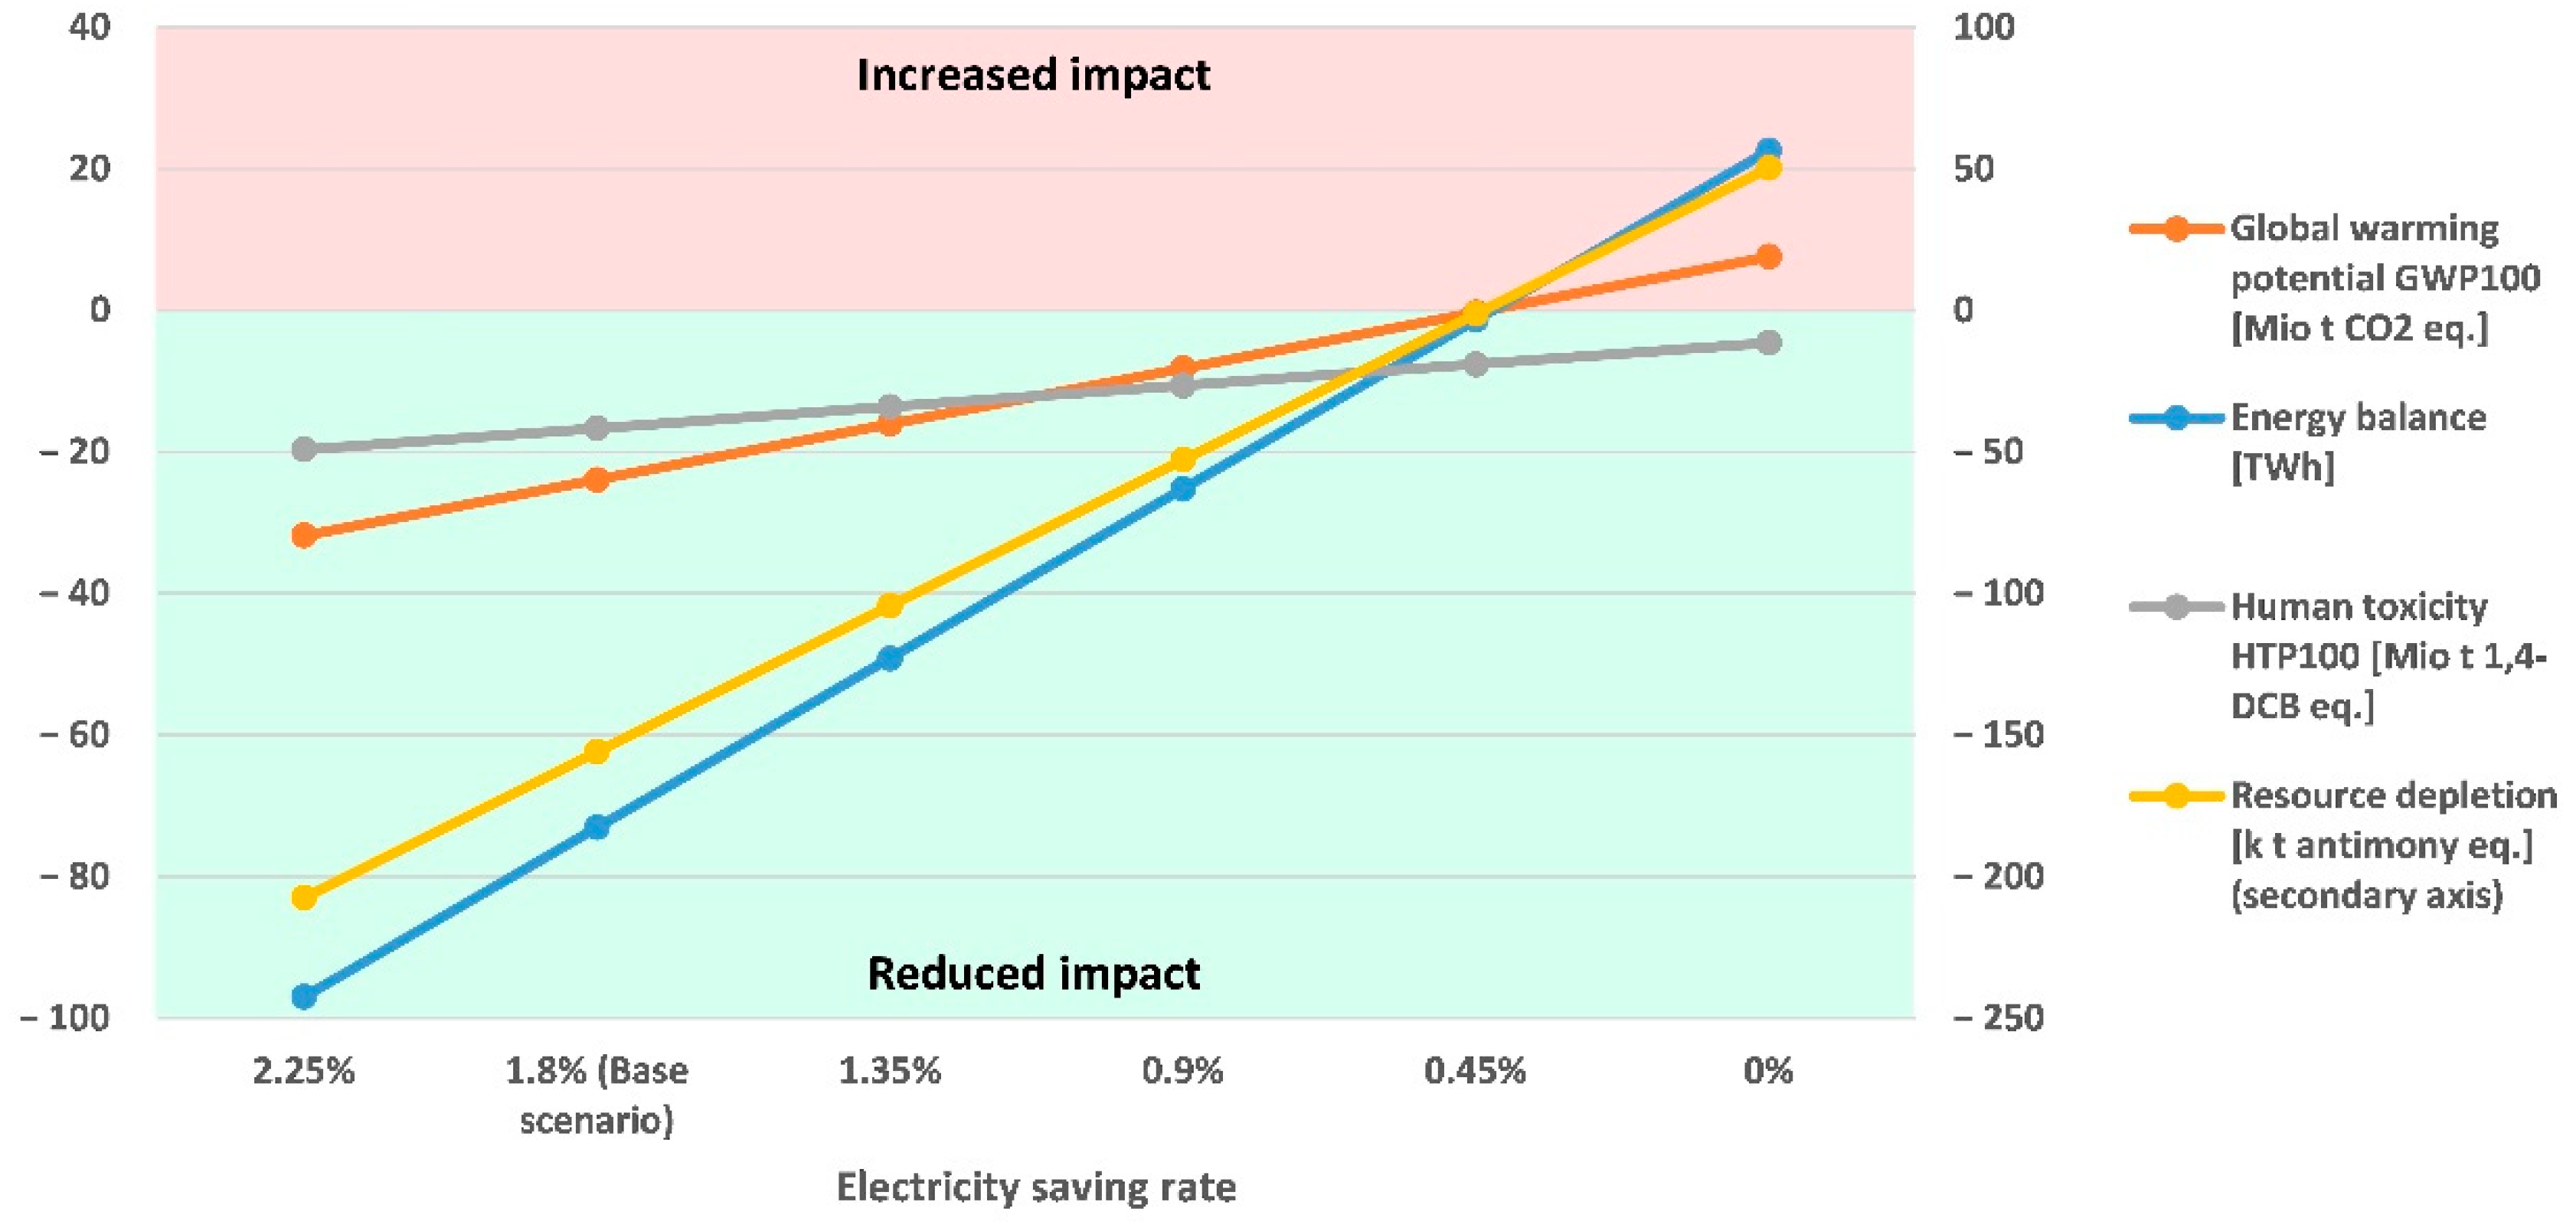
Figure 9 depicts the sensitivity of the LCA result regarding the assumption on the smart meters’ potential to cause energy savings. The reasons why a special focus is put on this assumption are that, on the one hand, it is subject to high uncertainty, and, on the other hand, it has a very strong effect on the LCA outcome. The base scenario assumes a saving of 1.8% of the electricity used by the users of the smart meters. In this scenario, all evaluated LCA impact categories are positively impacted (meaning a reduction of the impact is achieved). Therefore, the sensitivity analysis focuses primarily on identifying the tipping point where LCA results turn out negative (meaning an increase of the impact). Within the analyzed range of energy savings, all four impact factors have a linear correlation with the energy-saving assumption. The GWP100 break-even energy saving rate is found to be 0.43%. If smart meters generate more energy savings, their overall impact on the GWP100 is positive (GWP reduction). The energy balance and the resource depletion break-even point is very close to the GWP100 break-even point, indicating the close connection of the impact factors. Regarding the impact on human toxicity, a decrease is identified across all energy saving scenarios, even for the no electricity savings scenario. This is due to the modeled grid reinforcement reduction, which reduces the use of copper and its effects on human toxicity.
Since the electricity savings determine whether an overall GWP reduction can be achieved, an analysis of the different decarbonization paths of the German energy mix is necessary. If the decarbonization is achieved faster than expected, i.e., GWP intensity is only half of the estimates for 2030 and 2040, a GWP reduction would still be achieved. However, with only 12.02 Mio t CO2 eq. over 20 years compared to 23.9 Mio t CO2 eq. in the base scenario, the reduction is significantly smaller. If the GWP intensity does not decrease but rather stays constant over the next 20 years, the potential emission reduction increases to 33.5 Mio t CO2 eq., respectively.
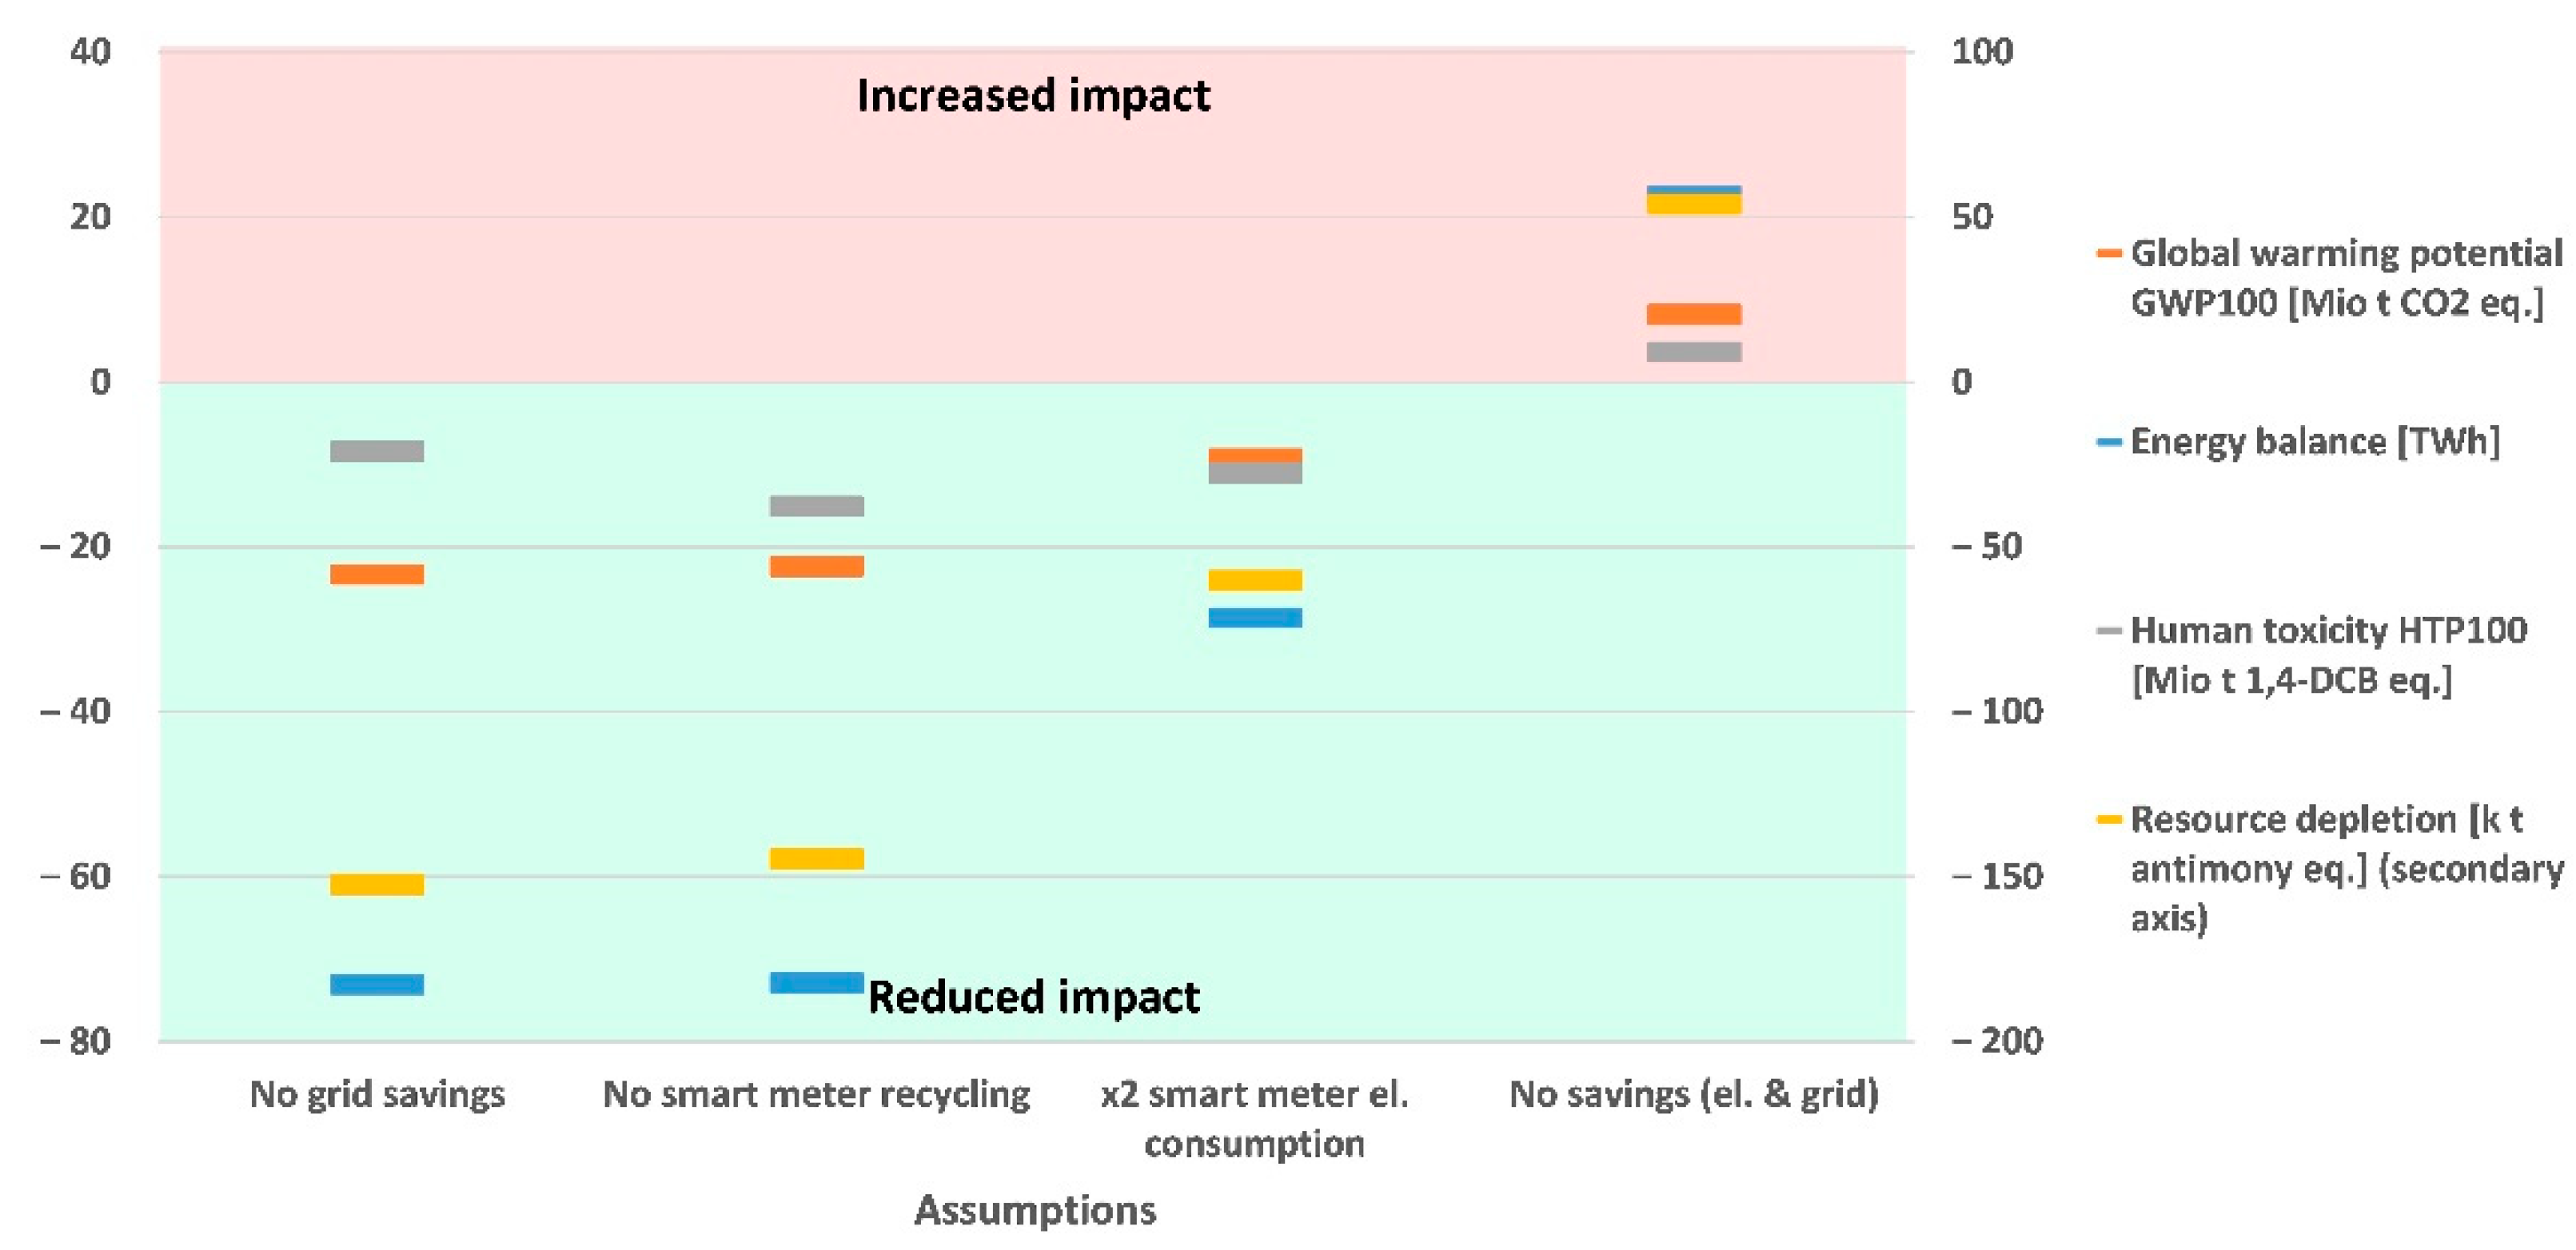
Comparing the influence of the energy saving on the LCA outcome in
Figure 9 to the further impact factors in
Figure 10, it can be seen that the very dominant effect on the impact categories is created by the energy savings. The “no grid reinforcement savings” scenario slightly reduces the savings in resource depletion due to the use of copper wire for grid reinforcements. This, in turn, also reduces the positive impact on human toxicity. However, the GWP saving remains almost unchanged. The “no recycling of smart meters” scenario tests the impact if smart meters cannot be recycled. Overall, the impact of this scenario is rather low, mainly due to the low production impact and long lifetime of the devices. If the smart meters have an own electricity consumption twice as high as assumed, a stronger effect on the energy balance, the resource depletion, and the GWP can be noted. An even higher own electricity demand is very unlikely, according to the manufacturers and utility experts. Yet, this effect does not come close to eliminating the overall savings. In the case of no positive system effect, i.e., no electricity savings and no grid reinforcement savings, all LCA impact categories increase and consequently, no positive impact is generated by the smart meters. The negative impact seen in this scenario is the production and operation impact of smart meters as electronic devices with a higher own electricity consumption and a shorter lifetime, compared to the analog conventional meters.
In a second step, the effect of the LCA result on the overall MCA evaluation is assessed. As described in Section 0, the LCA results are translated against an internal value, the results of the “2.25% electricity savings” scenario. While for the base scenario, this translates into MCA evaluations of +2.3 for the energy balance, the GWP100, and the resource depletion and a +2.5 for human toxicity, for the worst-case “no savings” scenario (no electricity savings and no reduction of grid reinforcements) this translates into an MCA evaluation of −0.7 for energy balance, −0.8 for GWP100 and resource depletion and −0.6 for human toxicity. Based on this translation, the difference between the base scenario and the “no savings” scenario affects the MCA result regarding the ecology category, which changes from an overall score of positive 1.9 to a neutral 0 for the national economy perspective. This, in turn, changes the overall MCA outcome from a positive 0.26 to a negative −0.23.
4. Discussion
Following the structure of the former section, the discussion is structured in three parts: LCA, MCA, and sensitivity analysis.
4.1. LCA
Smart meters are relatively similar to other ICT hardware with regards to the type of components and materials used and the manufacturing process; therefore, the total production GWP impact and the main contributors are similar. A smartphone has a production GWP of approximately 48 kg CO
2 eq. [
76]. Considering that a smartphone is significantly smaller and lighter but has a more potent CPU and a bigger display, the obtained smart meter GWP result of 82 kg CO
2 eq. is plausible. Besides that, similar to the smartphone, the main source of GWP impact is identified as the ICT components, such as integrated circuits. In contrast to a smartphone, the electricity meters have a long lifetime; therefore, the share of the GWP impact of the production, compared to the use phase, is found to be rather small. With an expected lifetime of 18 years, the GWP100 of the smart meter use phase is by a factor of seven greater than the GWP100 of the production of the device. This finding is roughly confirmed by the high-level life cycle analysis data supplied to the research project by a second smart meter manufacturer. Thus, own electricity consumption is the factor with the biggest impact on the GHG emissions caused by the electricity meters and, therefore, offers the most significant leverage for improvements.
Comparing the life-cycle impact of using smart meters over 20 years to using conventional meters reveals an increase in the GWP100 of 8.2 Mio t CO
2 eq. This shows that if the smart meters do not generate benefits, they merely increase the GWP100 of the metering system. However, the additional 8.2 Mio t CO
2 eq. emissions over 20 years are small compared to the yearly ~111 Mio t CO
2 eq. emissions (calculated for 2020 based on assumptions in
Table A1, 104 Mio t CO
2 eq. based on [
71]) of the electricity consumed by the smart meter users (households and small businesses). Therefore, it is apparent that already, a very small impact on the energy demand can neutralize the additional GWP100 emissions of the smart meters.
The consequential LCA looks beyond the direct life-cycle impact of the device and takes system impacts into consideration. In this case, the two system impacts energy savings and grid reinforcement reductions are assessed. When including both of them, the overall effect of using smart meters instead of conventional meters is positive, meaning a GWP reduction of 23.9 Mio t CO2 over 20 years. Here, the overwhelming effect is the reduction of the energy demand. However, comparing the GHG reduction achieved over 20 years to the yearly CO2 eq. emissions of the smart meter users (111 Mio t CO2 eq., see above) reveals that the smart meter, including the modeled system effects, does not drastically change the CO2 eq. intensity of the energy mix. In order to play an important role in the energy transition, the smart meters need to enable further system effects, such as enabling the integration of more renewable energies.
Besides the GWP, three additional impacts are assessed. Under the base scenario assumptions, all parameters show a significantly positive impact of the smart meter roll-out. The reduction of 73.1 TWh of the electricity demand is driven by the modeled energy savings of 1.8%. The reduced human toxicity is due to the modeled energy savings (~2/3) and the modeled grid reinforcement reduction (~1/3). The reduced resource depletion is mainly driven by the reduced energy demand and the subsequently reduced depletion of fossil fuels. The different hardware of smart and conventional meters does not have a significant impact on the overall resource depletion.
Although the results of the LCA of smart meters vs. conventional meters in California [
43] partly include different effects and therefore indicate different GWP levels, qualitatively, they are in line with the results of this study, e.g., proportions of GWP contribution of production, use-phase, and end-of-life, offset of higher GWP of smart meters production and use-phase via energy savings.
4.2. MCA
The MCA discussion is structured along the four criteria categories. The results are based on the expert interviews as well as the LCA results.
The category technology is evaluated negatively, thus it is necessary to identify which aspects cause this negative evaluation and identify potential solutions. The results show that the experts mainly see a high technical implementation effort and a negative effect on the vulnerability of the critical infrastructure. These points indicate areas where a special focus needs to be applied when defining the smart meter roll-out. Furthermore, some steps are seen as still necessary to reach marketability of the smart meters. This includes the technical ability to allow remote control, the interoperability between devices of different manufacturers and a process to recalibrate existing meters. On the other hand, also positive impacts can be identified. The main positively evaluated technological criteria are the controllability of the electricity generation and the grid. However, experts consistently noted that one requirement for these positive impacts to materialize is an extended possibility for distributed generation assets and consumers to be remotely controlled. This involves establishing the regulative basis (currently not given for consumers and smaller generators) and the certification of communication gateways with the required technical ability. On the one hand, the remote controllability is the basis for several other intended positive impacts of the smart meter, such as the integration of renewable energies, energy savings, improved profitability for users due to flexible tariffs and, in a broader sense, increased participation of users in the energy sector. On the other hand, however, the requirement to equip also smaller generation assets with smart meter gateways could reduce their profitability and cause fewer small-scale renewable assets to be connected to the grid. These effects on grid and generation controllability are the main technological reason for the smart meter implementation and as such, their influence on the evaluation of the technology category might be underrepresented. Experts consistently were surprised by the negative (or only very slightly positive) outcome of the technology category based on their own weighting and evaluation. A higher number of effort criteria, which are generally evaluated negatively, potentially causes this apparent weighting imbalance. Thus, a better balance between effort and impact criteria might be needed. Many experts see the smart meter as an enabler for future developments, such as smart home applications. Therefore, the innovation potential is evaluated positively. Nevertheless, the experts expressed the concern that the first-generation smart meters already need to be upgradeable/updateable to fulfill the full range of future applications and thus do not need to be replaced before the end of their lifetime.
Due to the positive LCA results and the positive effect on the integration of renewable energies, the overall ecological result is positive. The improved integration of renewables likely correlates with the technical criteria of generation and grid controllability and is one of the main reasons for the implementation of smart meters. The expert interview results for LCA criteria, although not part of the evaluation, can be used to crosscheck the LCA results. The experts evaluate the LCA criteria as less positive, compared to the outcome of the LCA. The biggest difference occurs for the sub-criterion resource depletion. Here, it is possible that the experts considered a practical roll-out, which involves replacing still-functional conventional meters with new smart meters, which influences resource depletion negatively. In the LCA, this practical roll-out effect is not considered.
The monetary profitability for the supplier is slightly positive. Considering that the prices for smart meters are regulated and set as low as possible while still allowing the supplier to benefit, this evaluation is plausible. The profitability for users, on the other hand, is evaluated slightly negatively. The experts do not expect that the users’ reduction in the electricity bill (or increase in revenues from a small generation asset) will outweigh the monthly cost of the smart meter. However, many experts note that the profitability as well as the users’ non-monetary benefits could be improved/increased if further applications are built on the basis of the smart meter, such as smart home systems. A key requirement for this is the right to use the user data, potentially by third parties, to offer these products and services. For consumers with a small consumption who only have the mMe without the communication gateway, it is required to establish a connection to the mMe via, for example, the user’s own router. Here, the regulatory framework needs to be established. However, as these measures could affect the users’ privacy and the integrity of the user data, caution is required, and a compromise needs to be made. The negative profitability for the user in combination with concerns about data security and privacy could be the reasons for the experts’ opinion that the smart meters will rather be rejected than accepted. Here, specific research into the reasons why users may reject the smart meter are recommended in order to develop measures to increase the acceptance.
Besides the results of the national economy perspective discussed in depth above, three additional stakeholder perspectives are defined as weighting profiles. In this case, all weighting profiles yield the same overall result tendency. However, the environmental NGO perspective reveals two differences. The overall result is more positive compared to the other weighting profiles and the technological category is positive instead of negative. This indicates that the biggest advantages are in areas important for these stakeholders, such as grid and generation controllability, integration of renewables, and life cycle performance. The most negative result in the technology category occurs in the consumer perspective (b) due to a higher weighting of the IT and data security criteria. This indicates that this is a point of concern for users and, as such, needs to be addressed by energy utilities as well as the regulator.
4.3. Sensitivity Analysis
In the sensitivity analysis, the energy saving parameter is identified as the most influential on the LCA result. The GWP100 break-even energy saving of 0.43%, above which an overall GWP reduction is achieved by the application of smart meters, is roughly confirmed by [
43], where it is found to be 0.25%. Within the scope and range of the sensitivity analysis, no other factor changes the tendency of the result. In a second step, the influence of the LCA sensitivity on the MCA outcome is analyzed. In the case of the “no savings” scenario, both the ecology category and the overall result turn out negative. This result underlines the importance of ensuring that these benefits are, in fact, achieved during the roll-out.
5. Conclusions and Outlook
A framework consisting of an MCA combined with an LCA and expert interviews for the holistic evaluation of digital applications in the energy sector is proposed and tested on the use case of the smart meter roll-out. The framework provides a result, which is reduced in complexity to enable broader discussions, reflects the perspectives of different stakeholders and provides detailed insights on critical aspects of the application.
Criteria for the MCA are developed based on the review of literature and refined in expert interviews. Weighting profiles for perspectives of different stakeholders are developed, also based on expert interviews. The LCA is performed using detailed information on the technical setup of smart and conventional meters and a set of assumptions. The outcome of the LCA is the assessment of several criteria in the ecology category. LCA results are subsequently integrated into the MCA evaluation. All MCA criteria are evaluated in expert interviews. Results are aggregated using the SAW method.
The evaluation of the smart meter roll-out is the first test of the proposed evaluation framework.
The LCA reveals that the smart meter as an electronic device has a higher environmental impact compared to conventional meters, mainly due to the high consumption of electricity, which is the biggest impact factor on the smart meter’s life cycle greenhouse gas emissions. However, if the smart meter roll-out results in an electricity saving of >0.43%, the overall environmental impact, mainly the GWP, would be reduced. The electricity saving potential has the most significant influence on the overall LCA result.
The overall MCA result, including evaluation of criteria in expert interviews and the LCA results, reveals a slightly positive overall score for most stakeholder perspectives. While the core reasons for the smart meter roll-out, generation and grid controllability, and further integration of renewable energies are all evaluated very positively, negative evaluations in the area of IT and data security, implementation and operational effort, social acceptance, and profitability overall offset the result into the negative range. These negative aspects need to be addressed and solved in order to take full advantage of the positive impacts of the smart meter. Critical aspects of the smart meter roll-out are identified, and key insights on required actions are gathered during the expert interviews.
Overall, the first test of the framework results in a largely consistent evaluation of the smart-meter roll-out, in line with the relevant discussed existing studies on smart meters for most aspects. Therefore, the overall goal of the proposed framework is met, and it is concluded that the framework is suitable for evaluating this digital application in the energy sector. Yet another test with a different application is recommended to prove the versatile applicability of the framework for digital applications.
Although the first test is considered successful, several areas for further improvements of the framework are identified. Most notably, some modifications need to be made on the criteria. It would be beneficial to reduce the number of overall criteria to improve the practical usability of the framework, although, due to the complexity and diversity of digital applications, no drastic reduction is possible. In the technology category, it seems to be necessary to rebalance the number of effort and impact criteria to obtain results that are more realistic. This could be done by summarizing several effort criteria into one. Furthermore, although the intention while defining the criteria was to avoid overlaps and, therefore, double counting as far as possible, some cases of double counting were identified and need to be resolved. The most prominent example is the technical impact on energy consumption and the ecological criteria energy balance. Lastly, the hierarchy level of some criteria and sub-criteria needs to be reconsidered, e.g., human toxicity and global warming potential should be on the same hierarchy level.
The point allocation weighting method based on the distribution of 100 points was easily understood. However, in practical use, many experts faced the difficulty of leveling the weights between (sub)criteria of different categories. To reduce this problem, some pairs of criteria were randomly picked for direct comparison. Sometimes the two criteria could meaningfully be compared; sometimes, the direct comparison did not seem suitable. It is possible to define a standard set of suitable (sub)criteria pairs for direct comparison, ensuring that general leveling of weightings is achieved.
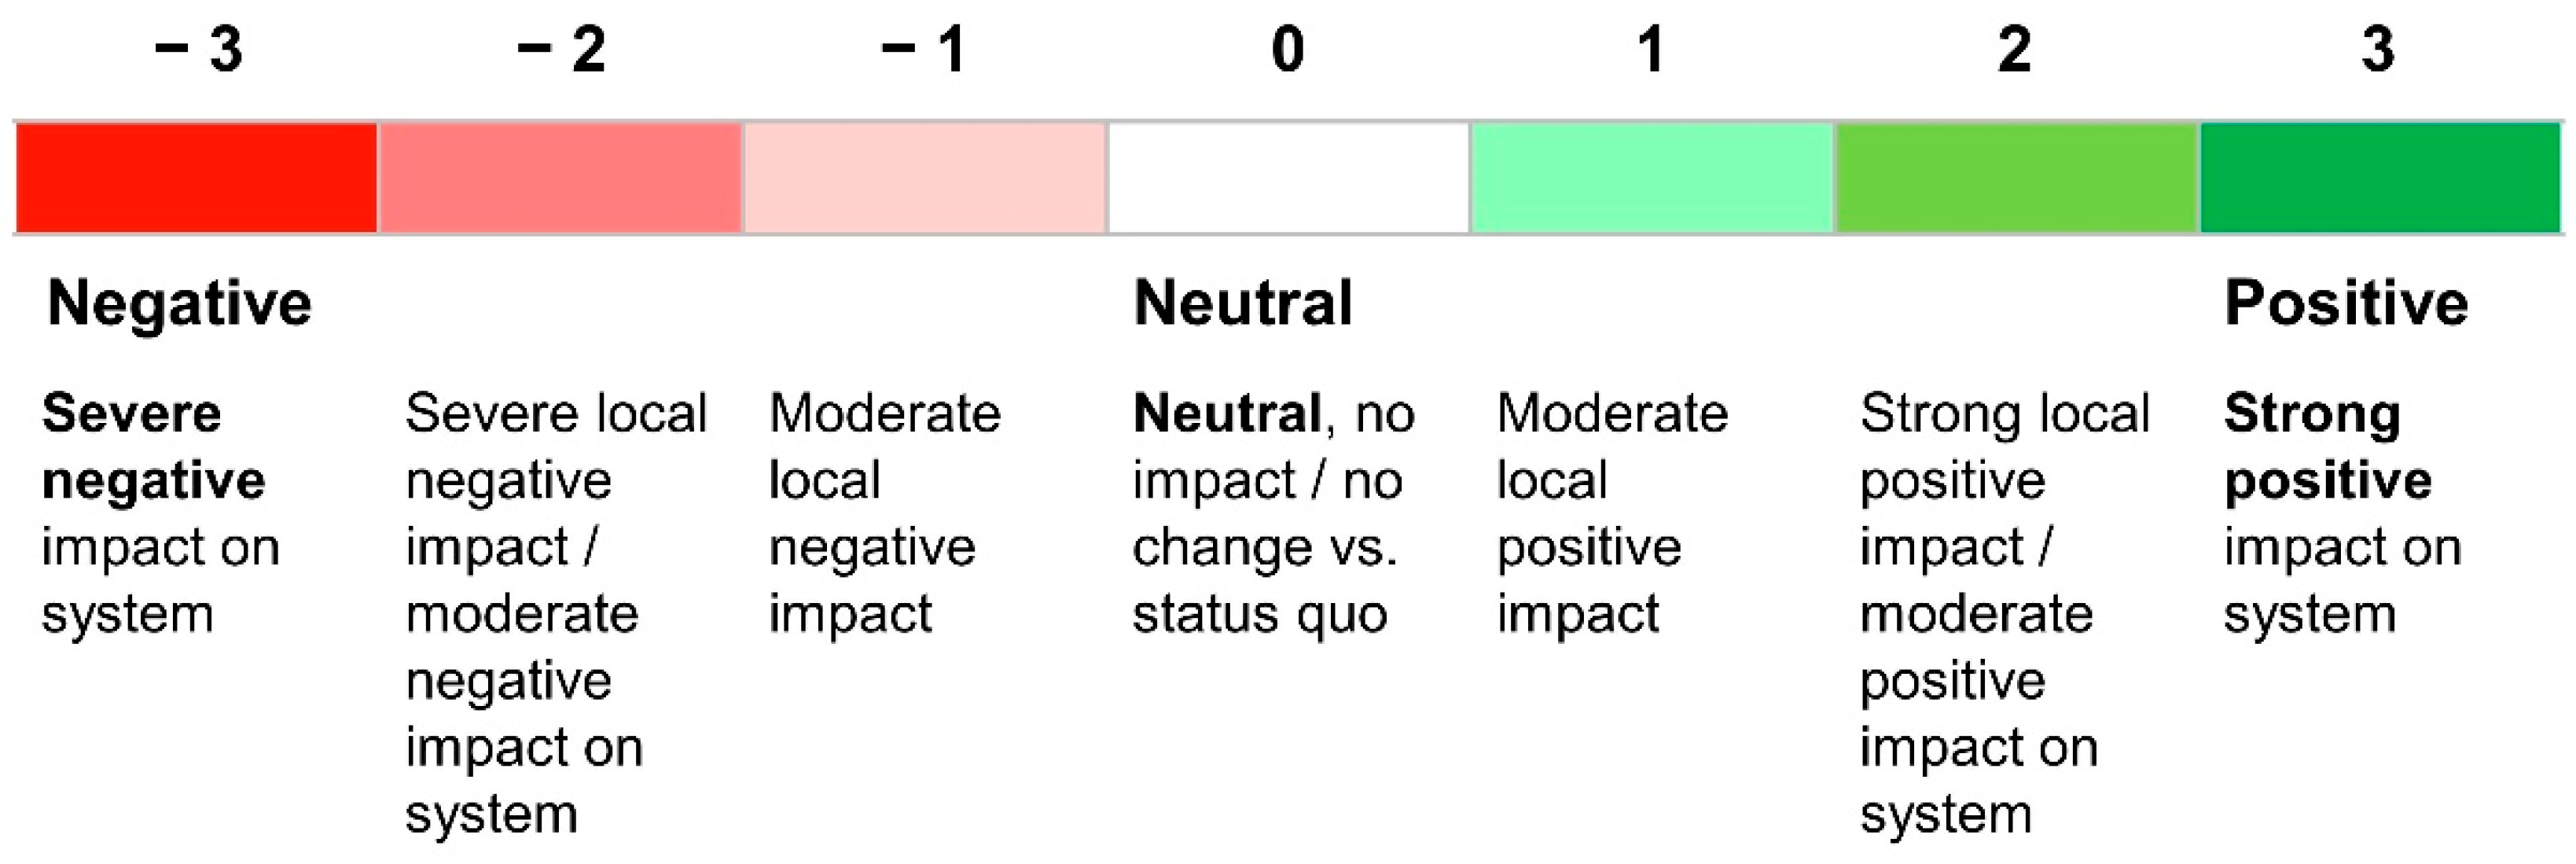
The evaluation range set from −3 to +3 was easily understood and, for the most part, intuitively used. No need for adaption was seen here.
Currently, the results are presented on the criteria level and summarized to the category level, following the hierarchical structure of the criteria. However, it could be of significant interest to derive a medium layer of result aggregation, which does not follow the hierarchical structure but is based on cross-functional result categories. These result categories could summarize different efforts, such as implementation and operational effort as well as different impacts, such as effects on the system stability, the environment, or the IT security. Based on these result categories, a weighting sensitivity analysis could be performed (e.g., sensitivity if system stability is weighted more).
Currently, neither the uncertainty of the input nor the number of evaluation points (how many experts evaluated a specific criterion) is considered. Therefore, the robustness of the results can only be ensured through the sensitivity analysis. An indication of the robustness could make transparent where a sensitivity analysis is required and increase confidence in the result.
Furthermore, a check of the usage of materials versus a list of critical materials, such as [
77], issued by the European commission could be performed. This is already partly covered in the LCA impact category depletion of resources. However, only a more in-depth knowledge of the exact material can lead to mitigation actions, such as finding substitutes.
Lastly, the weighting profiles should become adaptive not only to the stakeholder’s perspective but also to the type of application under evaluation such that non-relevant criteria do not need to be evaluated.


