Article

Measures for Ensuring Sustainability during the Current Spreading of Coronaviruses in the Czech Republic

Department of Security and Law, AMBIS College, Lindnerova 1, 180 00 Prague, Czech Republic
*
Author to whom correspondence should be addressed.
Sustainability 2021, 13(12), 6764; https://doi.org/10.3390/su13126764
Submission received: 30 March 2021 / Revised: 8 June 2021 / Accepted: 8 June 2021 / Published: 15 June 2021
(This article belongs to the Special Issue Security Challenges in the Context of Sustainability)

Abstract

:
This manuscript focuses on the SARS-CoV-2 outbreak in the Czech Republic and its impact on economic and social sustainability in this country. The topic of this manuscript is the topical issue of how to manage the outbreak of this infectious disease and thereby reduce any disruption to economic and social sustainability. The aim of the authors was to identify serious risks and to propose priority measures that can lead to their significant mitigation. A modified semi-quantitative three-component probability method Pj, consequences Cj and opinion of evaluators OEj were used to assess active risks. The manuscript also presents risk analysis and risk management and the construction of developmental regression models. The manuscript presents a proposal for preventive measures to mitigate risks in the period of the third wave of the occurrence and spread of the coronavirus. Most of the proposed preventive measures were based on brainstorming of the views and experience of the implementation team. Consultation with and materials by experts in the field of developmental biology, parasitology, epidemiology and virology were also used. As such, this survey provides lessons for other cities and regions involved in coping with COVID-19 infection and implementing the policy of a positive and timely return to work.

1. Introduction

Sustainable development is a form of human societal development consisting of and reconciling three basic pillars—economic development, social progress, and fully-fledged preservation of the environment [1].
From an economic point of view, the main goal is to achieve economic growth and create a world without consumption by producing quality products that will enable lasting economic prosperity. In the social sphere, it entails ensuring social progress, supporting community life and creating a welfare state leading to social well-being. The environmental component aims to achieve environmental equilibrium and preserve the quality and stability of the environment for future generations in a minimally altered form in relation to the present [2,3].
Originally, sustainability was associated almost exclusively with the environmental element. Later, in contrast, the economic factor came to be preferred, while the environmental and social components were rather neglected [4]. Balanced and appropriate planning and policymaking relating to each of the individual economic, social and environmental pillars on which sustainable development is built has only been conducted in the final decade of the last century [1,5].
In the Czech Republic, the concept of sustainability is currently understood in accordance with the vision of Agenda 2030 [6] and, to some extent, the European Commission (2019) [7] and is defined in the Strategic Framework of the Czech Republic 2030 [8] which also updates the state policy in the given area formulated in an earlier period [4]. The strategic framework summarizes the development of sustainable development so far, identifies the risks it faces and the opportunities ahead, and defines crisis management options, goals for the coming period and indicators to monitor their fulfilment in each of the following six crucial areas [8]:
  • The economic model;
  • People and society;
  • Resilient ecosystems;
  • Municipalities and regions;
  • Global development;
  • Good governance.
However, today’s world is facing a completely new and extremely serious phenomenon in the form of a pandemic of coronaviruses that is negatively affecting the current process of planning, policy and ensuring sustainability. These include not only severe acute respiratory syndrome-related coronaviruses (SARS-CoV and SARS-CoV-2) and Middle East respiratory syndrome-related coronavirus (MERS CoV) lineages, but also notably common cold coronaviruses such as 229E, NL63, OC43 and HKU1 and a number of their other mutations (hereinafter merely coronavirus(es)). The infection rate has significantly complicated the situation in the area of population security and has meaningfully disrupted the process of sustainable development, especially in the economic and social spheres [9,10,11]. Proof of this statement is the finding that the coronavirus pandemic has negatively affected the fulfilment of 17 ambitious sustainable development goals set by the United Nations (2015) [6] and 144 sub-goals (almost 90%). However, many sub-goals (about 66) could potentially benefit from the changes spurred by the crisis, given that the appropriate decisions are made, and will continue to be made, on the basis of thorough risk analysis [12].

Literature Review

Coronaviruses belong to a family of viruses that are transmitted through the respiratory tract by droplets from the air or by contact between the hands and contaminated objects and subsequent contact with the mouth or rubbing of the eyes. Coronavirus mutations result in a number of daily mortalities in the population and are also the cause of serious problems in healthcare, at the micro- and subsequently macro-economic level, in tourism and in other spheres of social life [13].
The initial outbreak of the coronavirus was recorded in late 2019 in Wuhan, with a population of around 1.1 × 10⁷, the capital of China’s Hubei Province. The virus there caused serious pneumonia of unclear origin, often with acute respiratory distress syndrome (ARDS). The causative agent was identified as the novel β-coronavirus SARS-CoV-2 and the disease was named COVID-19. As of the beginning of 2020, the infection has spread worldwide, including the EU and the Czech Republic, due to the globalization and planetarization of society [14].
Due to the spontaneous mutation of human coronaviruses, such as some species of the SARS-CoV-2 lineage with a frequency of mutation of up to twice a month, thousands of mutations have arisen during their spread in the last year. However, many of these do not necessarily pose a threat to human health. Mutations with better transmission capacities have become dominant in terms of the consequences and threats to the fulfilment of sustainable development goals. These include, first and foremost, the mutation reported as 20A.EU1 (Spanish variant), the variant bearing the designation 501Y.V2, sometimes also B1351 or E484K (the South African variant), the coronavirus termed B.1.1.7, alternatively according to the WHO VOC 202012/01 (British variant), and many other types of coronaviruses [15].
For example, the B.1.1.7 variant spreads up to 70% faster than conventional types of SARS-CoV-2 lineage and is likely to have a significantly higher mortality rate (by 30% or more) because it is able to outwit the immune system. At the beginning of 2021, it was already widespread in 33 countries around the world [15]. However, even this type of aggressive virus should not cause vaccination problems [16].
The high infectiousness of the B.1.1.7 mutation is evidenced by the development of the pandemic in Ireland, which was previously one of the least affected countries. Nevertheless, it became the country with the highest coronavirus disease incidence per 105 inhabitants in the world in the first decade of January 2021. At the same time, more than half of new cases of infection were caused by a new virus line [15].
Estimates of the main epidemiological parameters based on publicly available epidemiological data [17,18,19] are made by the professional community. First and foremost, this involves an estimate of the number of cases of mortality (daily mortality) and the rate of recovery (recovery rate) of the total number of infected people, along with a 90% confidence interval and evaluation of future development [17,20]. The persisting negative course of the spread of the viral disease and its variations in mutations that are variable in time and space are still important for predicting development by means of mathematical models. The growth trajectory and epidemiological properties of the new coronavirus have not yet been fully elucidated [21].
Data analysis, modeling and development prediction based on the Susceptible Infectious Recovered Dead (SIRD) model have been presented by, for example, Anastassopoulou, et al. (2020) [20]. By applying the SIRD model, they provide estimates of the baseline basic reproduction number reproductive rate, daily mortality and recovery rates. The main disadvantage in implementing predictive modeling using the data in the given method is that the parameter estimates may be unrealistic. This may be due to weekends and public holidays, when fewer tests are applied or some infected people are not identified (detected).
In contrast, the authors of the article [22] analyze the dynamics of coronavirus disease outbreaks in these countries over the course of time. They have used an analysis of simple maps of daily delays with the intention of pointing out a certain universality of the epidemic spread. By analyzing the data in the susceptible infectious recovered dead simple model, they suggest that the kinetic parameter, which describes the rate of recovery, can be seen as identical, regardless of the country, while the extent of infection and death appears to be a more variable value. Nevertheless, the disadvantage of this analysis is that it has been assumed that the specified basic reproduction number will follow a heuristic model which does not necessarily describe the actual transmission [22].
Another scientific report suggests data-based approaches to modeling and prediction that can be used in the public administration with the power to control an outbreak without pharmaceutical interventions [23]. The research study states that the growth of the reproduction number Rt is also influenced by factors such as the immunity of the population and the specific protection measures taken by the public administration of the given country. The authors submit the Transmission Index (TI), which describes the transmission of the disease in relation to the normal state. The TI values can be used to calculate the effectiveness of the measures implemented in the field of public health. The TI function can also be used to predict different public policy scenarios in the case that the current measures are relaxed or, conversely, tightened even further. Of course, this method also relies on the quality of the initial data [23].
In order to predict the evolution of the COVID-19 pandemic, we need to understand a number of aspects that are the subject of a number of surveys. We need to know how fast a viral infection spreads, how long it takes, when it reaches its peak, and whether it disappears or how fast it disappears. All mathematical models involve simplification and it is practically impossible to decide which factors to include in models and which to omit [24].
Various measures for a specific state, gender or age category are also proposed by the professional community for the implementation of the policy of a positive and timely return to work and the normal life of society. For example, the cross-sectional study by Ahmed et al. (2020) addresses the increased use of herbal products (homeopathy) or a combination of herbal products and medicinal products (paracetamol, antihistamines, antibiotics and minerals) in Bangladesh [25].
Another expert paper [26] assesses preventive measures and knowledge of pregnant women in Guraghe Zone hospitals. The outcome of the study is that pregnant women aged ≥35 years must be provided with more effective consultation by a healthcare provider regarding COVID-19 prevention procedures [26].
The authors of another study [27] discussed the effectiveness of the measures taken, especially strict measures, in cancer patients who were receiving chemotherapy at the time. As a result, SARS-CoV-2 antibodies were detected in 1 of 4 cancer patients and confirmed COVID-19 infection due to rapid and long-term tough measures. However, the issue of psychosocial mood (mental health) in these patients, arising from the long-term avoidance of interpersonal contacts [27].
Current preventive measures and knowledge have certain shortcomings and cannot be completely generalized to all states, gender, age category or current immunity of the population [26].
The COVID-19 pandemic may be one of the greatest modern societal challenges requiring extensive collective systematic action and interaction between countries and between a country’s government policy and its population. However, in some countries, such as the Czech Republic, these aspects are applied and adhered to with less flexibility, so they become dark red on the map (i.e., countries with low controllability of the virus and with the occurrence of new mutations). Applying the example of the Czech Republic, the authors present the identification of hazards caused by the coronavirus pandemic in the Czech Republic using the “What-if Analysis” method in combination with the “Checklist Analysis” method [28,29], including semi-quantitative risk assessment and proposals for general measures. The following chapter deals with developmental models, evaluation of their significance level and the conclusions that result from this. The final chapter discusses the factors relating to emotional and physical stressors resulting from the implementation of certain necessary measures (e.g., wearing a mask or respirator all day or losing a job). Last but not least, preventive proposals that may mitigate the risk of coronavirus infection are presented here.

2. Materials and Methods

The identification of hazards associated with coronavirus occurrence and transmission, the assessment of corresponding risks, the stipulation of their priority and the proposal of measures to mitigate critical risks have been performed by a work team of six people. The implementation team consisted of a doctor at a clinic of infectious diseases [30], the heads of the THERAP-TILIA clinic, a specialist in internal medicine and a university professor [31], a risk manager [32], an expert in the field of health risks analysis and control [9], an economist [33] and a layman [34]. The reason for the inclusion of the layman in the group of assessors was to avoid any professional omission.

2.1. Risk Assessment

The “What-if Analysis” method was used in combination with the “Checklist Analysis” method [28] to identify hazards caused by the coronavirus pandemic.
The non-systematic method of “What-if Analysis” [28,29] enabled the formulation of questions and consideration of potential hazards or consequences of coronavirus occurrence and transmission using structured brainstorming, in which the team members were well acquainted with the process.
The “Checklist Analysis” method consisted of the systematic control of the fulfilment of predetermined conditions and measures [28]. The method became the basis for the creation of closed-ended questions (checklists) generated using a list of characteristics related to potential hazards and impacts of the event. Significant hazards and consequences caused by the transmission of the pandemic were identified by evaluating the answers of the team members to the checklists.
The combined “What-if/Checklist” procedure combines the advantages of the unsystematic creative brainstorming function of the “What-if Analysis” method with the systematic functions of the “Checklist Analysis” method [28]. This technique has been applied to increase the validity of the established hazard register and for more accurate consideration of incidents that may appear in connection with the occurrence and transmission of coronavirus.
A modified semi-quantitative three-component method of probability Pj, consequences Cj and evaluator’s opinion OEj [9], referred to as the PNH method in the Czech version [35], was used to evaluate the risks associated with the identified j-th hazard and the impacts caused by it, where:
The Pj item assesses the probability that the considered j-th hazard may occur.
The Cj item assesses the amount and severity of the consequences caused by the activation of the j-th hazard.
The OEj item takes into account the threat severity, the number of people at risk and the action duration for the j-th hazard. It also evaluates the nature of the hazard, the age and technical condition of diagnostic and therapeutic equipment, the standard of its maintenance, the state and number of buildings for treating patients, the quality of the nursing staff, the equipment and quality of hospital care facilities, the possibility of providing first aid, the influence of the working environment and conditions, psychosocial risk factors, etc. The accumulation and dynamism of the Rj risk and other effects causing this risk are also judged.
Components Pj, Cj and OEj were assessed for individual j-th hazards by each member of the work team in a closed interval 〈1; 5〉 of all the natural numbers. A higher assigned value corresponded to higher Pj, Cj and OEj. The risk Rj of the j-th hazard was calculated from the medians Me(Pj), Me(Cj) and Me(OEj) according to Equation (1). Since the data sets, generally denoted by X with size n = 6, contained an even number of elements xi under conditions of ascending order of data xi, it was possible to write Formula (2) to calculate the medians Me(X).
R j     = M e P j × M e C j × M e O E j
M e X = x n 2   + x n 2 + 1 × 2 1

2.2. Description of Epidemiological Data and Mathematical Models

When constructing mathematical models, and with the aim of increasing their validity, the data from Saturdays, Sundays and holidays were not included in the data files since they were, for logical reasons, usually quite different from the data obtained on workdays. Extreme (outlying) values, three times exceeding the standard deviation σ, were excluded from the data samples [36].
Linear or polynomial regression analysis was applied to model the development of the time series of each monitored parameter Y. This is based on the study of the dependence of two quantitative features, namely the dependent variable Y and the independent variable X. Mathematically, this dependence can be expressed using Equation (3):
Y = f ( X )
As Y and X are statistical characters, the dependence passes into a regression function (4), in which y denotes the values of the dependent variable of the given parameter, x denotes the values of the independent variable during observed time τ inside the observed period, and the symbol e denotes a random component. By solving Equation (4) for linear or polynomial dependences of the particular order, the corresponding regression functions and formulas for calculating the corresponding determination coefficients are then obtained [37]. Regression development models of y parameters were created in a Microsoft Excel spreadsheet.
y = f x e
The normality of data sets with n > 50 elements was verified by the Anderson–Darling test (Razali and Wah, 2011). Confidence intervals at the significance level α = 0.05 of the investigated parameters y were calculated using Formula (5), in which y represents the arithmetic mean of parameter y, σ the standard deviation, n the number of data set elements, t1−α/2 (n − 1) the critical value of Student’s t-distribution at the significance level α = 0.05, and ν = n − 1 the number of degrees of freedom [33].
y   y ¯ ± σ × n 1 / 2 × t 1 α / 2 n 1
The nonparametric method of Spearman’s rank-order correlation coefficient was applied to assess the dependence of pairs of regression models. The prerequisite for the application of the method is the same number of elements k of the compared files and non-confusion of the order of the data, which must be on each i-th row from the same time period τ (Weathington et al., 2012). Spearman’s correlation coefficient rSp (y) is calculated using Equation (6).
r S p y = 1 6 q × q 2 1 × i = 1 q D i 2 y
In which D i 2 y represents the square of the difference in order of the i-th correlation pair kN* is the quantity of correlation pairs (rows) and N* is the designation for the set of all the natural numbers. The calculated correlation coefficient is compared with the tabulated critical values of Spearman’s rank correlation coefficient rSp (α, k) for the selected critical region α and the count of correlation pairs k. If |rSp (y)| > rSp (α, k), the dependence of both compared data samples is high at the significance level α. Conversely, if |rSp (y)| < rSp (α, k), there is no correlation between the compared data samples at the significance level α [38].
A test of the statistical significance of the obtained regression models was performed by the Fisher–Snedecor test (F-test) in order to verify its behaviour as a whole. Hypothesis H0, that there is no dependence between the variables yi and xi of the investigated linear or polynomial regression models of the a-th order, together with the alternative hypothesis H1, are expressed by the Relation (7), in which β0 = q represents the value of the absolute term, β1 of the linear term, and β2, β3, … βa, the polynomial term of the second, third to a-th degree. At the same time, the symbols a, jN* ∩ and β0, β1, β3, … βaRe, where N* is the designation of the natural and Re the real domain.
H 0 : β 0 = q , q 0 , β 1 = β 2 = β a = 0 H 1 : β j 0 p r o j = 1 , 2 , 3 , a
The test criterion is the statistic given by Formula (8), in which yi is the i-th value, y ^ i the i-th theoretical value, y ¯ the mean value of the dependent variable, d = a + 1, n the number of elements of the explored sample data and F the quantile of the Fisher–Snedecor distribution.
F = i = 1 n ( y i y ¯ ) 2 × ( n d ) i = 1 n ( y ^ i y ¯ ) 2 × ( d 1 )
The critical domain Wa is defined by Equation (9), where α is the selected significance level and the values d − 1 and nd denote the numbers of degrees of freedom ν1, ν2 of Snedecor’s F-distribution.
W a : F F 1 α / 2 ; ( d 1 ) ; ( n d )
If the F value falls into the critical range FF1−α/2; {ν1 = (d − 1), ν2 = (nd)}, hypothesis H0 is rejected and an alternative hypothesis H1 is accepted, proving the dependence between the variables yi and xi of the explored regression models at the significance level α. Testing of hypotheses according to Relation (9) can also be carried out using the p-value, which is compared with the significance level α to obtain identical conclusions [37].
The local extrema of the time series models were determined using the first derivative of the regression lines or curves equations and characterized by the value of the second derivative [39,40].

3. Results and Discussion

The fulfilment of many sub-goals and, therefore, ambitious goals of sustainable development set by the UN was already behind schedule before the outbreak of the coronavirus crisis. The onset of the crisis aggravated the situation and fundamentally jeopardized the achievement of most of these sub-goals in almost all crucial areas of sustainable society. The level of threat escalated as the crisis progressed and on one hand completely new threat factors emerged as compared to the previous normal situation, while on the other hand previous factors intensified which negatively affected and disrupted the sustainable development of society.
New phenomena include, first and foremost, daily coronavirus disease incidence and mortality, the value of which is closely related to the nature of a particular coronavirus mutation. The value of these indicators depends on the geographical position of each country or region and is an important function of time, because the time dependence is directly related to the transmission capacity and the rate of a particular coronavirus mutation. The willingness of the responsible government bodies and authorities at the local level to propose adequate and effective countermeasures and to make efforts to implement them quickly in practice is also decisive.
The coronavirus crisis has significantly complicated the sustainability of healthcare, the public administration and microeconomics due to the closure of public and private services, manufacturing and processing companies, crop and livestock production, transport, power engineering and many other sectors of the economy, the education system, military affairs, research and development organizations, tourism, many spheres of social life, etc. The occurrence and transmission of coronavirus infection have also contributed to a significant reduction to the safety of the population and deterioration to its quality of life, especially as regards health, education, quality of work and private life, work-life balance, mental health, personal freedom and equal opportunities, civic involvement, interpersonal relationships, well-being, etc.
Common factors that negatively affect the potential of possibilities for sustainability due to the occurrence of a coronavirus pandemic result from sub-goals.
It is therefore evident that the coronavirus pandemic has negatively affected sustainable development in virtually all key areas defined by the 2030 Agenda and specified domestically by the Strategic Framework “Czech Republic 2030” [4]. At this phase of the pandemic, it is necessary to assess objectively its impacts at the international as well as the local level, to collect data for a better understanding of the consequences of the coronavirus, and to analyze the potential for sustainable recovery in relation to all sustainable development goals.
The authors of the paper believe that the sustainability of life under the current difficult conditions of coronavirus infection can be strengthened by the following in particular:
  • Careful analysis of new risks and heightened existing risks and the proposal of quality countermeasures to mitigate them;
  • Construction of mathematical developmental regression models of time series;
  • Proposal of a set of measures for individuals to prevent coronavirus infection and stop the further transmission of infection.

3.1. Risk Analysis and Treatment during the Second and Third Waves of Coronavirus

Careful risk management consisting of the identification of existing hazards and, in particular, newly emerging hazards in connection with the coronavirus crisis, subsequent risk assessment and the setting of priorities can contribute to the design of effective countermeasures to minimize risks even in today’s difficult coronavirus period. The right decision at the government or local authority level when selecting measures for the implementation of the generated spectrum of alternatives based on multi-criteria evaluation of all the options proposed can fundamentally revive the fulfilment of the sub-goals relevant to sustainable development. It can justly be assumed that risk management plays a dominant role in strengthening sustainability across the spectrum of all stipulated sustainable development goals in comparison with the construction of developmental regression models of time series for selected parameters and the proposal of measures for individuals to prevent infection.
The implementation team identified the following key hazards posed by the coronavirus pandemic by combining the “What-if” and “Checklist Analysis” methods:
  • Failure of the overall population protection system;
  • Immediate threat to the life of the affected population;
  • Endangering the lives of livestock and domestic animals;
  • Production losses of manufacturing and processing companies;
  • Reduction in income from tourism;
  • Limitations of healthcare for the infected and otherwise disabled population;
  • Spreading pandemic outbreaks as a result of their stochastic spread;
  • Restrictions on the operation of transport networks;
  • Disruption in supplying the population with water, food, medicines and disinfectants;
  • Disturbance of public order;
  • Restrictions on international trade;
  • Intensification of sabotage activities;
  • Deliberate spread of the epidemic;
  • Increase in migration as a result of the population moving to localities with a lower infection rate, a smaller number of people with newly diagnosed disease and, thereby, a risk of mortality;
  • Panic;
  • Social impacts on producers, the public administration and families; and
  • Social impacts on healthcare staff due to the increased risk of infection and psychological burden.
The outputs of the assessment and prioritization of risks associated with the identified bio-hazards and other hazards of the coronavirus infection rate and its transmission using the modified PNH method in the Czech Republic were recorded in Table 1 as of 20 February 2021. The assessment of the severity of risks has been conducted in accordance with the criteria defined by the work team and is presented in Table 2.
Table 1 shows the current critical risks in the Czech Republic in descending order of severity:
  • The production losses of manufacturing and processing companies which can lead to serious effects at the macroeconomic level in the event of a large-scale pandemic;
  • Immediate threat to the life of the affected population;
  • Social impacts on healthcare staff due to the increased risk of infection and psychological burden;
  • Limitations in healthcare for the infected and otherwise disabled population.
The following measures have been proposed by the implementation team among the priority actions that may lead to more significant mitigation of the risks associated with the coronavirus infection rate and transmission:
  • Strict adherence to the restrictive measures introduced by the government, provided that these measures have been designed on the basis of careful risk analysis and assessment of the current situation in relation to the occurrence and transmission of the pandemic;
  • The prompt introduction of nationwide immunization of the population;
  • Implementation of rapid orientation detection and identification of outbreaks in regions and companies with a large number of employees by means of periodic testing and consistent tracing;
  • Implementation of effective clinical diagnoses and therapies in patients infected with coronavirus;
  • Ensuring and performing efficient tracing;
  • Clearly identifying outbreaks of infection and clarifying the routes of its transmission;
  • Evacuating healthy people from outbreaks of infection;
  • Preventing the import of the disease and conducting thorough border-crossing control in both directions and areas with coronavirus outbreaks;
  • Restricting travel of the population to foreign countries;
  • Applying effective quarantine, isolation and treatment of suspected patients;
  • Financially motivating people to adhere strictly to isolation (domestic quarantine), because many identified and potentially infected people often refuse quarantine for economic reasons (the employer mostly pays only 60% of their full salary and this literally means an existential risk for some families);
  • Ensuring the decontamination of people, the disinfection of objects and the environment and the minimization of the transmission of infection, especially at workplaces and on public transport;
  • Ensuring the availability of medicines, vaccines, means of prophylaxis and vaccination not only for the affected population, but also for the healthy population;
  • Strengthening immunity and reducing the population’s perception of infection by means of information campaigns focused on the principles of hygiene, healthy eating, lifestyle, sleep, etc.;
  • Minimizing physiological and emotional stressors suppressing the immune system of the population;
  • Preventing the misuse of the situation by individuals and social groups with an interest in increasing panic, misinforming the population and spreading fake news;
  • Ensure that the general public is informed in a timely and adequate manner of the course and consequences of the pandemic and the corrective measures taken to mitigate the associated risks;
  • Rationally implementing restrictions on the production of selected companies and the operation of public services, kindergartens and proximate teaching at primary and secondary schools, vocational schools and tertiary education institutions;
  • Specify the timing of walks, zones and the possibility of purchasing selected goods, medicines, etc., for different groups and age categories of the population;
  • Reinforcing the level of education and training of specialists in the field of detection, diagnosis and treatment of infectious diseases with an emphasis on the coronavirus;
  • Preventing the uncontrolled escape of infection from laboratory, biotechnological and other facilities where coronavirus is handled;
  • Intensively developing cooperation with concerned institutions in this country and abroad;
  • Implementing appropriate building engineering controls, including sufficient and effective ventilation, possibly enhanced by particle filtration and air disinfection, avoiding air recirculation and avoiding overcrowding. Such measures can easily be implemented without much cost, but only if they are recognized as significant in contributing to infection control goals. The use of engineering controls in public buildings, including hospitals, shops, offices, schools, kindergartens, libraries, restaurants, cruise ships, elevators, conference rooms and public transport, in parallel with effective application of other controls, including isolation and quarantine, social distancing and hand hygiene, is an important measure globally in reducing the likelihood of transmission and thereby in protecting healthcare workers, patients and the general public [41].

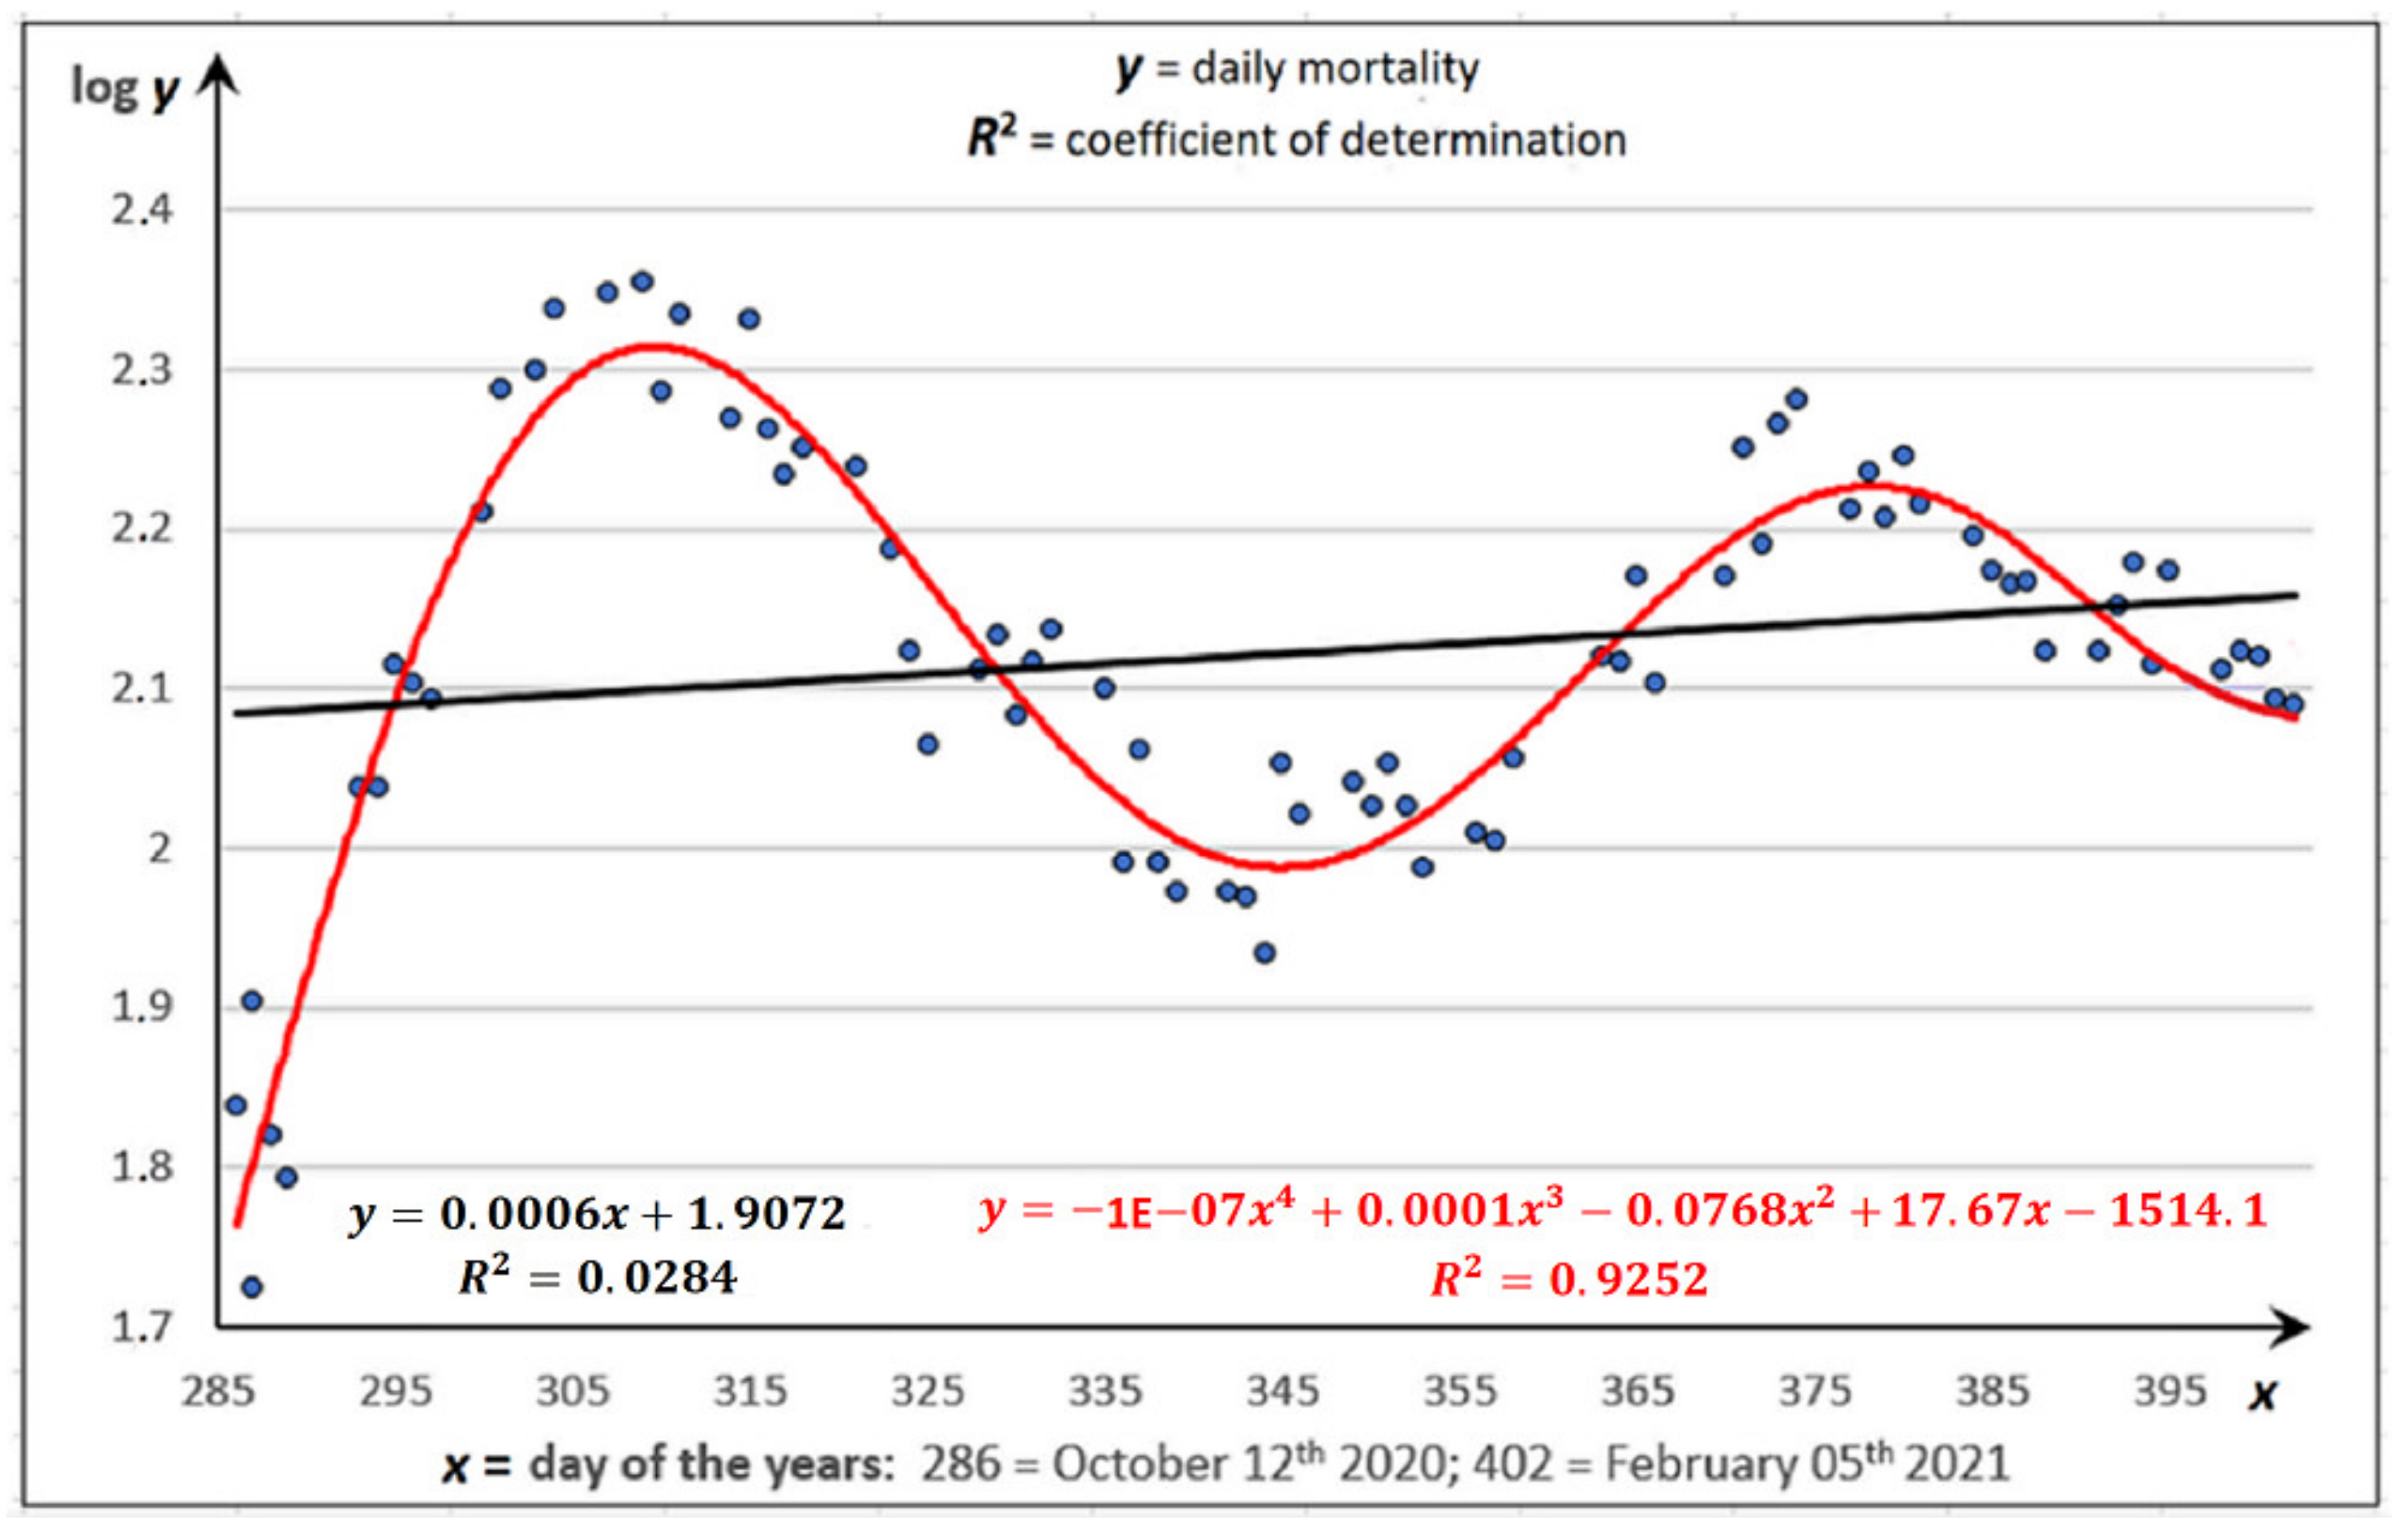
3.2. Developmental Regression Models in the Second and Third Waves of the Coronavirus

Mathematical developmental regression models of time series in relation to strengthening sustainability and fulfilling the set of ambitious goals and sub-goals of sustainable development are of only limited use in the current situation. The cause is spontaneous mutation of many dominant variants of human coronaviruses, often with a frequency of several days. Developmental models can therefore be applied exclusively to verify the effectiveness of the implemented measures and to predict the development of the monitored parameter for a maximum period of one to two weeks. However, an indisputable advantage of these models is the possibility of identifying the course and maximum occurrence of the examined indicators in each of the coronavirus propagation waves and the period of transition of individual waves which signals the local minimum of the regression curve.
In comparison with neighbouring countries (Germany, Austria, Poland and Slovakia), the Czech Republic showed the highest mortality and number of coronavirus infections per 105 inhabitants in the period from 12 October 2020 to 5 February 2021. In contrast, in relation to the same indicator, the Czech Republic was the most successful in the number of individuals recovering, which is logical due to the number of infected people per 105 inhabitants, which significantly exceeded the same indicator in neighbouring countries. Regarding tracing and the number of implemented tests per 105 inhabitants, the Czech Republic recorded the average in comparison with neighbouring countries [42].
The regression models below were processed for the period from 12 October 2020 to 5 February 2021, with the exception of the development of the number of antigen tests performed per day, as the given testing only began in the Czech Republic on 2 November 2020.
The necessary data were gathered from the database of the Ministry of Health of the Czech Republic and read as of 20 February 2021. The reason for this was the delay in the sending of data to the central database, particularly by hygiene stations in smaller cities [43].
The approximate symmetry of the data sets was ensured by the transformation of the elements of the monitored parameters y into a logarithmic scale. The Anderson–Darling test showed that their distribution is close to the Gaussian distribution of N(μ, σ2), as evidenced by the close values of the mean μ and the standard deviation σ [44].
The mathematical model of time series regarding the daily mortality of the population is shown in Figure 1. The reliability of the polynomial function of degree fourth is characterized by the coefficient of determination R2 ≈ 0.93, which corresponds to high model validity at the significance level of α = 0.05, as was found by the F-test. This finding correlates to the relatively narrow confidence interval of daily mortality y ∈ 〈132.4 ± 9.1〉 at the level of significance α = 0.05. The linear model, although highly unreliable, suggests a slight increase in the median daily number of coronavirus-infected deaths from 120 to 141 individuals over the study period. The local extrema of the quartic function reached a maximum on 5 November 2020 and 13 January 2021, and a minimum on 10 December 2021. Correlation of the data with other models was not found using the Spearman nonparametric test at the significance level α = 0.05.
Figure 2 presents the regression model of linear and polynomial dependence regarding the development of the daily number of people with newly proven COVID-19 disease with a coefficient of determination R2 ≈ 0.84 for the quartic regression curve. The reliability of this function was identified by the F-test at a significance level of α = 0.05. The confidence interval at level of significance α = 0.05 concerning regression function of infection incidence per day y ∈ 〈8497.4 ± 770.9〉. It is evident from the graph that the median of the number of infected people per day with the slope of linear dependence k2 = 10−4 remains practically constant during the tracking period and averages about 8.38 × 10³ people. The local extrema of the second and the third waves of coronavirus spread were significant, with maxima on 25 October 2020 and 4 January 2021 and a minimum on 28 November 2020 signalling the transition from the second wave of coronavirus spread to the third wave. Spearman’s test showed a correlation of this data model with the developmental models of time series regarding daily tests of diagnostic and epidemiological indications at a significance level of α = 0.05 (see Figure 2 in comparison with Figures 4 and 5).
Figure 3, which records the daily number of recovered patients of the number of coronavirus-infected people, is distinguished by high data variance σ2 with a low coefficient of determination R2 ≈ 0.40 even for the fourth-degree polynomial. The reliability of the developmental regression model of this time series could not be proven by the F-test even at a significance level of α = 0.1. The high data set divergence of the daily number of recovered individuals infected with coronaviruses y corresponds to a relatively wide confidence interval y ∈ 〈5627.8 ± 933.6〉 at the level of significance α = 0.05. However, from the linear, albeit highly unreliable, model with the slope of k3 = 10−4, it can be deduced that the median of the daily number of recovered people from a quantum of the number of infected people remains almost constant in the evaluated period and is approximately 5.65 × 10³ recovered individuals per day. Local extrema reached their maximum on 4 November 2020 and 15 January 2021, which corresponds to the second and third wave of coronavirus occurrence and transmission, respectively. The local minimum signalling the transition of the second wave to the third wave falls on 10 December 2020. However, the correlation of data models relating to the number of infected and recovered people per day was not confirmed at the significance level of α = 0.05 with any other processed regression model.
The dependence of the daily number of performed tests of diagnostic indication representing tests for patients with disease syndromes is presented in Figure 4. The reliability of the quartic polynomial function is expressed by the coefficient of determination R2 ≈ 0.76. The F-test confirmed the validity of this model at the level of significance α = 0.1. The confidence interval at level of significance α = 0.05 concerning regression function of number of diagnostic indication tests per day y ∈ 〈18299.4 ± 1109.5〉. The linear model with slope k4 = 2 × 10⁻⁴ shows that in the examined period of 116 days the median referring to the number of tests performed a day does not change very much and hovers around a value of 1.88 × 10⁴. Local maxima of the quartic curve can be found on 25 October 2020 and 4 January 2021, the local minimum on 28 November 2020. At the same time, the correlation dependence of the data model with the developmental regression models of daily coronavirus disease incidence and the number of epidemiological indication tests was proven by Spearman’s nonparametric test at the level of significance α = 0.05 (see Figure 4 in comparison with Figure 2 and Figure 5).
The regression model of the daily number of tests of epidemiological indication intended for individuals who came into contact with an infected person in relation to tracing and the risk contacts of a given person is shown in Figure 5. Coefficient of determination R2 ≈ 0.75 of quartic function corresponds to the reliability of this model at a significance level of α = 0.1, as was confirmed by the F-test. The confidence interval of the daily number of performed tests in relation to the epidemiological indication belongs to the range y ∈ 〈7416.2 ± 418.1〉 at the level of significance α = 0.05. Based on the linear model, it can be found that the median, which is related to the number of performed tests of epidemiological indication per day in the monitored period, is constantly increasing, namely from a value of 6.31 × 10³ to a value of 8.46 × 10³ performed tests. The local extrema of the fourth-degree polynomial curve can be found in the form of local maxima on 29 October 2020 and 8 January 2021, with a local minimum on 1 December 2020. Further, the Spearman test at the significance level of α = 0.05 revealed a correlation of the model data with the data on the daily number of newly infected individuals and the diagnostic indication tests performed (see Figure 5 in comparison with Figure 2 and Figure 4).
Figure 6 documents the daily number of performed tests related to preventive and nationwide indication reserved for preventive examination of people at increased risk, for critical state infrastructure, nationwide screening within the framework of community testing of the population and asymptomatic individuals of health and social service providers. The coefficients of determination regarding linear R2 ≈ 0.74 or quadratic R2 ≈ 0.77 function are proof of the quite considerable reliability of both models, confirmed in both cases by the F-test at a significance level of α = 0.1. The corresponding confidence interval varies at the level of significance α = 0.05 in the area y ∈ 〈16676.5 ± 1957.6〉. The linear model with the slope of k6 = 8.7 × 10⁻³ is evidence of a significant increase in the daily number of this type of tests, in total by 5.23 × 10⁴ of accomplished tests for the whole monitored period of time. The correlation dependence of the data with the other investigated regression models at the significance level of α = 0.05 was not registered.
Figure 7 shows a developmental regression model of the number of PCR (Polymerase Chain Reaction) tests, which are based on the verification of genetic information, performed daily. The essence of these tests lies in the laboratory multiplication of nucleic acid, which results in the ability of these tests to detect even trace concentrations of coronavirus and even to decipher its dead residues. For the polynomial function of degree fourth, the model is characterized by a coefficient of determination R2 ≈ 0.77 and validity at a significance level of α = 0.1. The confidence interval related to the development of the number of performed PCR tests per day is at the level of significance α = 0.05 y ∈ 〈31140.3 ± 1443.4〉. From the beginning to the end of the study period, the median of the number of daily tests decreased from a value of 3.31 × 10⁴ to a value of 2.82 × 10⁴, i.e., by 4.92 × 10³ tests accomplished per day. Local extrema reached their maxima on 25 October 2020 and 4 January 2021 and their minimum on 30 November 2020. The correlation of this data model with the data of the above-mentioned regression models at the significance level of α = 0.05 was not proven.
The mathematical developmental regression model of the daily number of antigen tests, called also rapid tests, based on a search for glycoprotein from the coronavirus surface is presented in Figure 8. Although the reliability and sensitivity of antigen tests are noticeably lower as compared to PCR tests due to their nature, their advantage is that they provide information to applicants within 15–30 min. It is evident from Figure 8 that the number of rapid tests performed increased significantly mainly in the initial period of their introduction. The gradual preference of rapid tests over PCR tests can be justified not only by the speed of provision of results, but first and foremost by the fact that their application does not require contact with infected people (the absence of tracing). The reliability of the linear or quadratic developmental regression models with the coefficients of determination R2 ≈ 0.45 or R2 ≈ 0.47 is not particularly high and was not indicated by the F-test even at the significance level of α = 0.1. At the level of significance α = 0.05, an extremely high data variance σ2 of the regression curve connected with the number of antigen tests performed per day also corresponds to an extremely wide confidence interval y ∈ 〈22594.4 ± 3228.2〉. The correlation of this model concerning antigen tests with the other developmental regression data models mentioned above has not been recorded since the start of the antigen tests in the Czech Republic on 2 November 2020.
It should be accepted that the above-mentioned time series models documented allow only short-term predictions, exclusively for workdays, and specifically for only 7–20 days. This is due to the fact that relevant uncertainties are introduced into mathematical models by possible spontaneous mutations of the virus. It is very difficult to obtain any evidence that one mutation causes higher virulence than another. There are a number of coronavirus mutations, but it is difficult to predict which mutation will cause higher virulence as the individual mutations are mutually interchangeable in their effects. It is precisely mathematical developmental models that clarify these issues, not only for COVID-19, but also for other epidemics.
In general, it is possible to derive the following from the course of the created quartic regression models of time series:
  • The logical fact that the course of the quartic curve of daily mortality, including the number of recovered people per day, is delayed by approximately 10 days behind the analogue of the daily incidence of the disease (compare Figure 1 and Figure 3 with Figure 2);
  • The maxima of occurrence and transmission of coronavirus in the second and third wave occurred at the end of the third decade of October 2020 or the first decade of January 2021;
  • The onset of the third wave of coronavirus rate and transmission occurred in the Czech Republic at the turn of October and November last year.

3.3. Prevention of Coronavirus Infection

Adherence to preventive measures by individuals can significantly minimize the daily incidence of coronavirus disease and, logically, the daily mortality. This will restore and reinforce the fulfilment of the ambitious and partial goals defined by the 2030 Agenda specified in the Czech Republic by the Strategic Framework “Czech Republic 2030” in each of the key areas, even during the current coronavirus crisis.
It is important to realize that there is a high probability that people will have to live with coronavirus even in the coming period, just as they have to live with influenza, the hepatitis A, B, C viruses, and other infectious diseases. It is, therefore, necessary to follow the basic hygiene rules of prevention [45]. The predominant part of the offensive measures presented below has resulted from the brainstorming of opinions and experience by the implementation team. Consultation with and materials by experts in the fields of developmental biology, parasitology, epidemiology and virology [45,46,47,48,49,50,51] have been also used, including information provided by the Ministry of the Interior of the Czech Republic (2021) [42], the Ministry of Health of the Czech Republic [43] and the National Institute of Public Health (2021) [13].
The following preventive measures can be recommended in particular:
  • It is necessary to avoid becoming stressed, because emotional stress reduces the natural immunity of the organism. There is no need to make your life difficult. Learn to live with the reality of the existence of SARS-CoV-2.
  • It is advisable to ensure that the mucous membranes of the oral cavity and throat are always moist and never dry. This can be done by drinking a few sips of water or other fluids every 15 min or so, because once the virus enters the mouth fluids flush it into the stomach where gastric HCl that destroys the coronavirus is present.
  • Drinking hot fluids is effective for all viruses of this species. In contrast, consumption of only a minimal amount results in the virus entering the upper respiratory tract and, in the final stage, the alveoli, where it penetrates the semi-permeable membrane to the cell nucleus. This is typical of this type of virus.
  • Drinking cold drinks, especially drinks with ice, is inappropriate as the coronavirus survives longer in a cold environment. It is necessary to realize that a decrease in temperature of 1 °C leads to an increase in the basic reproduction number R of about 3% in an environment of around 20 °C and less.
  • If the infection occurs in your household, it is advisable to disinfect the surfaces of objects of frequent contact and to wash hands with warm water, sporadically with good quality soap. The frequent treatment of hands with disinfectants is not beneficial, because disinfectants are oxidants decomposing the keratin and collagen proteins that are part of the skin and the layer beneath it.
  • It is not necessary to change clothes and to shower as a matter of urgency when returning from the outside environment. Adherence to hygiene and cleanliness is a virtue, but paranoia is not.
  • At body temperatures below 38 °C, it is beneficial to avoid the use of medicines to reduce temperature. Fever is a symptom of the coronavirus infection and also of other diseases, though the body’s natural immune response to the presence of any other virus becomes inactive at higher temperatures. Only when the body temperature exceeds 38 °C and difficulty in breathing worsens is it necessary to use medications and physical methods of treatment (cold wraps on the inside of the thighs and arms, the groin or the front of the neck) to reduce the body temperature and to call a doctor immediately.
  • It is recommended not to rub your eyes with the hands and not to touch your nose or mouth unintentionally. Although it may seem unbelievable, a person touches his/her face up to 2–3 × 10³ times a day.
  • Gargling two to three times a day with a warm solution at 45–55 °C prepared from approximately 50 mL of water and one to two grains of KMnO4 or a pinch of table salt provides effective prevention. NaCl solution is, however, less effective.
  • From the viewpoint of possible infection, it is not appropriate to touch your mask without hand protection when returning home from the outside environment, as your mask may be contaminated with a virus that has adhered to it. Disposable masks should be discarded immediately.
  • Wearing microtone gloves, usually made of high-density polyethylene, to protect the hands is not ideal as they are microporous. The virus accumulates during prolonged use on and inside the glove, especially in an environment with wet sweaty hands, and is easily transmitted by, for example, touching your mouth with your hand.
  • When coming into contact with other people, it is optimal to protect the respiratory tract with a respirator made of nanofibers.
  • It is recommended that cotton masks are treated with salt by soaking in a solution of NaCl of around 10% by weight and subsequently drying out. This protection works on the basis of osmosis, with freshwater cells, including bacteria, moulds, fungi, viruses and Rickettsiae, trying to dilute the salty environment with their own water and thereby drying themselves out. The salty cotton mask catches and kills the virus. It also works the other way around, when the virus comes from the wearer’s own breath, ensuring the protection of not just the wearer, but also the wearer’s surroundings. The salinity of the mask is so low that it does not cause allergies in users, but is sufficiently effective against the transmission of viruses. If the wearer inhales NaCl microcrystals from the mask, this is only beneficial to his/her respiratory tract, because NaCl effectively cleanses airways. This effect is also used when patients with respiratory problems visit salt caves. Salting is not possible in the case of disposable masks, which are usually made of synthetic fibres whose surface does not capture NaCl due to their hydrophobic nature.
  • It is expedient to use masks minimally and exclusively in an environment in which the wearer comes into contact with other people. When a (nano)-mask (respirator) is worn, the exhaled CO2 is inhaled, which reduces the level of O2 in the blood. This causes physiological stress during which the body suffers from hypoxia and is in a sympathomimetic state resulting in increased levels of the hormone cortisol. Cortisol suppresses the immune system as it reduces the number of lymphocytes in the bloodstream and the body becomes more susceptible to any pathogen, e.g., bacteria, viruses or Rickettsiae. Moreover, disposable masks are usually made of synthetic fibres, mostly polypropylene, polyethylene or their copolymers, containing additives that are released, decomposed and cause further weakening of the immunity in a humid breathing environment.
  • It would seem expedient for the elderly to use a mask (respirator) in contact with other people and to avoid shaking hands. Young people do not have to worry too much about shaking hands and the possible absence of a mask in a group of their peers, as they increase their own immunity in this way.
  • If someone sneezes, the trajectory of the aerosol droplets in the open is less than 3 m before hitting the ground. It is therefore important to maintain an adequate distance, around 2–3 m, from the other people and to remember that the aerosol hovers in the air for a substantially shorter time with increasing humidity. This is why the relative humidity inside enclosed rooms should be higher than 40%. If a humidifier is not available in the household, it is rational to keep the temperature lower and not to overheat the room, so that the relative humidity is as high as possible.
  • Vitamins D, E (6000 IU) and ascorbic acid (vitamin C) and zinc tablets may also be used to prevent SARS-CoV-2 infections.
  • Although the coronavirus is unlikely to be transmitted by food, it is advisable to process meat and food containing eggs at higher temperatures.
  • Consumption of foods and beverages rich in essential elements and vitamins, for example juice from sugar cane, apple cider vinegar and, in particular, ginger in combination with cinnamon and mineral waters, strengthens the immune system. (If you like, approximately 50 mL of hard liquor per day, although this does not directly protect the human body from the coronavirus infection, it strengthens the immune system). On the other hand, the consumption of fried, spicy and sweet foods, sweetened soft drinks, etc., suppresses the immunity of the organism.
  • The hormone melatonin, which maintains a strong circadian rhythm and regulates immune processes in the body, is considered an effective immunomodulator. Melatonin is produced by the pineal gland, but only at night and in the dark, so it is necessary to maintain both these conditions at the same time for its synthesis.
  • The human immune organism is also stimulated by regular sport, walks in nature, in the park and especially in pine forests, which are an ideal environment for breathing.
A limiting aspect of this research is the fact that relevant uncertainties are introduced into mathematical models by possible spontaneous mutations of the virus. It is very difficult to obtain any evidence that one mutation causes higher virulence than another. There are a number of coronavirus mutations, but it is difficult to predict which mutation will cause higher virulence as the individual mutations are mutually replaceable in their effects. It is precisely mathematical developmental models that clarify these issues not only for COVID-19, but also for other epidemics.
The second limiting aspect of the research was the delayed sending of data to the central database, especially by the hygiene stations in smaller cities.

4. Conclusions

The existence of the coronavirus crisis has significantly complicated the already time-delayed process of achieving sub-goals and logically, therefore, the 17 ambitious goals set at the international level by the 2030 Agenda and the specified formulations of local policies of sustainable development by individual states and regions. A holistic response and leadership are needed to ensure an inclusive economic and social recovery while protecting the environment under the current coronavirus situation. It is necessary to evaluate the consequences of the pandemic thoroughly and, on that basis, to propose effective countermeasures that will allow the goals of sustainable development to be met at least in part.
A successful solution to the problem may lie in the implementation of a thorough risk analysis that will enable generation and subsequent implementation of adequate measures minimizing the effects of the current crisis on the basis of rational governmental decisions. The construction of developmental regression models of time series will support this effort by checking the evaluation of the effectiveness of the introduced measures and the development and mutual comparison of selected indicators in particular waves of coronavirus infection. The development of a package of preventive measures for individuals to prevent coronavirus infection can also make a significant contribution to reducing the impacts of the occurrence and spread of coronavirus infection and to revitalizing the achievement of sustainability goals.
In connection with the article submitted, the work team intends the following in the coming period:
  • The application of the “Fault Tree Analysis” or “Event Tree Analysis” methods to quantify, in particular, the critical risks associated with the occurrence and spread of coronaviruses and to further specify, on this basis, a set of measures to mitigate the associated risks;
  • Paying particular attention to the transmission of coronaviruses adsorbed on aluminium silicate and carbon particles less than or equal to 2.5 (μm) in connection with this article;
  • The application of the SIR epidemiological model and comparison of the results with our findings using a model of regression analysis of time series; and
  • The supplementation of measures for personal prevention of human coronavirus infection through discussions within the work team and contacts with experts at home and abroad.
Achieving sustainable development goals, especially in this difficult period, is not exclusively the responsibility of the public administration itself. Companies, social partners, non-profit organizations, development and research institutions, and above all each and every citizen must also contribute to active participation in their revitalization and fulfilment.

Author Contributions

Conceptualization, I.T. and F.B.; methodology, F.B.; software, F.B.; validation, F.B. and I.T.; formal analysis, F.B.; investigation, I.T.; resources, F.B.; data curation, F.B.; writing—original draft preparation, F.B.; writing—review and editing, I.T.; visualization, I.T.; supervision, I.T.; project administration, I.T. funding acquisition, I.T. Both authors have read and agreed to the published version of the manuscript.

Funding

This research received no external funding.

Institutional Review Board Statement

Not applicable.

Informed Consent Statement

Not applicable.

Data Availability Statement

Not applicable.

Acknowledgments

Irena Tušer would like to thank AMBIS College, Prague for its support.

Conflicts of Interest

The authors declare no conflict of interest.

References

  1. Hatem, F. Le Concept de Développement Durable: Origines Récentes, une Notion Ambiguë Promettant des Applications Paris; Ministère de l’Environnement, Commisariat du Plan: Quebec City, QC, Canada, 1991. [Google Scholar]
  2. Commission on Environment and Development (CED). Report of the World Commission on Environment and Development: Our Common Future; Oxford University Press: London, UK, 1987. [Google Scholar]
  3. Zhai, T.T.; Chang, Y.C. Standing of environmental public-interest litigants in China: Evolution, obstacles and solutions. J. Environ. Law 2018, 30, 369–397. [Google Scholar] [CrossRef]
  4. Ministry of the Environment of the Czech Republic. Strategic Framework for Sustainable Development of the Czech Republic; Ministry of the Environment: Prague, Czech Republic, 2010. Available online: https://www.mzp.cz/en/czech_republic_strategy_sd (accessed on 24 April 2021).
  5. Basiago, A.D. Economic, social, and environmental sustainability in development theory and urban planning practice. Environmentalist 1998, 19, 145–161. [Google Scholar] [CrossRef]
  6. United Nations, Department of Economic and Social Affairs. Transforming Our World: The 2030 Agenda for Sustainable Development. 2015. Available online: https://sustainabledevelopment.un.org/post2015/transformingourworld (accessed on 24 April 2021).
  7. European Commission. Towards a Sustainable Europe by 2030. Available online: https://ec.europa.eu/info/publications/towards-sustainable-europe-2030_en (accessed on 24 April 2021).
  8. Office of the Government of the Czech Republic, Department for Sustainable Development. Strategic Framework of the Czech Republic 2030; Office of the Government of the Czech Republic: Prague, Czech Republic, 2017. Available online: https://www.vlada.cz/assets/ppov/udrzitelny-rozvoj/projekt-OPZ/Strategic_Framework_CZ2030.pdf (accessed on 29 March 2021).
  9. Bozek, F. Epidemics, Risk Assessment and Treatment with an Emphasis on Coronavirus; Ambis College: Prague, Czech Republic, 2020; pp. 21–25. [Google Scholar]
  10. Tušer, I.; Hoskova-Mayerova, Š. Emergency Management in Resolving an Emergency Situation. J. Risk Financ. Manag. 2020, 13, 262. [Google Scholar] [CrossRef]
  11. Tušer, I.; Hošková-Mayerová, Š. Traffic safety sustainability and population protection in road tunnels. Qual. Quant. 2020. [Google Scholar] [CrossRef]
  12. Nerini, F.F.; Henrysson, M.; Swain, A.; Swain, B.R. Sustainable Development in the Wake of Covid-19. Res. Square 2021. [Google Scholar] [CrossRef]
  13. The National Institute of Public Health. Disease by COVID-19 and the New Coronavirus SARS-CoV-2. 2021. Available online: http://www.szu.cz/index.php?lang=2 (accessed on 24 February 2021).
  14. Trojanek, M.; Grebenyuk, V.; Herrmannová, K.; Nečas, T.; Gregorová, J.; Kucbel, M.; Šín, R.; Roháčová, H.; Stejskal, F. Nový koronavirus (SARS-CoV-2) a onemocnění COVID-19. Časopis Lékařů Českých 2020, 159, 55–66. (In Czech) [Google Scholar] [PubMed]
  15. Popovic, L. Coronavirus and Its Mutations: What Makes “British” Worse Than the Previous Ones and What Do We Know Next? 2021. Available online: https://www.novinky.cz/koronavirus/clanek/koronavirus-a-jeho-mutace-v-cem-je-britska-horsi-nez-ty-predchozi-a-jake-dalsi-zname-40348273 (accessed on 24 February 2021).
  16. Conti, P.; Caraffa, A.; Gallenga, C.E.; Kritas, S.K.; Frydas, I.; Younes, A.; Di Emidio, P.; Tetè, G.; Pregliasco, F.; Ronconi, G. The British variant of the new coronavirus-19 (Sars-Cov-2) should not create a vaccine problem. J. Biol. Regul. Homeost. Agents 2021, 35, 1–4. [Google Scholar] [CrossRef] [PubMed]
  17. Max, R.; Ritchie, H.; Ortiz-Ospina, E.; Hasell, J. Coronavirus Pandemic (COVID-19). 2020. Available online: https://ourworldindata.org/coronavirus (accessed on 24 February 2021).
  18. WHO Coronavirus Disease (COVID-19). Available online: https://covid19.who.int/ (accessed on 24 February 2021).
  19. ECDC—European Centre for Disease Prevention and Control. Available online: https://www.ecdc.europa.eu/en/geographical-distribution-2019-ncov-cases (accessed on 24 February 2021).
  20. Anastassopoulou, C.; Russo, L.; Tsakris, A.; Siettos, C. Data-based analysis, modelling and forecasting of the.COVID-19 outbreak. PLoS ONE 2020, 15, e0230405. [Google Scholar] [CrossRef] [PubMed] [Green Version]
  21. Roosa, K.; Lee, Y.; Luo, R.; Kirpich, A.; Rothenberg, R.; Hyman, J.; Yan, P.; Chowell, G. Real-time forecasts of the COVID-19 epidemic in China from February 5th to February 24th, 2020. Infect. Dis. Model. 2020, 5, 256–263. [Google Scholar] [CrossRef] [PubMed]
  22. Fanelli, D.; Piazza, F. Analysis and forecast of COVID-19 spreading in China, Italy and France. Chaos Solitons Fractals 2020, 134, 109761. [Google Scholar] [CrossRef] [PubMed]
  23. Hasan, A.; Putri, E.R.M.; Susanto, H.; Nuraini, N. Data-driven modeling and forecasting of COVID-19 outbreak for public policy making. ISA Trans. 2021. [Google Scholar] [CrossRef] [PubMed]
  24. Postavaru, O.; Anton, S.R.; Toma, A. COVID-19 pandemic and chaos theory. Math. Comput. Simul. 2021, 181, 38–149. [Google Scholar] [CrossRef] [PubMed]
  25. Ahmed, I.; Hasan, M.; Akter, R.; Sarkar, B.K.; Rahman, M.; Sarker, M.S.; Samad, M.A. Behavioral preventive measures and the use of medicines and herbal products among the public in response to Covid-19 in Bangladesh: A cross-sectional study. PLoS ONE 2020, 15, e0243706. [Google Scholar] [CrossRef] [PubMed]
  26. Fikadu, Y.; Yeshaneh, A.; Melis, T.; Mesele, M.; Anmut, W.; Argaw, M. COVID-19 Preventive Measure Practices and Knowledge of Pregnant Women in Guraghe Zone Hospitals. Int. J. Womens Health 2021, 7, 39–50. [Google Scholar] [CrossRef] [PubMed]
  27. Fong, D.; San Nicolò, K.O.; Alber, M.; Mitterer, M. Evaluating the longitudinal effectiveness of preventive measures against COVID-19 and seroprevalence of IgG antibodies to SARS-CoV-2 in cancer outpatients and healthcare workers. Wiener Klinische Wochenschrift 2021, 27, 1–5. [Google Scholar]
  28. Sutton, I. Process Risk and Reliability Management: Operational Integrity Management, 1st ed.; Oxford Elsevier Inc.: Amsterdam, The Netherlands, 2010; pp. 143–152. [Google Scholar]
  29. Dickert, T.G. Methods for Environmental Impact Assessment: Guidelines and Commentary, 1st ed.; University of California: Berkeley, CA, USA, 1974; pp. 79–88. [Google Scholar]
  30. Krenek, R.; Department of Infectious Diseases, University Hospital Brno-Bohunice, Brno, Czech Republic. Personal communication, 2021.
  31. Navratil, L.; Faculty of Biomedical Engineering Czech Technical University in Prague, Kladno, Czech Republic. Personal communication, 2021.
  32. Komar, A.; Faculty of Military Health Sciences, University of Defence, Brno, Czech Republic. Personal communication, 2021.
  33. Kudlák, A.; Urban, R.; Hoskova-Mayerova, S. Determination of the Financial Minimum in a Municipal Budget to Deal with Crisis Situations. Soft Comput. 2020, 24, 8607–8616. [Google Scholar] [CrossRef]
  34. Bozek, A.; Stahl und Anlagenbau GmbH, Hinterhermsdorf, Germany. Personal communication, 2021.
  35. Koudelka, C.; Vrána, V. Rizika a Jejich Analýza, 1st ed.; VSB Technical University of Ostrava: Ostrava, Czech Republic, 2006; pp. 9–11. Available online: http://fei1.vsb.cz/kat420/vyuka/Magisterske%20nav/prednasky/web/RIZIKA.pdf (accessed on 24 February 2021). (In Czech)
  36. Majumdar, S.N.; Pal, A.; Schehr, G. Extreme value statistics of correlated random variables: A pedagogical review. Phys. Rep. 2020, 840, 1–32. [Google Scholar] [CrossRef] [Green Version]
  37. Meloun, M.; Militký, J. Statistická analýza experimentálních dat (in Czech), 2nd ed; Academia: Prague, Czech Republic, 2004; p. 953. [Google Scholar]
  38. Weathington, B.L.; Cunningham, C.J.L.; Pittenger, D.J. Understanding Business Research, 1st ed.; John Wiley & Sons: Hoboken, NJ, USA, 2012; pp. 265–266. [Google Scholar]
  39. Bakare, E.A.; Hoskova-Mayerova, S. Optimal Control Analysis of Cholera Dynamics in the Presence of Asymptotic Transmission. Axioms 2021, 10, 60. [Google Scholar] [CrossRef]
  40. Bekesiene, S.; Hošková-Mayerová, Š. Automatic Model Building for Binary Logistic Regression by Using SPSS 20 Software. In Proceedings of the 18th Conference on Applied Mathematics APLIMAT 2019 Proceedings (SPEKTRUM STU), Bratislava, Slovakia, 5–7 February 2019; pp. 31–40, ISBN 978-80-227-4884-1. [Google Scholar]
  41. Morawska, L.; Tang, W.J.; Bahnfleth, W.; Bluyssen, M.P.; Boerstra, A.; Buonanno, G.; Cao, J.; Dancer, S.; Floto, A.; Franchimon, F.; et al. How can airborne transmission of COVID-19 indoors be minimised? Environ. Int. 2020, 142, 105832. [Google Scholar] [CrossRef] [PubMed]
  42. Ministry of the Interior of the Czech Republic; NAKIT; National Agency for Communication and Information Technologies. Development in the Czech Republic and in Other Countries. 2021. Available online: https://nakit.cz/koronadata (accessed on 24 February 2021).
  43. Ministry of Health of the Czech Republic. Covid-19: Overview of the Current Situation in the Czech Republic. 2021. Available online: https://onemocneni-aktualne.mzcr.cz/covid-19 (accessed on 24 February 2021).
  44. Razali, N.; Wah, Y. Power Comparisons of Shapiro-Wilk, Kolmogorov-Smirnov, Lilliefors and Anderson-Darling tests. J. Stat. Modeling Anal. 2011, 2, 21–33. [Google Scholar]
  45. Henry, B.; Faculty of Medicine, School of Population and Public Health, The University of British Columbia, Vancouver, BC, Canada. Personal communication, 2020.
  46. Flegr, J. They Swept Everything under the Rug, Life Stops, It Didn’t Have to Happen at All, Says Flegr; Charles University, The Faculty of Natural Science: Prague, Czech Republic, 2020; Available online: https://video.aktualne.cz/dvtv/vse-zametali-pod-koberec-zivot-se-zastavi-vubec-se-to.nemuse/r~a857cc2e13d711eba7deac1f6b220ee8/ (accessed on 29 March 2021).
  47. Flegr, J. The Third Wave Will Come before Christmas. The Virus Will Be Much More Aggressive, It’s Too Late for the Veils, Flegr Warns; Charles University, The Faculty of Natural Science: Prague, Czech Republic, 2020; Available online: https://www.televizeseznam.cz/video/face-to-face/treti-vlna-prijde-uz-pred-vanocemi-virus-bude-.mnohem-agresivnejsi-na-rousky-je-pozde-varuje-flegr-64106362 (accessed on 29 March 2021).
  48. Hardell, L.; University Hospital, Örebro, Sweden. Personal communication, 2020.
  49. Omelchenko, A.; St. Boniface General Hospital Research Centre, Winnipeg, MB, Canada. Personal communication, 2021.
  50. Subhas, K.S.; National Risk Management Laboratory, US Environmental Protection Agency, Cincinnati, OH, USA. Personal communication, 2021.
  51. Ždímal, V. Institute of Chemical Process Fundamentals of the CAS. It’ll Only Survive for Minutes. The Scientist Describes What Happens to the Virus in Warmer Weather. 2020. Available online: https://zpravy.aktualne.cz/domaci/zivot-v-pandemii-vladimir-zdimal-z-ustavu-chemickych-procesu/r~cbc8c13c67a511eb95caac1f6b220ee8/ (accessed on 29 March 2021).
Figure 1. Development of daily mortality in the coronavirus-infected population.
Sustainability 13 06764 g001
Figure 2. Development of the daily number of newly coronavirus-infected people.
Sustainability 13 06764 g002
Figure 3. Development of the number of recovered coronavirus-infected individuals per day.
Sustainability 13 06764 g003
Figure 4. Development of the number of diagnostic indication tests performed per day.
Sustainability 13 06764 g004
Figure 5. Development of the daily number of epidemiological indication tests performed.
Sustainability 13 06764 g005
Figure 6. Development of the daily number of performed tests of preventive and nationwide indication.
Sustainability 13 06764 g006
Figure 7. Development of the daily number of PCR tests performed.
Sustainability 13 06764 g007
Figure 8. Development of the number of antigen tests performed per day.
Sustainability 13 06764 g008
Table 1. Semi-quantitative risk assessment of the COVID-19 pandemic using the modified PNH method.
Indication of RiskName of HazardPNHRLevel of RiskPriority
RaFailure of the overall system of protection of the population15525marginal14
RbEEndangering the lives of the affected population3.55589tolerable2
RcEndangering the lives of livestock and domestic animals1.5226acceptable17
RdProduction losses of production and processing companies454.590tolerable1
ReReduction of income from tourism43.5342low11
RfRestrictions on healthcare for the infected and otherwise disabled population44.54.581acceptable3
RgIncreasing the number of pandemic outbreaks due to its stochastic spread3.54.53.555medium8
RhRestrictions on the operation of transport networks43.53.549medium9
RiDisruption of the population’s supply of water, food, medicine and disinfectants3.53.5561high7
RjDisturbance of public order233.521marginal15
Rkrestrictions on international trade33.54.547medium10
RlIntensification of sabotage activities1.52.5311acceptable16
RmDeliberate spread of the epidemic244.536low12
RnIncrease in migration3.55470high6
RoPanic1.54530low13
RpSocial impacts on producers, public administrations and families44.5472high5
RqSocial impacts on health workers of increased risk of infection and psychological burden44580acceptable4
Source: the authors.
Table 2. Risk assessment criteria by modified PNH method.
Degree of RiskPoint Risk IntervalLevel of Risk
I≥95unacceptable
II〈85; 95) tolerable but undesirable (a)
III〈75; 85) acceptable (b)
IV〈60; 75) high (c)
V〈45; 60) medium (d)
VI〈30; 45) low (e)
VII〈15; 30) marginal
VIII〈1; 15)negligible
Legend: (a) Risks will be tolerated until effective countermeasures to mitigate them, such as vaccination, are discovered and immediately implemented. Measures need to be designed and put into practice as soon as possible, regardless of the costs. This means that reducing this type of risk may not always be based on the “as low as is reasonably achievable (practicable)” principle, denoted by the abbreviations ALARA and ALARP. (b) To minimize the risks, it is recommended to introduce only those countermeasures for which the “Cost Benefit Analysis” proves lower costs than benefits, or more precisely when multi-criteria evaluation summarizes the overall advantages of each proposed measure and makes it possible to choose the optimal measures. A timetable should be established for the design and implementation of measures for gradual risk reduction. (c) High but lower than acceptable risk. Similar principles are applied as for acceptable risks when dealing with this type of risk. (d) In order to reduce the risks, it is appropriate to introduce only those countermeasures that show verifiably lower costs compared to benefits. (e) When aiming for risk mitigation, it is often advantageous to implement measures of an organizational nature which tend to be the most cost-effective. Note: Risks of all the above-mentioned degrees have to be monitored on an ongoing basis and simultaneously evaluated, especially rigorously then tolerable and acceptable risks. The frequency of monitoring should be increased with a higher level of risk. Source: the authors.
Publisher’s Note: MDPI stays neutral with regard to jurisdictional claims in published maps and institutional affiliations.

