Article

The Cost of Reducing Municipal Unsorted Solid Waste: Evidence from Municipalities in Chile

by
Maria Molinos-Senante
1,2 and
Alexandros Maziotis
1,*
1
Departamento de Ingeniería Hidráulica y Ambiental, Pontificia Universidad Católica de Chile, Santiago 4860, Chile
2
Centro de Desarrollo Urbano Sustentable ANID/FONDAP/15110020, Universidad Católica de Chile, Santiago 4860, Chile
*
Author to whom correspondence should be addressed.
Sustainability 2021, 13(12), 6607; https://doi.org/10.3390/su13126607
Submission received: 21 May 2021 / Revised: 8 June 2021 / Accepted: 8 June 2021 / Published: 10 June 2021

Abstract

:
The management of municipal solid waste sector is crucial for a sustainable circular economy. Waste utilities are expected to provide high quality solid waste services at an affordable price. The efficient management of solid waste requires its assessment from an economic and environmental perspective, i.e., eco-efficiency assessment. Although the reduction of unsorted waste incurs an economic cost, its positive externalities are huge for the well-being of society, the environment, and people. Our study quantifies the marginal cost of reducing any unsorted waste using stochastic frontier analysis techniques which allow us to estimate the eco-efficiency of the waste sector. Our empirical approach focuses on the municipal solid waste collection and recycling services provided by several waste utilities in Chile. The results indicate that substantial eco-inefficiency in the sector exists, since the average eco-efficiency score is roughly 0.5 which means that the municipalities could approximately halve their operational costs and unsorted waste to produce the same level of output. The average marginal cost of reducing unsorted waste is 32.28 Chilean pesos per ton, although notable differences are revealed among the waste utilities evaluated. The results provided by this study are of great interest to stakeholders to promote sustainable management solutions and resource efficient solid waste services.

1. Introduction

Municipal solid waste (MSW) management is an important indicator for the development of a country [1], as it has a significant effect on resource efficiency, the environment, and peoples’ well-being [2]. Over the years, the performance of the MSW sector has received considerable attention from researchers and policy makers due to population growth, economic growth, customer habits, and resource constraints [3,4,5]. In spite of the efforts conducted by local and national authorities, the volume of MSW produced has been increasing in the European Union and developing countries [6,7,8], and therefore improving the efficiency of solid waste services is of great importance.
An extensive literature review illustrates that most of the previous studies in the framework of performance assessment of public services that collect and recycle waste, i.e., waste utilities (WUs), have focused on evaluating the cost efficiency (e.g., [9,10]) or the operational efficiency of WUs (e.g., [11]). Economic or cost efficiency measures the ability of the unit (WU in this study) to reduce its costs for a given level of output (input oriented) or the ability to expand its output for a given level of cost (output oriented). Hence, this approach ignores the environmental performance of WUs because MSW collected or treated is used as an output variable without differentiating between recycled and unsorted waste, in spite of the fact that they have notably different environmental impacts [2,6]. Nevertheless, the performance of units can be evaluated both from an economic and environmental perspective, i.e., eco-efficiency [12] by considering that the objective of the unit is also to reduce any bad (undesirable) outputs. In the case of solid waste services, WUs want to collect and recycle as much MSW waste as possible and reduce any unsorted waste while making efforts to reduce operational costs [13,14,15,16,17].
From a methodological perspective, the evaluation of the (eco)-efficiency of units can be conducted through the use of both non-parametric (several studies have used non-parametric techniques to evaluate the efficiency (e.g., [9,13]) and eco-efficiency (e.g., [6,14−17]) of the solid waste sector using linear programming, e.g., data envelopment Analysis (DEA)), and parametric (other studies have adopted econometric techniques to evaluate the efficiency of the waste sector (e.g., [7,18,19,20,21]) using econometrics e.g., stochastic frontier analysis (SFA)) techniques [6,22]. DEA techniques compare the performance of each unit relative to the frontier of the best industry [23] and do not assume a functional form for the underlying technology [24]. However, DEA is a deterministic approach, which means that it does not consider noise. By contrast, SFA techniques separate between inefficiency and noise and assume a functional form for the underlying technology. Since SFA techniques incorporate both inefficiency and noise, we adopted this method to evaluate the eco-efficiency of the MSW sector.
Focusing on the empirical applications conducted, while most of the studies of the MSW industry assessed its (eco)-efficiency in several European Union countries such as Italy, Portugal and Belgium, evidence from developing economies is limited. Two exceptions are the studies by Llanquileo-Melgarejo et al. [16] and Llanquileo-Melgarejo and Molinos-Senante [17] which used DEA techniques to evaluate the eco-efficiency of several municipalities in the collection and recycling of MSW in Chile. The authors concluded that considerable eco-inefficiency exists, and more evidence is needed to understand the drivers of the inefficiency. Moreover, to improve sustainability in the provision of MSW services, it is essential to have reliable and robust information about the cost of reducing unsorted waste. Thus, our study aims to quantify in monetary terms the marginal cost of reducing undesirable output in the municipal solid waste sector. This information could be of great value to stakeholders to deliver waste services in an efficient and sustainable way.
Against this background, the objective of this study is threefold. The first is to evaluate the eco-efficiency of a sample of Chilean WUs. The second is to estimate the marginal cost of reducing unsorted waste in the municipal waste sector. The third is to evaluate the influence of some environmental variables on the eco-efficiency estimates of WUs and to cluster WUs according to their economic and environmental performance. In order to do this, we use parametric techniques integrating both desirable and undesirable outputs, i.e., recyclable and unsorted waste, respectively. To the best of our knowledge, this study is the first and attempt to quantify in monetary terms the cost of reducing unsorted waste in the MSW sector using parametric techniques. Policy makers highly value these estimates, as they can help them to make better decisions and manage their operations efficiently.

2. Materials and Methods

In this section we present the methodology used to estimate the cost efficiency of several WUs that are involved in the collection and recycling of waste. We also describe how we can estimate the marginal cost of reducing unsorted waste (bad output) as part of the process. We then present the clustering technique used to group WUs based on the cost of reducing unsorted waste and eco-efficient scores.

2.1. Eco-Efficiency Assessment

We followed a parametric approach and estimate a cost frontier model. The generic form of a cost frontier model is defined as follows [25,26]:
C i = ( y i , w i ; β ) + ν i + u i
where i denotes unit (WU), C i is the total cost of each unit of assessment, which is a function of the set of output and input prices, y i and w i , respectively, and β is the vector of the unknown parameters to be estimated [27]. The error term in the cost frontier in Equation (1) consists of two components. The first term, v i , is the standard noise term which follows the normal distribution, v i ~ N ( 0 , σ 2 ) . The second term, u i , denotes inefficiency and is assumed to follow the exponential distribution, u i ~ exp ( θ ) [28,29].
In order to estimate the cost frontier model in Equation (1) we needed to specify a cost function. The translog specification was chosen because it is a second-order flexible form, takes into account the different size of the WUs, is widely used in the literature, and is easy to estimate [27,30]. Due to the absence of data for input prices, we specify the following frontier cost function [31,32,33,34]:
l n C i = a 0 +   k = 1 K β k l n y i , k + 1 2 k = 1 K l = 1 K β k l l n y i , k l n y i , l + z = 1 Z γ z l n z i , z +   1 2 k = 1 K z = 1 Z δ k z l n y i , k l n z i , z + π = 1 Π χ π l n ξ i , +   v i + u i
where K denotes the total number of outputs that need to be produced by each WU i . In our study, these outputs include different types of recyclable waste. As the main purpose of the study is to estimate the marginal cost of reducing unsorted waste from the solid waste service, we include an additional cost driver, z i , which represents service quality, and is captured by the amount of unsorted waste. Furthermore, there might be several environmental factors such as population density, which could influence WU costs and inefficiency in the collection and recycling process of MSW [6,17]. Therefore, these were included in the estimation process through the term ξ i . The eco-efficiency (ECOE) of each evaluated unit was calculated as follows:
E C O E i = exp ( u i )  
We estimated the marginal cost of reducing unsorted waste or equivalently, improving the quality of MSW service econometrically from Equation (2) as follows [31,33,34]:
M C O S T i = E L C O S T i × C i z i  
where M C O S T i denotes the marginal cost of reducing any unsorted waste for each WU i or equivalently, improving service quality and enhancing sustainability, E L C O S T i presents the elasticity of cost with respect to the cost driver z i . Variable z i is our undesirable output and is defined as the amount of unsorted waste, and variable C i is the actual cost of managing MSW to each WU.

2.2. Clustering Techniques

Finally, in order to get a better understanding about the relationship between eco-efficiency and the marginal cost of reducing unsorted waste across WUs, we used cluster analysis techniques. These techniques allow the classification of WUs into homogeneous groups based on similar characteristics [35,36]. Consistent with past studies [37,38,39,40], we used k-means clustering to group WUs based on similar efficiencies and characteristics. The k-means algorithm functions in three stages. In the first stage, we define the number of clusters k and the initial centroids are randomly selected and defined [41]. In the second stage, each object is then allocated to its nearby centroid. In the third stage the clusters are updated and the algorithm converges when there are no changes in the assignments of objects among the clusters [42]. We note that the optimal number of clusters in the k-means algorithm is determined using the silhouette score, which takes a value between zero and one [40]. A value of one suggests that the units in the same cluster have very similar characteristics scores [43].

2.3. Data and Sample Selection

Our empirical study focuses on the MSW management services provided by 298 WUs in Chile. It should be noted that each WU corresponds to a municipality, since solid waste services in Chile are provided by municipalities [17]. The WUs included in our study cover 79% of the total Chilean population (14,716,132). The MSW collection system in Chile is door-to-door, for both recyclable and unsorted waste. Additionally, several of the municipalities evaluated have implemented green areas where citizens can carry recyclable waste. Hence, municipalities save collection costs as citizens are aware of the importance of separative collection and the volume of recyclable MSW deposited in the green areas increases. As Chile is a small country and relatively isolated, most of the recycled MSW is used in the same country without too much processing. Moreover, based on Chilean Law 20,920, which established the framework for waste management, extended the responsibility of the producer, and promotes recycling, the recycling system to be developed in Chile focuses on sustainability issues as the government gives a lot of importance to economic and social issues in addition to environmental ones.
The data refer to the year 2018 and were downloaded from the National Waste Declaration System (SINADER in Spanish) and the National System of Municipal Information (SINIM in Spanish). We selected the inputs, desirable outputs and undesirable outputs based on previous studies evaluating the eco-efficiency of solid waste providers in Chile and other countries. Our sole input is the total cost of providing MSW services, i.e., waste collection and recycling services [6,13,14,15,16,17,44], which was measured in Chilean pesos per year (CLP/year). We included two desirable outputs (i.e., recyclable waste). The first output was the amount of paper and cardboard collected and recycled, measured in tons per year, and the second desirable output was the amount of organic waste recycled, measured in tons per year [17,44,45,46,47]. The undesirable output was captured by unsorted waste and was measured in tons per year [14,16,17].
In accordance with past studies which highlighted that there might be several environmental variables that could influence the efficiency of solid waste management services (e.g., [1,3,22]), the following environmental variables were included in the assessment. The first variable was population density (e.g., [2,4,14,48]). This variable was calculated as the ratio of the number of inhabitants and the area of the municipality. The second variable was proxied by the tourism index developed by the Division of Studies and Territory of the Undersecretariat of Tourism (Sernatur) [17]. It took a value between zero and one, with a value of one suggesting that the area is highly touristic. Table 1 reports the descriptive statistics of the variables used in the study.

3. Results and Discussions

This section describes the results from the econometric estimation of the stochastic frontier model. We then discuss the results based on eco-efficiency scores and the marginal cost of reducing the unsorted waste of WUs. We finally offer some policy implications.

3.1. Cost Frontier Analysis

The results from the estimation of the cost frontier are reported in Table 2. As expected, the elasticities of cost with respect to paper and organic waste had a positive sign suggesting that higher outputs led to higher costs. The cost elasticity of paper was found to be statistically significant from zero. Keeping other variables constant, a 1% increase in the amount of paper and cardboard collected and recycled will increase costs by 0.149% on average. By contrast, a 1% increase in the amount of organic waste will lead to an immaterial increase in costs by 0.004%, but this impact is not statistically significant from zero. Thus, the collection and recycling of paper is an important cost driver for solid waste management. It appears that there are cost complementarities between the two outputs, as suggested by the negative sign in the interaction term, but these complementarities are not statistically significant from zero.
The cost elasticity with respect to unsorted waste has a negative sign and is statistically significant from zero. Ceteris paribus, a 1% increase in the amount of unsorted waste could lead to an increase in costs by 0.805% on average. This finding implies a positive marginal cost of enhancing service quality [31,33]. It also suggests that improving economic and resource efficiency could be achieved at the same time. As the collection and recycling of unsorted waste increases, then costs could also increase as indicated by the squared term for unsorted waste. It appears that costs could go down from the collection and recycling of both paper and unsorted waste, as indicated by the negative sign of their interaction term. However, this result is not statistically significant from zero. Both environmental variables had a significant effect on the costs of WUs, with tourism index having the major impact based on the magnitude of the estimated coefficient. It was found that, on average, a unit increase in population density and tourism could increase costs by 0.046% and 1.442%, respectively. Thus, the more densely populated the area is, the higher the costs related to the collection, transportation, and disposal of waste would be. Moreover, municipalities with high levels of tourism need to collect and recycle more waste, which could have a negative impact on costs. Finally, considerably high levels of inefficiency exist in the solid waste sector, as indicated by the statistically significance of θ .

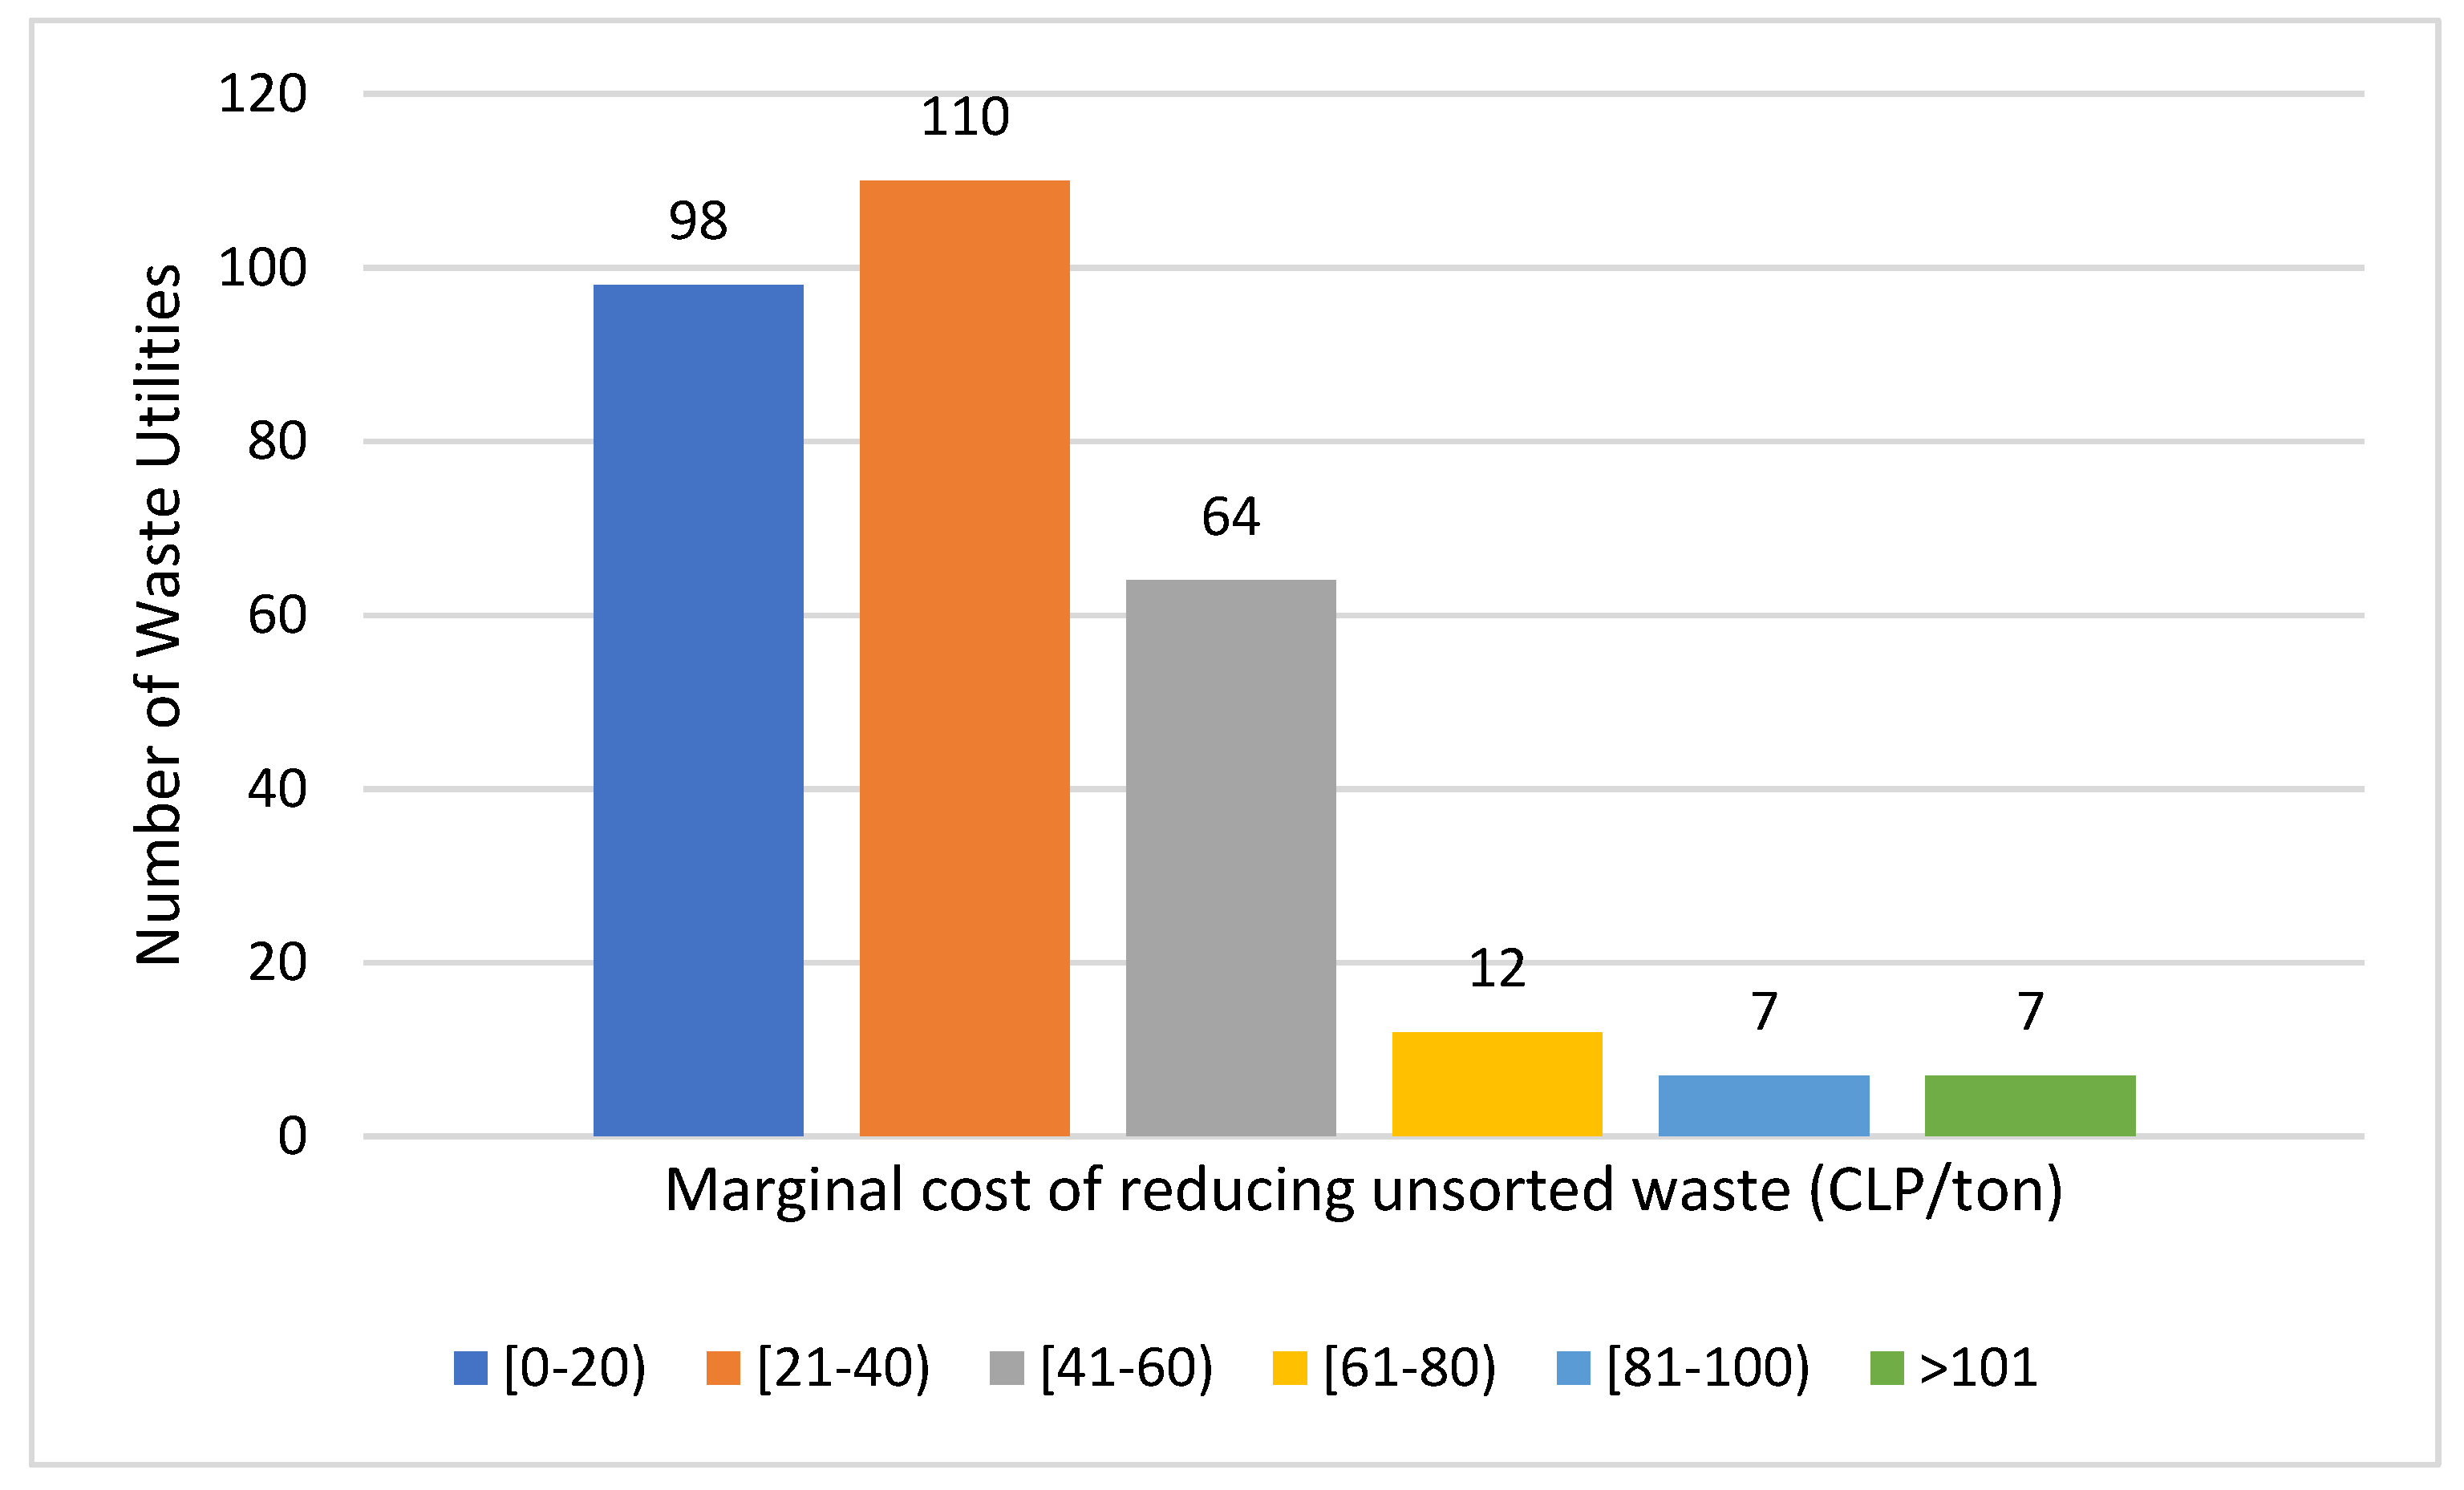
3.2. Eco-Efficiency Assessment and Marginal Cost of Reducing Unsorted Waste

Table 3 reports the main statistics for the eco-efficiency assessment of WUs and the marginal cost of reducing unsorted waste. It is found that the average eco-efficiency was 0.488, which means that on average the municipalities evaluated could reduce costs and unsorted waste by 51.2%. The findings are consistent with a previous study by Llanquileo-Melgarejo et al. [17] which reported a mean eco-efficiency of 0.54 for several Chilean municipalities when undesirable outputs were included in the analysis. This result suggests that considerable eco-inefficiency exists in the Chilean solid waste sector. We did not find any municipalities that were fully eco-efficient, i.e., they reported an eco-efficiency score of 1.000 (or 100%). The best performing WU reported an average eco-efficiency of 0.921, which means that it could improve its managerial practices by 8% to be more eco-efficient.
Figure 1 offers a better understanding of how the levels of eco-efficiency were distributed across WUs. The results indicate that 277 out of 298 WUs (93.0%) reported an eco-efficiency score lower than 0.80. In particular, 57 WUs reported an eco-efficiency score less than 0.20, while the range in eco-efficiency scores for 42 WUs was between 0.21 and 0.40. This finding means that the potential saving in costs and unsorted waste among these municipalities ranged from 60% to 100%. Considerable savings could be achieved in the other groups. Ninety-two WUs could improve their eco-efficiency between 40% and 60%, whereas 86 WUs could reduce costs and unsorted waste up to 40%. Thus, the findings confirm the existence of high eco-inefficiency in the Chilean MSW sector. Twenty-one out of the 298 WUs (7%) appeared to be more eco-efficient than the rest of their peers as they reported an eco-efficiency score greater than 0.81. However, these WUs still need to improve efficiency by up to 20% to catch-up with the most efficient WUs in the sector.
As far as the marginal cost to reduce unsorted waste is concerned, it was found to be on average 32.28 CLP/ton. This implies that, on average, a municipality needs to spend an extra of 32.28 Chilean pesos to prevent one ton of unsorted waste. The range in the marginal cost of reducing unsorted waste varied from 0.008 to 242.10 CLP per ton. The difference in the range can be attributed to the different costs to the WUs of providing MSW services. Figure 2 shows the distribution of the marginal costs of reducing unsorted waste measured in Chilean pesos per ton for the Chilean WUs under evaluation. The majority of the WUs, that is 208 out of 298 (69.8%), reported a mean marginal cost of reducing unsorted waste up to 40 CLP per ton. There were a small number of WUs where the mean cost of preventing one ton of waste not being sorted for collection and recycling was more than 60 CLP.
Considering that our assessment accounts for 79% of the total Chilean population, Table 4 displays the results on eco-efficiency and marginal cost of reducing unsorted waste by region. The majority of the municipalities in our study are located in the central region of Chile, with Santiago Metropolitan being the largest with 49 municipalities. The Santiago Metropolitan is the most densely populated area in our sample, with 5667 inhabitants per km2. The collection of waste seems to be challenging in such densely populated areas. Its mean eco-efficiency was 0.545, and the marginal cost of reducing waste was 38.13 CLP/ton. More frequent collection by waste services and more recycling drop-off points are policies that could be adopted in this region to improve eco-efficiency. Higher eco-efficient scores were reported for moderately sized regions located in the southern part of Chile. For instance, the region of Bío-Bío, with a population density of 118 inhabitants per km2, reported an eco-efficiency score of 0.598, meaning that MSW management performance could further improve by 40% if considerable reductions in operating costs and the amount of unsorted waste occurred. Low eco-efficiency scores were reported for the north region of Chile as well, with the best-performing region having an eco-efficiency of 0.582. Regions in this part of Chile have a lower number of municipalities compared to other parts. Overall, the findings suggest that location does not affect the eco-performance of WUs in terms of collection and waste recycling services.
Table 5 reports the results on the eco-efficiency and marginal cost of reducing unsorted waste based on population density and level of tourism in the Chilean WUs evaluated. Areas with population density between 48 and 11,000 inhabitants per km2 were characterized by higher levels of efficiency than smaller areas. These areas also reported a higher cost to reduce any unsorted waste. This finding suggests that as areas become more densely populated, the cost of collecting MSW increases. Thus, the cost to reduce unsorted waste increases as well. However, better management of recyclable and unsorted waste could lead to a higher eco-efficiency. By contrast, the results showed that eco-efficiency dropped for municipalities with population densities greater than 11,000 inhabitants per km2.
As far as the level of tourism is concerned, we conclude that the more touristic an area, the higher the level of eco-efficiency. This is explained by the fact that in these areas, collection of waste services might be more frequent, as waste needs to be collected from both domestic residents and tourists. However, it also appears that the cost of reducing any unsorted waste is considerably higher than in less touristic areas, which means that municipalities need to make notable efforts to reduce operational costs and the amount of unsorted waste to improve eco-efficiency.

3.3. Clustering Analysis

As eco-efficiency scores and the marginal cost of reducing unsorted waste showed variation across WUs, we classified them into homogeneous groups according to the values reported for eco-efficiency and the marginal costs of reducing unsorted waste. We also report some other characteristics of these groups, such as total costs, population density, and tourism index. The results demonstrate that the WUs are classified into seven groups (Table 6). The optimal number of clusters was determined by the highest silhouette score (see Figures S1 and S2 in the Supplementary Materials). There was a positive correlation between eco-efficiency and the marginal cost of reducing unsorted waste. Higher levels of eco-efficiency are related to higher levels of the cost of reducing unsorted waste. This means that, as municipalities need to increase their expenditure to prevent any additional tons of waste from being unsorted for recycling purposes, this could eventually have a positive impact on their eco-efficiency. Thus, the municipalities can be efficient in terms of the economic and environmental perspectives if they put efforts into collecting and recycling more waste.
Moreover, it is shown that WUs providing services to densely populated municipalities and municipalities attracting a high number of tourists were characterized by high costs of collecting and recycling MSW. Consequently, they might experience a high cost of reducing unsorted waste. However, if these municipalities focused on increasing expenditures to prevent any waste from being unsorted and not recycled, then they could further improve their performance. For instance, our study shows that areas with a mean population density of 1698 inhabitants per km2 showed a mean efficiency score of 0.745. This implies that the potential savings in costs and unsorted waste in highly densely populated municipalities could reach of 25.5%. By contrast, less-densely populated municipalities are characterized by lower MSW costs, but it appears that they do not put any efforts into collecting and recycling unsorted waste. The mean eco-efficiency score was at the level of 0.100, which implies that the potential savings in costs and undesirable outputs in such an area is 90%. However, when population increases, municipalities increase the amount of unsorted waste, which although it increases their costs, would eventually have a positive impact on eco-efficiency. For instance, our study demonstrates that for small areas with population density up to 570 inhabitants/km2, a more efficient management of solid waste services could improve efficiency by 0.355. The last two groups in our sample are characterized by the highest levels of efficiency in less densely populated areas. Thus, this group of municipalities made notable efforts to collect and recycle waste, which had a positive impact on eco-performance. However, there was still room for improvement as they could further reduce their operational costs and unsorted waste by more than 19% on average.
Overall, our results indicate that small municipalities with an average population density of 18 inhabitants per km2 showed low levels of eco-efficiency and marginal cost of reducing unsorted waste. These municipalities should collect more recyclable waste to improve their eco-efficiency. However, there is an increasing trend between population density, eco-efficiency, and cost of reducing unsorted waste. This means that in more densely populated areas collection and recycling services are usually considered better in terms of the quantities of waste collected and recycled. Increasing the operating costs to collect more recyclable waste could eventually lead to higher eco-efficiency and a more sustainable economy. This result is consistent with previous studies [6,9,14]. Our results demonstrated, however, that moderately sized municipalities with 690 inhabitants per km2 on average were more eco-efficient than larger-sized municipalities with a mean population density of 1698 inhabitants per km2. This finding implies that in large municipalities it might be difficult to establish green points to collect recyclable waste materials [17].

3.4. Policy Implications

Overall, the results of the empirical application conducted reveal several interesting policy implications. First, we provide a methodology that allows policy makers to identify which WUs are more or less eco-efficient and quantify the savings that could be achieved by reducing operating costs and the volume of unsorted waste. Moreover, it allows us to quantify the impact of any undesirable outputs in the costs of WUs. Thus, our study demonstrates that municipalities needed to spend an extra 32.28 CLP to prevent one ton of waste from not being sorted for recycling purposes. Our study demonstrates that although the cost of reducing unsorted increases as the service area of municipality increases, this increase could lead to higher levels of cost efficiency, resource efficiency, and enhanced sustainability. Our study also demonstrates that small-sized municipalities were less eco-efficient than moderate and large-sized areas. High levels of eco-inefficiency are reported for large municipalities as well. While small municipalities need to better manage any unsorted waste to become more eco-efficient, large municipalities need to be more efficient in reducing operational costs, reducing unsorted waste, and increasing the collection of recyclable waste. Eco-efficiency is positively related to the presence of tourists and considerable inefficiency still exists among Chilean municipalities overall.
To enhance solid waste recycling, the Chilean Ministry of Environment adopted in 2016 the Law of Extended Producer Responsibility which seeks to reduce the generation of solid waste and promotes its recycling. According to this law, waste producers and importers are responsible for financing the correct management of the waste generated by products that are commercialized in the national market. In particular, seven products (electrical and electronic devices, batteries, tires, containers and packaging, newspapers, batteries, and oils and lubricants) have been defined as priorities, based on their massive consumption, size, and toxicity. Moreover, they are feasible to value and have a comparative experience at an international level [49]. Subsequently, the same ministry implemented a decree, establishing collection and evaluation goals for containers and packaging [50]. The decree provides several incentives to reduce the generation of solid waste and to promote the recycling of five types of MSW, namely liquid, metal, paper and cardboard, plastic, and glass. Moreover, the same national decree establishes that after ten years (i.e., by 2031), the 50%, 30%, and 52% of the paper and cardboard, plastic, and glass, respectively, used in the country must be recycled. It should be noted that current rates of MSW recycling are far away from these goals, and therefore in the coming years notable efforts should be done by citizens, municipalities, and waste producers to achieve the recycling goals defined by the Environment Ministry. In doing so, appropriate economic and financial evaluation tools are needed which consider not only market costs and benefits but also environmental externalities and circularity parameters [51]. In this context, life cycle sustainability assessment (LCSA) has been identified as a useful tool which assessed the impact of a product or process integrating the environmental, economic, and social dimensions of sustainability [52].

4. Conclusions

The management of solid waste services is of outmost importance for a sustainable circular economy. The efficient management of MSW could lead to substantial cost savings and a better quality of service with a positive influence on people’s well-being and environmental sustainability. The evaluation of the eco-efficiency of WUs needs to be carried both from an economic and environmental perspective. Thus, the methodological models used in this study incorporate both desirable outputs, i.e., recycled waste, and undesirable outputs, i.e., unsorted waste collected.
Our study employs stochastic frontier techniques to estimate the eco-efficiency of several WUs managed by municipalities that provide MSW management services in Chile. Furthermore, we estimate the marginal cost of improving the quality of solid waste management services or the cost of reducing unsorted waste. The results can be summarized as follows. It was found that paper and cardboard waste was a significant cost driver in the MSW sector. This was also evident for the unsorted waste collected. Densely populated areas and highly touristic areas increased the operational costs of WUs. As for the level of eco-efficiency, the results indicate that MSW management services in Chile were very eco-inefficient and too much recyclable material is not at present recovered for recycling. On average, eco-efficiency was around 0.5, which means that the municipalities could reduce operational costs and unsorted waste approximately by 50% to generate the same level of output. The average marginal cost of reducing unsorted waste was 32.28 CLP/ton, which means that WUs needed to spend an extra 32.28 in costs to prevent one ton of waste from not being sorted for collection and recycling. Moreover, it was found that higher levels of eco-efficiency were related to higher levels of marginal cost of reducing unsorted waste collected. This means that increased collection of unsorted waste puts more pressure on overall costs. However, dealing with unsorted waste would eventually lead to better quality of service, better performance and a more sustainable sector. Furthermore, it was found that less densely populated areas were less eco-efficient than moderately sized and large municipalities. Moreover, the more touristic the area is, the higher the cost of collecting recyclable and unsorted waste. However, this could lead to higher eco-efficiency in the long-run. Finally, our results show that location did not impact municipalities’ performance.
Our results could be of great importance to policy makers for the following reasons. First, we provide an approach that allows stakeholders to evaluate how eco-efficient MSW management services are. Second, our results allow us to understand how much it costs to deal with any unsorted waste collected. This is of great importance because waste recycling improves resource efficiency and environmental sustainability. Hence, in the framework of circular economy, is fundamental to use tools such as LCSA and eco-efficiency to support decision making which integrates not only costs but also environmental impacts. Moreover, policy makers can now understand the factors that affect MSW management such as population density and the level of tourism in an area. This information is essential for adopting strategies such as mergers or eco-taxes to enhance eco-efficiency in the provision of MSW services. Municipalities need to act to improve economic and environmental performance by adopting several strategies such as the establishment of more recycling drop-off points, the collection of more recyclable waste, and the education of residents about the benefits of recycling. Regarding future research, the authors plan to expand the current dataset (if available) to include more time periods. This could allow for the measurement of productivity analysis and its drivers, efficiency change, and technical change. Moreover, the inclusion of undesirable outputs in the analysis could permit us to quantify their impact on the components of productivity change. This type of analysis could identify how the less eco-efficient waste utilities have improved/worsened their performance compared to the best ones (efficiency change), or how the more eco-efficient waste utilities improved/worsened their performance (technical change). This information could be used by managers to identify best practices that could enhance productivity and sustainability and move towards a greener economy with huge benefits to the environment and society.

Supplementary Materials

The following are available online at https://www.mdpi.com/article/10.3390/su13126607/s1, Figure S1: Silhouette score, Figure S2: Cluster analysis based on cost efficiency and marginal cost of reducing unsorted waste.

Author Contributions

Conceptualization, M.M.-S., A.M.; methodology, A.M.; software, A.M.; validation, M.M.-S.; formal analysis, M.M.-S., A.M.; investigation, A.M.; resources, M.M.-S.; data curation, M.M.-S.; writing—original draft preparation, A.M.; writing—review and editing, M.M.-S., A.M.; visualization, A.M.; supervision, M.M.-S.; project administration, M.M.-S., A.M.; funding acquisition, M.M.-S., A.M. All authors have read and agreed to the published version of the manuscript.

Funding

This research was funded by the Agencia Nacional de Investigación y Desarrollo (ANID) [grant numbers ANID/FONDAP/15110020, FONDECYT 1210077] and the School of Engineering of the Pontificia Universidad Católica de Chile through its Seed Fund.

Institutional Review Board Statement

Not applicable.

Informed Consent Statement

Not applicable.

Data Availability Statement

Data is available in https://mma.gob.cl/tag/sinader/ (accessed on 15 February 2021).

Conflicts of Interest

The authors declare no conflict of interest.

References

  1. Simoes, P.; De Witte, K.; Marques, R.C. Regulatory structures and operational environment in the Portuguese waste sector. Waste Manag. 2010, 30, 1130–1137. [Google Scholar] [CrossRef]
  2. Romano, G.; Ferreira, D.C.; Marques, R.; Carosi, L. Waste services’ performance assessment: The case of Tuscany, Italy. Waste Manag. 2020, 118, 573–584. [Google Scholar] [CrossRef]
  3. Simoes, P.; Cruz, N.F.; Marques, R.C. The performance of private partners in the waste sector. J. Clean. Prod. 2012, 29–30, 214–221. [Google Scholar] [CrossRef]
  4. Halkos, G.; Petrou, K.N. Assessing 28 EU member states’ environmental efficiency in national waste generation with DEA. J. Clean. Prod. 2019, 208, 509–521. [Google Scholar] [CrossRef]
  5. Gastaldi, M.; Lombardi, G.V.; Rapposelli, A.; Romano, G. The Efficiency of Waste Sector in Italy: An Application by Data Envelopment Analysis. Environ. Clim. Technol. 2020, 24, 225–238. [Google Scholar] [CrossRef]
  6. Romano, G.; Molinos-Senante, M. Factors affecting eco-efficiency of municipal waste services in Tuscan municipalities: An empirical investigation of different management models. Waste Manag. 2020, 105, 384–394. [Google Scholar] [CrossRef] [PubMed]
  7. Fan, X.; Yu, B.; Chu, Z.; Chu, X.; Huang, W.-C.; Zhang, L. A stochastic frontier analysis of the efficiency of municipal solid waste collection services in China. Sci. Total Environ. 2020, 743, 140707. [Google Scholar] [CrossRef]
  8. Giannakitsidou, O.; Giannikos, I.; Chondrou, A. Ranking European countries on the basis of their environmental and circular economy performance: A DEA application in MSW. Waste Manag. 2020, 109, 181–191. [Google Scholar] [CrossRef] [PubMed]
  9. Simoes, P.; Marques, R.C. On the economic performance of the waste sector: A literature review. J. Environ. Manag. 2012, 106, 40–47. [Google Scholar] [CrossRef] [PubMed]
  10. Spallini, S.; Viola, D.; Leogrande, D.; Maria, V.A.D. The efficiency of the municipal waste management model in the italian municipalities. Electron. J. Appl. Stat. Anal. 2016, 9, 688–703. [Google Scholar]
  11. Ichinose, D.; Yamamoto, M.; Yoshida, Y. Productive efficiency of public and private solid waste logistics and its implications for waste management policy. IATSS Res. 2013, 36, 98–105. [Google Scholar] [CrossRef] [Green Version]
  12. Schaltegger, S.; Sturm, A. Ecological rationality: Approaches to design of ecology-oriented management instruments. Die Unternehmung 1990, 4, 273–290. [Google Scholar]
  13. Sarra, A.; Mazzocchitti, M.; Rapposelli, A. Evaluating joint environmental and cost performance in municipal waste management systems through data envelopment analysis: Scale effects and policy implications. Ecol. Indic. 2017, 73, 756–771. [Google Scholar] [CrossRef]
  14. Guerrini, A.; Carvalho, P.; Romano, G.; Marques, R.C.; Leardini, C. Assessing efficiency drivers in municipal solid waste collection services through a nonparametric method. J. Clean. Prod. 2017, 147, 431–441. [Google Scholar] [CrossRef]
  15. Exposito, A.; Velasco, F. Municipal solid-waste recycling market and the European 2020 Horizon Strategy: A regional efficiency analysis in Spain. J. Clean. Prod. 2018, 172, 938–948. [Google Scholar] [CrossRef]
  16. Llanquileo-Melgarejo, P.; Molinos-Senante, M. Evaluation of economies of scale in eco-efficiency of municipal waste management: An empirical approach for Chile. Environ. Sci. Pollut. Res. 2021, 28, 28337–28348. [Google Scholar] [CrossRef]
  17. Llanquileo-Melgarejo, P.; Molinos-Senante, M.; Romano, G.; Carosi, L. Evaluation of the Impact of Separative Collection and Recycling of Municipal Solid Waste on Performance: An Empirical Application for Chile. Sustainability 2021, 13, 2022. [Google Scholar] [CrossRef]
  18. Carvalho, P.; Marques, R.C. Economies of size and density in recycling of municipal solid waste in Portugal. Waste Manag. 2014, 34, 12–20. [Google Scholar] [CrossRef]
  19. Swart, J.; Groot, L. Waste management alternatives: (Dis)economies of scale in recovery and decoupling. Resour. Conserv. Recycl. 2015, 94, 43–55. [Google Scholar] [CrossRef]
  20. Foggia, G.D.; Beccarello, M. Improving efficiency in the MSW collection and disposal service combining price cap and yardstick regulation: The Italian case. Waste Manag. 2018, 79, 223–231. [Google Scholar] [CrossRef]
  21. Foggia, G.D.; Beccarello, M. Drivers of municipal solid waste management cost based on cost models inherent to sorted and unsorted waste. Waste Manag. 2020, 114, 202–214. [Google Scholar] [CrossRef] [PubMed]
  22. Jacobsen, R.; Buysse, J.; Gellynck, X. Cost comparison between private and public collection of residual household waste: Multiple case studies in the Flemish region of Belgium. Waste Manag. 2013, 33, 3–11. [Google Scholar] [CrossRef]
  23. Ananda, J. Explaining the environmental efficiency of drinking water and wastewater utilities. Sustain. Prod. Consumpt. 2019, 17, 188–195. [Google Scholar] [CrossRef]
  24. Suárez-Varela, M.; de los Ángeles García-Valiñas, M.; González-Gómez, F.; Picazo-Tadeo, A.J. Ownership and Performance in Water Services Revisited: Does Private Management Really Outperform Public? Water Resour. Manag. 2017, 31, 2355–2373. [Google Scholar] [CrossRef]
  25. Aigner, D.; Lovell, C.K.; Schmidt, P. Formulation and estimation of stochastic frontier production function models. J. Econ. 1977, 6, 21–37. [Google Scholar] [CrossRef]
  26. Meeusen, W.; van den Broeck, J. Efficiency estimation from Cobb–Douglas production functions with composed error. Int. Econ. Rev. 1977, 18, 435–444. [Google Scholar] [CrossRef]
  27. Coelli, T.J.; Prasada Rao, D.S.; O’Donnell, C.J.; Battese, G.E. An Introduction to Efficiency and Productivity Analysis, 2nd ed.; Springer: New York, NY, USA, 2005; pp. 1–341. [Google Scholar]
  28. Saal, D.S.; Parker, D.; Weyman-Jones, T. Determining the contribution of technical change, efficiency change and scale change to productivity growth in the privatized English and Welsh water and sewerage industry: 1985–2000. J. Product. Anal. 2007, 28, 127–139. [Google Scholar] [CrossRef]
  29. Molinos-Senante, M.; Porcher, S.; Maziotis, A. Impact of regulation on English and Welsh water-only companies: An input distance function approach. Environ. Sci. Pollut. Res. 2017, 24, 16994–17005. [Google Scholar] [CrossRef]
  30. Molinos-Senante, M.; Porcher, S.; Maziotis, A. Productivity change and its drivers for the Chilean water companies: A comparison of full private and concessionary companies. J. Clean. Prod. 2018, 183, 908–916. [Google Scholar] [CrossRef]
  31. Jamasb, T.; Orea, L.; Pollitt, M. Estimating the marginal cost of quality improvements: The case of the UK electricity distribution companies. Energy Econ. 2012, 34, 1498–1506. [Google Scholar] [CrossRef] [Green Version]
  32. Mydland, O.; Kumbhakar, S.C.; Lien, G.; Amundsveen, R.; Marit Kvile, H. Economies of scope and scale in the Norwegian electricity industry. Econ. Model. 2019, 88, 39–46. [Google Scholar] [CrossRef]
  33. Maziotis, A.; Molinos-Senante, M.; Villegas, A. Marginal Cost of Reducing Unplanned Water Supply Interruptions: Influence of Water Company Ownership. J. Water Res. Plan. Manag. 2021, 147, 1–9. [Google Scholar] [CrossRef]
  34. Molinos-Senante, M.; Villegas, A.; Maziotis, A. Measuring the marginal costs of reducing water leakage: The case of water and sewerage utilities in Chile. Environ. Sci. Pollut. Res. 2021, 1–11. [Google Scholar] [CrossRef]
  35. Xie, L.; Chen, C.; Yu, Y. Dynamic Assessment of Environmental Efficiency in Chinese Industry: A Multiple DEA Model with a Gini Criterion Approach. Sustainability 2019, 11, 2294. [Google Scholar] [CrossRef] [Green Version]
  36. Sala-Garrido, R.; Mocholi-Arce, M.; Molinos-Senante, M.; Smyrnakis, M.; Maziotis, A. Eco-Efficiency of the English and Welsh Water Companies: A Cross Performance Assessment. Int. J. Environ. Res. Public Health 2021, 18, 2831. [Google Scholar] [CrossRef] [PubMed]
  37. Bojnec, S.; Latruffe, L. Measures of farm business efficiency. Ind. Manag. Data Syst. 2007, 108, 258–270. [Google Scholar] [CrossRef]
  38. Omrani, H.; Shafaat, K.; Emrouznejad, A. An integrated fuzzy clustering cooperative game data envelopment analysis model with application in hospital efficiency. Expert Syst. Appl. 2018, 114, 615–628. [Google Scholar] [CrossRef]
  39. Lo Storto, C. Ownership structure and the technical, cost, and revenue efficiency of Italian airports. Util. Policy 2018, 50, 175–193. [Google Scholar] [CrossRef]
  40. Cinaroglou, S. Integrated k-means clustering with data envelopment analysis of public hospital efficiency. Health Care Manag. Sci. 2020, 23, 325–338. [Google Scholar] [CrossRef]
  41. Tang, T.; Chen, S.; Zhao, M.; Huang, W.; Luo, J. Very large-scale data classification based on K-means clustering and multi-kernel SVM. Soft Comput. 2018, 23, 3793–3801. [Google Scholar] [CrossRef]
  42. Bayaraa, B.; Tarnoczi, T.; Fenyves, V. Measuring performance by integrating k-medoids with DEA: Mongolian case. J. Bus. Econ. Manag. 2019, 20, 1238–1257. [Google Scholar] [CrossRef] [Green Version]
  43. Rousseeuw, P.J. Silhouettes: A graphical aid to the interpretation and validation of cluster analysis. J. Comput. Appl. Math. 1987, 20, 53–65. [Google Scholar] [CrossRef] [Green Version]
  44. Rogge, N.; De Jaeger, S. Measuring and explaining the cost efficiency of municipal solid waste collection and processing services. Omega 2013, 41, 653–664. [Google Scholar] [CrossRef]
  45. Bosch, N.; Pedraja, F.; Suárez-Pandiello, J. Measuring the efficiency of Spanish municipal refuse collection services. Local Gov. Stud. 2000, 26, 71–90. [Google Scholar] [CrossRef] [Green Version]
  46. García-Sánchez, I.M. The performance of Spanish solid waste collection. Waste Manag. Resour. 2008, 26, 327–336. [Google Scholar] [CrossRef]
  47. Marques, R.C.; Simoes, P. Incentive regulation and performance measurement of the Portuguese solid waste management services. Waste Manag. Resour. 2009, 27, 188–196. [Google Scholar] [CrossRef]
  48. Agovino, M.; Matricano, D.; Garofalo, A. Waste management and competitiveness of firms in Europe: A stochastic frontier approach. Waste Manag. 2020, 102, 528–540. [Google Scholar] [CrossRef]
  49. BCNC (Biblioteca del Congreso Nacional de Chile). Law 20920 Establishes Framework for Waste Management, Extended Responsibility of the Producer and Promoting Recycling, 2016. Available online: https://www.bcn.cl/leychile/navegar?idNorma=1090894 (accessed on 15 February 2021).
  50. BCNC (Biblioteca del Congreso Nacional de Chile). Decree 12 Establishes Collection and Valuation Goals and Other Associated Obligations of Containers and Packaging, 2020. Available online: https://www.bcn.cl/leychile/navegar?idNorma=1157019 (accessed on 15 February 2021).
  51. Medina-Salgado, M.S.; Garcia-Muiña, F.E.; Cucchi, M.; Settembre-Blundo, D. Adaptive Life Cycle Costing (LCC) Modeling and Applying to Italy Ceramic Tile Manufacturing Sector: Its Implication of Open Innovation. J. Open Innov. Technol. Mark. Complex. 2021, 7, 101. [Google Scholar] [CrossRef]
  52. Alejandrino, C.; Mercante, I.; Bovea, M.D. Life cycle sustainability assessment: Lessons learned from case studies. Environ. Impact Assess. Rev. 2021, 87, 106517. [Google Scholar] [CrossRef]
Figure 1. Histogram of the eco-efficiency scores of Chilean waste utilities in the provision of municipal solid waste services.
Sustainability 13 06607 g001
Figure 2. Histogram of marginal costs of reducing unsorted waste (CLP/ton) of Chilean waste utilities evaluated.
Sustainability 13 06607 g002
Table 1. Descriptive statistics.
VariablesUnit of
Measurement
MeanStandard DeviationMinimumMaximum
Total costsCLP/year *1,173,0682,051,9709814,765,504
Paper & cardboard recycledTons/year513890.00016023
Organic waste recycledTons/year304345,0030.0001775,267
Usorted wasteTons/year29,25561,907129.00778,893
Population densityInhabitants/km21002.202961.000.1118,386.00
Tourism indexindicator0.050.1070.001.00
* On May 19th, 1 US$     716 CLP and 1 €   870 CLP.
Table 2. Estimates of the cost frontier.
VariablesCoeff.St. ErrorT-Statp-Value
Constant14.4091.20211.9890.000
Paper0.1490.0891.6740.100
Other organic waste0.0040.0770.0500.960
Unsorted waste−0.8050.2163.7220.000
Paper20.0060.0080.7300.465
Other organic waste2−0.0030.006−0.4330.665
Unsorted waste20.1520.0226.8830.000
Paper*other organic waste−0.0010.001−0.6280.530
Paper*unsorted waste−0.0130.008−1.6230.105
Other organic waste*unsorted waste−0.0020.007−0.2310.818
Population density0.0460.0281.6710.095
Tourism index1.4420.5412.6640.008
θ 0.9390.06913.6380.000
σ v 2 0.3660.0389.6920.000
Log-likelihood−403.89
Dependent variable is total cost. Bold indicates that coefficients are statistically significant at a 5% significance level. Bold italic indicates that coefficients are statistically significant at a 10% significance level.
Table 3. Summary statistics of eco-efficiency assessment of waste utilities and marginal costs of reducing unsorted waste.
Unit of
Measurement
AverageMinimumMaximumStd. Dev.
Eco-efficiency scoreIndex0.4880.0000.9210.243
Marginal cost of reducing
unsorted waste
CLP/ton32.280.008242.1025.46
Table 4. Eco-efficiency scores of waste utilities and marginal costs of reducing unsorted waste by Chilean region.
RegionLocationNumber of Waste Utilities (Municipalities)Average
Eco-Efficiency Score
Average Marginal Cost of
Reducing Unsorted Waste (CLP/ton)
Population Density (inh/km2)Tourism Index
AraucaníaSouth310.54639.46634.8190.031
Bío-BíoSouth230.59838.437118.6890.031
Los LagosSouth280.40224.07514.8890.040
Los RíosSouth120.51434.03344.4940.063
Magallanes & Antártica ChilenaSouth40.70040.1876.7810.035
ÑubleSouth210.42029.29311790.026
AntofagastaNorth70.27642.08784.6520.043
Arica & ParinacotaNorth20.40019.0493.8890.029
AtacamaNorth70.46728.02123.0890.026
TarapacáNorth50.58236.39214.5220.036
CoquimboCentral120.34220.64738.2550.063
Libertador General
Bernardo Ohiggins
Central300.48828.05177.8510.027
MauleCentral290.51130.84262.0800.020
Metropolitana de
Santiago
Central490.54538.1265667.40.079
ValparaísoCentral380.50333.586237.9130.053
Table 5. Influence of population density and the tourism index on eco-efficiency and marginal costs of reducing unsorted waste.
Environmental VariableNumber of
Municipalities
Eco-Efficiency ScoreMarginal Cost of Reducing
Unsorted Waste (CLP/ton)
Population density (inhabitants/km2)
<4480.30622.977
4–481490.50931.960
48–11.000910.54737.092
>11.000100.50537.761
Tourism index (%)
<0.10480.37221.686
0.10–0.581490.50731.591
0.59–0.86910.51235.511
>0.87100.54163.835
Table 6. Cluster analysis based on eco-efficiency and marginal costs of reducing unsorted waste.
ClustersNumber of MunicipalitiesEco-Efficiency ScoreMarginal Cost of Reducing Unsorted Waste (CLP/ton)Average Total Costs
(CLP/year)
Population Density
(Inhabitant/km2
Tourism Index (%)
1580.1004.85165,478180.023
2480.35517.223350,3305700.028
3790.53627.957899,38715830.037
4630.66542.0301,873,34211910.059
5360.74560.0222,551,70816980.075
6130.81196.1903,630,5396900.162
710.921242.103830,0363.410.032
Publisher’s Note: MDPI stays neutral with regard to jurisdictional claims in published maps and institutional affiliations.

