Article

Environmental and Stress Analysis of Wild Plant Habitat in River Nile Region of Dakahlia Governorate on Basis of Geospatial Techniques

1
Botany Department, Faculty of Science, Mansoura University, Mansoura 35516, Egypt
2
Environmental Studies Department, National Authority for Remote Sensing and Space Sciences (NARSS), Cairo 11769, Egypt
3
Botany Department, Faculty of Science, Tanta University, Tanta 31527, Egypt
4
Department of Biology, College of Sciences, Taif University, P.O. Box 11099, Taif 21944, Saudi Arabia
5
Department of Biotechnology, College of Sciences, Taif University, P.O. Box 11099, Taif 21944, Saudi Arabia
*
Authors to whom correspondence should be addressed.
Sustainability 2021, 13(11), 6377; https://doi.org/10.3390/su13116377
Submission received: 26 April 2021 / Revised: 24 May 2021 / Accepted: 24 May 2021 / Published: 3 June 2021

Abstract

:
Spatiotemporal environmental changes lead to disturbances in wild plant habitats, particularly in regions characterized by changeable land use and cover. The present study aims to characterize wild plant habitats in the River Nile region of Dakahlia Governorate using a multidisciplinary approach, incorporating remote sensing, GIS and sampling analyses. Twenty-four stands representing the wild plant habitats in the River Nile region were geographically identified, sampled and analyzed. Water and soil samples were investigated for physical and chemical characteristics. Two calibrated multispectral Landsat images dated 1999 and 2019 were processed to produce LULC, NDSI, NDMI and NDSI to characterize wild plan habitats. The floristic composition showed the presence of 64 species belonging to 53 genera and 28 families. Ecologically, the recorded plant species in the present work can be classified into four main categories, which are separated into three communities according to the TWINSPAN classification. Results showed that the annual loss of agricultural lands (3.98 km2) is closely relevant to the annual expansion of urban areas (4.24 km2). Although the uncontrolled urban sprawl caused loss of agricultural lands, it leads to the expansion of wild plant habitats, represented mainly by the sparse class and partially by the moderately dense class as obtained from NDVI. The increase in mean values of the moisture (NDMI) from 0.034 in 1999 to 0.64 in 2019 may have arisen from the increase in total areas of wild plant habitats during the investigated period (1999–2019). This might increase the suitability of conditions for wild habitats which induces the proliferation of natural plants.

1. Introduction

Native plants are very distinctive to each country, taking part in their identities and culture, making them precious resources that need to be taken care of and protected. Native plants can be considered food sources, shelter, nesting sites for wildlife such as birds, mammals, insects, aquatic life and, ultimately, people [1,2]. Continuous destruction to the wild habitats could result in the invasion of invasive plant species that alter the ecosystem and cause loss of the bio-diversity, along with the encroachment of the urban settlements over the wild habitats that causes changes in soil characters in river banks, causing complete destruction to the wild habitat and even loss of some endemic/native wild species [3]. Egypt Nile delta is considered one of the most important areas for plant diversity, as it contains about 28.8% of the threatened plants of North Africa. These are mostly included in the River Nile branches [4].
Humans have influenced the natural flora and vegetation of Egypt from prehistoric times, chiefly in a destructive manner. By draining marshes and lakes, the marsh and aquatic communities have been reduced. New habitats have been provided by agriculture and by the more or less permanent occupation of sites for habitation. Therefore, the Nile Delta region supports many types of habitat, some of which are natural and the others are human-made [5,6]. The main natural habitats found in the north of the delta are salt marshes, coastal dunes and brackish shallow lakes. The habitats created by humans include irrigation and drainage canals, railways, motor roads, railway yards, demolished houses, abandoned fields, refuse areas and graveyards [7,8]. Unsurprisingly, The vast majority of priority reclaimable land, around 61%, is bordering the delta and valley regions due to it containing loamy fertile soil that can be used for successful cultivation [6,9].
Studying the change in native habitats is a largely important endeavor that documents the depleting native flora and habitats of urban cities and areas surrounding them. These studies can now be automated using digital image processing on multispectral images without the use of manual labor [10]. Integrating Geographical Information System (GIS) and Remote Sensing Technology (RST) have become incredibly useful tools for spatial distribution studies for environmental vulnerability as well variable acquisition [11,12]. Normalized Difference Vegetation Index (NDVI) has been shown to be capable of producing accurate high correlation of parameters associated with plant density, chlorophyll content [13], crop condition [14], leaf area index [15], green leaf biomass [16] and plant health [12,17]. Large-scale vegetation tracing using advanced very-high-resolution radiometer (AVHRR) data has been demonstrated to be possible and effective by Tucker, Gatlin [18] over the Nile Delta indicating that the use of NDVI as a general indicator of growth and vegetation coverage can be effective. However, NDVI has its limitations as the use of a single image sometimes renders the user unable to distinguish between temporary healthy, fallow fields and barren fields [19] as well as between immature crops and low-density coverage.
The objective of this study is to test and develop a field survey and to explore new methods for providing current and accurate information on the location and under-threat wild plant habitats in the Nile Delta, River Nile Damietta branch region. The presence and vigorousity of vegetation were determined by temporal patterns of NDVI derived from a set of geometrically registered and radio-metrically calibrated TM and OLI Landsat images dating from 1999 to 2019. The change in the NDVI was detected according to two factors that affected the habitat in the Delta; soil problems such as soil salinity NDSI and waterlogging NDMI.

2. Materials and Methods

2.1. Study Area

Cairo is where the Nile Delta starts continuing down to the northwest for 20 km before splitting into 2 branches, Damietta and Rosetta branch (239 and 242 km in length). The Damietta Branch crosses by 5 state Governorates, El-Qalyubiya, El-Gharbia, El-Menofyia, El-Dakahlia and Damietta. El-Dakahlia Governorate is located downstream of the Damietta branch of the River Nile located between longitude 31°06′ E to 31°50′ E and latitude 30°10′12′′ N to 31°31′48′′ N as shown in Figure 1, the northeast Nile Delta region in Egypt [20,21]. There are many water sources in the study area such as rainfall, River Nile (Damietta branch), Mediterranean Sea, northern Lake Manzala and underground water. Furthermore, the agricultural sector in El-Dakahlia Governorate depends mainly on the water from the Nile of the Damietta branch and partly on winter rainfall. The different activities in each site are illustrated in Supplementary Materials Table S1.
The northern part of Egypt is considered arid to semi-arid due to the low rate of precipitation to evaporation as is stated in the UNESCO United Nations Educational [22] map of the world distribution of the arid. El-Dakahlia Governorate lies in the Deltaic Mediterranean coast which is considered part of the arid or semi-arid climate belt according to Ayyad and Floc’h [23] as it experiences annual rainfall, a short dry period, mild winters and warm summers.

2.2. Vegetation Analysis

Twenty-four stands were randomly chosen along the River Nile, Damietta branch (Dakahlia Governorate) at spring season 2019. Each stand was analyzed for all the plant species recorded within 5 plots 25 m2 each and the species frequency or abundance was estimated according to Mueller Dombois and Ellenberg [24] and Westhoff and Van der Maarel [25] (frequency, IV = 100). All the plants were identified, and their taxonomic nomenclature, as well as their chorotype, was completed according to Täckholm [26] and Boulos [27,28,29] and placed in a scheme according to Raunkięr [30].

2.3. Analytical Methods

2.3.1. Soil Analysis

Geo-referenced sediment samples were collected from 24 stands along River Nile, Damietta branch (Table S1). The collection of composite sediment samples from each stand was carried out using polyethylene bags that were then brought back to the lab. All samples were air-dried at room temperature and filtered using 2 mm sieves for the removal of coarse materials and debris before further analyses could be carried out. Hilgard Pan-Box boxes were used for the estimation of water-holding capacity, sulphate was estimated gravimetrically using barium chloride solution and organic carbon was determined using the Walkley and Black rapid titration method, and soil particle size was determined by using the hydrometer method [31]. The calcium carbonate was determined by titration against 1N NaOH and chloride was estimated by titration method using N/35.5 silver nitrate [32]. Water suspensions were created to measure the electrical conductivity (EC) and soil pH according to Jackson [32]. Carbonates and bicarbonates were determined by titration using 0.1 N HCl [33]. The direct stannous chloride method was used to determine the total dissolved phosphorus [34], and the total nitrogen was measured according to Allen et al. [35] using the micro-Kjeldahl method. Na+ and K+ levels were estimated using flame photometry (PHF 80B Biologie Spectrophotometer), while Ca2+ and Mg2+ were determined using an atomic absorption spectrometer (A Perkin-Elmer, Model 2380, East Norwalk, CT, USA).

2.3.2. Water Samples

Water samples were collected and various tests were conducted on the same 24 stands (Table S1). The temperature dissolved oxygen, pH and electric conductivity of the water were tested in the field using a DO meter (Lutron YK-22 DO meter), pH-meter (Model Lutron YK-2001, pH meter) and an EC-meter (Thermo, Orion 150 A+ advanced conductivity) respectively. Collected water samples were taken to the lab, filtered using CF/C glass fiber filters before being stored in the dark at 4 °C. The filtered samples were tested for chemical oxygen demand (COD) and Biological oxygen demand (BOD) according to the methods described by APHA [34,36]. Calcium carbonate, organic carbon anions and cations were determined according to the methods previously applied in the sediment analysis.

2.4. Data Analysis

Community Analysis Package program was used to perform cluster analysis of the stand data as done by Hilland Šmilauer [37] and the Canonical Correspondence Analysis (CCA) and the ordination of stands (Principal Component Analysis, PCA) were done using the MVSP Program version 3.2 [38]. One-way ANOVA was done on the water and sediment variables before the mean values were parsed by Duncan’s test at 0.05 probability level, using COSTAT 6.3 program.

2.5. Spectral Analysis

2.5.1. Satellite Images Acquisition and Pre-Processing

Initially, two multispectral Landsat imageries (TM and OLI 8) on the 6th of March 1999 and 19th of March 2019 were freely downloaded for Dakahlia Governorate. The data type is level 1, which provides systematic radiometric and geometric accuracy, derived from data collected by the sensor and spacecraft. The study area is located in two scenes; 176-38 and 176-39. Radiometric calibration and atmospheric correction were the basic preprocessing steps followed in correcting Landsat data, which was collected together to create a mosaic for the whole area, then cropped using shape file of the governorate administrative boundary to resize the River Nile area of the Governorate.

2.5.2. Image Processing

Image processing is applied to change and alert the original raw data to bring out visual details [39]. Multi-temporal calibrated Landsat images were processed to produce land use/cover (LULC) maps and three spectral indices based on empirical equations identified in ENVI 5.1 (Band Math). LULC and indices maps were assessed at two years; 1999 and 2019 to monitor environmental changes in the River Nile region. The maximum likelihood classifier (MLC) was applied to produce LULC maps since the field validation visits were elaborated to confirm the accuracy of classification. The investigated spectral indices include normalized difference vegetation index (NDVI), normalized difference salinity index (NDSI) and normalized difference moisture index (NDMI). The calculation formulas for spectral indices and their class ranges are presented in Table S2 [39]. The average wavelengths of investigated spectral bands are 0.6546, 0.8646 and 1.6090 for Red, NIR and SWIR, respectively.

3. Results and Discussion

3.1. Floristic Composition

A total of 64 species (28 annual, one biennial and 35 perennial) constituted the floristic composition, belonging to 53 genera and 28 families (Table S3). The three most species-rich families are Poaceae, Asteraceae, Amaranthaceae and Cyperaceae (11, 9, 6 and 5 spp., respectively). They constituted 48.44% of the recorded species, and represented the majority of the flora in the study area, while the two (Chenopodiaceae and Convolvulaceae) families shared 6.25% of the species and 18 families were monospecific they represent the most common Mediterranean North African flora [40,41]. The plants in this study, Asteraceae and Poaceae, are the largest most widespread flowering plant families with the former being the largest in the world and the latter being the fifth largest after Asteraceae, Orchidaceae, Fabaceae and Rubiaceae [41,42], but is not the only largest family in the Flora of Egypt [26,28,43]. The largest genera are arranged in the following sequence: Poaceae > Asteraceae > Brassicaceae > Amaranthaceae. In addition, Ceratophllum demersum, Myriophyllum spicatum, Eichhornia crassipes and Persicaria salicifolia have the highest presence value among the perennial recorded species. However, several annual plant species have a wide ecological range of distribution and attained high presence such as Amaranthus viridis, Chenopodium murale, Eclipta prostrata, Portulaca oleracea and Sonchus oleraceus. These floristic structures in the present study were in line with those of Shaltout et al. [44,45] on the plant life in the Nile Delta, and El-Amier et al. [46] on successive changes in the plant life of the Damietta branch. Ecologically, these species can be classified into four major groups (Table S3).

3.2. Vegetation Analysis

Application of TWINSPAN analysis techniques based on the importance value of 64 plant species, recorded in 24 stands, separating three plant communities at the 2nd level of classification (eigenvalue = 0.27) is shown in Figure 2. Each plant community comprises a set of stands that are similar in their vegetation and named after the first dominant species with the highest important values. Notably, fourteen of the recorded species were determined to have a wide ecological range of distribution and occurred in all the identified vegetation groups (Table S4). Community I was dominated by submerged hydrophytes Myriophyllum spicatum, and this community was the smallest one and consequently less diverse and resembled by three stands. Moreover, this community also contained other important associated species with high importance value such as Ceratophllum demersum, Cyperus alopecuroides, Eichnocloa staginia and Persicaria salicifolia (Table 1).
Community II is the largest one (contained 14 stands) and was dominated by Senecio aegyptius, in addition to 52 associated plant species; Melilotus indicus and Malva parviflora were the most important. Moreover, community III was dominated by emergent hydrophyte Eichnocloa staginia and also contained an accompanying 33 plant species such as Chenopodium album, Panicum repens, Phyla nodiflora, Phragmites australis, Urtica urens and Convolvulus arvensis (Table 1). The identified communities in the present study are in harmony with the study of El–Khiary [47] and El-Amier et al. [46].
It is worth mentioning that similarities between different plant communities are obviously detected between communities I and II, and between II and III. Community I was the least diversified among the recognized communities and being characterized by hydrophytes, which could be related to a higher level of dissolved and free oxygen. Zahranand, Willis [21] reported that M. spicatum is found in the River Nile system of Nile Delta associated with C. demersum, C. alopecuroides, E. staginia and P. salicifolia. Community II was the highest diverse one, and is characterized by canal bank habitat, which could be related to salinity and soil fertility (TN and TP). On the other hand, community III is less distinct because it is characterized by mixed communities of aquatic and terrestrial plants. In accordance, the ordination of the plant communities showed that these three communities were slightly overlapped, reflecting more similar vegetation structure and environmental variables. In Egypt’s aquatic ecosystem, Zahranand, Willis [21], Shaltout, Sharaf El–Din [48] and El–Amier, Zahran [46] recognized several plant associations, some of which are comparable to those of the present study.

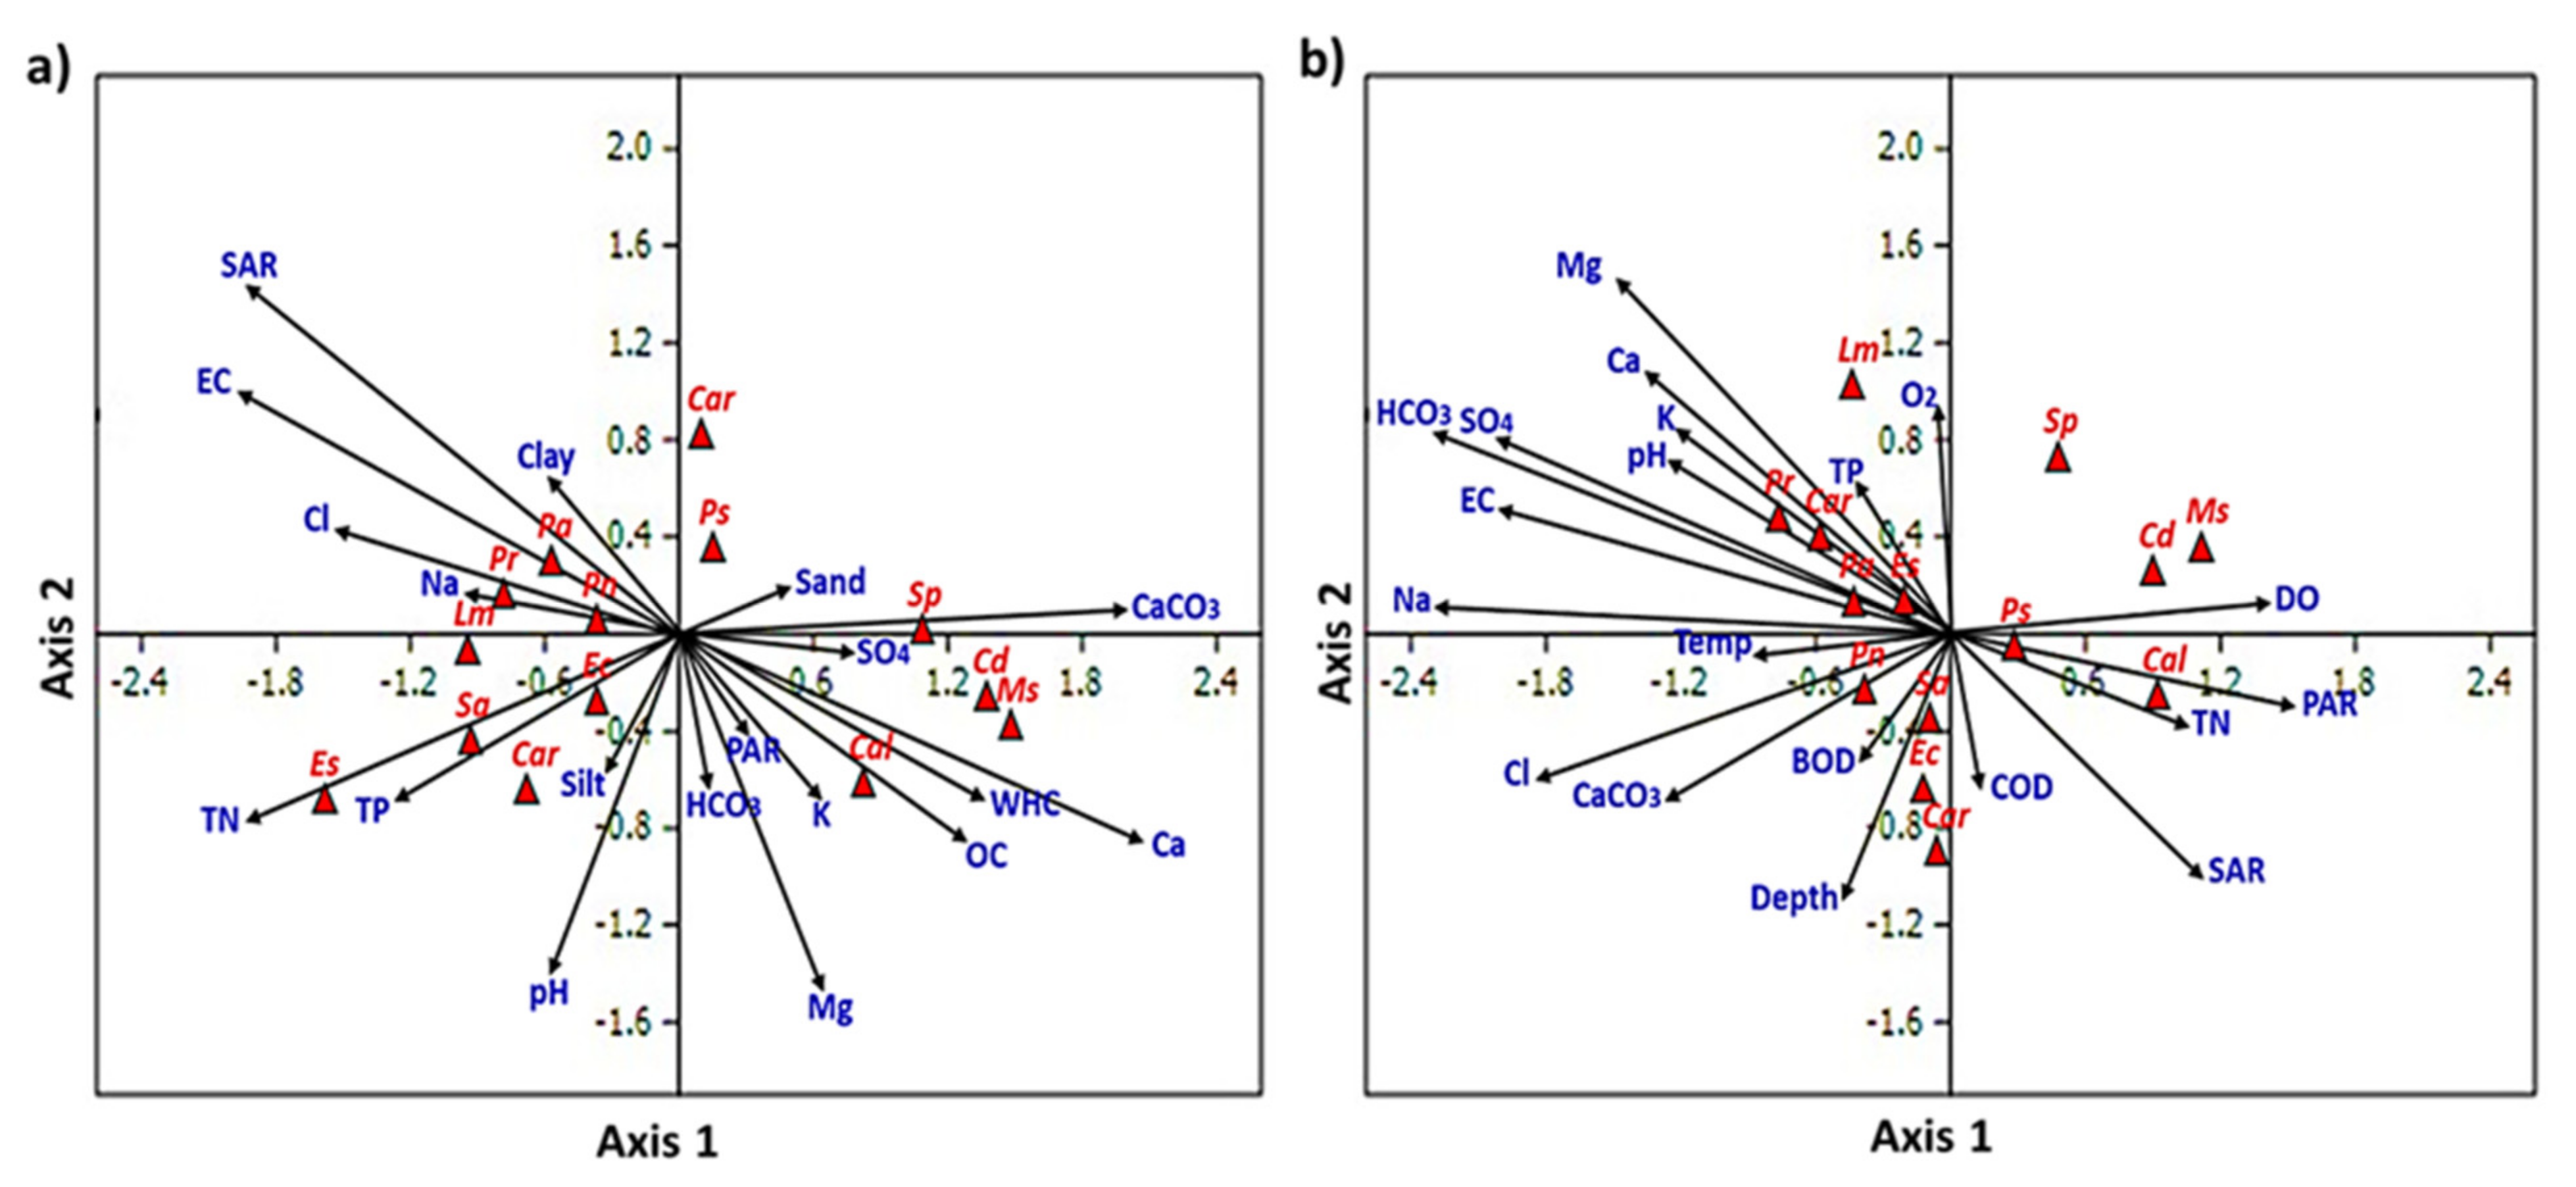
3.3. Vegetation–Environment Relationships

3.3.1. Sediment–Vegetation Relationships

Analysis of the sediments from the three separated plant communities showed non-significant variations in most sediment variables with few exceptions (Table 2). Chloride, nitrogen, electrical conductivity and bicarbonate had significant variations (p < 0.05). All soil sample textures were composed majorly of fractions of sand. However, the sediment components of the emergent hydrophyte Eichnocloa staginia were more saline (0.61 mS cm−1) and contained the highest levels of TP, TN, Na, Cl and SO4, and the differences in other variables were non-significant when compared to other communities (Table 2).
As CCA was applied, several trends between the plant species and the environmental sediment variables emerged, as shown in Figure 3a. Plant species in community I were significantly impacted by the Ca2+ and Mg2+ levels as well as the organic carbon and calcium carbonate showing a close relationship with them. Meanwhile, plants from communities II and III were affected by soil fertility and salinity, showing a positive correlation with TP, EC, TN, SAR, and pH and a negative correlation with organic carbon. Several studies note the importance of these same soil gradients on the vegetation [46,47,48,49].

3.3.2. Water–Vegetation Relationships

There were significant variations (p < 0.05) in the water variables shown in (Table 3) within the identified three plant communities with the main differing variables being depth and salinity. The main component of the soil texture was sand fractions. The water reaction of all communities is mainly slightly alkaline (mean = 7.9). In comparison to other ecosystems, the water of the submerged aquatic Myriophyllum spicatum community and other important species was less saline (0.45 mS cm−1) compared to the other communities. Furthermore, this community showed the highest level of dissolved and free oxygen. In the communities of emergent Eichnocloa staginia and canal bank Senecio aegyptius, the opposite is true. However, the other measured water variables (pH, DO, O2, BOD, COD, sulphate, calcium carbonate, TP, TN, Ca2+) had no significant variation shown compared to the identified communities (Table 3). Another important factor in aquatic environments is the concentration of dissolved oxygen as it is essential for plant respiration for the fauna of aquatic plants and acts as a limiting factor [50]. The largest effects that alter this factor are usually associated with human activity and pollution as it affects the clarity, water chemistry and temperature which results in changes in species in the ocean alongside eutrophication which affects aquatic flora [51].
A CCA ordination biplot was used to study the effect of water variables on plant species. As shown in Figure 3b, three communities were separated from TWINSPAN and the examined water variables. The highest significant correlations with the first and second axes were exhibited by the levels of dissolved oxygen, anions and cations as well as the free oxygen which shows that these variables were the most effective. The plant species of community I exhibit a close relationship with dissolved oxygen and TN. However, community II was negatively correlated with depth, chloride, carbonate calcium and BOD. Community III showed a positive correlation with salinity, TP and level of free oxygen (Figure 3b). Water quality has been shown to be significantly correlated with behavior and distribution of many aquatic plants [52,53]. Human practices through waste, industry and agriculture create large levels of pollution that may impact aquatic flora and macrophytes.

3.4. Spectral Analysis

3.4.1. LULC Analysis

On basis of LULC maps of the River Nile Region, there are four classes: bare land, vegetation, urban and water. The results demonstrated the following: vegetation class is exhibited by areas of 791.16 km2 (86.6 %) and 711.53 km2 (77.87%), urban class is represented by 103.73 km2 (11.4%) and 188.45 km2 (20.62%), water class is mainly represented by 10.69 km2 (1.2%) and 12.48 km2 (1.37%), and bare land class occupied areas of 8.13 km2 (0.9%) and 1.25 km2 (0.14%) with annual change by −3.98, 4.24, 0.09 and −0.34 km2 in 1999 and 2019, respectively (Figure 4a,b). The study area is a part of the Nile Delta region which suffers from urban sprawl problems on account of the agricultural lands. Therefore, the annual loss of agricultural lands (3.98km2) is closely relevant to the annual expansion of urban areas (4.24 km2). The present findings coincide with [54] in the Nile Delta region. On the other hand, the bare lands lost 0.34 km2 due to the annual expansion of urban areas while non-significant change was observed in the water bodies (0.09 km2) as shown in Figure 4c. The uncontrolled urban expansion is one of the main driving forces leading to the loss of land resources and damaging ecosystems [55].

3.4.2. Spectral Indices Assessment

Detection of NDVI Changes

Focusing on the study area around the Nile River, a clear decline is noted in the dense vegetation of the Nile River zone by 9.35 km2 annually, as it was 304.80 km2 in 1999 and then decreased to 117.89 km2 in 2019 (Figure 5). Likewise, the moderate vegetation class showed an increase of 8.15 km2 per year (the highest increase among the four NDVI vegetation classes). It increased from 369.76 km2 in 1999 to 532.85 km2 in 2019. Sparse vegetation class was represented by scattered patches, which showed increases as they got closer to the Nile River branch. Sparse vegetation class (including the wild plants) showed an annual rate of increase by 1.5 km2 from 183.44 km2 in 1999 to 213.39 km2 in 2019. Finally, no vegetation class showed a slight decrease with 0.31 km2 annually where the total area occupied in 1999 was 147.17 km2 that decreased to 141.01 km2 in 2019 (Figure 5). Despite the loss in agricultural lands as prescribed in the LULC section, represented by dense vegetation, there are increases in both sparse and moderately dense vegetated areas. These areas are extensively associated with the newly developed urban areas. In other words, although the uncontrolled urban sprawl caused loss of agricultural lands, it leads to expansion on wild plant habitats, represented mainly by sparse class and partially by moderately dense class [56,57] as shown in Figure 7. The NDVI values show changes according to the years. The application of spectral indices provide data helping the decision-makers in the conservation of the remaining natural sustainable resources of the aquatic ecosystems.

Detection of NDMI and NDSI Changes

A similar pattern of results was obtained in NDMI where the minimum value was −1, reaching 0.91 with a mean of 0.034 in 1999. Then, a clear increase was recorded in 2019, as values ranged from −0.35 to 0.64 with a mean value of 0.33 (Figure 6). The increase in mean values of the moisture may arise from the increase in total areas of wild plant habitats during the investigated period (1999–2019). This might increase the suitability of conditions for wild habitats which induces the proliferation of natural plants. Disturbance arisen from the changes in land surface characteristics such as LULC, vegetation cover and moisture leads to the environmental suitability for spread out of natural habitats. This matches with the findings of El–Zeiny, El–Hefni [58]. On the other hand, the NDSI distribution map in 1999 showed noticeable variation, as the lowest value was −1, while the highest value was 0.44 with a mean of −0.54 (Figure 6). Although a noticeable decline was recorded in 2019 in the levels of NDSI ranging from −0.08 to 0.14, the mean level does not show a significant change (−0.52). This index is associated with the land affected by salinization problems which are high in agriculturally degraded land and in water as well as urban areas (Figure 7). The changeable LULC caused increases in urban areas and decreases in both bare lands and vegetation classes. This complex change might be the reason behind the stability of the mean values and the changeable minimum and maximum values [57].

4. Conclusions

Tracking the changes in usage and displaying the results are important in landscape planning and area usage planning. In this study, we aimed to evaluate wild plant habitats that belonged to the sparse vegetation class using remote sensing and GIS. Moreover, the recorded vegetation mostly belonged to the canal bank, which flourishes with the increase of soil fertility and oxygen levels. This reinforces the strong negative correlation between the increase in the NDVI and the NDSI in the Rive Nile of Damietta branch and it is not conditionally dependent on the soil moisture levels (NDMI). After the assessment of the previous indices, NDVI showed a clear increase in the sparse vegetation class total consumed surface area from 183.4 in the year 1999 to 213.40 in the year 2019. Likewise, there was an increase in the salinity index mean from −0.54 to −0.52 and otherwise, the moisture index declined from 0.34 to 0.33. Finally, several polluted bodies of water drain into the Nile and its branches within Egypt, i.e., sewages, waterways, industries and agriculture, negatively affecting aquatic macrophytes and polluting the fresh water of the Nile. The use of remote sensing and GIS for the analysis and management of wild plant habitats in regional areas (e.g., River Nile of Dakahlia) is described as an effective and powerful tool.

Supplementary Materials

The following are available online at https://www.mdpi.com/article/10.3390/su13116377/s1, Table S1: Study Area, Table S2: Image Processing, Table S3: Floristic Composition.

Author Contributions

Conceptualization, Y.A.E.-A., E.-S.F.E.-H., and A.E.-Z.; methodology, Y.A.E.-A., A.E.-Z. and S.A.E.; validation, Y.A.E.-A., E.-S.F.E.-H., A.E., M.A.E.-E., A.E.-Z., A.N., H.D. and A.A.-B.; formal analysis, Y.A.E.-A., A.E.-Z. and S.A.E.; investigation, S.A.E.; resources, A.N., H.D. and A.A.-B.; data curation, S.A.E.; writing—original draft preparation, Y.A.E.-A., S.A.E., and A.E.-Z.; writing—review and editing, Y.A.E.-A., A.E., M.A.E.-E., E.-S.F.E.-H., A.E-.Z., A.N., H.D. and A.A.-B.; visualization, Y.A.E.-A., A.E., M.A.E.-E., and A.E.-Z.; project administration, Y.A.E.-A., A.E., and A.E.-Z.; funding acquisition, A.N., H.D. and A.A.-B. All authors have read and agreed to the published version of the manuscript.

Funding

The current work was funded by Taif University Researchers Supporting Project number (TURSP—2020/203), Taif University, Taif, Saudi Arabia.

Institutional Review Board Statement

Not applicable.

Informed Consent Statement

Not applicable.

Data Availability Statement

The data presented in this study are available in within the article.

Acknowledgments

The authors would like to thank the Deanship of Scientific Research at Taif University for funding this work through Taif University Researchers Supporting Project number (TURSP—2020/203), Taif University, Taif, Saudi Arabia. Thanks are extended to the USGS for providing Landsat images to this study.

Conflicts of Interest

The authors declare no conflict of interest.

References

  1. Oro, D.; Genovart, M.; Tavecchia, G.; Fowler, M.S.; Martínez-Abraín, A. Ecological and evolutionary implications of food subsidies from humans. Ecol. Lett. 2013, 16, 1501–1514. [Google Scholar] [CrossRef] [PubMed]
  2. Snep, R.P.H.; Clergeau, P. Biodiversity in cities, reconnecting humans with nature. In Sustainable Built Environments; Springer: Berlin/Heidelberg, Germany, 2020; pp. 251–274. [Google Scholar]
  3. Hobbs, R.J.; Mooney, H.A. Invasive species in a changing world: The interactions between global change and invasives. In Invasive Alien Species: A New Synthesis; Scope-Scientific Committee on Problems of the Environment International Council of Scientific Unions; Island Press: Washington, DC, USA, 2005; p. 310. [Google Scholar]
  4. Kassem, H.S.; Bello, A.R.S.; Alotaibi, B.M.; Aldosri, F.O.; Straquadine, G.S. Climate change adaptation in the delta Nile Region of Egypt: Implications for agricultural extension. Sustainability 2019, 11, 685. [Google Scholar] [CrossRef] [Green Version]
  5. Shaltout, K.H.; El-din, A.S. Habitat types and plant communities along a transect in the Nile Delta region. Feddes Repert. 1988, 99, 153–162. [Google Scholar] [CrossRef]
  6. Zahran, M.A.; El-Amier, Y.A. Non-traditional fodders from the halophytic vegetation of the deltaic Mediterranean coastal desert Egypt. J. Biol. Sci. 2013, 13, 226–233. [Google Scholar] [CrossRef] [Green Version]
  7. El-Amier, Y.A.; El-Halawany, E.F.; Abdullah, T.J. Composition and diversity of plant communities in sand formations along the northern coast of the Nile Delta in Egypt. Res. J. Pharm. Biol. Chem. Sci. 2014, 5, 826–847. [Google Scholar]
  8. El-Amier, Y.A.; El-Hayyany, L.Y. Floristic composition and species diversity of plant communities associated with genus Atriplex in Nile Delta coast. Egypt. Asian J. Conserv. Biol. 2020, 9, 11–24. [Google Scholar]
  9. Biswas, A.K. Land resources for sustainable agricultural development in Egypt. Ambio 1993, 22, 556–560. [Google Scholar]
  10. Olorunfemi, I.E.; Fasinmirin, J.T.; Olufayo, A.A.; Komolafe, A.A. GIS and remote sensing-based analysis of the impacts of land use/land cover change (LULCC) on the environmental sustainability of Ekiti State, southwestern Nigeria. Environ. Dev. Sustain. 2020, 22, 661–692. [Google Scholar] [CrossRef]
  11. Bing, P.; Hui-Min, X.; Tao, H.; Asundi, A. Measurement of coefficient of thermal expansion of films using digital image correlation method. Polym. Test. 2009, 28, 75–83. [Google Scholar] [CrossRef]
  12. Benzer, N. Using the geographical information system and remote sensing techniques for soil erosion assessment. Pol. J. Environ. Stud. 2010, 19, 881–886. [Google Scholar]
  13. Chappelle, E.W.; Kim, M.S.; McMurtrey, J.E., III. Ratio analysis of reflectance spectra (RARS): An algorithm for the remote estimation of the concentrations of chlorophyll a, chlorophyll b, and carotenoids in soybean leaves. Remote Sens. Environ. 1992, 39, 239–247. [Google Scholar] [CrossRef]
  14. Wieg, C.L.; Maas, S.J.; Aase, J.K.; Hatfield, J.L.; Pinter, P.J., Jr.; Jackson, R.D.; Kanemasu, E.T.; Lapitan, R.L. Multi-site analyses of spectral-biophysical data for wheat. Remote Sens. Environ. 1992, 42, 1–21. [Google Scholar]
  15. Wiegand, C.L.; Richardson, A.J.; Kanemasu, E.T. Leaf Area Index Estimates for Wheat from LANDSAT and Their Implications for Evapotranspiration and Crop Modeling 1. Agron. J. 1979, 71, 336–342. [Google Scholar] [CrossRef]
  16. Tucker, C.J. Red and photographic infrared linear combinations for monitoring vegetation. Remote Sens. Environ. 1979, 8, 127–150. [Google Scholar] [CrossRef] [Green Version]
  17. Ormsby, J.P.; Choudhury, B.J.; Owe, M. Vegetation spatial variability and its effect on vegetation indices. Int. J. Remote Sens. 1987, 8, 1301–1306. [Google Scholar] [CrossRef]
  18. Tucker, C.J.; Gatlin, J.A.; Schneider, S.R. Monitoring vegetation in the Nile Delta with NOAA-6 and NOAA-7 AVHRR imagery. Photogramm. Eng. Remote Sens. 1984, 50, 53–61. [Google Scholar]
  19. Wallace, J.F.; Campbell, N.A.; Wheaton, G.A.; McFarlane, D.J. Spectral discrimination and mapping of waterlogged cereal crops in Western Australia. Int. J. Remote Sens. 1993, 14, 2731–2743. [Google Scholar] [CrossRef]
  20. Zahran, M.A.; Willis, A.J. The vedetation of Egypt chapman and Hall. Environ. Conserv. 1992, 20, 377–378. [Google Scholar]
  21. Zahran, M.A.; Willis, A.J. Plant Life in the River Nile in Egypt; Mars Publishing House: Reyadh, Saudi Arabia, 2003. [Google Scholar]
  22. UNESCO United Nations Educational, Scientific and Cultural Organization. Map of the World Distribution of Arid Regions; MAB Technical Notes; UNESCO: Paris, France, 1979. [Google Scholar]
  23. Ayyad, M.G.; Floc’h, L. An Ecological Assessment of Renewable Resources for Rural Agricultural Development in the Western Mediterranean Coastal Region of Egypt Case Study: El Omayed Test-Area; CEPE L. Emberger: Montpellier, France, 1983; p. 127. [Google Scholar]
  24. Mueller Dombois, D.; Ellenberg, H. Aims and Methods of Vegetation Ecology; John Wiley & Sons, Inc.: New York, NY, USA, 1974. [Google Scholar]
  25. Westhoff, V.; van der Maarel, E. Ordination and classification of communities. In Hand Book of Vegetable Science; Springer: Dordrecht, The Netherlands, 1973; Volume 5, pp. 617–737. [Google Scholar]
  26. Täckholm, V. Student’s Flora of Egypt, 2nd ed.; Cairo University Press: Cairo, Egypt, 1974. [Google Scholar]
  27. Boulos, L. Flora of Egypt; Al Hadara Publishing: Cairo, Egypt, 1999; Volume 1. [Google Scholar]
  28. Boulos, L. Flora of Egypt; Al Hadara Publishing: Cairo, Egypt, 2002. [Google Scholar]
  29. Boulos, L. Flora of Egypt; Al Hadara Publishing: Cairo, Egypt, 2005; Volume 4. [Google Scholar]
  30. Raunkięr, C. Plant Life Forms; Clarendon Press: Oxford, UK, 1937. [Google Scholar]
  31. Piper, C.S. Soil and Plant Analysis; Interscience Publishers, Inc.: New York, NY, USA, 1947. [Google Scholar]
  32. Jackson, M.L. Soil Chemical Analysis; Constable and Co. Ltd.: London, UK, 1962. [Google Scholar]
  33. Pierce, W.C.; Haenisch, E.L.; Sawyer, D.T. Quantitative Analysis; Wiley Toppen: Tokyo, Japan, 1958. [Google Scholar]
  34. APHA American Public Health Association. Standard Methods for the Examination of Water and Waste Water, Sewage and Industrial Wastes, 16th ed.; Macmillan Publishing Co.: New York, NY, USA; Washington, DC, USA, 1989. [Google Scholar]
  35. Allen, S.E.; Grimshaw, H.M.; Rowland, A.P. Methods in Plant Ecology, 2nd ed.; Black Well Scientific Publications: Oxford, UK, 1986. [Google Scholar]
  36. APHA American Public Health Association. Standard Methods for the Examination of Water and Waste Water; American Public Health Association: Washington, DC, USA; American Water Work Association: Washington, DC, USA; Water Pollution Control Federation: Washington, DC, USA, 1998. [Google Scholar]
  37. Hill, M.O.; Šmilauer, P. WinTWINS TWINSPAN for Windows version 2005. Available online: http://www.canodraw.com/wintwins.htm (accessed on 15 February 2021).
  38. Ter Braak, C.J. CANOCO-aFORTRAN Program for Canonical Community Ordination by Partial Detrended Correspondence Analysis, Principal. Component Analysis and Redunancy Analysis; Agricultural Mathematics Group: Wageningen, The Netherlands, 1988. [Google Scholar]
  39. Jensen, J.R. Introductory Digital Image Processing: A Remote Sensing Perspective, 2nd ed.; Prentice-Hall Inc.: Upper Saddle River, NJ, USA, 1996. [Google Scholar]
  40. Quezel, P. Analysis of the flora of Mediterranean and Saharan Africa: Phytogeography of Africa. Ann. Mo. Bot. Gard. 1978, 65, 479–534. [Google Scholar] [CrossRef]
  41. International Association for Plant Taxonomy. Systematics, Evolution, and Biogeography of the Compositae; Funk, V.A., Ed.; IAPT: Vienna, Austria, 2009. [Google Scholar]
  42. Stevens, P.F. Angiosperm Phylogeny Website; Missouri Botanical Garden: St. Louis, MO, USA, 2016; Volume 13. [Google Scholar]
  43. El-Amier, Y.A.; Abdul-Kader, O.M. Vegetation and species diversity in the northern sector of Eastern Desert, Egypt. West Afr. J. Appl. Ecol. 2015, 23, 75–95. [Google Scholar]
  44. Shaltout, H.A.; Rose, J.C.; Figueroa, J.P.; Chappell, M.C.; Diz, D.I.; Averill, D.B. Acute AT1-receptor blockade reverses the hemodynamic and baroreflex impairment in adult sheep exposed to antenatal betamethasone. Am. J. Physiol. Heart Circ. Physiol. 2010, 299, H541–H547. [Google Scholar] [CrossRef] [PubMed] [Green Version]
  45. Shaltout, M.; Belmonte, J.A. On the orientation of ancient Egyptian temples:(1) Upper Egypt and Lower Nubia. J. Hist. Astron. 2005, 36, 273–298. [Google Scholar] [CrossRef]
  46. El-Amier, Y.A.; Zahran, M.A.; Al-Mamoori, S.O. Plant Diversity of the Damietta Branch, River Nile, Egypt: An Ecological Insight. Mesop. Environ. J. 2015, 1, 109–129. [Google Scholar]
  47. El-Khiary, A.M. Ecological Studies on the Vegetation of the River Nile (Damietta Branch) in El-Dakahlia and Damietta Provinces; Faculty of Science, Mansoura University: New Damietta, Egypt, 2005. [Google Scholar]
  48. Shaltout, K.H.; El-Din, A.S.; El-Sheikh, M.A. Species richness and phenology of vegetation along irrigation canals and drains in the Nile Delta, Egypt. Vegetatio 1994, 112, 35–43. [Google Scholar] [CrossRef]
  49. Al-Sodany, Y.M. Vegetation Analysis of the Canals, Drains and Lakes of the Northern Part of Nile Delta; Tanta University: Tanta, Egypt, 1998. [Google Scholar]
  50. Klimaszyk, P.; Rzymski, P. Surface Runoff as a Factor Determining Trophic State of Midforest Lake. Pol. J. Environ. Stud. 2011, 20, 1203–1210. [Google Scholar]
  51. Räike, A.; Pietiläinen, O.-P.; Rekolainen, S.; Kauppila, P.; Pitkänen, H.; Niemi, J.; Raateland, A.; Vuorenmaa, J. Trends of phosphorus, nitrogen and chlorophyll a concentrations in Finnish rivers and lakes in 1975–2000. Sci. Total Environ. 2003, 310, 47–59. [Google Scholar] [CrossRef]
  52. Carbiener, R.; Tremolieres, M. The Rhine rift valley ground water-river interactions: Evolution of their susceptibility to pollution. Regul. Rivers Res. Manag. 1990, 5, 375–389. [Google Scholar] [CrossRef]
  53. Romero, M.I.; Onaindia, M. Fullgrown aquatic macrophytes as indicators of river water quality in the northwest Iberian Peninsula. In Annales Botanici Fennici; Finnish Zoological and Botanical Publishing Board: Helsinki, Finland, 1995; pp. 91–99. [Google Scholar]
  54. Elagouz, M.; Abou-Shleel, S.; Belal, A.; El-Mohandes, M. Detection of land use/cover change in Egyptian Nile Delta using remote sensing, Egypt. J. Remote Sens. Space Sci. 2020, 23, 57–62. [Google Scholar]
  55. Khdery, G.; Gad, A.; El-Zeiny, A.M. Spectroscopic Characterization of Plant Cover in El-Fayoum Governorate, Egypt. Egypt. J. Soil Sci. 2020, 60, 397–408. [Google Scholar] [CrossRef]
  56. Gad, A.A.; El-Zeiny, A. Spatial analysis for sustainable development of El Fayoum and Wadi El Natrun desert depressions, Egypt with the aid of remote sensing and GIS. J. Geogr. Environ. Earth Sci. Int. 2016, 8, 1–18. [Google Scholar] [CrossRef]
  57. El-Zeiny, A.M.; Effat, H.A. Environmental analysis of soil characteristics in El-Fayoum Governorate using geomatics approach. Environ. Monit. Assess. 2019, 191, 463. [Google Scholar] [CrossRef] [PubMed]
  58. El-Zeiny, A.; El-Hefni, A.; Sowilem, M. Geospatial techniques for environmental modeling of mosquito breeding habitats at Suez Canal Zone, Egypt. Egypt. J. Remote Sens. Space Sci. 2017, 20, 283–293. [Google Scholar] [CrossRef] [Green Version]
Figure 1. Map of Egypt showing Dakahlia Governorate and location of the studied sites (1–24) along River Nile (Damietta branch).
Sustainability 13 06377 g001
Figure 2. TWINSPAN dendrogram of 24 stands based on the importance value of the species. Indicator species names are abbreviated to the first three letters of both genus and species. Cap bur: Capsella bursa-pastoris, Eic cra: Eichhornia crassipes, Ror pal: Rorippa palustris, Cyp art: Cyperus articulates, Cyn dac: Cynodon dactylon, Phy nod: Phyla nodiflora.
Sustainability 13 06377 g002
Figure 3. Canonical Correspondence Analysis (CCA) ordination biplot of (a) species-sediment variable, and (b) species–water variable. EC: electrical conductivity, OC: organic carbon, SAR: sodium adsorption ratio, PAR: potassium adsorption ratio, WHC: water holding capacity, DO: dissolved oxygen, BOD: biological oxygen demand, COD: chemical oxygen demand, TN: total nitrogen, TP: total phosphorus, Cd: Ceratophllum demersum, Ms: Myriophyllum spicatum, Pa: Phragmites australis, Es: Eichnocloa staginia, Ps: Persicaria salicifolia, Sa: Senecio aegyptius, Ec: Ethulia conyzoides, Pn: Phyla nodiflora, Pr: Panicum repens, Car: Convolvulus arvensis, Cal: Cyperus alopecuroides, Cart: Cyperus articulates, Lm: Lemna minor, Ss: Saccharum spontaneum.
Sustainability 13 06377 g003
Figure 4. Areas in sq. km of LULC classification for River Nile Damietta branch of the study area (a) classification comparison from 1999 to 2019, (b) annual rate of change for each class, and (c) LULC distribution map.
Sustainability 13 06377 g004
Figure 5. Comparison of NDVI values of River Nile, Damietta branch of the study area.
Sustainability 13 06377 g005
Figure 6. Statistics of the spectral and thermal retrieved parameters for River Nile, Damietta branch of the study area.
Sustainability 13 06377 g006
Figure 7. Spatial distribution maps of NDMI and NDSI for River Nile, Damietta branch of the study area.
Sustainability 13 06377 g007
Table 1. Characteristics of the different communities (I-III) from TWINSPAN classification of the studied area.
Comm.Stand No.Total SpeciesHabitatsDominant SpeciesOther Important Species
I 32S-HyMyriophyllum spicatum (11.20 ± 0.26)Ceratophllum demersum (8.29 ± 0.15)
Cyperus alopecuroides (5.89 ± 0.99)
Eichnocloa staginia (5.73 ± 0.89)
Persicaria salicifolia (5.31 ± 0.42)
II1452CBSenecio aegyptius (10.34 ± 0.62)Phragmites australis (8.29 ± 0.15)
Ethulia conyzoides (7.65 ± 0.64)
Phyla nodiflora (6.74 ± 0.65)
Panicum repens (6.23 ± 0.58)
Chenopodium album (6.10 ± 0.50)
III733E-HyEichnocloa staginia (16.07 ± 0.54)Chenopodium album (14.19 ± 0.63)
Panicum repens (13.77 ± 0.81)
Phyla nodiflora (7.07 ± 1.01)
Phragmites australis (4.39 ± 1.10)
Urtica urens (4.39 ± 1.28)
Convolvulus arvensis (4.27 ± 1.05)
S-Hy: submerged hydrophytes, CB: canal bank, E-Hy: emergent hydrophytes.
Table 2. Mean values, standard error (±SE) and ANOVA values of the sediment variables in the vegetation groups (A–C) of the study area. WHC: Water holding capacity, EC: Electrical conductivity, OC: Organic carbon, TP: Total phosphorus, TN: Total nitrogen, SAR: Sodium adsorption ratio, PAR: Potassium adsorption ratio, ns: not significant at p < 0.05. *: Values are significant at p < 0.05.
Sediment VariablesMean (n = 24)TWINSPAN Vegetation GroupsLSD0.05
I (n = 3)II (n = 14)III (n = 7)
Sand (%)77.02 ± 2.2179.79 ± 1.5677.16 ±0.3575.57 ± 0.775.58 ns
Silt (%)16.41 ± 0.1614.64 ± 1.5716.16 ± 0.2217.67 ± 0.684.69 ns
Clay (%)6.56 ± 0.395.57 ± 0.176.68 ± 0.186.76 ± 0.221.8 ns
WHC (%)53.37 ± 1.5056.55 ± 6.3453.14 ± 0.9352.48 ± 1.1015.43 ns
CaCO3 (%)3.33 ± 0.114.69 ± 1.143.45 ± 0.192.50 ± 0.323.07 ns
OC (%)0.95 ± 0.031.23 ± 0.330.94 ± 0.040.84 ± 0.080.78 ns
pH8.09 ± 0.018.18 ± 0.018.10 ± 0.038.03 ± 0.020.31 ns
EC (mS cm−1)0.47 ± 0.750.35 ± 0.750.44 ± 0.180.61 ± 0.230.22 *
Cl (%)0.12 ± 0.010.08 ± 0.010.12 ± 0.010.16 ± 0.010.03 *
SO4 (%)0.23 ± 0.010.26 ± 0.040.21 ± 0.010.26 ± 0.020.15 ns
HCO3 (%)0.12 ± 0.010.10 ± 0.010.13 ± 0.010.12 ± 0.010.04 *
TP (mg/100 g dry soil)3.66 ± 0.192.34 ± 0.333.76 ± 0.164.01 ± 0.341.99 ns
TN (mg/100 g dry soil)0.58 ± 0.110.40 ± 0.030.58 ± 0.010.65 ± 0.030.02 *
Na+ (mg/100 g dry soil)66.97 ± 2.3359.41 ± 9.8565.85 ± 2.6972.45 ± 3.1835.64 ns
K+ (mg/100 g dry soil)22.76 ± 1.7727.02 ± 10.9121.04 ± 1.3124.39 ± 2.1152.81 ns
Ca+ (mg/100 g dry soil)40.14 ± 1.2165.77 ± 14.6737.53 ± 2.1434.40 ± 2.2024.74 ns
Mg+ (mg/100 g dry soil)37.62 ± 1.4648.91 ± 15.2636.75 ± 2.7934.53 ± 3.5635.55 ns
SAR11.74 ± 1.169.28 ± 1.8911.64 ± 0.3012.98 ± 0.284.42 ns
PAR3.50 ± 0.283.61 ± 1.203.24 ± 0.123.96 ± 0.2325.25 ns
LSD0.05: least significant difference after Duncan’s post hoc test at probability level of 0.05.
Table 3. Mean values, standard error (±SE) and ANOVA values of the soil variables in the vegetation groups (A–C) of the study area. Temp.: temperature, EC: Electrical conductivity, DO: dissolved oxygen, BOD: biological oxygen demand, COD: chemical oxygen demand, TN: total nitrogen, TP: total phosphorus, SAR: Sodium adsorption ratio, PAR: Potassium adsorption ratio, ns: not significant at p < 0.05. *: Values are significant at p < 0.05. **: Values are significant at p < 0.01.
Water VariablesMean (n = 24)TWINSPAN Vegetation GroupsLSD0.05
I (n = 3)II (n = 14)III (n = 7)
Depth (cm) 203.65 ± 11.67192.17 ± 8.59210.55 ± 1.37194.76 ± 3.2222.98 *
Temp. (°C)29.55 ± 1.7128.57 ± 0.1429.83 ± 0.1229.42 ± 0.281.64 ns
pH7.90 ± 0.317.94 ± 0.077.89 ± 0.037.90 ± 0.020.24 na
EC (mS cm−1)0.55 ± 0.850.45 ± 0.320.53 ± 0.510.58 ± 0.130.09 *
DO (mg O2/L)10.33 ± 1.8811.07 ± 0.1010.19 ± 0.1110.31 ± 0.401.86 ns
O2 (%)22.63 ± 2.2723.73 ± 0.3721.61 ± 0.2124.20 ± 1.296.10 ns
BOD (mg/L)22.98 ± 3.0420.17 ± 2.1123.17 ± 0.6823.80 ± 1.439.59 ns
COD (mg/L)58.20 ± 10.6953.00 ± 5.526 ± 1.4956.83 ± 3.4421.74 ns
CL (mg/L)991.36 ± 22.05875.65 ± 30.251011.15 ± 6.791001.35 ± 11.77105.16 **
SO4 (mg/L)459.61 ± 33.47390.44 ± 49.95446.25 ± 6.74515.99 ± 18.60146.85 ns
HCO3 (mg/L)651.33 ± 17.76557.56 ± 29.66639.60 ± 5.71714.99 ± 8.5488.92 **
CaCO3 (mg/L)227.89 ± 15.44197.75 ± 13.63235.11 ± 2.42226.38 ± 4.9540.11 ns
TN (mg/L)1.03 ± 0.471.03 ± 0.161.14 ± 0.040.81 ± 0.050.41 ns
TP (mg/L) 1.17 ± 0.261.17 ± 0.151.19 ± 0.021.14 ± 0.040.38 ns
Na+ (mg/L) 720.51 ± 32.01604.12 ± 42.64725.84 ± 6.20759.72 ± 6.46110.41 **
K+ (mg/L)112.34 ± 21.0793.34 ± 4.18110.16 ± 1.67124.84 ± 3.5522.60 *
Ca+ (mg/L)133.41 ± 51.6084.47 ± 34.46123.50 ± 7.17174.20 ± 14.31107.55 ns
Mg+ (mg/L)99.15 ± 16.3182.00 ± 8.3694.18 ± 1.64116.46 ± 3.9025.88 *
SAR73.81 ± 7.2772.03 ± 3.5776.96 ± 1.3168.27 ± 2.5417.65 ns
PAR11.19 ± 1.5511.33 ± 0.8211.33 ± 0.1110.86 ± 0.221.96 ns
LSD0.05: least significant difference after Duncan’s post hoc test at probability level of 0.05.
Publisher’s Note: MDPI stays neutral with regard to jurisdictional claims in published maps and institutional affiliations.

