
The Evaluation of Experimental Variables for Sustainable Virtual Road Safety Audits


Abstract
:1. Introduction
2. Literature Review
2.1. Categories and Content of Road Safety Audits
2.2. Road Environment Definition by the Local Dynamic Map
2.3. Identifying and Categorizing Experimental Variables Based on the Literature Review
2.4. Comparison with Other Research in This Field
3. Methods
3.1. Materials and Methods
3.1.1. Participants
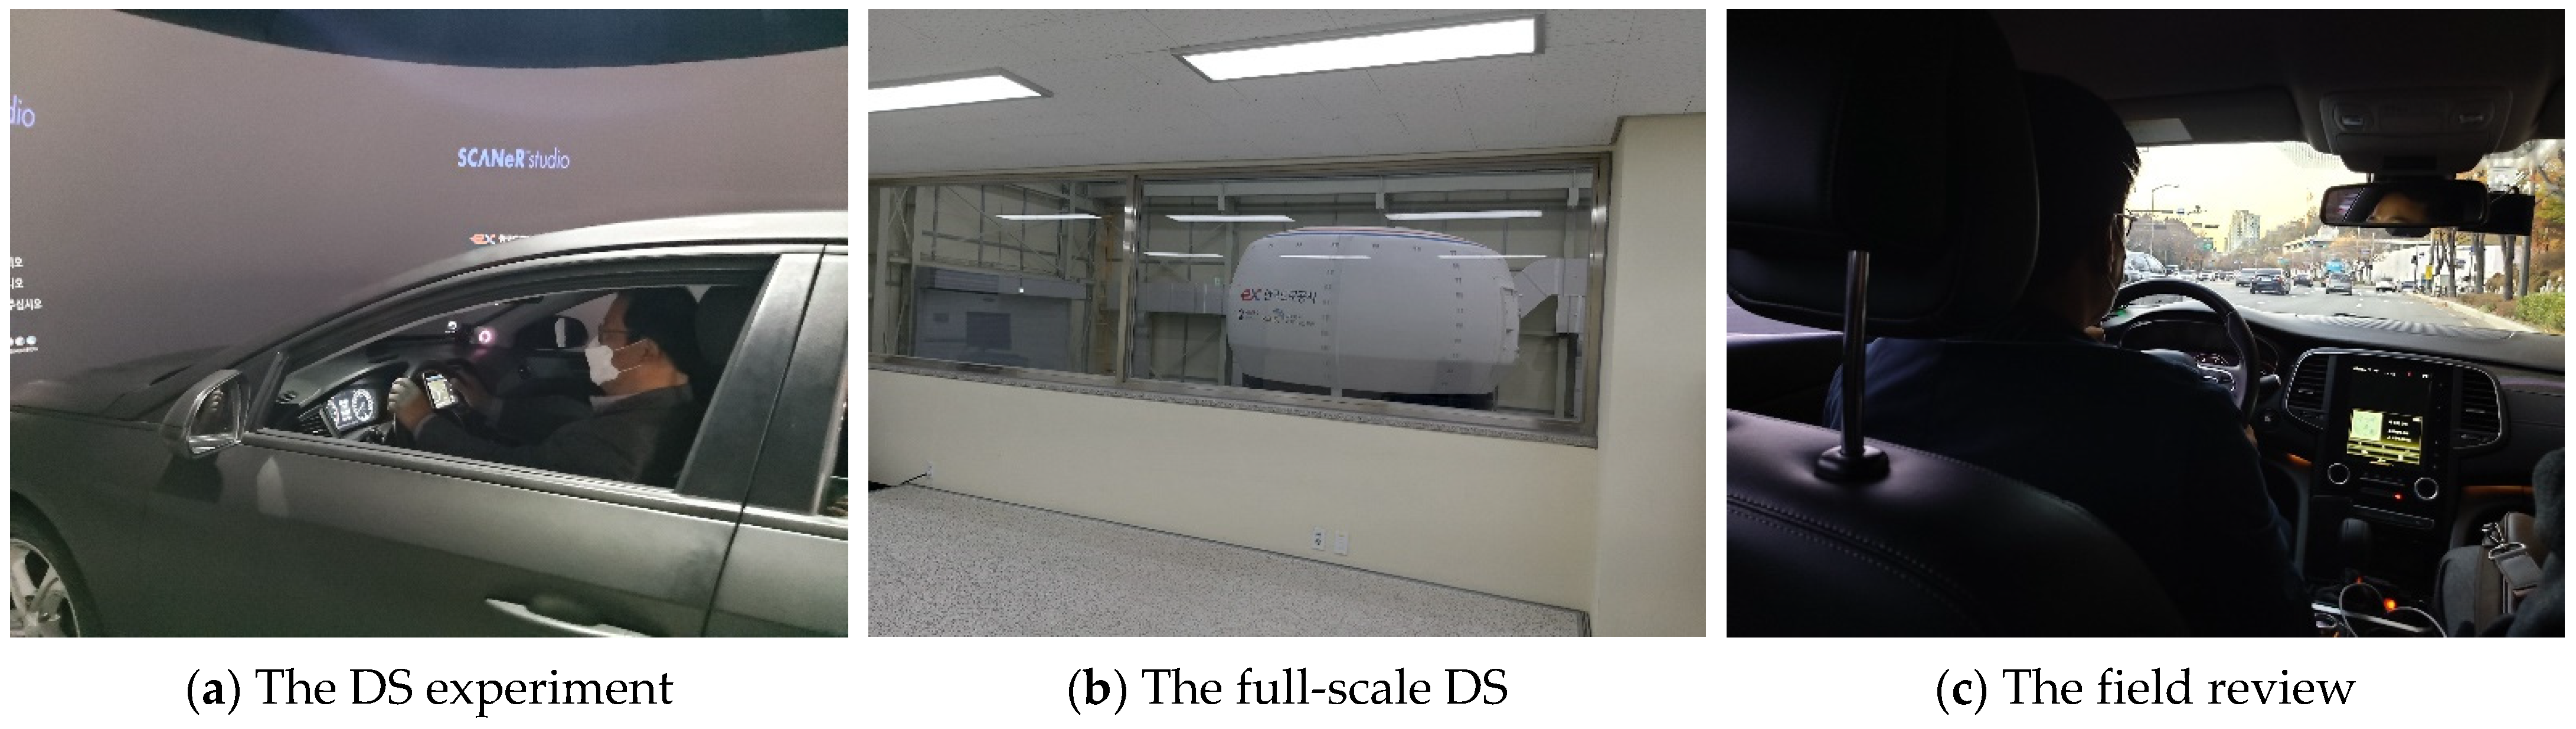
3.1.2. Driving Simulator and Field Reviews
3.1.3. Net Promoter Score
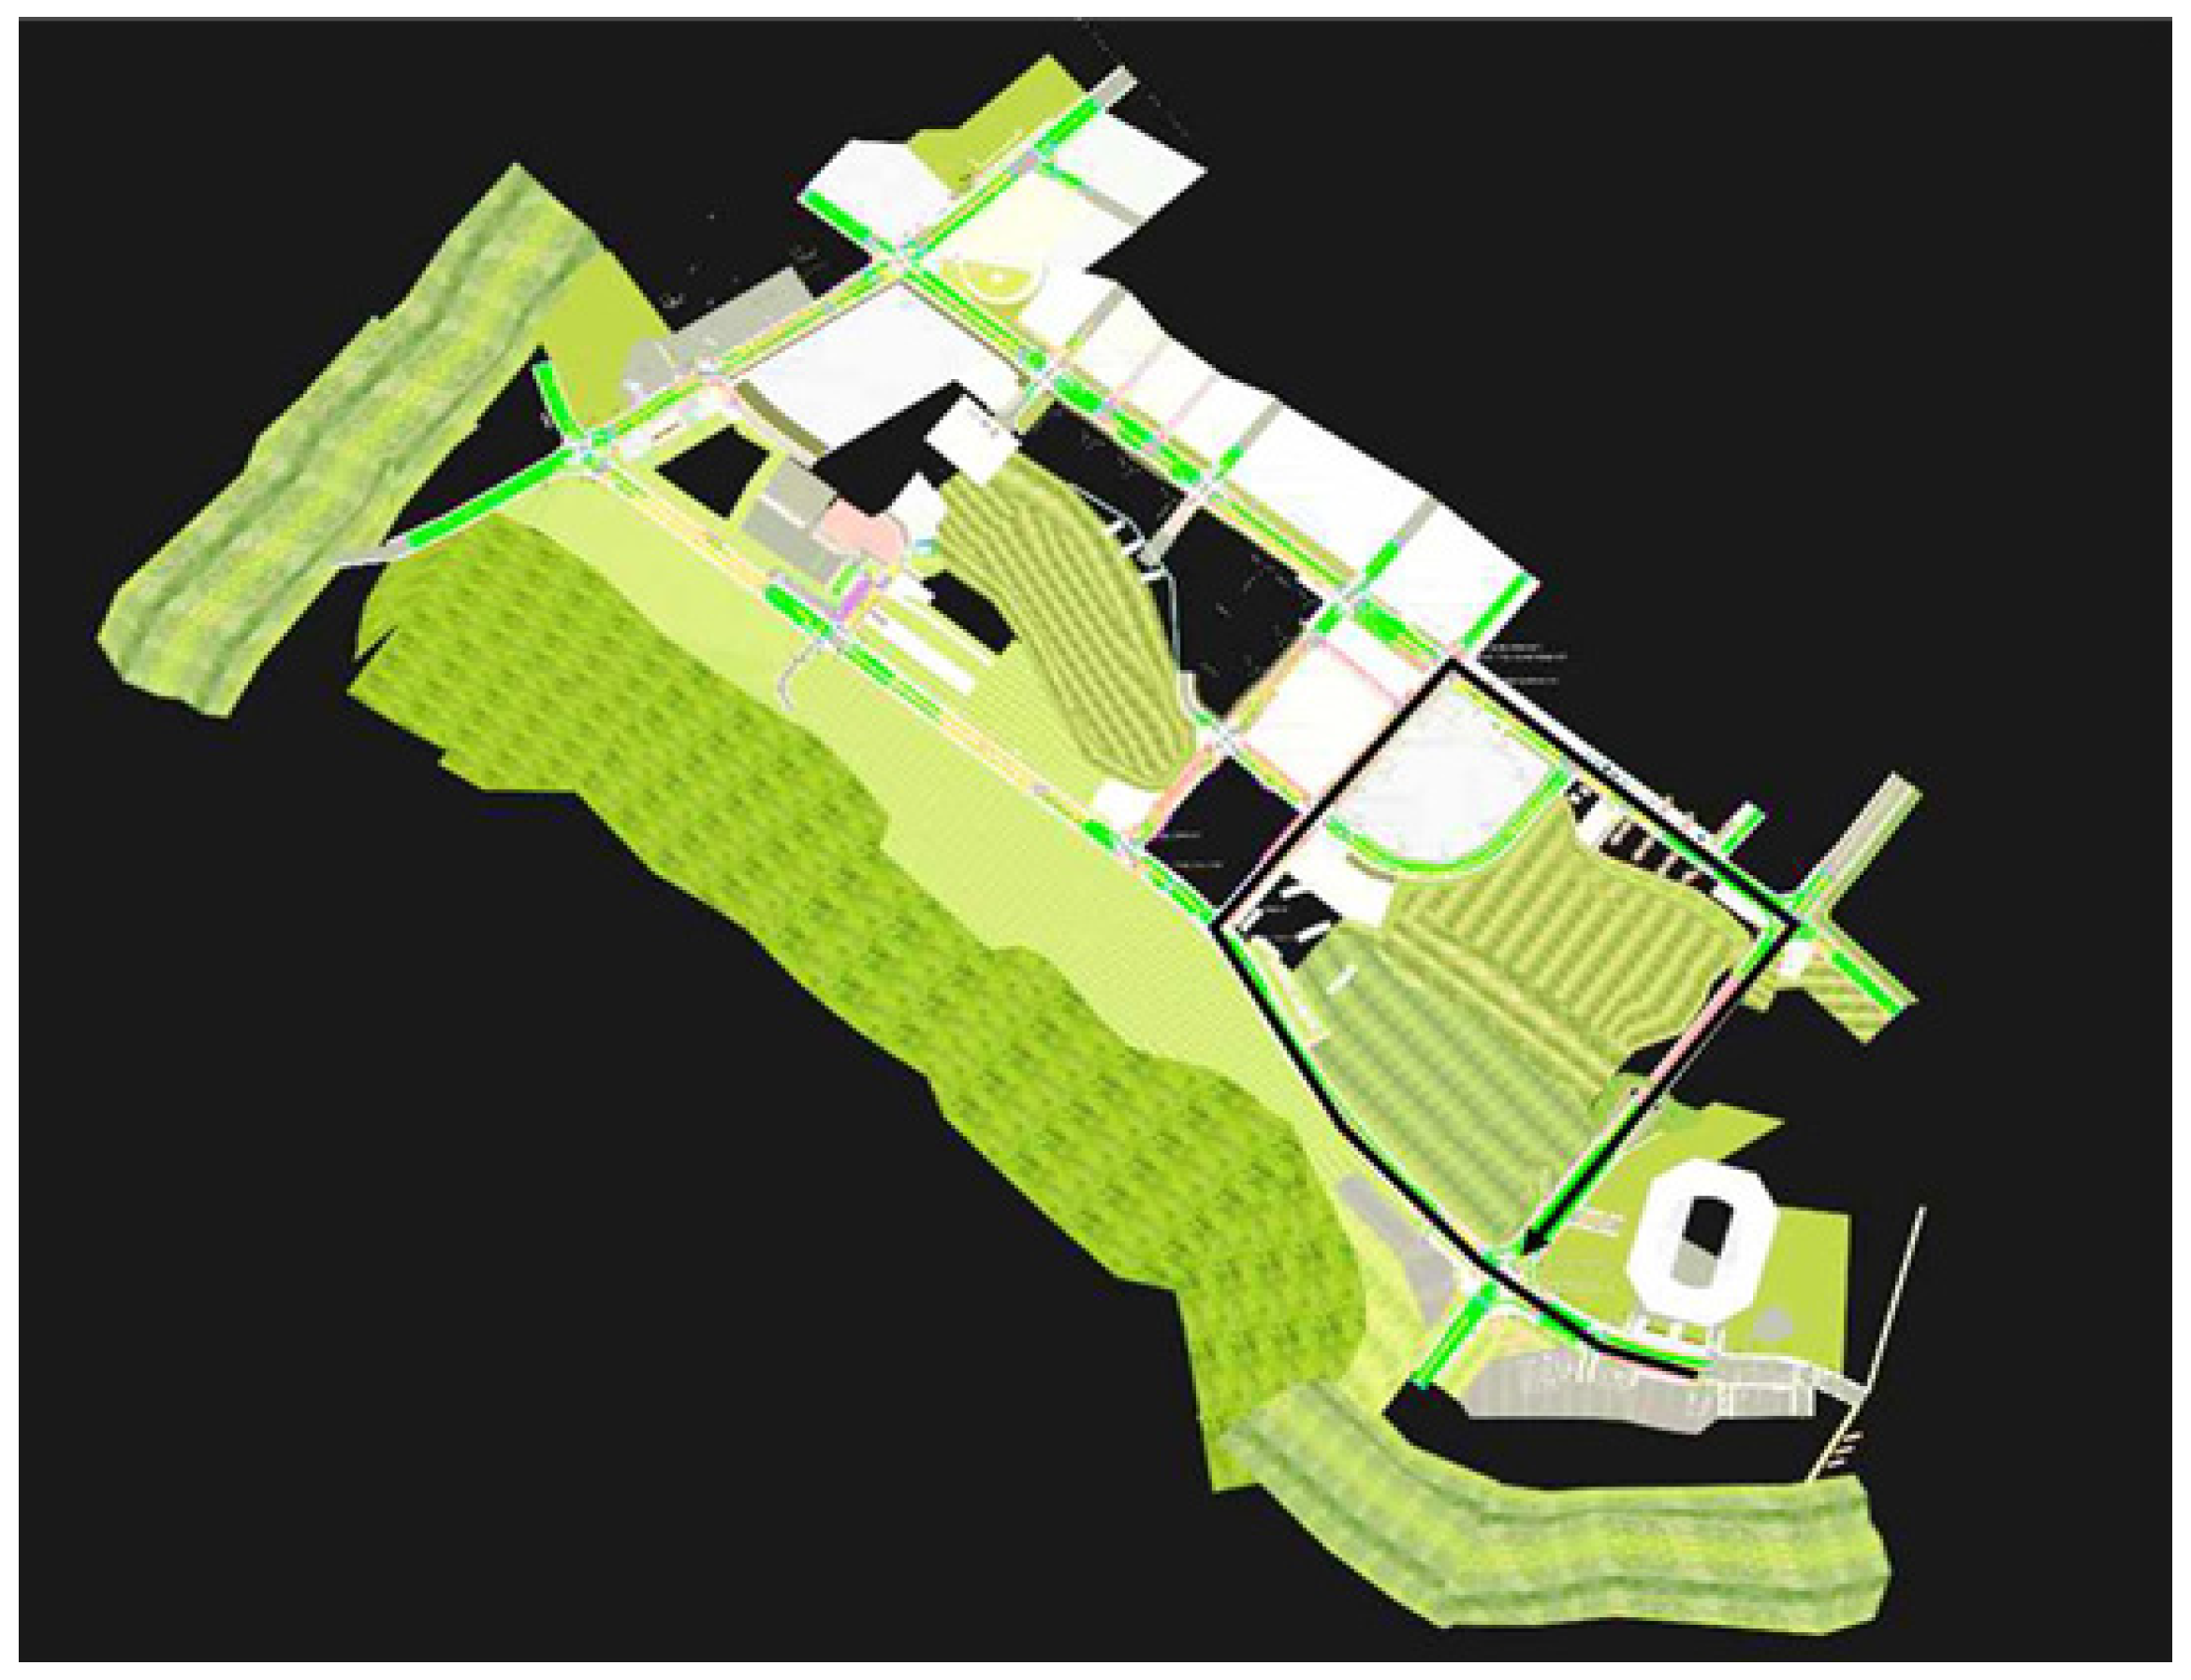
3.1.4. Case Study
3.2. Analysis Procedures
4. Results and Discussion
4.1. Results
4.1.1. Survey Results
4.1.2. Expert Interviews
4.2. Comparison of These Results with Other Researches
4.3. Discussion
4.4. Limitations and Future Researches
5. Conclusions
Author Contributions
Funding
Institutional Review Board Statement
Informed Consent Statement
Data Availability Statement
Conflicts of Interest
Appendix A

| Q. How Likely Is It That You Would Recommend the VRSA Experimental Variables to a Colleague? | |||||||||||||
|---|---|---|---|---|---|---|---|---|---|---|---|---|---|
| Experimental Variables | Not at All Likely | Extremely Likely | |||||||||||
| Static road environments | Roadway layout, Sidewalk, Bicycle route, Shoulder (roadside) | 0 | 1 | 2 | 3 | 4 | 5 | 6 | 7 | 8 | 9 | 10 | |
| Tunnel, Bridge, Underpass, Footbridge | 0 | 1 | 2 | 3 | 4 | 5 | 6 | 7 | 8 | 9 | 10 | ||
| Other road types (Rail track, etc.) | 0 | 1 | 2 | 3 | 4 | 5 | 6 | 7 | 8 | 9 | 10 | ||
| Road pavement | 0 | 1 | 2 | 3 | 4 | 5 | 6 | 7 | 8 | 9 | 10 | ||
| Drainage | 0 | 1 | 2 | 3 | 4 | 5 | 6 | 7 | 8 | 9 | 10 | ||
| Traffic light | 0 | 1 | 2 | 3 | 4 | 5 | 6 | 7 | 8 | 9 | 10 | ||
| Traffic island | 0 | 1 | 2 | 3 | 4 | 5 | 6 | 7 | 8 | 9 | 10 | ||
| Median barrier | 0 | 1 | 2 | 3 | 4 | 5 | 6 | 7 | 8 | 9 | 10 | ||
| Landscaping | 0 | 1 | 2 | 3 | 4 | 5 | 6 | 7 | 8 | 9 | 10 | ||
| Sign | 0 | 1 | 2 | 3 | 4 | 5 | 6 | 7 | 8 | 9 | 10 | ||
| Lane, Road marking | 0 | 1 | 2 | 3 | 4 | 5 | 6 | 7 | 8 | 9 | 10 | ||
| Lighting | 0 | 1 | 2 | 3 | 4 | 5 | 6 | 7 | 8 | 9 | 10 | ||
| Road furniture (Fence, Delineator, Barrier, Hump, Glare screening, Parking area, Rest area, Bus bay, etc.) | 0 | 1 | 2 | 3 | 4 | 5 | 6 | 7 | 8 | 9 | 10 | ||
| Dynamic road environments | Vehicle | 0 | 1 | 2 | 3 | 4 | 5 | 6 | 7 | 8 | 9 | 10 | |
| Pedestrian | 0 | 1 | 2 | 3 | 4 | 5 | 6 | 7 | 8 | 9 | 10 | ||
| Bicycle | 0 | 1 | 2 | 3 | 4 | 5 | 6 | 7 | 8 | 9 | 10 | ||
| Traffic condition | 0 | 1 | 2 | 3 | 4 | 5 | 6 | 7 | 8 | 9 | 10 | ||
| Accident | 0 | 1 | 2 | 3 | 4 | 5 | 6 | 7 | 8 | 9 | 10 | ||
| Work zone | 0 | 1 | 2 | 3 | 4 | 5 | 6 | 7 | 8 | 9 | 10 | ||
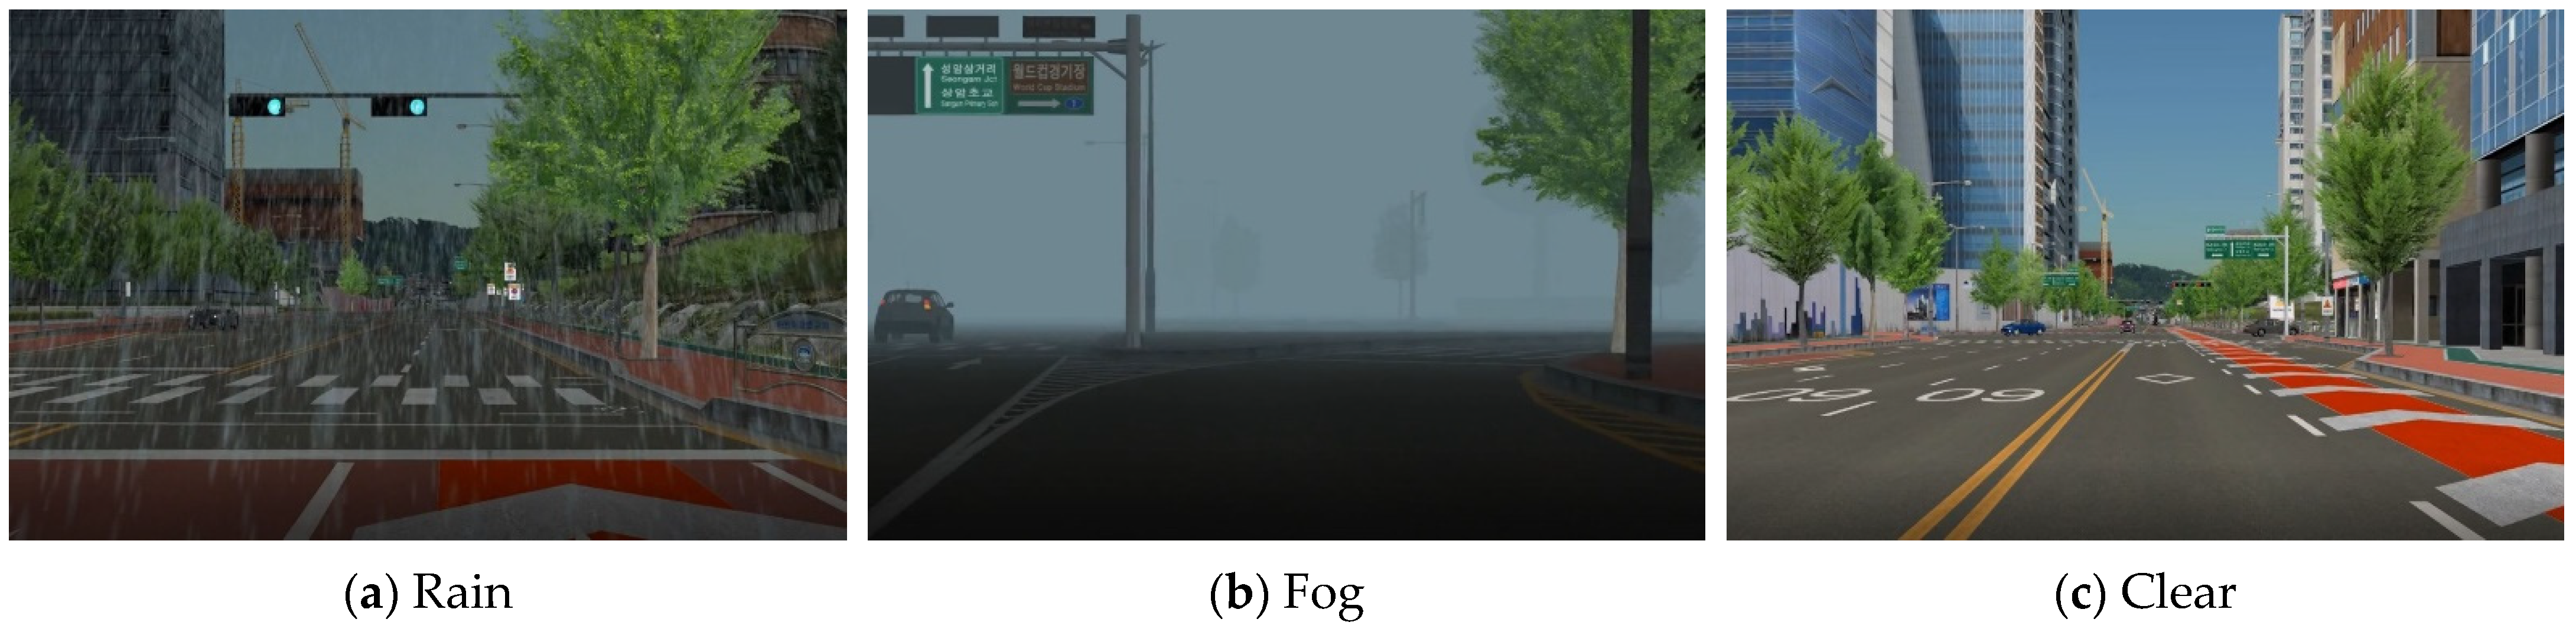
| Weather | 0 | 1 | 2 | 3 | 4 | 5 | 6 | 7 | 8 | 9 | 10 | ||
| Hazard event (Disaster, Animal, etc.) | 0 | 1 | 2 | 3 | 4 | 5 | 6 | 7 | 8 | 9 | 10 | ||
References
- The Institution of Highways & Transportation. Road Safety Audit; Institution of Highways & Transportation: London, UK, 2008. [Google Scholar]
- Consultancy, T. Practical Road Safety Auditing, 2nd ed.; Thomas Telford Books: London, UK, 2008. [Google Scholar]
- Federal Highway Administration. FHWA Road Safety Audit Guidelines; Federal Highway Administration: Washington, DC, USA, 2006.
- De Winter, J.; Wieringa, P.A.; Dankelman, J.; Mulder, M.; Van Paassen, M.M.; De Groot, S. Driving Simulator Fidelity and Training Effectiveness. In Proceedings of the 26th European Annual Conference on Human Decision Making and Manual Control, Lyngby, Denmark, 20–22 June 2007. [Google Scholar]
- Allen, R.W.; Park, G.D.; Cook, M.L.; Fiorentino, D. The Effect of Driving Simulator Fidelity on Training Effectiveness. In Proceedings of the DSC 2007 North America, Iowa City, IA, USA, 12–14 September 2007. [Google Scholar]
- Noyce, D.A.; Chitturi, M.V. Virtual Road Safety Audits: Recommended Procedures for Using Driving Simulation and Technology to Expand Existing Practices. 2018. Available online: http://safersim.nads-sc.uiowa.edu/final_reports/UWI%203%20Y1_Report.pdf (accessed on 24 May 2021).
- Santiago-Chaparro, K.; DeAmico, M.; Bill, A.; Chitturi, M.; Noyce, D. Realistic-Scenario Creation Process for Virtual Road Safety Audits. Adv. Transp. Stud. 2011, 19–28. [Google Scholar] [CrossRef]
- Jun, Y.; Go, J.; Yeom, C. Experimental variables assessment for virtual road safety audit using analytic hierarchy process. J. Transp. Saf. Secur. 2021, 1–20. [Google Scholar] [CrossRef]
- Kim, S.; Park, H. Development and Test Application of Road and Traffic Safety Diagnosis Methodology using VR-Based Driving Simulator. In Proceedings of the KORKST Conference, Gangneung, Korea, 25–26 June 2020; p. 20. [Google Scholar]
- Kar, K.; Blankenship, M.R. Road Safety Audit: Findings from Successful Applications in Arizona. Transp. Res. Rec. 2010, 2182, 113–120. [Google Scholar] [CrossRef]
- Huvarinen, Y.; Svatkova, E.; Oleshchenko, E.; Pushchina, S. Road Safety Audit. Transp. Res. Procedia 2017, 20, 236–241. [Google Scholar] [CrossRef]
- Austroads. Road Safety Audit, 2nd ed.; Austroads: Sydney, Australia, 2002. [Google Scholar]
- Jun, Y.; Go, J.; Yeom, C. A Study on the Road Safety Audit Factors Influencing Accidents Density in Seoul. Seoul Stud. 2020, 21, 67–84. [Google Scholar]
- Guidelines for Traffic Safety Diagnoses; Ministry of Land, Infrastructure and Transport: Sejong-si, Korea, 2018.
- ETSI. ETSI EN 302 895 (V1.1.1): Intelligent Transport Systems (ITS); Vehicular Communications; Basic Set of Applications; Local Dynamic Map (LDM). ETSI: Valbonne Sophia Antipolis, France, 2014. Available online: https://www.etsi.org/deliver/etsi_en/302800_302899/302895/01.01.01_60/en_302895v010101p.pdf (accessed on 24 May 2021).
- ETSI. ETSI TR 102 863 (V1.1.1): Intelligent Transport Systems (ITS); Vehicular Communications; Basic Set of Applications; Local Dynamic Map (LDM); Rationale for and Guidance on Standardization. ETSI: Valbonne Sophia Antipolis, France, 2011. Available online: https://www.etsi.org/deliver/etsi_tr/102800_102899/102863/01.01.01_60/tr_102863v010101p.pdf (accessed on 24 May 2021).
- Shimada, H.; Yamaguchi, A.; Takada, H.; Sato, K. Implementation and Evaluation of Local Dynamic Map in Safety Driving Systems. J. Transp. Technol. 2015, 5, 102–112. [Google Scholar] [CrossRef] [Green Version]
- Eiter, T.; Füreder, H.; Kasslatter, F.; Parreira, J.X.; Schneider, P. Towards a Semantically Enriched Local Dynamic Map. Int. J. Intell. Transp. Syst. Res. 2019, 17, 32–48. [Google Scholar] [CrossRef] [Green Version]
- Netten, B.D.; Kester, L.; Wedemeijer, H.; Passchier, I.; Driessen, B. Dynamap: A Dynamic Map for Road Side Its Stations; Intelligent Transportation Society of America: Washington, DC, USA, 2013. [Google Scholar]
- ISO. ISO/TS 18750:2018: Intelligent Transport Systems—Co-Operative ITS—Local Dynamic Map; ISO: Geneva, Switzerland, 2018. [Google Scholar]
- ISO. ISO/TS 17931:2013: Intelligent Transport Systems—Extension of Map Database Specifications for Local Dynamic Map for Applications of Cooperative ITS; ISO: Geneva, Switzerland, 2013. [Google Scholar]
- Dols, J.F.; Molina, J.; Camacho, F.J.; Marín-Morales, J.; Pérez-Zuriaga, A.M.; Garcia, A. Design and Development of Driving Simulator Scenarios for Road Validation Studies. Transp. Res. Procedia 2016, 18, 289–296. [Google Scholar] [CrossRef]
- Ziakopoulos, A.; Yannis, G. A review of spatial approaches in road safety. Accid. Anal. Prev. 2020, 135, 105323. [Google Scholar] [CrossRef]
- Wang, C.; Quddus, M.A.; Ison, S.G. The effect of traffic and road characteristics on road safety: A review and future research direction. Saf. Sci. 2013, 57, 264–275. [Google Scholar] [CrossRef]
- Nabors, D.; Soika, J. Road Safety Audit Case Studies: Using Three-Dimensional Design Visualization in the Road Safety Audit Process; Federal Highway Administration: Washington, DC, USA, 2013.
- Kim, S.; Lee, K.; Park, H.; Kim, Y. Introduction of Traffic Safety Diagnosis Methodology Based on Virtual Reality using a Driving Simulator. Korean Soc. Transp. 2020, 17, 37–44. [Google Scholar]
- Park, J.; Kim, D.; Park, Y. The Introduction and Activation Plan of Driving Simulator Experiment Facility. In Proceedings of the KSCE 2018 Convention, Gyeongju-si, Korea, 17–19 October 2018. [Google Scholar]
- Korea Expressway Corporation. Construction of a Driving Simulator Experiment Facility; Korea Expressway Corporation: Gimcheon-si, Korea, 2019. [Google Scholar]
- Reichheld, F.F. The one number you need to grow. Harv. Bus. Rev. 2003, 81, 46–55. [Google Scholar] [PubMed]
- Kompella, K. Marketing Wisdom; Springer: New York, NY, USA, 2019. [Google Scholar]
- Hamilton, D.F.; Lane, J.V.; Gaston, P.; Patton, J.T.; Macdonald, D.J.; Simpson, A.; Howie, C.R. Assessing Treatment Outcomes using a Single Question: The Net Promoter Score. Bone Jt. J. 2014, 96, 622–628. [Google Scholar] [CrossRef] [PubMed] [Green Version]
- Korneta, P. Net promoter score, growth, and profitability of transportation companies. Int. J. Manag. Econ. 2018, 54, 136–148. [Google Scholar] [CrossRef] [Green Version]
- Fisher, N.I.; Kordupleski, R.E. Good and bad market research: A critical review of Net Promoter Score. Appl. Stoch. Model. Bus. Ind. 2019, 35, 138–151. [Google Scholar] [CrossRef] [Green Version]
- Krol, M.W.; de Boer, D.; Delnoij, D.M.; Rademakers, J.J. The Net Promoter Score—An Asset to Patient Experience Surveys? Health Expect. 2015, 18, 3099–3109. [Google Scholar] [CrossRef]
- Jung, E.-J.; Jung, Y.-S.; Yang, H.-Y.; Kim, J.-H.; Choi, Y.-H.; Song, K.-B. Related factors between quality of dental service and Korean net promoter score. J. Korean Acad. Oral Health 2016, 40, 112. [Google Scholar] [CrossRef]
- Gliem, J.A.; Gliem, R.R. Calculating, Interpreting, and Reporting Cronbach’s Alpha Reliability Coefficient for Likert-Type Scales. In Proceedings of the Midwest Research-to-Practice Conference in Adult, Continuing, and Community Education, Columbus, IN, USA, 8–10 October 2003. [Google Scholar]
- Vienne, F.; Caro, S.; Désiré, L.; Auberlet, J.; Rosey, F.; Dumont, E. Driving Simulator: An Innovative Tool to Test New Road Infrastructures. In Proceedings of the TRA-Transport Research Arena, Paris, France, 14–17 April 2014. [Google Scholar]
- Kawamura, A.; Maeda, C.; Shirakawa, T.; Ishida, T.; Nakatsuji, T.; Himeno, K. Applicability of a Driving Simulator as a New Tool for the Pavement Surface Evaluation. In Proceedings of the SIIV (Italian Society for Transportation Infrastructures) 2004 International Congress, Firenze, Italy, 27–29 October 2004; pp. 10–52. [Google Scholar]
- Espié, S.; Gauriat, P.; Duraz, M. Driving Simulators Validation: The Issue of Transferability of Results Acquired on Simulator. In Proceedings of the Driving Simulation Conference North-America (DSC-NA 2005), Orlondo, FL, USA, 30 November–2 December 2005. [Google Scholar]
- Gilandeh, S.S.; Hosseinlou, M.H.; Anarkooli, A.J. Examining bus driver behavior as a function of roadway features under daytime and nighttime lighting conditions: Driving simulator study. Saf. Sci. 2018, 110, 142–151. [Google Scholar] [CrossRef]
- Guzek, M.; Lozia, Z.; Zdanowicz, P.; Jurecki, R.S.; Stańczyk, T.L. Research on Behaviour of Drivers in Accident Situation Conducted in Driving Simulator. J. KONES 2009, 16, 173–183. [Google Scholar]
- Bélanger, A.; Gagnon, S.; Stinchcombe, A. Crash avoidance in response to challenging driving events: The roles of age, serialization, and driving simulator platform. Accid. Anal. Prev. 2015, 82, 199–212. [Google Scholar] [CrossRef]
- Zaki, M.; Kandeil, D.; Neely, A.; McColl-Kennedy, J.R. The Fallacy of the Net Promoter Score: Customer Loyalty Predictive Model. Camb. Serv. Alliance 2016, 10, 1–25. [Google Scholar]
- Keiningham, T.L.; Cooil, B.; Andreassen, T.W.; Aksoy, L. A Longitudinal Examination of Net Promoter and Firm Revenue Growth. J. Mark. 2007, 71, 39–51. [Google Scholar] [CrossRef] [Green Version]


| Categories | Content |
|---|---|
| General topics | Road type, Speed, etc. |
| Cross-section elements | Median barrier, Roadway layout, Shoulder, etc. |
| Alignment | Horizontal alignment, Vertical alignment, Sight distance, Transition, etc. |
| Intersection | Traffic light, Traffic island, Roundabout, etc. |
| Interchange | Ramp, Rail crossing, etc. |
| Pedestrian and Bicycle | Sidewalk, Bicycle route, Related facilities, etc. |
| Pavement and Drainage | Road pavement, Drainage, Tunnel, Bridge, etc. |
| Road furniture | Fence, Delineator, Cushion, Barrier, Hump, Glare screening, Parking area, Rest area, Bus bay, Soundproofing, etc. |
| Sign and Marking | Sign, Road marking, Pole, etc. |
| Lighting | Illumination, Pole, etc. |
| Work zone and Crash handling | Detour, Work zone, Crash handling of debris, etc. |
| Weather and Natural features | Weather, Animal, Landscaping, etc. |
| The Four Layers | Examples | |
|---|---|---|
| The first layer (Bottom) | Permanent static data | GIS map provided by map data suppliers. It includes intersections, lane precise local road topography, and statutory speed limit. |
| The second layer | Transient static data | Traffic signs, landmarks, intersection features, and roadside infrastructures (ITS stations) |
| The third layer | Transient dynamic data | Hazard information, traffic congestion, traffic conditions, weather situation, slippery road, traffic signal phase, road works information, temporary speed limit, temporary restriction changes, and parking lots’ current status. |
| The fourth layer (Top) | Highly dynamic data | Automotive sensor information, dynamic traffic signs, pedestrians, ego vehicles, and vehicles (V2X messages such as GPS position and speed) |
| Category | Experimental Variables |
|---|---|
| Static road environments | Roadway layout *, Sidewalk, Bicycle route, Shoulder (roadside) |
| Tunnel, Bridge, Underpass, Footbridge | |
| Other road types (Rail track, etc.) | |
| Road pavement | |
| Drainage | |
| Traffic light | |
| Traffic island | |
| Median barrier | |
| Landscaping | |
| Sign | |
| Lane, Road marking | |
| Lighting | |
| Road furniture (Fence, Delineator, Cushion, Barrier, Hump, Glare screening, Parking area, Rest area, Bus bay, Soundproofing, etc.) | |
| Dynamic road environments | Vehicle |
| Pedestrian | |
| Bicycle | |
| Traffic condition | |
| Accident | |
| Work zone | |
| Weather | |
| Hazard event (Disaster, Animal, etc.) |
| Experimental Variables | NPS Score | Experimental Variables | NPS Score |
|---|---|---|---|
| Roadway layout, Sidewalk, Bicycle route, Shoulder (Roadside) | 0 | Lighting | −50 |
| Tunnel, Bridge, Underpass, Footbridge | 50 | Road furniture (Fence, Delineator, etc.) | 25 |
| Other road types (Rail track, etc.) | 0 | Vehicle | −25 |
| Road pavement | −50 | Pedestrian | −50 |
| Drainage | −100 | Bicycle | −50 |
| Traffic light | 25 | Traffic condition | 25 |
| Traffic island | 50 | Accident | −50 |
| Median barrier | 25 | Work zone | 0 |
| Landscaping | 0 | Weather | 0 |
| Sign | 50 | Hazard event (Disaster, Animal, etc.) | −25 |
| Lane, Road marking | 50 |
Publisher’s Note: MDPI stays neutral with regard to jurisdictional claims in published maps and institutional affiliations. |
© 2021 by the authors. Licensee MDPI, Basel, Switzerland. This article is an open access article distributed under the terms and conditions of the Creative Commons Attribution (CC BY) license (https://creativecommons.org/licenses/by/4.0/).
Share and Cite
Jun, Y.; Park, J.; Yeom, C. The Evaluation of Experimental Variables for Sustainable Virtual Road Safety Audits. Sustainability 2021, 13, 5899. https://doi.org/10.3390/su13115899
Jun Y, Park J, Yeom C. The Evaluation of Experimental Variables for Sustainable Virtual Road Safety Audits. Sustainability. 2021; 13(11):5899. https://doi.org/10.3390/su13115899
Chicago/Turabian StyleJun, Yeonsoo, Juneyoung Park, and Chunho Yeom. 2021. "The Evaluation of Experimental Variables for Sustainable Virtual Road Safety Audits" Sustainability 13, no. 11: 5899. https://doi.org/10.3390/su13115899