Article

Inequalities in the Exercise and Continuity in Building Engineering in Spain. Factor Analysis Including Gender Perspective

by
Irantzu Recalde-Esnoz
1,2,
Daniel Ferrández
1,
Carlos Morón
1,* and
Guadalupe Dorado
3
1
Departamento de Tecnología de la Edificación, Universidad Politécnica de Madrid, 28040 Madrid, Spain
2
Departamento de Ciencias de la Educación, Universidad de Alcalá, Aulario María de Guzmán, 28804 Alcalá de Henares, Spain
3
Departamento de Lingüística Aplicada a la Ciencia y a la Tecnología, Universidad Politécnica de Madrid, 28006 Madrid, Spain
*
Author to whom correspondence should be addressed.
Sustainability 2021, 13(10), 5514; https://doi.org/10.3390/su13105514
Submission received: 14 April 2021 / Revised: 3 May 2021 / Accepted: 6 May 2021 / Published: 14 May 2021
(This article belongs to the Collection Social Sustainability in Business from a Gender Perspective)

Abstract

:
The building sector is one of the most relevant at world level in view of the percentage of gross domestic product (GDP) concerned, as well as the number of new jobs created. Nevertheless, it is a completely male-dominated industry. Different institutions and organisms, such as the Agenda 2030 and the Sustainable Development Goals, struggle to reduce gender inequality in different environments, including the working one. Aligned with these goals, this study provides the data exploited from the first survey regarding gender inequality within the professionals of the building engineering field in the Spanish population as a whole. This survey was developed in 2018 by the Spanish General Council of Technical Architecture and it was sent to its members. The sample involved 1353 cases. For this data mining, bivariate analyses were conducted in order to subsequently carry out a factor analysis and the socio–demographic composition of the dimensions found. Results exposed statistically meaningful differences in the eyes of women and men about those factors which facilitate practice and continuity in the profession. The most relevant conclusions drawn from the factor analysis reflect the existence of three factors: (1) work competences, (2) social capital and (3) physical appearance and being a man, dimensions in which women and men’s opinion was unevenly distributed.

1. Introduction

Since the last quarter of the 20th century, economic development, social movements and institutions have helped reduce the inequalities between men and women in most parts of the world [1]. Globally, the construction sector is one of the most important at the economic level. It represents about 10% of global gross domestic product (GDP) and 7% of worldwide job positions [2]. In a European context, the GDP rate stands at around 5% in almost all countries in 2019 [3]. Nonetheless, in spite of its relevance, women’s participation in the construction sector remains a challenge, with minor fluctuations or improvements with respect to equality over the past years [4,5,6,7,8,9,10].
In 2015, an action plan for people, the planet and prosperity was set up by the United Nations. The objective was to attain people equality, among them gender equality, through any government, institution, enterprise, and citizen that feels appealed and able to contribute to the action plan. This plan is known as Agenda 2030, and is composed of 17 Sustainable Development Goals [11]. In the present case, gender equality in the construction sector, three of the 17 goals work directly or indirectly to reduce the gender inequalities in this field. In the first place, objective number 5 draws particular attention to gender equality and the fact of empowering women and girls. Secondly, the construction sector must feel called upon by objective number 8 “promote sustained, inclusive and sustainable economic growth, full and productive employment and decent work for all”. Lastly, and from a more global perspective, the enterprises within this field, due to their position and capacity for action must contribute to the achievement of objective number 10, “reduce inequality within and among countries” [11].
However, despite endeavors to reach gender equality into the labour world, research shows that there is still a long way to go in order to attain this aim [2,4,7,12,13,14]. At a global level, it is one of the sectors with the lowest women’s participation rate [4,7,8,13,15,16]. As a matter of fact, according to statistics provided by the United States Bureau of Labor Statistics [17], in 2018, only 9.9% of the total workers in the construction sector in this country were women. These figures are very similar to those obtained by the International Labour Organization (ILO) [14], whose data is nourished by official statistics from different countries. As an example, in the United States, the ILO uses the Current Population Survey (LFS). For the year 2018, this survey indicated a 10.2% woman’s participation rate of the total American population within the construction sector; for 2019, the participation rate was 10.6%. In India, in accordance with the Periodic Labour Force Survey, in 2018, the percentage of women working in the construction sector was 8.3%. In Argentina (Encuesta Permanente de Hogares; in English: The Permanent Household Survey), in 2018, women accounted for 3.5% of total employees, and in 2019, 3.8%. This situation, without a doubt, leads to a loss in diversity of viewpoints. This has been further combined with a waste of talent for this field as they mainly have men as workers [18].
The explanation for these figures lies in the barriers found by women to enter and to stay in the construction industry. On the one hand, socialization rooted in gender roles appears. In this process, roles, values and norms are assigned based on the person’s gender. Furthermore, to support these work plan allocations, there has always been a wide range of societal beliefs and stereotypes, that is, a social imaginary [10,12,19,20,21]. This approach associates the work in the construction sector with men, because of the strength, whereas jobs related to childcare are strongly associated with women because of affection, care or empathy, features deemed “distinctive and innate” among women [10,15,22,23,24]. What is feminine, linked to care, finds no expression on the construction site, a place considered rough and dirty, that is, an inappropriate place for women and femininity [2,4,13,25]. The assignment of roles is a learning process that has taken place since childhood and has implications in the choice of hobbies and field of studies. Girls are not found as much as boys in science, technology, engineering and mathematics (STEM) subjects for various reasons such as the absence of women role models in this field and also the aforementioned stereotypes and norms. This implies that women’s access to professional careers linked to these areas of knowledge has been reduced [9,22,23,26].
In addition to these constraints, present even before joining the sector, women face many barriers which hinder the exercise and continuity in this profession. Research highlights most of these barriers as being related to the unique characteristics of the construction sector. These characteristics, that are adjusted to a work–life balance model suitable for those without domestic and family responsibilities, include long working hours, inflexible work schedule, face–to–face work format and nomadic nature [2,6,13,22,25]. Family life, maternity, reconciliation of family life or double working shift (on the one hand, the unpaid domestic labour; on the other, the gainful professional experience) represent one of the biggest impediments for women in the exercise and continuity in this profession. These responsibilities will involve career breaks as women feel the pressure to choose between their professional career or starting a family. Furthermore, the fear of losing their job or the fact of lagging behind in their professional development are incurred by these breaks [2,10,13,22,27,28].
Another reported obstacle in various research is the influence exerted in recruitment processes and in the appointment of women and men in the construction sector. On the one hand, in human resources, experience is highly valued and it is presented as an objective yardstick to recruit men or women. However, this does not always apply as, in many cases, where individuals are of the same age and training, men have more work experience than women thanks to the greater number of opportunities in the labour market. This inequality arises from the women’s invisibility in this field, the lack of female role models and the unwillingness or limited willingness to recruit women without work experience. All this makes the search for work complicated, therefore, breaking out from this circle will prove to be very difficult. The fact that human resources take experience into consideration in the recruitment process is legitimate. What is intended is to stress that as women have less opportunities their experience is naturally limited, which can be a vicious cycle [2,13,22,29]. On the other hand, on many occasions, the recruitment or promotion procedures in the construction sector occur informally, in social networking [13], where contacts are more relevant than achievements. Hence, access to work is gained through references from relatives or friends [10,30,31,32,33]. Research suggests that these networks operate as “close–knit gangs”, wary of the arrival of new members [4]. Moreover, complaints about the existence of homosocial behavior phenomenon are reported. Thus, social relationships and contacts are exclusively among men, which derives from the lack of mixture in these networks, keeping women out of the social game [6,10,13]. These networks are reinforced by leisure, membership of clubs or the practice of several sports where women have limited presence. This applies to STEM professional careers even more notably, as there are only a limited number of women in the company and it is even more challenging to join these male exclusive social networks [23]. A thirty-year-old woman architect, in the research carried out by Sang, Dainty and Ison, summarizes the above: “I like to think it’s (promotion) on merit but I am realistic enough to know that I don’t play golf at the same club.” (Sara, female, partner, 30 s) [6].
Some women in this field are exposed to sexual violence, especially those at the building site, and this is a least but not less important studies dimension [10,16,19,24,34,35,36]. This type of violence manifests itself in multiple ways, as the World Health Organization points out, sexual violence is “any sexual act, attempt to obtain a sexual act, comments or unwanted sexual advances (…) by any person regardless of their relationship with the victim, in any environment, including, among others, home and work” [37].

Previous Studies within the Spanish Context

Of the various studies undertaken in Spain on the horizontal gender-based employment segregation phenomenon, one of the most obvious and repeated conclusions is the strong male predominance in the construction sector [15,22,38,39,40,41,42,43]. Although this phenomenon is in a very similar situation to the rest of countries, it should be emphasized that the generalized incorporation of women into the Spanish labour market has presented unique characteristics, as it has been one of the most recent and accelerated incorporations: starting in the 1980s, coinciding with the end of the Franco dictatorship [11,13,44,45]. In agreement with the official records, the first Spanish woman who joined the professional association of Technical Architecture was Elvira de Azúa Gruart. She graduated in 1934 but became a member a decade later, in 1945, in COAATB, the Official College of Technical Architecture in Barcelona [46]. Her situation was remarkable and unique as it was not until 1956 that a second woman became a member. Later on, well into the 1960s, the presence of women in the colleges of technical architects or building engineers it is no longer an exception, beginning its incorporation into university education in this area gradually [47].
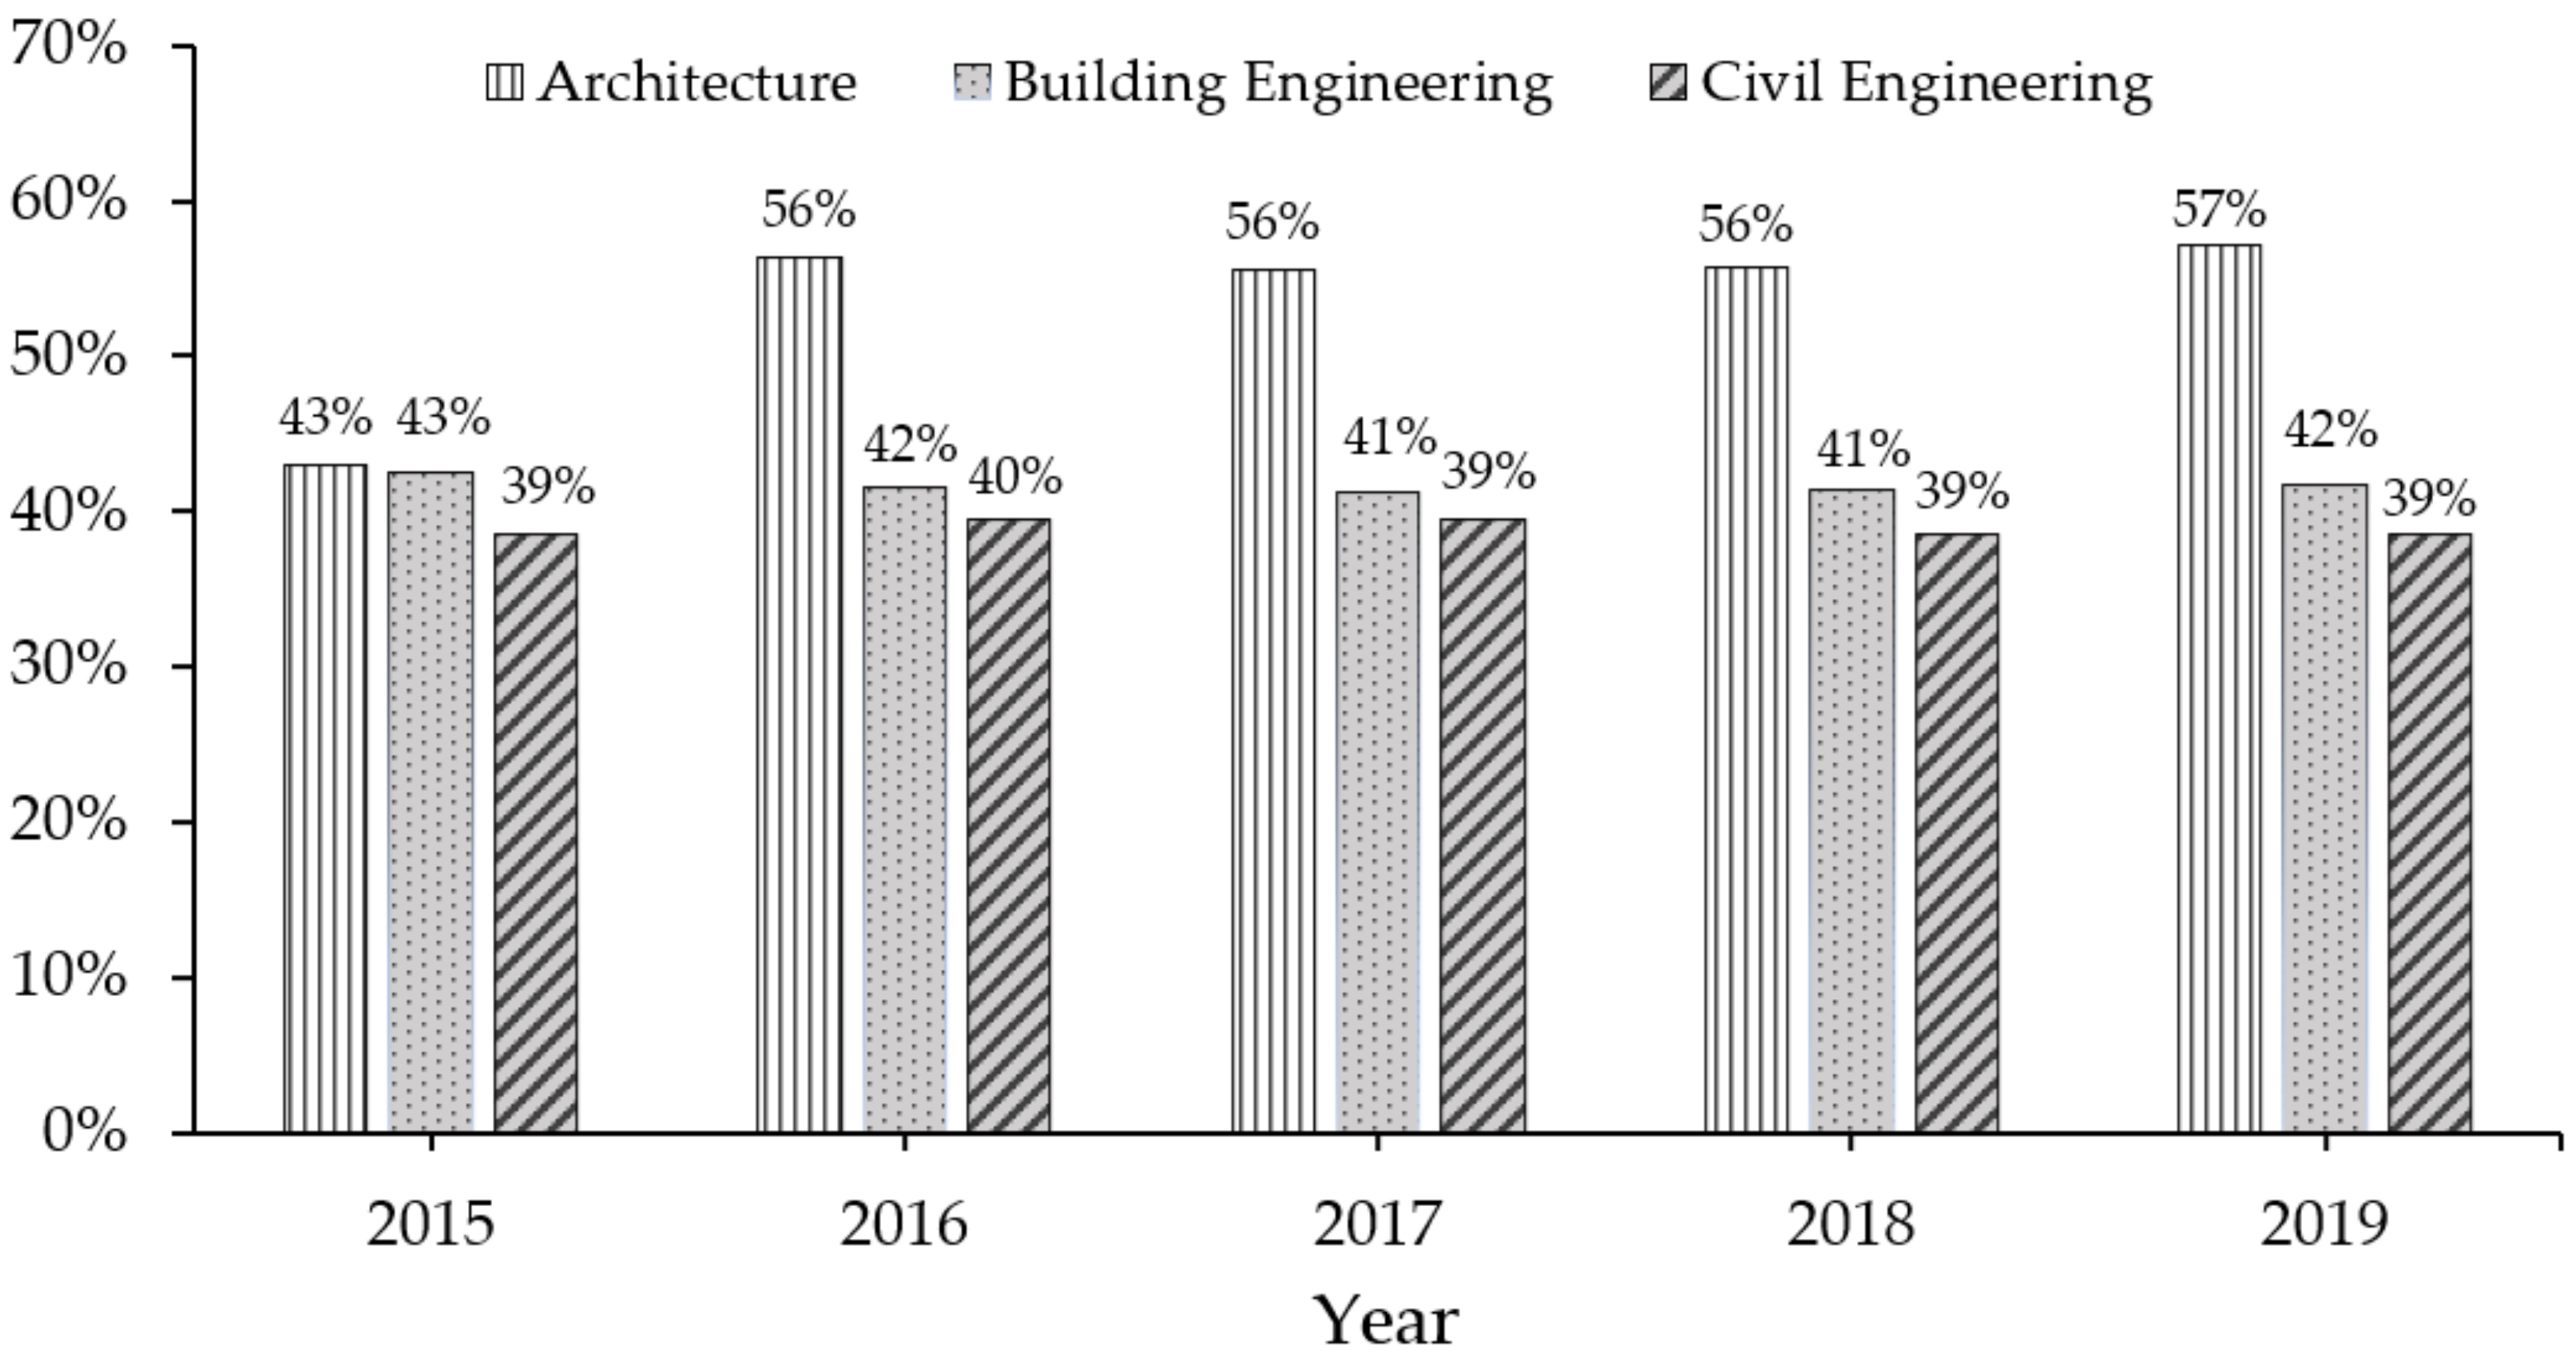
Nowadays, even though in Spanish higher education the gender gap in STEM careers has been reduced considerably, women fail to enter the labour market to the same extent that in higher education [34]. That raises the following question, what happens with women who graduated in this type of career when entering the labour market? In fact, when observing the data gathered by the Transparency Portal of the Universidad Politécnica de Madrid [48], one of the higher education institutions with the widest number of courses and with the largest concentration of students in STEM careers, it can be seen that the percentage of women enrolled in studied related to the construction sector such as architecture, building engineering or civil engineering varies between 39%—in civil engineering—and 57% in architecture in 2019 (see Figure 1).
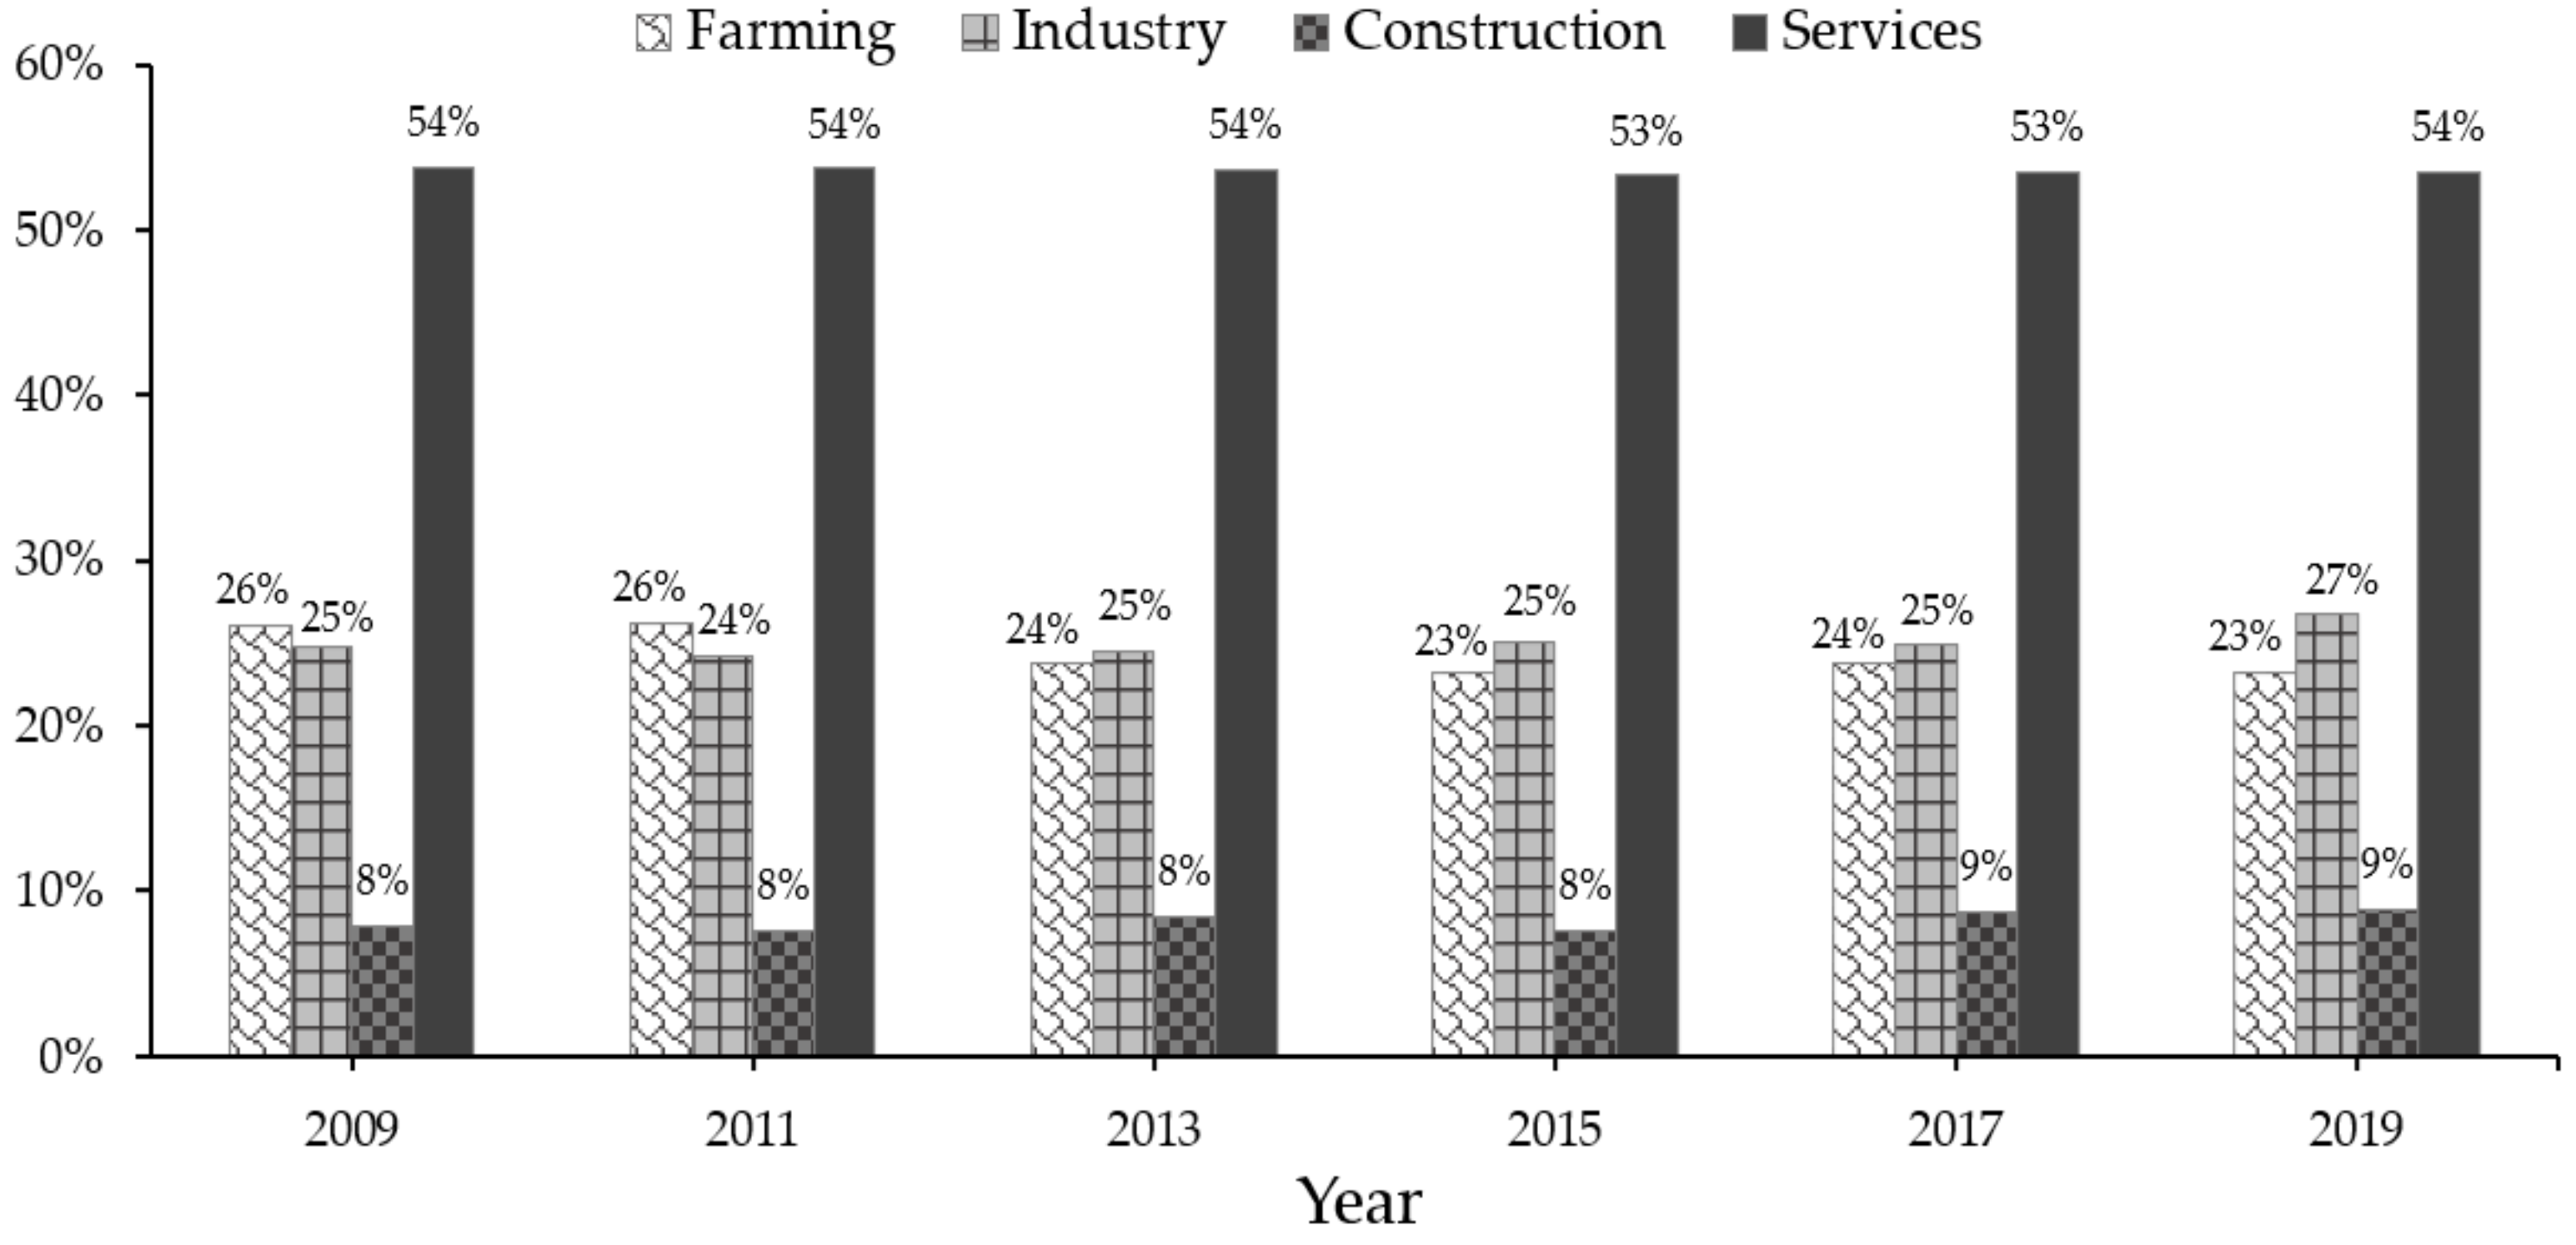
Nonetheless, these figures correspond neither to those found in the Spanish construction labour market, nor to those found in other countries such as the United Kingdom where in the last 10 years, the percentage of women who graduated in STEM careers has risen to 55%, a rise that has not moved to the British labour market [12]. In the Spanish case, in accordance with the data provided by the Spanish National Statistical Institute (Instituto Nacional de Estadística–hereinafter INE), through the Labour Force Survey, from 2008 until 2019–, the percentage of women employed in the construction field has risen two points higher, from 7% to 9% (see Figure 2) [49]. In addition to the low participation rate in the construction industry, data offered by INE present a labour market segregation, with a significant feminisation of the services sector in relation to the other sectors, as shown in Figure 2. A situation that has changed little in the last few years [13,15,34].
In Seville (Spain), Román, Ríos and Traverso [22] conducted interviews with site managers of construction companies and human resources recruiters of these companies. The objective was to seek the opinion of sector workers as well as their recruiters in regard to those characteristics that are important and that facilitate the exercise and continuity in the construction sector. In relation to its findings, men highlighted features such as experience, knowledge, leadership qualities, the ability to negotiate or the responsiveness in adverse situations. Additionally, women claimed similar characteristics to those provided by men, although more emphasis was given to teamwork and coordination. They also emphasized several aspects to be unique among women working in this field: to be very strict, to avoid sharing their personal life, to keep a strictly professional relationship in order to prevent any misunderstandings, to win respect and to know how to assert themselves.
Given knowledge of the data revealed in this research and due to the commitment with equality and inclusive economic development, the Spanish General Council of Technical Architecture (CGATE) developed and implemented in 2018 a survey on the status of women in the construction industry. It became the most complete survey, with the highest sample, and the most representative undertaken to date in this field. This survey was addressed to all individuals enrolled in their Technical Architecture and Building Engineering Professional Bodies in Spain, reaching a total of 1353 answers, with a female participation rate of more than 50%. Among the outcomes, it is noteworthy that most surveyors, technical architects and building engineers (60.4%) believed that the profession has evolved towards achieving equality in the last 10 years. Nevertheless, 59.1% of the total respondents considered that women were still facing challenges in entering the profession. In fact, of the women interviewed, 64.8% declared to have received inappropriate comments in the exercise of their work, 58.4% reported to have not felt properly treated by male colleagues having their same level of academic training, and 59.6% affirmed being discriminated against when carrying out their work at the building site [50].
After this introduction to the main issue before us, it has become evident that the barriers met by women when accessing jobs in the construction field are noticeable. In the survey designed in 2018 by the Spanish General Council of Technical Architecture (CGATE), respondents were asked about those facilitators encountered in their surroundings for the practice and continuity in their profession. This was done with a battery of items in a 1–10 scale to be measured according to the respondent’s perception [51]. The availability of such information led the present work team to wonder about the underlying dimensions for which the CGATE had asked its interviewees in the survey if these items could be grouped into categories of a greater abstract order, and if, moreover, there are differences in the results obtained according to sex. To answer these questions, exploratory factor analysis has been performed, the results of which have been subjected to analysis of variance (the Mann–Whitney U test).

2. Methodology

2.1. Procedure and Measures

Participants were a representative sample of the professionals belonging to associations of Official Colleges of Surveyors, Technical Architects and Building Engineers in Spain (49,821 members), conforming to the database of the Spanish General Council of Technical Architecture [52]. A total of 1353 interviews were conducted, 659 were men (48.7%) and 694 women (51.3%), see Table 1. In that way, the sample was uniformly distributed by sex, although in relation to the data offered by CGATE about the total number of members, in 2018, 79.17% of members in Spain were men (39,302) and 20.83% were women (10,341). The reason for this sampling design lies in the desire to achieve a better approximation to the opinion of women working in this profession. Therefore, more weight should be lent to the sample in order to reach them. Assuming simple random sampling and in the most unfavorable hypothesis being p = q = 0.5, the sampling error for the total sampling is ±2.7%. For men, the sampling error is ±3.9% and ±3.8% for women.
The method of administration of the aforementioned tool was carried out by computer-assisted web interviewing (CAWI). The information gathering was collected between September and December 2018 and the CGATE was in charge of this task. The questionnaire was composed of 39 closed questions, five of which focus on socio–demographic characteristics of participants. In the questionnaire design, a 1–10 scale, where 1 means “less important” and 10 “most important” with 10 items being used. The respondent was asked to choose to what extent he considered that each item facilitated the exercise and continuity in the technical architecture profession. Before conducting bivariate and multivariate analysis on them, we wanted to know the descriptive statistics as well as the reliability of the scales employed. It is worth noting that, among the 1353 respondents of the sample, only those that answered everything (1282) were going to be taken into account; 71 cases presented missing values, the reason why they have been excluded. Secondly, measures in each item range between 4.24 and 7.07, values representing the items “being a woman” and “work capacity”, respectively.

2.2. Data Analysis

Data mining was carried out with the statistical package SPSS (version 25.0) in three steps. Firstly, the sample characterization takes place. Therefore, a bivariate analysis, where sex is related to the rest of the sociodemographic variables, was conducted. Secondly, an in-depth study of the 10 items is undertaken: its reliability as a whole—according to Cronbach’s α test—and the average score. The objective was on the one hand to know the average score by sex in these variables and, on the other, to discover if the differences in these scores were statistically significant. As the normal distribution assumption was not met, the Mann–Whitney U test was applied.
Thirdly, an exploratory factor analysis was undertaken with the aim of identifying the structures and dimensions under these items. As an extraction method, it was used the principal component analysis with Varimax rotation. The reasons why this factor model, set out below, were accepted were the following:
(1)
size of the determinant of the correlation matrix,
(2)
Kaiser, Meyer and Olkin (KMO) measure of sampling adequacy,
(3)
the result in Bartlett’s test of sphericity,
(4)
values on the diagonal of the anti–image correlation matrix,
(5)
communalities of variables or items,
(6)
total variance explained, and
(7)
the percentage of non-redundant residuals in the reproduced correlation matrix [53,54].
Finally, having obtained dimensions or factors, the aim was to know individuals reactions regarding their socio–demographic characteristics, stressing the gender perspective. For this reason, and since the factors achieved are quantitative variables, a mean difference study with independent samples is implemented. As the normal distribution assumption was not met, the Mann–Whitney U test and the Kruskal–Wallis tests were applied [55,56,57]. Figure 3 shows, in a schematic way, the process of analysis employed in this research.

3. Results and Discussion

3.1. Sample Characterization

As shown in Table 1, the bulk of the sample was aged between 30 and 50 (more than 60% of the sample). 9.6% being under 30 years of age and 6.4% over 60 years of age. In relation to the exercise of the building engineer profession, 59.5% carry on their profession on a self–employed basis, followed by 28.9% who work as an employee for others. Regarding monthly revenue, more than 50% of the sample earn between 1000 and 2000 €, although it should be noted that, over a quarter of the sample (20.6%) are paid less than 1000 € per month. Lastly, 58.4% of the sample declare having children, versus 41.6% who declare not having them.
When disaggregating the data according to the sex variable, in terms of age, it stands out that in the age groups over 51 years there is a higher presence of men than women (32.9% of men are over 51 years of age, compared to 10.1% of women). On the other hand, there is also a higher presence of women who work as an employee for others or as officials than of men. Regarding salary, a higher percentage of women is collected in the lower bands, e.g., 18.3% of women earn between €500 and €1000, compared to 12.5% of men who indicate the same interval. However, in the highest monthly income, there is a higher male presence, 9.6% of the men surveyed admit to being paid more than €3000, compared to 2.7% of the women surveyed. Furthermore, there are more men with children in the sample than women in the same situation (52.1% compared to 47.9%). It should be noted that all the frequency distributions obtained according to sex in the sociodemographic variables present statistically significant differences between men and women, according to the bivariate analysis carried out using the Chi-square test.

3.2. Reliability of the Scale and Items Analysis

Concerning the reliability tests of the scale, Cronbach’s α has been used [58]. For the 10 items, a very high α (0.841) was obtained. As can be seen in Table 2, for each variable and even if the item in question was removed, the α values would also remain very high when checking the reliability of the scale. For this reason, it can be asserted that the items of the questionnaire and the scale are highly reliable. As illustrated in Table 2, for men, “capacity of work” is the aspect that facilitates the most the exercise and continuity in the profession, with a mean of 7.19 out of 10, versus 6.93 for women. According to the opinion of female respondents, “experience” (7.35) is the item with the highest value and, therefore, this is the characteristic that they consider facilitates the most the exercise and continuity in the construction field. Concerning the variables that facilitate least the practice and continuity in the profession, women as well as men underline the fact of “being a woman”, with a mean of 4.15 in men and 4.28 in women. The four items most valued by the whole sample—experience, training, work capacity and flexible working hours—are also those identified by literature as the most valued characteristics in the selection processes, when being hired [13,22,25].
To assess whether or not these means are statistically significant, an analysis of the necessary assumptions is completed in order to carry out Student’s t-test. Any variable presents a normal distribution with respect to the Kolmogorov–Smirnov test (p < 0.001). This is the reason why the Student t-test is discarded in favour of the Mann–Whitney U test. This test displays that there are three characteristics where the differences between means in men and in women are statistically significant for a reliability level higher than 95%, as shown in Table 2. The first variable is “social contacts”, a variable in which men obtain higher scores than women, 6.18 and 5.86 respectively. Hence, men consider more important than women the social contacts for the profession. The second variable that reveals a statistically significant mean difference is “flexible working hours”. Women (7.15), more than men (6.83), consider that this is a characteristic that facilitates professional development in this field. Finally, the fact of being a man presents a more marked mean difference. Women (6.29) give more emphasis than men (4.79) to the fact that being a man is important to practice and continuity in the profession. These differences coincide with the findings from other studies, where the importance of homosocial behavior in the selection processes and men’s promotion are emphasized. The big barrier for carers and those in charge of chores to having flexible working hours so that they may continue with their professional career is also underlined [6,13,22,25].

3.3. Factor Analysis

To comply with the principle of parsimony that should guide any scientific analysis, the variable “being a woman” was removed. The reason is that asking whether being a man facilitates practice in the profession and whether being a woman facilitates practice in the profession are two ways to measure the same phenomenon, which would duplicate the information.
As outlined above, indicators for the appropriateness of this type of analysis with the available data and variables is reflected in (1) the determinant of the correlation matrix (0.017), very low and close to zero; (2) Kaiser, Meyer and Olkin (KMO) sampling adequacy measure, higher than 0.8–0.824 exactly; (3) the statistical significance for a reliability level of 99.9% in Bartlett’s test of sphericity (Chi-square = 5219.261, df = 16), information on the basis of which we can discard the null hypothesis about the correlations matrix as an identity matrix; (4) Values on the diagonal of the anti-image correlation matrix which assess the adequacy of each variable to the model, being between 0.632 (minimum value) and 0.912 (maximum value).
In regard to the fifth indicator of plausibility and adequacy to the model, that is, the commonalities, and as reflected in Table 3, all the variables included in the model have high scores (being 0.830 the highest commonality, and 0.618 the lowest). Hence, they are sufficiently explained with the three factors model; a model that explains 74.13% of the total variance, being this one the sixth indicator of the goodness of fit test (see Table 4). Lastly, the residual percentage in the reproduced correlation matrix with values higher than 0.1 is 8% (3 cases). Thus, the stability of the model is confirmed.
As to the interpretation of the three factors extracted, factor 1 could be named as the dimension work competences, factor that explains 37.44% of the variance after the Varimax rotation, see Table 4. It is characterized by high values in “working capacity”, “flexible working hours”, “experience”, “training” and “personality” (see Table 5). Those individuals having high scores in factor 1 are the same individuals that considered that the mentioned variables facilitate to a great extent the exercise and continuity in the Building engineering profession. With respect to the second factor or underlying dimension in the analyzed items, appointed as Social capital, it explains 18.83% of variance (after Varimax rotation) and it is characterized by high scores in the items “family contacts” and “social contacts”. Individuals or groups of people with high scores in this factor consider that having family and social contacts facilitate the exercise and continuity in the Surveyor profession. Finally, factor 3, physical appearance and being a man, explains 17.86% of the variance after Varimax rotation. It is composed of the items “physical appearance” and “being a man”. In this way, individuals or groups of people that have high scores in this factor believe that the physical appearance and the fact of being a man are features that facilitate practice and continuity in the surveyor profession in Spain.

3.4. Characterization of the Factors: An Exhaustive Analysis through Gender

Factors generated in the factor analysis are quantitative variables (mean = 0 and standard deviation = 1). Therefore, the interpretation of results should be undertaken taking into account those scores. When the group mean in a factor is higher than 0, it means that the score is over the total mean of the sample, whereas when the mean is lower than 0, it means that it is below. As variables are quantitative, the Student’s t-test or the analysis of variance (ANOVA) should be employed in order to find the mean differences of different sorting groups. Nonetheless, the three dimensions or factors obtained in the factor analysis do not follow the normal distribution assumption (Kolmogorov–Smirnov test, p < 0.001). Hence, non–parametric tests were implemented. In those cases where the categorical variable or group is made of two categories, the Mann–Whitney U test was applied for independent samples. When there were three or more groups or categories, the Kruskal–Wallis test was used for independent samples [59].
In mean differences concerning factors by gender (see Table 6), it is observed that men have higher scores in the two first factors—work competences and social capital—, although the differences in the same factors in women are not statistically significant. However, in the third factor (physical appearance and being a man), women present higher scores, reason why this difference is statistically significant. The significance of the differences between means in factor 3 confirms the result provided by literature. This result indicates how aware women are in this field about the fact of being a man as a characteristic that facilitates the career path in the construction sector [6,12,22,23,25].
In Table 7, Table 8 and Table 9 mean differences in each factor have been analyzed in a detailed manner; first in men and second in women, through a case selection. Once men were selected, the possible differences between them in relation to their age, the way in which they exercise the profession, their income and the fact of having children were studied. The same procedure was followed with women. Moreover, in these tables, it was indicated whether or not the differences within each genre are statistically significant. This was carried out through the Kruskal–Wallis statistic test or the Mann–Whitney U test. In order to render interpretation easier, symbols or were added to indicate the average score that was the highest or the lowest, respectively.
With respect to factor 1 (see Table 7), it is observed that the youngest men and women of the sample consider that work competences (factor 1) facilitate the exercise and continuity in the Technical Architecture profession, whereas older men and women think otherwise. The differences found according to the age are statistically significant in men and in women. Regarding the way in which the profession is carried out, there are no significant differences between men and women. In the case of men, those that work as officials or similar gain the highest scores. This means that, to a great extent, they contemplate work competences as a facilitator, against those that work as salaried employees that have the lowest scores. In relation to the monthly income, men and women having the highest salary consider to a great extent that this first factor facilitates the continuity in the profession, whereas those men earning less than 500 € per month do not deem work competences as important for practice and continuity in the profession. The score differences concerning the monthly income in men in the first factor are statistically significant. In the case of women, the reliability level in the differences found exceeds 99.9%: women with higher salaries are those that, to a great extent, find relevant this first factor. Those women having a lower score receive a monthly salary of between 500 and 1000 €. Finally, men having children achieve higher scores than those who do not have, although these differences are not statistically significant. The same happens in the case of women. These results indicate the importance of having work competences when entering the labour market in order to successfully overcome the selection processes, to progress and to succeed in the field, as pointed out in literature [13,22,23].
In the analysis of the second factor, Table 8, the importance of social capital (items: family and social contacts) for the exercise and continuity in the profession), it should be noted that, in the case of men, those aged between 30 and 40 years old present the highest scores, in contrast to the older group (60 years old and more), who obtain the lowest scores. These differences are statistically significant in a reliability level higher than 99.0%. In the case of women, the situation changes dramatically. Those being older deem social capital as the factor that facilitates practice and continuity in the profession whereas those that do not consider it that way are between 50 and 60, that is, we find statistically significant differences. Once more, as in the first factor, in the dimension social capital, there are no mean differences statistically significant in any groups in the way in which the profession is carried out. In both sexes, those individuals that work as salaried employees are those who believe that family and social contacts facilitate the most the exercise and continuity in the technical architecture profession. With respect to salary, in the case of men, mean differences according to the income level are statistically significant. Men with salaries between 500 and 1001 € belong to the group that deem social capital as the most important factor in the exercise of their profession, against those men earning wages of more than 3000 €, who scored lower this dimension. In the case of women, means differences in regard to the monthly income are statistically significant. Those women with salaries between 1001 and 1500 € consider contacts as the most meaningful factor in the exercise of the profession. Nevertheless, those receiving higher salaries (2001–3000 €) recognize contacts as the least important. Men who do not have children, as opposed to those having them, deem social capital as the most relevant factor in the exercise and continuity of the profession—differences that are statistically significant. This same situation also occurs with women, as those who do not have children get higher scores in factor 2. Once more, these means show the relation between social capital and opportunities not only to enter the profession but also to stay and be promoted or to improve the professional path [4,6,10,13,22,23,30,31,32,33].
Finally, concerning the detailed characterization of factor 3 (physical appearance and being a man, Table 9), the first remark is that any of the comparison within sex groups, with the exception of age differences in men, are statistically significant. A second noteworthy question is that the characterization of men and women’s opinion behaves in a different way when analyzing age and income. In the case of age, in the men, those being 60 or more, consider to a great extent that physical appearance and the fact of being a man facilitate continuity and practice in the profession (the only statistically significant difference). However, in the case of women, the youngest ones recognize physical appearance and the fact of being a man as the most important factors that facilitate practice and continuity in the profession. When analyzing the monthly income, there is a similar situation. Men with higher salaries (between 2001 and 3000 €) deem this factor as the most important, in the case of women, those earning less than 500 € per month believe that physical appearance and being a man facilitate the most practice in the profession.

4. Conclusions

In the first place, certain differences have been observed between the features of the men and women that make up the sample analyzed. Although there is an equitable distribution by sex in the sample, there are more men over 50 years of age practicing the profession than women of the same age, being a first indicator of the difficulty of the latter to remain in the profession (see Table 1). The higher presence of men in the free exercise of the profession, as self-employed, is also notable, than of women in the same employment situation, who practice the profession to a higher extent as wage earners or civil servants. This in turn could indicate the difficulty of women in this area for entrepreneurship. On the other hand, in the analysis that characterizes the sample, it is observed how there is a higher accumulation of men with children than women in the same condition. This result, again, reinforces the conclusions indicated by the literature, which indicates that motherhood is a problem for the exercise of the profession in women, as they are in charge of raising children to a higher extent [2,10,13,22,23,27,28].
The analysis of the mean scores for each sex in the 10 items that make up the scale applied by the CGATE (Table 2) reveals that for women, the most important aspect for the exercise of the profession is “flexible working hours”. This is another issue already mentioned in the literature, where it is pointed out that, in general, the construction sector entails working hours that are only with difficultly compatible with family responsibilities and the care of third parties [2,6,13,22,25], so the women surveyed would once again be highlighting the need to be able to reconcile private and family life with work. Another aspect that this analysis includes is that for men, having “social contacts” is the most important aspect for practice in the profession. Again, this result is linked to the reviewed scientific literature, since it indicates how contact networks become an essential asset in the hiring and promotion of people and projects in the construction sector, and that the main beneficiaries of these networks are those who possess them: men [4,6,10,13,22,23,30,31,32,33].
With respect to the dimensions found in this research and in order to recapitulate the results that are statistically significant, Table 10 is presented. It reflects that factor 1, work competences, is a dimension that is contemplated as a facilitator of the exercise and continuity in the Technical Architecture profession by men under age 30, men having salaries superior to 3000 € and the youngest women. In regard to factor 2, social capital, it is the dimension most considered as a facilitator of the job in the construction sector by men between 30 and 40, men receiving salaries between 500 and 1000 € per month, men and women without children, women over the age of 60 and those women with monthly salaries between 1001 and 1500 €. Finally, factor 3, physical appearance and being a man, is a dimension seen as a facilitator of the profession by all women (general sample of women) and by men over the age of 60.
Thus, this work shows an incipient profile of professionals according to the assessment of the factors found in this research. This profile should be analyzed in-depth in future research to confirm the information obtained. In the first place, the respondents who consider job skills as the most important aspect for the performance of the profession are the youngest. This leads us to wonder about the relationship of this assessment with its vital moment: insertion in the labor market. In turn, this aspect is also positively valued by the men who earn the most money each month, an aspect that may be related to the hiring logic. On the other hand, in the case of social capital, men of intermediate ages, without children and with low salaries are those who most value this dimension, probably intending to improve their employment situation. However, the profile of women in this factor changes notably, since it is the older ones, with low to middle salaries and without children who consider social capital important for the exercise of the profession, possibly motivated by the need to maintain their employment status. In the case of the third factor, it is the group of women in the sample (without differences according to the sociodemographic characteristics studied) who consider the physical appearance and the fact of being a man most important for the exercise of the profession, an opinion that coincides with men over 60 years of age. This question leads us to ask ourselves whether women feel higher pressure about their physical appearance, for meeting hegemonic beauty criteria and, therefore, believe that if they meet that social requirement if they accumulate erotic capital in the words of Hakim [60,61] they are more likely to be valued at work.
Be that as it may, this research reveals two relevant issues to take into account in the achievement of gender equality in the construction sector in Spain. On the one hand, the current composition of the workforce in this sector is analyzed, observing how, in addition to having a high difference in the percentage of labor insertion (remember that it did not reach 10% in the case of women), the sector does not seem to allow men and women who work in it to build vital projects equally. Such a suspicion is deduced from the bivariate analysis carried out in the characterization of the sample because if it were the case if vital projects could be built equally, we would not find statistically significant differences between the sexes in base variables such as age, employment status, monthly salary or having children or not. Statistics tell us (and remind us) that these differences found in the analysis are not due to chance, but rather that there are cultural and social conditions that lead to this situation.
Secondly, it has been observed that women and men have different opinions about what is or is not important to practice in the profession in the construction sector. This in turn, in line with the previous conclusion, leads us to trust the revised scientific literature and the warning that it makes of the existence of preconceived ideas, myths, and stereotypes that may still be immersed in the mentality today of an important group of construction workers. These myths or stereotypes, which discriminate against women and ultimately expel them from the sector, are reflected in different aspects. For example, in the exclusivity of contact networks, a fundamental aspect for the exercise of the profession, as indicated by those surveyed by the CGATE, but also in the distrust of a female project manager [13,15]. Thus, what is fundamentally touted as the major cause of discrimination against women in the construction sector is the prevailing gender socialization model, by which certain roles and capacities are associated with one of the genders to detriment of the other. This model of socialization ends up being a very large determinant of the person’s possibilities, acting on her own decisions, but also on those of her environment [10,12,15,19,20,21,22,23,24]. Faced with this scenario, the scientific community, with the support of science and research, must commit itself to the recognition of myths and false beliefs about the physical and intellectual capacities of the gender, for the eradication of inequalities based on beliefs without a scientific basis. Furthermore, present-day society, as mentioned in the introduction, is committed to the Sustainable Development Goals, in the quest of a fairer and more democratic world. As concluded in this research, the construction sector requires extensive efforts to come closer to the goals proposed by the United Nations in its 2030 Agenda. These goals are the action plans designed to give effect to human rights [11]. The inequalities found in the construction market indicate discrimination against women, which hinders and denies them equal access to employment. This, indubitably, has an effect on the comprehensive development of nations [62].

Author Contributions

Conceptualization, I.R.-E., D.F.; methodology, I.R.-E.; software, I.R.-E.; validation, I.R.-E., D.F. and C.M.; formal analysis, I.R.-E.; investigation, I.R.-E.; resources, C.M.; data curation, I.R.-E.; writing—original draft preparation, I.R.-E.; writing—review and editing D.F. and G.D.; visualization, I.R.-E.; supervision, D.F. and C.M.; project administration, C.M.; funding acquisition, C.M. All authors have read and agreed to the published version of the manuscript.

Funding

This research received no external funding.

Institutional Review Board Statement

The ethical review and approval of this study was waived, due to the database from which the research is carried out was produced by the Spanish General Council of Technical Architecture (CGATE), after the informed consent of the participants to participate in the survey.

Informed Consent Statement

Informed consent was obtained from all subjects involved in the study.

Data Availability Statement

Part of these results can be verified in: Spanish General Council of Technical Architecture (CGATE). Encuesta sobre igualdad de género. Todavía existen diferencias. CERCHA 2019, 139, 40–42. Available at: https://www.cgate.es/cercha/pdf/139.pdf (accessed on 13 May 2021).

Acknowledgments

Authors express their gratitude to the Spanish General Council of Technical Architecture. They designed and implemented the questionnaire and provided the data used in this research.

Conflicts of Interest

The authors declare no conflict of interest.

References

  1. Lansky, M.; Ghosh, J.; Méda, D.; Rani, U. Women, Gender and Work. Vol. 2: Social Choices and Inequalities; International Labour Office: Geneva, Switzerland, 2017. [Google Scholar]
  2. Infante-Perea, M.; Román-Onsalo, M.; Navarro-Astor, E. An early view of the barriers to entry and career development in Building Engineering. DYNA 2015, 82, 247–253. [Google Scholar] [CrossRef]
  3. EUROSTAT. Basic Breakdowns of Main GDP Aggregates and Employment (by Industry and by Assets). Available online: https://ec.europa.eu/eurostat/databrowser/view/NAMA_10_A10__custom_372461/default/table?lang=en (accessed on 18 December 2020).
  4. Clarke, L.; Pedersen, E.F.; Michielsens, E.; Susman, B. The european construction social partners: Gender equality in theory and practice. Eur. J. Ind. Relat. 2005, 11, 151–177. [Google Scholar] [CrossRef]
  5. Powell, A.; Sang, K.J. Equality, diversity and inclusion in the construction industry. Constr. Manag. Econ. 2013, 31, 795–801. [Google Scholar] [CrossRef]
  6. Sang, K.J.C.; Dainty, A.R.J.; Ison, S.G. Gender in the UK architectural profession: (Re) producing and challenging hegemonic masculinity. Work Employ. Soc. 2014, 28, 247–264. [Google Scholar] [CrossRef]
  7. French, E.; Strachan, G. Women at work! Evaluating equal employment policies and outcomes in construction. Equal. Divers. Incl. 2015, 34, 227–243. [Google Scholar] [CrossRef] [Green Version]
  8. French, E.; Strachan, G. Women in the construction industry. Still the outsiders. In Valuing People in Construction; Emuze, F., Smallwood, J., Eds.; Routledge: New York, NY, USA, 2018; pp. 151–171. [Google Scholar]
  9. Infante-Perea, M.; Román-Onsalo, M.; Navarro-Astor, E. Relationship between Gender Segregation and Students’ Occupational Preferences in Building Engineering. J. Prof. Issues Eng. Educ. Pract. 2019, 145. [Google Scholar] [CrossRef]
  10. Bridges, D.; Wulff, E.; Bamberry, L.; Krivokapic-Skoko, B.; Jenkins, S. Negotiating gender in the male-dominated skilled trades: A systematic literature review. Constr. Manag. Econ. 2020, 38. [Google Scholar] [CrossRef]
  11. General Assembly of the United Nations. Transforming our World: The 2030 Agenda for Sustainable Development (A/RES/70/1). 2015. Available online: https://www.unescwa.org/sites/www.unescwa.org/files/un_resolutions/a_res_70_1_e.pdf (accessed on 14 December 2020).
  12. Naoum, S.G.; Harris, J.; Rizzutp, J.; Egbu, C. Gender in the construction industry: Literature review and comparative survey of men’s and women’s perceptions in UK construction consultancies. J. Manag. Eng. 2020, 36. [Google Scholar] [CrossRef]
  13. Román-Onsalo, M.; Navarro-Astor, E.; Infante-Perea, M. Barreras de carrera en la industria de la construcción. In Proceedings of the V International University Congress, Sevilla, Spain, 3–4 July 2014. [Google Scholar]
  14. International Labour Organization (ILOSTAT). Employment by Sex, Economic Activity and Marital Status—Annual. Available online: https://www.ilo.org/shinyapps/bulkexplorer7/?lang=en&segment=indicator&id=EMP_TEMP_SEX_ECO_MTS_NB_A (accessed on 15 December 2020).
  15. Infante, M.; Román, M.; Traverso, J. The Spanish construction sector under gender perspective. Analysis of working conditions. Revista Construcción 2012, 11, 32–43. [Google Scholar] [CrossRef] [Green Version]
  16. Mariam, A.T.; Olalusi, O.B.; Haupt, T.C. A scientometric review and meta-analysis of the health and safety of women in construction: Structure and research trends. J. Eng. Des. Technol. 2020, 19. [Google Scholar] [CrossRef]
  17. United States Bureau of Labor Statistics. Women in the Labor Force: A Databook. Available online: https://www.bls.gov/opub/reports/womens-databook/2019/pdf/home.pdf (accessed on 15 December 2020).
  18. Dericks, G.H.; Phua, F.T.T. The occupational attractiveness of the built environment and the roles of individualism and collectivism: A hidden source of conflict and gender imbalance? Constr. Manag. Econ. 2020, 28. [Google Scholar] [CrossRef]
  19. Witt, S.D. The influence of Peers on Children’s Socialization to Gender Roles. Early Child Dev. Care 2000, 162, 1–7. [Google Scholar] [CrossRef]
  20. Saewyc, E. A global perspective on gender roles and identity. J. Adolesc. Health 2017, 61. [Google Scholar] [CrossRef] [PubMed] [Green Version]
  21. Reinking, A.; Martin, B. The Gender Gap in STEM Fields: Theories, Movements, and Ideas to Engage Girls in STEM. J. New Approaches Educ. Res. 2018, 7, 148–153. [Google Scholar] [CrossRef] [Green Version]
  22. Onsalo, M.R.; Paniagua, A.R.; Cortés, J.T. Barreras de género en el desarrollo profesional de mujeres técnicas de la Construcción. Revista Construcción 2013, 12, 87–99. [Google Scholar] [CrossRef] [Green Version]
  23. Coleman, M. Women leaders in the workplace: Perceptions of career barriers, facilitators and change. Ir. Educ. Stud. 2019, 39, 233–253. [Google Scholar] [CrossRef]
  24. Chew, Y.T.E.; Atay, E.; Bayraktaroglu, S. Female Engineers’ Happiness and Productivity in Organizations with Paternalistic Culture. J. Constr. Eng. Manag. 2020, 146, 05020005. [Google Scholar] [CrossRef]
  25. Enshassi, A.; Ihsen, S.; Al Hallaq, K. The perception of women engineers in the construction industry in Palestine. Eur. J. Eng. Educ. 2008, 33, 13–20. [Google Scholar] [CrossRef]
  26. Stockard, J.; McGee, J. Children’s occupational preferences: The influence of sex and perceptions of occupational characteristics. J. Vocat. Behav. 1990, 36, 287–303. [Google Scholar] [CrossRef]
  27. Dainty, A.R.J.; Bagilhole, B.M.; Neale, R.H. A grounded theory of women’s career under-achievement in large UK construction companies. Constr. Manag. Econ. 2000, 18, 239–250. [Google Scholar] [CrossRef]
  28. Navarro-Astor, E. Work-family balance issues among construction professionals in Spain. In Proceedings of the 27th Annual ARCOM Conference, Leeds, UK, 5–7 September 2011; Egbu, C., Lou, E.C.W., Eds.; Association of Researchers in Construction Management: Glasgow, UK; pp. 177–186.
  29. English, J.; Le Jeune, K. Do Professional Women and Tradeswomen in the South African Construction Industry Share Common Employment Barriers despite Progressive Government Legislation? J. Prof. Issues Eng. Educ. Pr. 2012, 138, 145–152. [Google Scholar] [CrossRef]
  30. Dainty, A.; Lingard, H. Indirect discrimination in construction organisations and the impact on women’s careers. J. Manag. Eng. 2006, 22, 108–118. [Google Scholar] [CrossRef]
  31. Solís Carcaño, R.G.; González Fajardo, J.A.; Pacheco Martínez, J. Estudio de egresados de Ingeniería Civil en una Universidad de México. Rev. Ing. Investig. 2006, 26, 129–134. [Google Scholar]
  32. Watts, J.H. Leaders of men: Women ‘managing’ in construction. Work Employ. Soc. 2009, 23, 512–530. [Google Scholar] [CrossRef] [Green Version]
  33. Hunte, R. Black Women and Race and Gender Tensions in the Trades. Peace Rev. 2016, 28, 436–443. [Google Scholar] [CrossRef]
  34. Infante-Perea, M.; Román-Onsalo, M.; Navarro-Astor, E. Expected Career Barriers in Building Engineering: Does Gender Matter? J. Women Minor. Sci. Eng. 2018, 24, 43–59. [Google Scholar] [CrossRef]
  35. Kumar, S.B.P. A study on psycho-social problems of women workers in construction sites: Special reference to Nellore town. St. J. Humanit. Soc. Sci. 2019, 5, 19–28. [Google Scholar]
  36. Navarro-Astor, E.; Román-Onsalo, M.; Infante-Perea, M. Women’s career development in the construction industry across 15 years: Main barriers. J. Eng. Des. Technol. 2017, 15, 199–221. [Google Scholar] [CrossRef]
  37. Krug, E.G.; Dahlberg, L.L.; Mercy, J.A.; Zwi, A.B.; Lozano, R. (Eds.) World Report on Violence and Health; World Health Organization (WHO): Geneva, Switzerland, 2002; p. 149. Available online: https://www.who.int/violence_injury_prevention/violence/world_report/chapters/en/, (accessed on 21 December 2020).
  38. Cáceres, J.I.; Escot, L.; Fernández, J.A.; Saiz, J.; Faculty of Economic and Business Sciences, Complutense University of Madrid. La segregación ocupacional y sectorial de la mujer en el mercado de trabajo español. Personal communication, 2004. [Google Scholar]
  39. Nicolás, C.; López, M.; Riquelme, P.J. La segregación ocupacional entre hombres y mujeres: Teorías explicativas y análisis de su evolución reciente en España. Proy. Soc. Rev. De Relac. Labor. 2010, 13, 38–62. [Google Scholar]
  40. Iglesias, C.; Llorente, R. Evolución reciente de la segregación laboral por género en España. Rev. Univ. Cienc. Trab. 2010, 11, 81–105. [Google Scholar]
  41. Torns, T.; Recio Cáceres, C. Las desigualdades de género en el mercado de trabajo: Entre la continuidad y la transformación. Rev. Econ. Crítica 2012, 14, 178–202. [Google Scholar]
  42. Dueñas Fernández, D.; Iglesias Fernández, C.; Llorente Heras, R. ¿Por qué las mujeres no se distribuyen de forma homogénea en el mercado de trabajo español? El efecto rechazo y el efecto atracción. El Trimest. Económico 2016, 33, 339–369. [Google Scholar] [CrossRef] [Green Version]
  43. López Martínez, M.; Nicolás Martínez, C.; Riquelme Perea, P.J.; Vives Ramírez, N. Análisis de la segregación ocupacional por género en España y la Unión Europea. Prism. Soc. Rev. De Cienc. Soc. 2019, 26, 159–182. [Google Scholar]
  44. Poelmans, S.A.; Chinchilla, N.; Cardona, P. The adoption of family-friendly HRM policies. Int. J. Manpow. 2003, 24, 128–147. [Google Scholar] [CrossRef]
  45. Prieto, C.; Pérez de Guzmán, S. Desigualdades laborales de género. Disponibilidad temporal y normatividad social. REIS 2013, 141, 113–132. [Google Scholar] [CrossRef]
  46. Ministry of Development (Spain). Mujeres Pioneras. Áreas de Actividad del Ministerio de Fomento. Available online: http://www.fomento.es/LIBROS_ESCANEADOS_WEB/2018_Mujeres_Pioneras.pdf (accessed on 6 December 2020).
  47. Obligado, C. Aparejadoras. CERCHA 2007, 88, 96. Available online: https://www.cgate.es/cercha/pdf/88.pdf (accessed on 17 November 2020).
  48. Technical University of Madrid. Matriculados en Titulaciones de Grado. Portal de Transparencia. Available online: https://transparencia.upm.es/sfs/PortalTransparencia/Estudiantes/Matriculados_por_titulacion/Matriculados_grados.pdf (accessed on 14 December 2020).
  49. Instituto Nacional de Estadística (INE). Encuesta de Población Activa. Available online: https://www.ine.es/jaxiT3/Tabla.htm?t=4885&L=0 (accessed on 14 December 2020).
  50. Consejo General de la Arquitectura Técnica de España (CGATE). Encuesta sobre igualdad de género. Todavía existen diferencias. CERCHA 2019, 139, 40–42. [Google Scholar]
  51. Consejo General de la Arquitectura Técnica de España (CGTAE). Encuesta Sobre la Igualdad de Género en la Profesión de la Arquitectura Técnica; CGTAE: Madrid, Spain, 2018; [No publicado].
  52. Consejo General de la Arquitectura Técnica de España (CGTAE). Distribución Número de Colegiados por Sexo-Anual; CGTAE: Madrid, Spain, 2018; [No publicado].
  53. Díaz de Rada, V. Técnicas Multivariantes de Interdependencia. Casos Reales y Prácticos de Investigación; Ra-Ma: Madrid, Spain, 2018. [Google Scholar]
  54. Méndez Martínez, C.; Rodón Sepúlveda, M.A. Introducción al análisis factorial exploratorio. Rev. Colomb. Psiquiatr. 2012, 41, 197–207. [Google Scholar] [CrossRef]
  55. Arditi, D.; Gluch, P.; Holmdahl, M. Managerial competencies of female and male managers in the Swedish construction industry. Constr. Manag. Econ. 2013, 31, 979–990. [Google Scholar] [CrossRef] [Green Version]
  56. Gil Flores, J.J.; Rodríguez Santero, J.; Perera Rodríguez, V.H. Introducción al Tratamiento Estadístico de Datos Mediante SPSS; Arial: Madrid, Spain, 2011. [Google Scholar]
  57. Sarrià-Arrufat, A.; Freixa Blanxart, M.; Guàrdia Olmos, J. Introducción a la Estadística en Psicología; Universitat de Barcelona: Barcelona, Spain, 1999. [Google Scholar]
  58. Cohen, R.J.; Swerdlik, M.E. Pruebas y Evaluación Psicológicas. Introducción a las Pruebas y a la Medición; McGraw Hill: New York, NY, USA, 2001. [Google Scholar]
  59. Pardo, A.; San Martín, R. Análisis de Datos en Ciencias Sociales y de la Salud II; Síntesis: Madrid, Spain, 2015. [Google Scholar]
  60. Hakim, C. Erotic Capital. Eur. Sociol. Rev. 2010, 26, 499–518. [Google Scholar] [CrossRef] [Green Version]
  61. Hakim, C. Erotic Capital: The Power of Attraction in the Boardroom and the Bedroom; Basic Books: New York, NY, USA, 2011. [Google Scholar]
  62. UN Women. Are you Ready for Change? Gender Equality Attitudes Study. 2019. Available online: https://www.unwomen.org/-/media/headquarters/attachments/sections/library/publications/2020/research-paper-are-you-ready-for-change-gender-equality-attitudes-study-2019-en.pdf?la=en&vs=5023 (accessed on 29 April 2021).
Figure 1. Percentage of women enrolled in architecture, building engineering or civil engineering in the Universidad Politécnica de Madrid [48].
Sustainability 13 05514 g001
Figure 2. Percentage of women employed in each field in the Spanish labour market [49].
Sustainability 13 05514 g002
Figure 3. Diagram of the data analysis process.
Sustainability 13 05514 g003
Table 1. Socio-demographic characteristics of the sample.
Total SampleMenWomenχ2φ/Cramer’s V
N%N%N%
Total1353 659 694
Age 124.590 ***0.303
<30 Years1309.6395.99113.1
30–40 Years41330.518027.323333.6
41–50 Years52338.722333.830043.2
51–60 Years 20114.913921.1628.9
>60 Years 866.47811.881.2
Exercise of the profession 33.803 ***0.158
Salaried employee38228.214321.723934.4
Official or similar16612.37311.19313.4
Self–employed80559.544355.036245.0
Monthly income 48.170 ***0.186
<500 €705.2304.6405.8
500–1000 €20915.48212.512718.3
1001–1500 €39729.317326.322432.3
1501–2000 €34525.516525.118026.0
2001–3000 €24818.314522.010314.9
>3000 €826.1639.6192.7
Having children 8.504 **0.079
Yes78958.441152.137847.9
No56341.624837.631556.0
Note. *** p < 0.001; ** p < 0.01; Source: Own elaboration based on CGATE data [51].
Table 2. Mean difference in the questionnaire items by gender.
ItemsαOverall SampleMenWomen
nMSDMSDMSD
Family contacts0.84312825.782.6095.662.555.852.69
Social contacts0.83412826.022.3286.18 *2.225.86 *2.42
Work capacity0.82212827.072.1517.191.996.932.30
Flexible working hours0.81912827.012.1356.83 ***2.017.15 ***2.23
Experience0.81712827.432.1217.461.977.352.28
Training0.82312827.092.1257.182.006.982.25
Physical appearance0.82412825.002.2644.882.175.082.36
Personality0.81612827.062.0227.071.896.992.17
Male0.83712825.562.7754.79 ***2.506.29 ***2.83
Female0.82912824.242.2194.152.134.282.29
Note: the test used for the mean difference is the Mann–Whitney U test. M = Mean, SD = Standard Deviation. *** p < 0.001; * p < 0.05. Source: Own elaboration based on CGATE data [51].
Table 3. Items communalities in factor analyses.
ItemsExtraction
Family contacts0.819
Social contacts0.830
Working capacity0.773
Flexible working hours0.618
Experience0.756
Training0.764
Physical appearance0.683
Personality0.647
Male0.781
Source: Own elaboration based on CGATE data [51].
Table 4. Total variance explained with the factor model.
Extraction
UnrotatedVarimax Rotation
FactorEigenvalue% of Variance % of Variance % Cumulative Variance
Factor 14.08245.35637.43737.437
Factor 21.55317.25618.83356.270
Factor 31.03611.51517.85774.127
Source: Own elaboration based on CGATE data [51].
Table 5. Rotated factor matrix.
ItemsFactor 1Factor 2Factor 3
Family contacts0.0410.8850.184
Social contacts0.1940.8860.085
Working capacity0.8700.127−0.001
Flexible working hours0.7220.0960.295
Experience0.8520.1240.123
Training0.8710.0140.077
Physical appearance0.2660.2430.744
Personality0.7000.1560.366
Male0.0840.0610.878
Source: Own elaboration based on CGATE data [51].
Table 6. Mean differences in each factor by gender.
FactorSexM95% CISDStandardized Mann–Whitney U Test
LlowerLupper
Factor 1Men0.066−0.0060.1380.925−1.655
Women−0.063−0.1450.0181.064
Factor 2Men0.058−0.0170.1320.956−1.176
Women−0.055−0.1350.0241.038
Factor 3Men−0.245−0.315−0.1750.9009.287 ***
Women0.2360.1570.3151.035
Note. M = Mean, SD = Standard Deviation, CI = Confidence Interval. *** p < 0.001. Source: Own elaboration based on CGATE data [51].
Table 7. Mean differences in factor 1 according to socio–demographic features.
MenWomen
NM (SD)Kruskal–Wallis 1NM (SD)Kruskal–Wallis 1
Factor 1: Work competences
Age
<30 Years 390.203 (1.033)9.363 *910.121 (0.895)13.378 **
30–40 Years 1800.128 (0.857)233−0.241 (1.104)
41–50 Years 2230.066 (0.968)3000.033 (1.032)
51–60 Years 1390.049 (0.923)62−0.056 (1.177)
>60 Years 78−0.139 (0.890)8−0.612 (1.247)
Exercise of the profession
Salaried employee143−0.045 (0.904)3.046239−0.092 (1.094)0.106
Official or similar730.105 (0.876)93−0.081 (1.084)
Self–employed4430.095 (0.939)362−0.040 (1.041)
Monthly income
<500 €30−0.236 (1.127)18.199 **40–0.249 (1.268)37.298 ***
500–1000 €82−0.066 (0.902)127−0.259 (1.127)
1001–1500 €173−0.019 (0.995)224−0.091 (0.995)
1501–2000 €1650.143 (0.893)180−0.169 (1.092)
2001–3000 €1450.046 (0.891)1030.371 (0.877)
>3000 €630.438 (0.709)190.781 (0.453)
Having children
Yes4110.086 (0.916)−0.662378−0.53 (1.064)−0.375
No2480.031 (0.943)315−0.076 (1.065)
Note. (1) In the variable “having children”, the test used for the mean differences is the Mann–Whitney U test. M = Mean, SD = Standard Deviation. *** p < 0.001; ** p < 0.01; * p < 0.05; () the highest average y () the lowest average. Source: Own elaboration based on CGATE data [51].
Table 8. Mean differences in factor 2 according to socio–demographic features.
MenWomen
NM (SD)Kruskal–Wallis 1NM (SD)Kruskal–Wallis 1
Factor 2: Social capital
Age
<30 Years 390.211 (0.943)19.343 ***910.259 (0.843)26.443 ***
30–40 Years 1800.252 (0.906)2330.093 (1.016)
41–50 Years 2230.097 (0.932)300−0.184 (1.070)
51–60 Years 139−0.167 (0.986)62−0.504 (1.052)
>60 Years 78−0.201 (0.981)80.294 (0.455)
Exercise of the profession
Salaried employee1430.177 (0.950)2.4652390.024 (1.014)2.915
Official or similar730.034 (0.821)93−0.206 (1.065)
Self–employed4430.023 (0.977)362−0.068 (1.045)
Monthly income
<500 €300.096 (1.048)12.348 *400.079 (1.070)16.511 **
500–1000 €820.216 (1.058)1270.036 (0.957)
1001–1500 €1730.151 (0.969)2240.113 (0.998)
1501–2000 €1650.107 (0.905)180−0.207 (1.083)
2001–3000 €145−0.084 (0.876)103−0.329 (1.057)
>3000 €63−0.216 (0.983)19−0.006 (1.073)
Having children
Yes4110.007 (0.948)2.299 *378−0.128 (1.056)2.070 *
No2480.145 (0.965)3150.033 (1.012)
Note. (1) In the variable “Having children”, the test used for the mean differences is the Mann–Whitney U test. M = Mean, SD = Standard Deviation *** p < 0.001; ** p < 0.01; * p < 0.05; () the highest average and () the lowest average. Source: Own elaboration based on CGATE data [51].
Table 9. Mean differences in factor 3 according to socio–demographic features.
MenWomen
NM (SD)Kruskal–Wallis 1NM (SD)Kruskal–Wallis 1
Factor 3: Physical appearance and being a man
Age
<30 Years39−0.325 (0.965)9.355 *910.332 (1.009)5.192
30–40 Years180−0.134 (0.935)2330.148 (1.074)
41–50 Years223−0.315 (0.871)3000.302 (1.003)
51–60 Years139−0.352 (0.875)620.152 (1.092)
>60 Years78−0.042 (0.868)8−0.089 (0.765)
Exercise of the profession
Salaried employee143−0.193 (0.829)0.3502390.338 (1.040)3.507
Official or similar73−0.223 (0.890)930.211 (1.055)
Self–employed443−0.265 (0.924)3620.176 (1.025)
Monthly income
<500 €30−0.424 (0.993)4.278400.422 (0.916)10.487
500–1000 €82−0.339 (0.955)1270.247 (0.995)
1001–1500 €173−0.231 (0.920)2240.351 (0.991)
1501–2000 €165−0.278 (0.925)1800.187 (1.095)
2001–3000 €145−0.105 (0.836)1030.048 (1.061)
>3000 €63–0.314 (0.787)19−0.163 (1.215)
Having children
Yes411−0.261 (0.886)0.5813780.226 (1.044)0.203
No248−0.217 (0.924)3150.248 (1.026)
Note. (1) In the variable “Having children”, the test used for the mean differences is the Mann–Whitney U test. M = Mean, SD = Standard Deviation. p < 0.05; () the highest average y () the lowest average. Source: Own elaboration based on CGATE data [51].
Table 10. Socio-demographic characteristics with higher scores and statistically significant.
Factor 1Factor 2Factor 3
Men (<30 Years)Men (30–40 Years)Women (general sample)
Men (>3000 €)Men (500–1000 €)Men (>60 Years)
Women (<30 Years)Men (No children)
Women (>60 Years)
Women (1001–1500 €)
Women (No children)
Source: Own elaboration based on CGATE data [51].
Publisher’s Note: MDPI stays neutral with regard to jurisdictional claims in published maps and institutional affiliations.

