Sustainability of Agricultural Crop Policies in Rwanda: An Integrated Cost–Benefit Analysis


Abstract
:1. Introduction
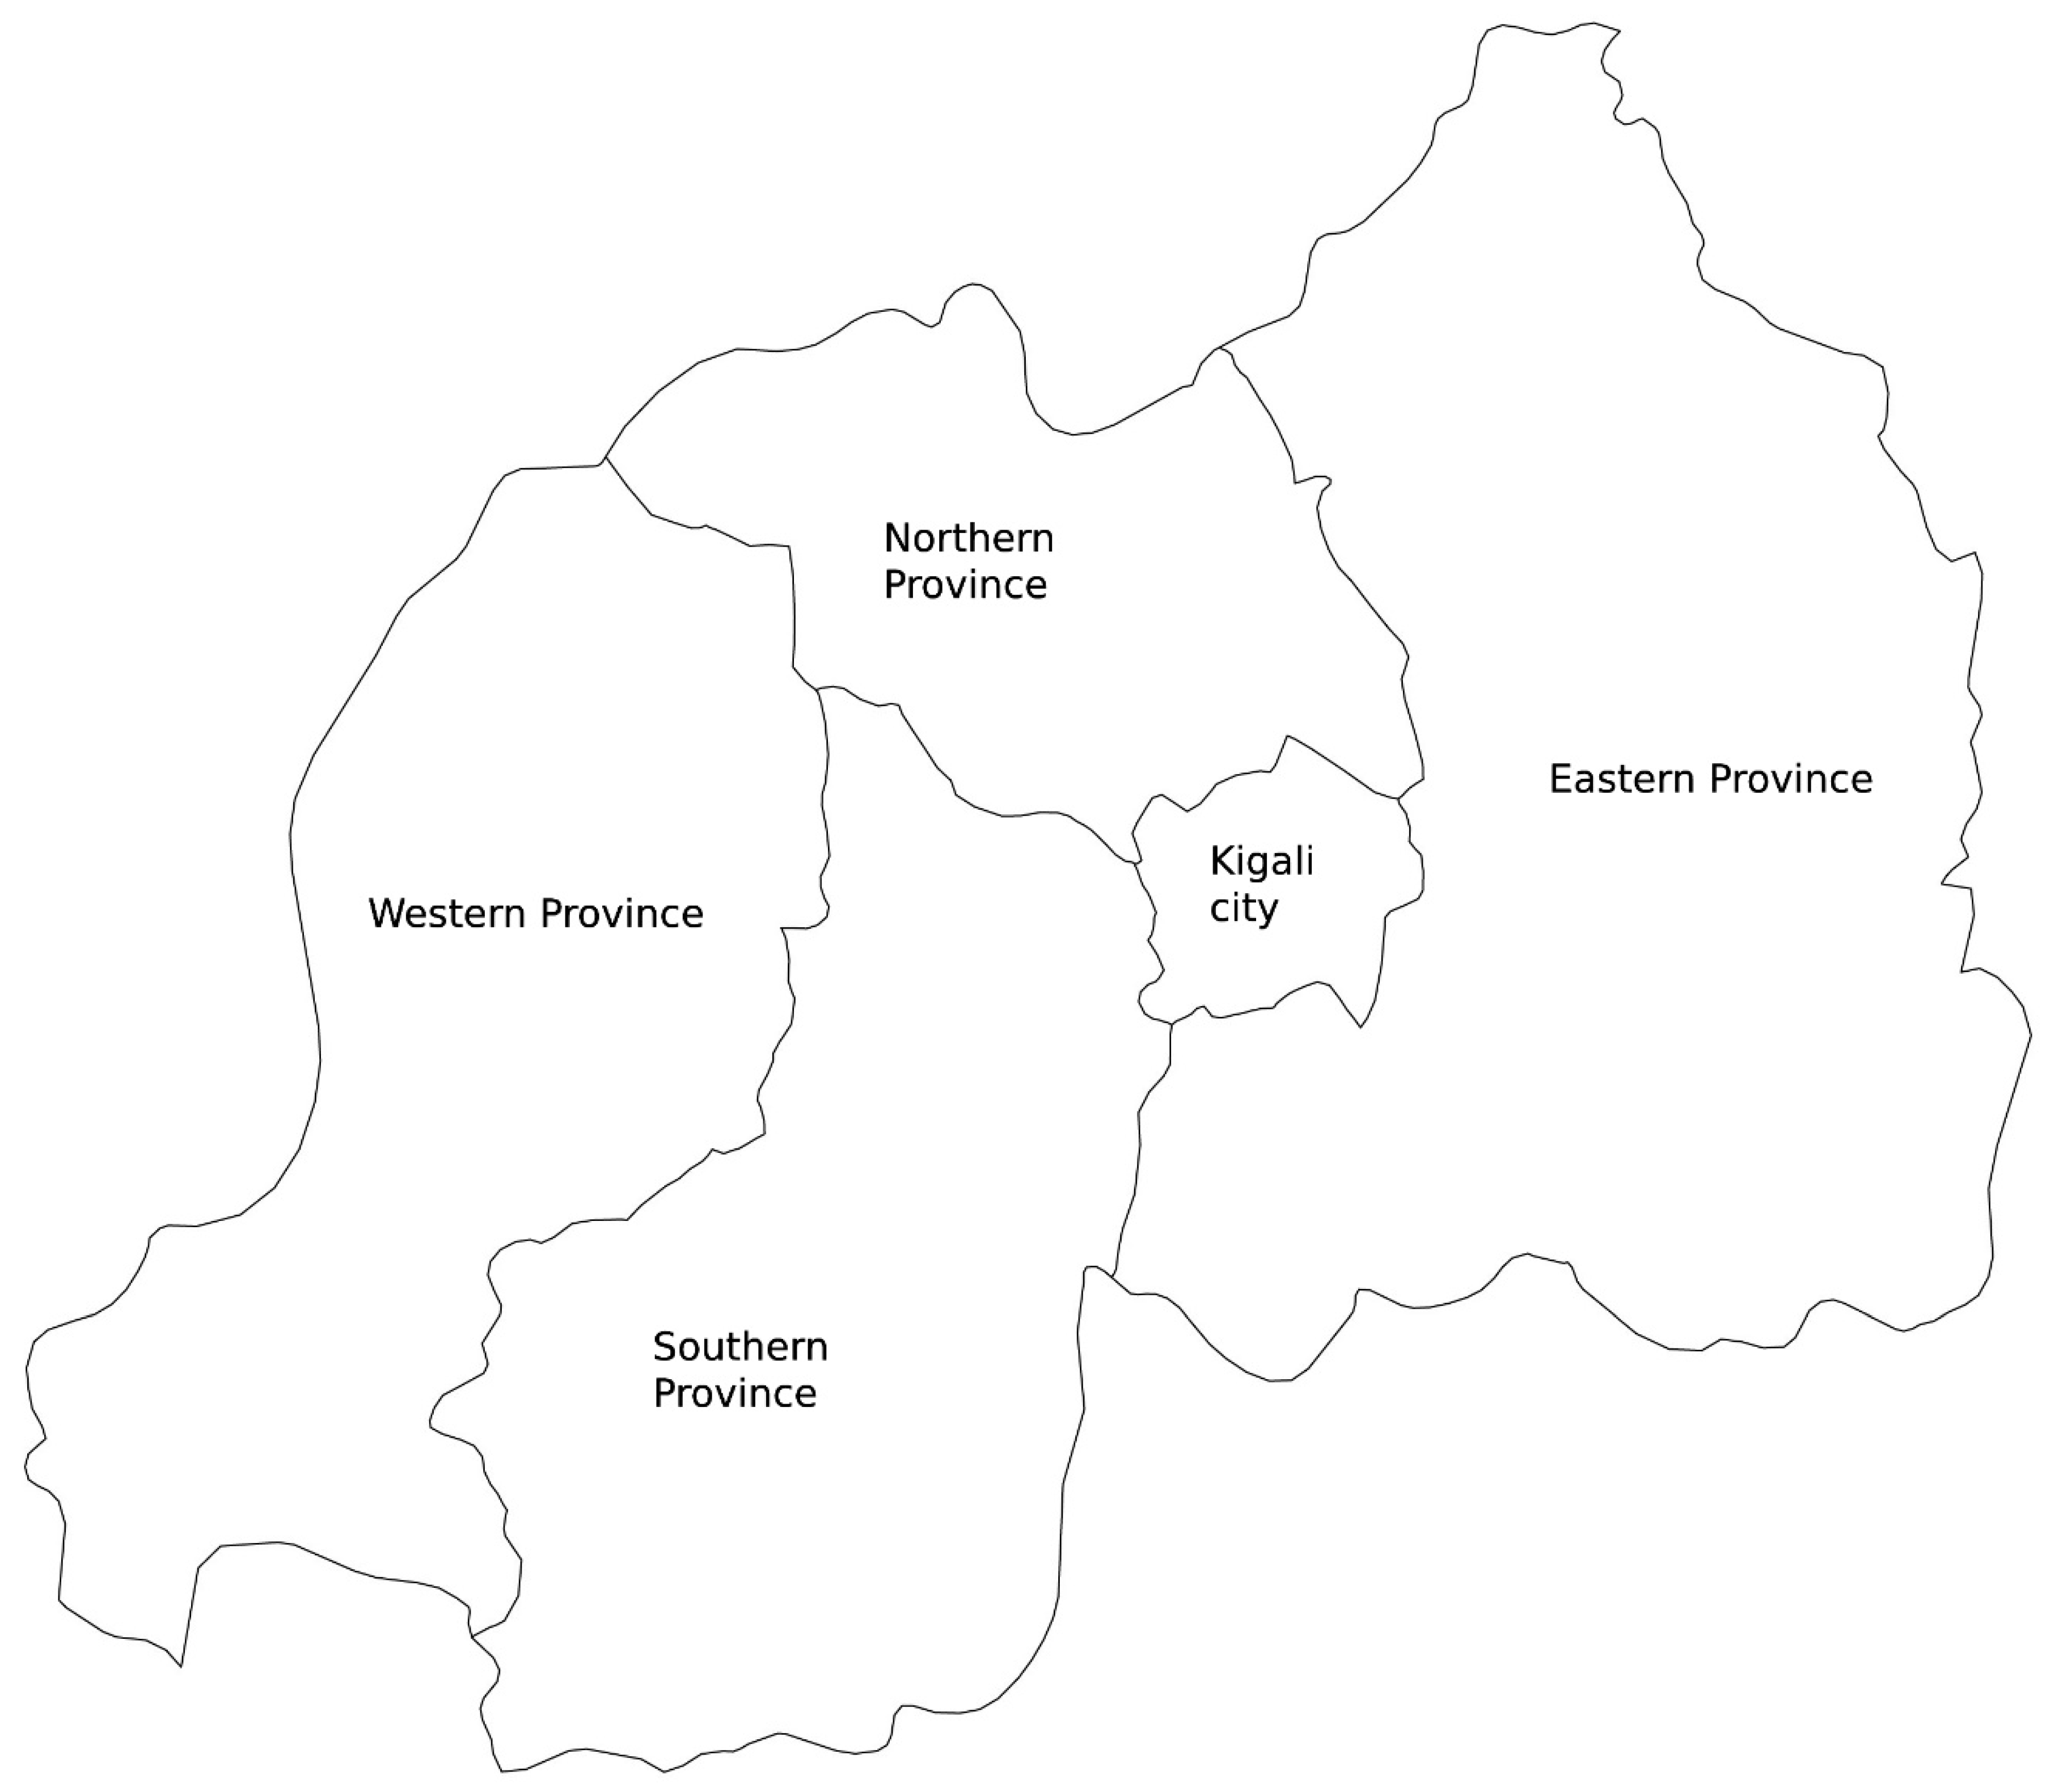
2. Area of Study
2.1. Crop Intensification Program (CIP)
2.2. Land Usage
3. Methodology and Data
3.1. Farmers’ Perspective: Financial Profitability
3.2. Country’s Perspective: Economic Valuation
3.3. Stakeholder Analysis: Distributive Impacts
4. Empirical Results and Discussions
4.1. Beans
4.2. Cassava
4.3. Maize
4.4. Potato
4.5. Rice
4.6. Soybean
4.7. Wheat
5. Conclusions and Policy Recommendations
Author Contributions
Funding
Institutional Review Board Statement
Informed Consent Statement
Data Availability Statement
Acknowledgments
Conflicts of Interest
References
- Ministry of Finance and Economic Planning, Republic of Rwanda. Rwanda Vision 2020–Revised 2012. Kigali, 2012. Available online: http://www.minecofin.gov.rw/fileadmin/templates/documents/NDPR/Vision_2020_.pdf (accessed on 3 December 2020).
- Ansoms, A.; Cioffo, G.; Dawson, N.; Desiere, S.; Huggins, C.; Leegwater, M.; Murison, J.; Bisoka, A.N.; Treidl, J.; Damme, J.V. The Rwandan agrarian and land sector modernisation: Confronting macro performance with lived experiences on the ground. Rev. Afr. Political Econ. 2018, 45, 408–431. [Google Scholar] [CrossRef] [Green Version]
- Bugingo, I.; Interayamahanga, R. A Study on the Development and Use of Governance Indicators in Rwanda; Institute of Research and Dialogue for Peace: Kigali, Rwanda, 2010. [Google Scholar]
- Klingebiel, S.; Gonsior, V.; Jakobs, F.; Nikitka, M. Case Study: Imihigo—A Traditional Rwandan Concept as a RBApp. In Public Sector Performance and Development Cooperation in Rwanda: Results-Based Approaches; Klingebiel, S., Gonsior, V., Jakobs, F., Nikitka, M., Eds.; Springer International Publishing: Basel, Switzerland, 2016; pp. 41–73. [Google Scholar]
- Huggins, C. An overview of the political economy of agricultural reform in Rwanda. In Agricultural Reform in Rwanda: Authoritarianism, Markets, and Zones of Governance, 1st ed.; Zed books: London, UK, 2017. [Google Scholar]
- Jenkins, G.; Kuo, C.Y.; Harberger, A. The integrated analysis. In Cost-Benefit Analysis for Investment Decisions, 1st ed.; Amazon Publishing: Seattle, WA, USA, 2019; pp. 1–13. [Google Scholar]
- World Bank Development Indicators. Population Density (People per sq. km of Land Area)–Rwanda. Available online: https://data.worldbank.org/indicator/EN.POP.DNST?locations=RW&view=chart (accessed on 3 December 2020).
- World Bank Development Indicators. GDP Growth (Annual%)–Rwanda. Available online: https://data.worldbank.org/indicator/NY.GDP.MKTP.KD.ZG?locations=RW (accessed on 2 December 2020).
- Gatete, C. The Rwanda We Want: Towards ‘Vision 2050′, National Dialogue Presentation, Kigali, 16 December 2016; Ministry of Finance and Economic Planning: Kigali, Rwanda, 2016. [Google Scholar]
- The World Bank. Rwanda Agricultural Policy Note; The World Bank: Washington, DC, USA, 2014. [Google Scholar]
- Cioffo, G.D.; Ansoms, A.; Murison, J. Modernising agriculture through a ‘new’ Green Revolution: The limits of the Crop Intensification Programme in Rwanda. Rev. Afr. Political Econ. 2016, 43, 277–293. [Google Scholar] [CrossRef]
- Kwan, A.Y.H. Rural Development in Malaysia-Issues and Problems Confronting MADA, FELDA and RISDA1. Asian J. Soc. Sci. 1980, 8, 64–86. [Google Scholar] [CrossRef]
- Fertilizer Consumption by Country. Knoema, 2019. Available online: https://knoema.com//atlas/ranks/Fertilizer-consumption (accessed on 13 December 2020).
- Fanelli, R.M. The (un) sustainability of the land use practices and agricultural production in EU countries. Int. J. Environ. Stud. 2020, 76, 273–294. [Google Scholar] [CrossRef]
- Miklyaev, M.; Afra, S.; Hashemi, M. Cost-Benefit Analysis of Rwanda’s Dairy Value Chains. Dev. Discuss. Pap. 2017, 02, 1–45. [Google Scholar]
- Kathiresan, A. Strategies for Sustainable Crop Intensification in Rwanda; Ministry of Agriculture and Animal Resources (MINAGRI): Kigali, Rwanda, 2011. [Google Scholar]
- National Institute of Statistics of Rwanda (NISR). National Agricultural Survey (NAS); NISR: Kigali, Rwanda, 2008.
- Nishimwe, G.; Rugema, D.M.; Uwera, C.; Graveland, C.; Stage, J.; Munyawera, S.; Ngabirame, G. Natural Capital Accounting for Land in Rwanda. Sustainability 2020, 12, 5070. [Google Scholar] [CrossRef]
- Ali, D.A.; Deininger, K.; Duponchel, M. Credit Constraints and Agricultural Productivity: Evidence from rural Rwanda. J. Dev. Stud. 2014, 50, 649–665. [Google Scholar] [CrossRef]
- Deininger, K.; Goyal, A. Going digital: Credit effects of land registry computerization in India. J. Dev. Econ. 2012, 99, 236–243. [Google Scholar] [CrossRef] [Green Version]
- Ansoms, A.; Verdoodt, A.; Van Ranst, E. The inverse relationship between farm size and productivity in rural Rwanda. Inst. Dev. Policy Manag. Discuss. Pap. 2008. Available online: http://hdl.handle.net/1854/LU-684186 (accessed on 3 December 2020).
- Chigbu, U.E.; Ntihinyurwa, P.D.; de Vries, W.T.; Ngenzi, E.I. Why tenure responsive land-use planning matters: Insights for land use consolidation for food security in Rwanda. Int. J. Environ. Res. Public Health 2019, 16, 1354. [Google Scholar] [CrossRef] [Green Version]
- Muyombano, E.; Espling, M. Land use consolidation in Rwanda: The experiences of small-scale farmers in Musanze District, Northern Province. Land Use Policy 2020, 99, 105060. [Google Scholar] [CrossRef]
- Nilsson, P. The Role of Land Use Consolidation in Improving Crop Yields among Farm Households in Rwanda. J. Dev. Stud. 2019, 55, 1726–1740. [Google Scholar] [CrossRef] [Green Version]
- Monitor Group. The Business Case for Investing in the Import and Distribution of Fertilizer in Rwanda; USAID: Washington, DC, USA, 2012. [Google Scholar]
- Fanelli, R.M. The Spatial and Temporal Variability of the Effects of Agricultural Practices on the Environment. Environments 2020, 7, 33. [Google Scholar] [CrossRef] [Green Version]
- Huggins, C. Maize production and the ‘fugitive farmers’ in Kihere District. In Agricultural Reform in Rwanda: Authoritarianism, Markets, and Zones of Governance, 1st ed.; University of Chicago Press: Chicago, IL, USA, 2017. [Google Scholar]
- International Fertilizer Development Center (IFDC). New Project Helps Rwanda to Privatize its Fertilizer Sector. 14 December 2010. Available online: https://ifdc.org/2010/12/14/new-project-helps-rwanda-to-privatize-its-fertilizer-sector (accessed on 3 December 2019).
- Ministry of Finance and Economic Planning (MINECOFIN), Republic of Rwanda. Rwanda Vision 2020; MINECOFIN: Kigali, Rwanda, 2000.
- Huggins, C. Contemporary agricultural reforms in sub-Saharan Africa. In Agricultural Reform in Rwanda: Authoritarianism, Markets, and Zones of Governance, 1st ed.; Zed books: London, UK, 2017. [Google Scholar]
- Moon, S.; Lee, S. A Strategy for Sustainable Development of Cooperatives in Developing Countries: The Success and Failure Case of Agricultural Cooperatives in Musambira Sector, Rwanda. Sustainability 2020, 12, 8632. [Google Scholar] [CrossRef]
- MacNarn, I.; Davis, K. Rwanda Desk Advisory Study; USAID: Washington, DC, USA, 2018.
- Kuria, A.W.; Barrios, E.; Pagella, T.; Muthuri, C.W.; Mukuralinda, A.; Sinclair, F.L. Farmers’ knowledge of soil quality indicators along a land degradation gradient in Rwanda. Geoderma Reg. 2019, 16, e00199. [Google Scholar] [CrossRef]
- Isaacs, K.B.; Snapp, S.S.; Chung, K.; Waldman, K.B. Assessing the value of diverse cropping systems under a new agricultural policy environment in Rwanda. Food Sec. 2016, 8, 491–506. [Google Scholar] [CrossRef] [Green Version]
- Clay, N.; King, B. Smallholders’ uneven capacities to adapt to climate change amid Africa’s ‘green revolution’: Case study of Rwanda’s crop intensification program. World Dev. 2019, 116, 1–14. [Google Scholar] [CrossRef]
- Clay, N.; Zimmerer, K.S. Who is resilient in Africa’s Green Revolution? Sustainable intensification and Climate Smart Agriculture in Rwanda. Land Use Policy 2020, 97, 104558. [Google Scholar] [CrossRef]
- Jenkins, G.P.; Miklyaev, M.; Ujeneza, N.; Afra, S.; Matanhire, B.; Basikiti, P.; Nsenkyire, A. Comparative Economic Advantage of Crop Production in Rwanda. Dev. Discuss. Pap. 2017. Available online: https://ideas.repec.org/p/qed/dpaper/3006.html (accessed on 2 December 2020).
- Jenkins, G.; Kuo, C.Y.; Harberger, A. Discounting and alternative investment criteria. In Cost-Benefit Analysis for Investment Decisions, 1st ed.; Amazon Publishing: Seattle, WA, USA, 2019; pp. 83–106. [Google Scholar]
- Jenkins, G.; Kuo, C.Y.; Harberger, A. Discounting and alternative investment criteria. Dev. Discuss. Pap. 2011, 1–31. [Google Scholar]
- Commodity-Specific Conversion Factors Database for the Republic of Rwanda. Available online: http://rwanda-cscf.cri-world.com/ (accessed on 3 December 2020).
- Jenkins, G.; Kuo, C.Y.; Harberger, A. Evaluation of stakeholder impacts. In Cost-Benefit Analysis for Investment Decisions, 1st ed.; Amazon Publishing: Seattle, WA, USA, 2019; pp. 330–353. [Google Scholar]
- Musoni, A. Interviewee, Plant breeding in Revolutionizing Agriculture [Interview]. 2016. Available online: http://rab.gov.rw/index.php?id=235 (accessed on 3 December 2020).
- Donahue Angel, M.; Berti, P.; Siekmans, K.; Tugirimana, P.L.; Boy, E. Prevalence of Iron Deficiency and Iron Deficiency Anemia in the Northern and Southern Provinces of Rwanda. Food Nutr. Bull. 2017, 38, 554–563. [Google Scholar] [CrossRef] [Green Version]
- UN Comtrade Database. Available online: https://comtrade.un.org/Data/ (accessed on 7 January 2020).
- Del Prete, D.; Ghins, L.; Magrini, E.; Pauw, K. Land consolidation, specialization, and household diets: Evidence from Rwanda. Food Policy 2019, 83, 139–149. [Google Scholar] [CrossRef]
- Katungi, E.; Larochelle, C.; Mugabo, J.; Buruchara, R. Climbing bean as a solution to increase productivity in land-constrained environments: Evidence from Rwanda. Outlook Agric. 2019, 48, 28–36. [Google Scholar] [CrossRef]
- Catherine, L.; Dorene, A.M.; Ekin, B.; Jeffrey, A. Assessing the Adoption of Improved Bean Varieties in Rwanda and the Role of Varietal Attributes in Adoption Decisions; International Food Policy Research Institute: Washington, DC, USA, 2016. [Google Scholar]
- FAOstat, Crops and Livestock Products. Available online: http://www.fao.org/faostat/en/#data/TP/visualize (accessed on 3 December 2020).
- Kinazi Cassava Plant Limited. About Us. Available online: https://kcp.rw/-About-Us-.html (accessed on 3 December 2020).
- Ntirenganya, E. Farmers Upbeat about Productivity of New Cassava Variety. The New Times [Online]. 5 July 2016. Available online: https://www.newtimes.co.rw/section/read/201411 (accessed on 4 December 2020).
- International Institute of Tropical Agriculture (IITA). CBSD Control Project in Rwanda and Burundi Commended by Partners. Available online: http://bulletin.iita.org/index.php/2018/05/05/cbsd-control-project-in-rwanda-and-burundi-commended-by-partners/ (accessed on 3 December 2020).
- Jenkins, G.P.; Kuo, C.Y.; Salci, S. Measuring the Foreign Exchange Premium and the Premium for Non-Tradable Outlays for 20 Countries in Africa. S. Afr. J. Econ. 2015, 83, 269–285. [Google Scholar] [CrossRef]
- Republic of Rwanda; Ministry of Trade and Industry (MINICOM). Minimum Price for Maize to Improve Farmers’ Incomes. 26 January 2015. Available online: http://www.minicom.gov.rw/index.php?id=24&tx_ttnews%5Btt_news%5D=917&cHash=802b7d9f959a489345e06198d9e32a82 (accessed on 5 March 2020).
- Nkurunziza, M. Over 2000 Tonnes of Maize Seeds Set for Distribution. The New Times [Online]. 29 August 2018. Available online: https://www.newtimes.co.rw/business/over-2000-tonnes-maize-seeds-set-distribution (accessed on 3 December 2020).
- FAOstat. Crops. Available online: http://www.fao.org/faostat/en/#data/QC/visualize (accessed on 26 January 2019).
- Austin, K.G.; Beach, R.H.; Lapidus, D.; Salem, M.E.; Taylor, N.J.; Knudsen, M.; Ujeneza, N. Impacts of Climate Change on the Potential Productivity of Eleven Staple Crops in Rwanda. Sustainability 2020, 12, 4116. [Google Scholar] [CrossRef]
- Murenzi, H. Investigating the Effect of Climate Variability Maize Yield in Rwanda. Master’s Thesis, University of Nairobi, Nairobi, Kenya, January 2019. Available online: http://erepository.uonbi.ac.ke/handle/11295/106425 (accessed on 4 December 2020).
- Reliefweb. Climate Change Profile: Rwanda; Dutch Ministry of Foreign Affair: The Hague, The Netherlands, 2019. [Google Scholar]
- Republic of Rwanda; Ministry of Trade and Industry (MINICOM). Minister Kanimba Launches a Wholesale Market for Irish Potatoes in Kigali. Available online: http://www.minicom.gov.rw/index.php?id=24&tx_ttnews%5Btt_news%5D=1012&cHash=e0d9f59c59484400f1473abf9e484779 (accessed on 2 December 2019).
- PotatoPro. Agricultural Statistics Rwanda. Available online: https://www.potatopro.com/rwanda/potato-statistics (accessed on 2 December 2020).
- Okoboi, G. The Marketing Potential of Potatoes in Uganda and Market Opportunities for Rwanda; International Institute of Tropical Agriculture: Ibadan, Nigeria, 2001. [Google Scholar]
- Approved Measures on Import Duty Rates in the EAC Common External Tariff; East African Community: Arusha, Tanzania, 30 June 2019.
- The World Bank. ICR for Rural Sector Support Project, 2008. Report No: ICR0000675; The World Bank: Washington, DC, USA, 2008. [Google Scholar]
- MINAGRI. National Rice Development Strategy; MINAGRI: Kigali, Rwanda, 2013.
- Fintrac Inc. Rwanda Cross-Border Agricultural Trade Analysis; USAID: Washington, DC, USA, 2013.
- Jenkins, G.; Kuo, C.Y.; Harberger, A. Economic prices for tradable goods and services. In Cost-Benefit Analysis for Investment Decisions, 1st ed.; Amazon Publishing: Seattle, WA, USA, 2019; pp. 277–300. [Google Scholar]
- Factfish. Rwanda: Rice, Paddy, Production Quantity (Tons). Available online: http://www.factfish.com/statistic-country/rwanda/rice,+paddy,+production+quantity (accessed on 2 December 2020).
- One Acre Fund. Soybean and Rhizobium-2015B Season; One Acre Fund: Kigali, Rwanda, 2016. [Google Scholar]
- Tukamuhabwa, P. Feasibility Study for Implementation of the Project on Increased Soybean Production and Productivity for Sustaining Markets; Rwanda Agriculture Board (RAB): Kigali, Rwanda, 2016. [Google Scholar]
- IndexMundi. Rwanda Wheat Domestic Consumption by Year. Available online: https://www.indexmundi.com/agriculture/?country=rw&commodity=wheat&graph=domestic-consumption (accessed on 31 December 2019).
- Feed the Future. Rwandan Farmers Turn Straw Into Income [Press release]. 26 April 2016. Available online: https://reliefweb.int/report/rwanda/rwandan-farmers-turn-straw-income (accessed on 2 December 2020).


| Crop | Eastern (1) | Southern (2) | Northern (3) | Western (4) | Total Rwanda |
|---|---|---|---|---|---|
| Bush bean | 95 | 68 | - | - | 163 |
| Climbing bean | - | - | 41 | 43 | 84 |
| Cassava | 31 | 112 | - | 29 | 172 |
| Maize | 39 | 17 | 31 | 31 | 118 |
| Potato | - | 4 | 35 | - | 39 |
| Rice | 6 | 4 | - | 2 | 12 |
| Soybean | 9 | 10 | - | 4 | 23 |
| Wheat | - | 5 | 10 | 3 | 17 |
| Total Rwanda | 179 | 220 | 116 | 111 | 627 |
| Province (Crop) | MIRR (1) | FNPV per ha—$ (2) | ENPV per ha—$ (3) | Agg. FNPV—000s $ (4) | Agg. ENPV—000s $ (5) | Externalities—000s $ | |
|---|---|---|---|---|---|---|---|
| Tax Revenue (6) | Subsidy (7) | ||||||
| Northern (climbing bean) | 31.01% | 1568 | 1926 | 64,409 | 79,122 | 14,713 | - |
| Eastern (bush bean) | 8.62% | −170 | 60 | −16,199 | 5716 | 21,915 | - |
| Southern (bush bean) | −11.28% | −924 | −744 | −62,839 | −50,599 | 12,240 | - |
| Western (climbing bean) | −13.64% | −1402 | −1242 | −59,883 | −53,036 | 6847 | - |
| Total/average Rwanda (climbing bean) | 8.25% | 54 | 311 | 4526 | 26,086 | 21,560 | - |
| Total/average Rwanda (bush bean) | 0.34% | −483 | −275 | −79,038 | −44,883 | 34,155 | - |
| Total/average Rwanda (beans) | 3.02% | −301 | −76 | −74,512 | −18,797 | 55,715 | - |
| Province | MIRR (1) | FNPV per ha –$ (2) | ENPV per ha—$ (3) | Agg. FNPV—000s $ (4) | Agg. ENPV—000s $ (5) | Externalities—000s $ | |
|---|---|---|---|---|---|---|---|
| Tax Revenue (6) | Subsidy (7) | ||||||
| Eastern | 13.09% | 6 | 272 | 173 | 8352 | 8179 | - |
| Southern | 12.07% | −63 | 231 | −7118 | 25,929 | 33,047 | - |
| Western | 0.27% | −453 | −250 | −13,055 | −7211 | 5844 | - |
| Total/average Rwanda | 10.27% | −116 | 158 | −20,000 | 27,070 | 47,070 | - |
| Province | MIRR (1) | FNPV per ha—$ (2) | ENPV per ha—$ (3) | Agg. FNPV—000s $ (4) | Agg. ENPV—000s $ (5) | Externalities—000s $ | |
|---|---|---|---|---|---|---|---|
| Tax Revenue (6) | Subsidy (7) | ||||||
| Southern | 31.99% | 1349 | 361 | 23,417 | 6261 | 5720 | −22,876 |
| Northern | 16.60% | 143 | −707 | 4410 | −21,760 | 10,293 | −36,463 |
| Eastern | 6.60% | −251 | −1234 | −9741 | −47,945 | 12,967 | −51,171 |
| Western | −2.27% | −505 | −1567 | −14,944 | −46,387 | 9400 | −40,843 |
| Total/average Rwanda | 10.77% | 27 | −942 | 3142 | −109,831 | 38,380 | −151,353 |
| Province | MIRR (1) | FNPV per ha—$ (2) | ENPV per ha—$ (3) | Agg. FNPV—000s $ (4) | Agg. ENPV—000s $ (5) | Externalities—000s $ | |
|---|---|---|---|---|---|---|---|
| Tax Revenue (6) | Subsidy (7) | ||||||
| Southern | 50.79% | 18,333 | 19,384 | 75,561 | 79,891 | 6333 | −2003 |
| Northern | 37.59% | 12,849 | 13,789 | 450,763 | 483,755 | 50,045 | −17,053 |
| Total/average Rwanda | 38.97% | 13,425 | 14,377 | 526,324 | 563,646 | 56,378 | −19,056 |
| Province | MIRR (1) | FNPV per ha—$ (2) | ENPV per ha—$ (3) | Agg. FNPV—000s $ (4) | Agg. ENPV—000s $ (5) | Externalities—000s $ | ||
|---|---|---|---|---|---|---|---|---|
| Tax revenue (6) | Subsidy (7) | Tariff (8) | ||||||
| Eastern | 31.11% | 2783 | −2528 | 18,466 | −14,587 | 4512 | −3462 | −34,103 |
| Western | 31.58% | 2691 | −2617 | 5551 | −4637 | 1348 | −1063 | −10,473 |
| Southern | 30.56% | 2620 | −2699 | 12,536 | −11,135 | 3191 | −2476 | −24,386 |
| Total/average Rwanda | 30.98% | 2712 | −2602 | 36,553 | −30,359 | 9051 | −7001 | −68,962 |
| Province | MIRR (1) | FNPV—$ (2) | ENPV—$ (3) | Agg. FNPV—000s $ (4) | Agg. ENPV—000s $ (5) | Externalities—000s $ | |
|---|---|---|---|---|---|---|---|
| Tax Revenue (6) | Subsidy (7) | ||||||
| Southern | 1.53% | −355 | −1494 | −3369 | −15,008 | 2269 | −13,908 |
| Western | −15.66% | −1145 | −2366 | −4601 | −9509 | 655 | −5563 |
| Eastern | −19.29% | −1498 | −2726 | −13,044 | −23,736 | 1361 | −12,053 |
| Total/average Rwanda | −9.46% | 923 | 2119 | −21,014 | −48,253 | 4285 | −31,524 |
| Province | MIRR (1) | FNPV per ha—$ (2) | ENPV per ha—$ (3) | Agg. FNPV—000s $ (4) | Agg. ENPV—000s $ (5) | Externalities—000s $ | |
|---|---|---|---|---|---|---|---|
| Tax Revenue (6) | Subsidy (7) | ||||||
| Northern | 15.04% | 133 | −1317 | 1268 | −12,545 | 4243 | −18,056 |
| Western | −2.45% | −606 | −2144 | −1837 | −6495 | 1086 | −5744 |
| Southern | −4.38% | −774 | −2311 | −3514 | −10,491 | 1627 | −8604 |
| Total/Average Rwanda | 6.79% | −239 | −1728 | −4083 | −29,531 | 6956 | −32,404 |
| Crops | Western | Eastern | Southern | Northern | Total |
|---|---|---|---|---|---|
| Bush beans | 3703 | 2068 | 5771 | ||
| Climbing beans | 1157 | 2486 | 3643 | ||
| Cassava | 988 | 1382 | 5584 | 7954 | |
| Maize | −5313 | −6456 | −2899 | −4422 | −19,090 |
| Potato | 732 | 5575 | 6307 | ||
| Rice | −1722 | −5586 | −4000 | −11,308 | |
| Soybean | −830 | −1807 | −1967 | −4604 | |
| Wheat | −787 | −1179 | −2334 | −4300 | |
| Total | −6507 | −8764 | −1661 | 1305 | −15,627 |
Publisher’s Note: MDPI stays neutral with regard to jurisdictional claims in published maps and institutional affiliations. |
© 2020 by the authors. Licensee MDPI, Basel, Switzerland. This article is an open access article distributed under the terms and conditions of the Creative Commons Attribution (CC BY) license (http://creativecommons.org/licenses/by/4.0/).
Share and Cite
Miklyaev, M.; Jenkins, G.; Shobowale, D. Sustainability of Agricultural Crop Policies in Rwanda: An Integrated Cost–Benefit Analysis. Sustainability 2021, 13, 48. https://doi.org/10.3390/su13010048
Miklyaev M, Jenkins G, Shobowale D. Sustainability of Agricultural Crop Policies in Rwanda: An Integrated Cost–Benefit Analysis. Sustainability. 2021; 13(1):48. https://doi.org/10.3390/su13010048
Chicago/Turabian StyleMiklyaev, Mikhail, Glenn Jenkins, and David Shobowale. 2021. "Sustainability of Agricultural Crop Policies in Rwanda: An Integrated Cost–Benefit Analysis" Sustainability 13, no. 1: 48. https://doi.org/10.3390/su13010048