1. Introduction
As climate talks gain more traction, countries across the globe, especially the highest polluters, may be expected to make significant changes to their energy systems. The type of energy technology used is central in the climate discussion, due to the variety of sources from where energy is harnessed and the associated emissions from each energy technology used. In addition, the types of energy technology used have been linked to socioeconomic and environmental outcomes of individual and community wellbeing [
1,
2]. Massive deployment of alternative emerging technologies, such as renewable electricity (RE), is critical to achieving the desired stability of the atmospheric CO
2 concentration [
3] and it also offers economic benefits [
2]. While these benefits appear to be positive for society, public opinion about RE, and particularly RE siting, is not unilaterally supportive and some public opposition to RE can hinder its successful deployment [
4,
5].
Public perceptions of RE is one of the key social dimensions in sociotechnical transitions [
6]. Public views on energy may be shaped by different social factors. Demographic factors, such as income, environmental concern, and consumption behavior, may shape public perceptions of particular energy sources. Understanding how these factors shape general public support for a complete transition to RE can help in obtaining a bird’s eye view of socio-spatial information about its potential success. To capture the opinion of a wider range of members of the public, a quantitative survey was designed that possesses such capability, in contrast to stakeholder focus groups that involve selected members of the society.
With this in mind, this research is geared toward collecting a broader perspective from residents about factors that would make them more or less likely to support a transition to 100% RE in their various municipalities. Technically, 100% RE has been shown to be feasible and economically viable for residents in the Western Upper Peninsula (WUP) [
7]. The technical feasibility also shows the greater economic viability of 100% RE with increased energy consumption reduction. With these in mind, it is important to investigate whether WUP residents would show buy-in for such a transition that has potential energy cost savings and their willingness to support a municipality-led initiative that will reduce their energy consumption. In research done in other contexts, supportive public attitudes have been due to positive economic benefits in Southern California [
8], while locally funded projects by private entities have received the most support in the case of Long Island [
9]. As these factors cannot be generalized for all places in the United States due to the uniqueness of every city and state, it is important to understand whether these factors can spur support or opposition in other places.
Opinion of Public in Energy Transition as a Sociotechnical System Transition (STST)
By definition, an STST is the combined changes in both social and material components that drive societal functions, such as energy supply, communication, housing, transportation, and healthcare [
10]. A STST involves a web of elements, including technology, science, user practice, cultural meaning, regulation, the market, infrastructure, production, and the supply network [
10,
11]. One conceptual framework for studying complex STSTs is the multilevel perspective (MLP), in which the public operates at the regime level [
6,
10]. Basically, the MLP argues that interactions across multiple levels, including the sociotechnical landscape, sociotechnical regime, and niche innovation, influence the pathways of transition [
6,
12,
13]. Within this theoretical framework, the stability of new technology is partly contingent on the regime, which includes the public. Transition in the regime level, which is usually dynamically stable, occurs as a result of combined changes in infrastructures, policies, culture, and norms [
6,
13]. Due to being dynamically stable, this explains the inertia and carefulness of people when welcoming new or unfamiliar system change that might undermine their interest. In other words, technological substitution occurs after increased public trust [
12,
14].
Furthermore, in an energy system transition, understanding the role of norms, sociodemographic factors, values, and trust in the system can facilitate communication between technologists, decision-makers, and the public [
15]. To avoid neglecting the importance of public participation, social acceptance, and political feasibility, sociotechnical system transitions must be given a holistic assessment that is embedded in society. The previous experience in the United Kingdom about local protests regarding onshore wind, a failed energy savings program, an unsuccessful zero-carbon home target, and smart meter roll-outs are empirical examples of consequences of public neglect [
13]. It is thus necessary to assess public opinion in the conceptualization of any 100% RE transition scenario.
This research attempts to answer two main questions: (1) What factors make the WUP residents more or less supportive of a transition to 100% RE? (2) How does support for a 100% RE transition differ between counties in the WUP? The objectives of this study were to determine factors that can contribute to the support of 100% RE in the WUP and investigate similarities and differences in the perceptions about 100% RE in the WUP from one county to another.
2. Public Perception of 100% Renewable Electricity in the United States
Although research has been done on public perceptions and engagement regarding various RE in energy mixes [
16], not much has been explicitly done on the topic of a 100% RE transition in the United States. The techno-economic feasibility of 100% or nearly 100% RE transition in the United States have been studied by various researchers [
16,
17,
18]. Previous studies have captured public and stakeholder perceptions on solar projects [
9,
19], while other studies have shown the engagement of individuals on various wind projects [
20]. One of the explanations for the dearth in this research area is the relatively new concept of 100% RE in the United States and the very few empirical case studies in this context. For instance, only five municipalities in the United States have been recognized as successfully transitioning to 100% RE for their electricity supply [
21,
22,
23,
24,
25]. These municipalities represent less than 0.003% of the total municipalities in the United States, based on the Census Bureau in 2007 [
26]. Thus, this research focused on gathering the opinions of residents from the early conceptual stage about the potential for a 100% RE transition.
The succeeding subsection uses the theoretical MLP framework on the energy transition as an STST as the basis for investigating public opinion. First, the demands of a 100% RE transition and changes in consumption pattern to match the available resources are discussed. Second, perceptions on the possibilities of RE in northern climates are reviewed as this relates to having energy production resource availability to meet needs. Next, the interest of the public with respect to RE placement, project developers, and benefits from such projects is reviewed. Then, the WUP in Michigan case study is introduced, along with the region’s uniqueness, demography, and developing interest in RE. Then, the methodology and hypotheses of this research are presented. The findings, discussion, and conclusions follow according.
2.1. Energy Consumption Behavior and the RE Transition
Recent research revealed that the main barriers to variable or intermittent 100% RE are not techno-economic, but political, cultural, and institutional challenges [
16]. One example is the potential of changing consumption patterns by individuals to match the available RE resources. The ability of Americans to make a connection between their consumption patterns and the available energy resources, and making choices on viable alternatives, can help to influence support for RE [
27]. The reason for such changes in behavioral patterns is because the techno-economic, social, and policy requirements in a wholly RE system would be higher, compared to mixed renewable and fossil fuel scenarios. In the technical dimension, the issue of intermittent renewable resources, with the need for energy generation to reliably and securely meet base and peak loads, is one challenge [
16,
18,
28]. While the availability of storage, such as batteries, offers a solution to this technical challenge, its cost and economic implications pose further bottlenecks. It would be expected that if RE will displace the current fossil fuel regime, then it must provide more economic and environmental benefits for it to appeal to the people. However, the falling prices of RE technologies and battery storage [
28] offer potential solutions to the economic challenges. Nonetheless, interest in energy efficiency has been growing alongside RE adoption [
29,
30]. Furthermore, energy consumption waste reduction has been at the center of energy regulations [
31]. It is therefore imperative that in the early stage of planning and decision-making, the consideration of public interest, support, and views of individuals regarding the potential for changing their energy consumption pattern and their support for energy efficiency and waste reduction measures to reduce overall energy demand and adapt to the increased use of RE is investigated as part of the potential public support for a 100% RE transition.
Some of the themes explored in previous public opinion research regarding renewable energy development also include the siting of RE technologies, the relationship with RE project developers, and the distribution of the benefits associated with RE development [
32,
33]. In the Long Island Solar Roadmap project, for instance, input from the public was collected through a public opinion survey that explicitly asked about the relative importance of multiple factors involved in solar energy development [
9]. In addition, research in Leelanau County, Michigan, found community members’ perspectives of RE to be positive [
34].
Considering the public’s perceptions and preferences early in RE project development can foster support, increase public awareness, ease information sharing for better understanding, and provide an opportunity to incorporate key local environmental knowledge [
35]. Obtaining public support in RE development is capable of facilitating acceptance of future implementation. On the other hand, if such a project is in conflict with the interests of the residents, this could lead to project failure [
36,
37].
2.2. Electricity Price and Environmental Concern in the Case of Michigan’s Western Upper Peninsula
Historically, many parts of the Upper Peninsula (UP) of Michigan, USA, have been impacted by mining activities that have left legacies of environmental degradation and damage, including impacts to the water quality of the cherished Lake Superior, the largest freshwater body in the world [
38,
39]. The legacies of mining also have economic impacts, leaving areas relatively under-resourced and with fewer opportunities for economic growth. Not only that, the cost of energy in the UP is among the highest in the whole United States [
40]. The situation has resulted in hardship for residents of the UP region due to exorbitant electricity bills [
41]. This disproportionate energy challenge in the state of Michigan has raised concerns among its residents. In response to this energy crisis, Governor Gretchen Whitmer recently appointed a task force to come up with viable solutions to ensure that UP residents have access to affordable, reliable, and safe energy [
42].
Electricity from RE seems to be on the radar as a possible alternative solution to mitigate the existing energy challenges in the UP. In September 2020, Michigan’s Governor Whitmer issued an executive directive for the state to become carbon-neutral by the year 2050, with the goal of transitioning from fossil fuel to RE [
43]. The rationales for this goal, according to the directive, include ensuring economic resilience, mitigation of climate change and its impacts, and localizing energy provision while meeting the needs of Michiganders. Furthermore, there has been increasing interest in RE adoption in selected parts of the UP. For instance, the Western UP Planning and Development Region (WUPPDR) has renewable energy deployment as part of its plans [
44]. In 2018, the WUPPDR requested the assistance of researchers from the University of Michigan (UM) and Michigan Technological University (MTU) to carry out technical and cost-benefit analyses for community solar in the Keweenaw Bay Region [
40], resulting in a community solar project [
19,
40,
44,
45]. While techno-economic analysis is important in this process, the opinions of the public who are at the center of this energy development are equally germane.
The WUP is a region in the northern part of Michigan, flanked by Lake Superior. The WUP covers ten counties which are Baraga, Delta, Dickinson, Gogebic, Houghton, Iron, Keweenaw, Marquette, Menominee, and Ontonagon [
46,
47]. The region is predominantly made up of rural communities, with a population of 232,886 people as of 2018 [
47], including 186,886 eligible voters who are at least 18 years old. Over 86% of WUP residents are high school graduates, while approximately 20% hold bachelor’s degrees or higher [
48]. Against this backdrop, it is important to assess the commonalities and differences across the WUP while exploring social perceptions of the potential for a 100% RE transition in the WUP.
3. Method and Survey Design
The investigation of residents’ perceptions of and support for a 100% RE transition in the WUP was conducted via a survey questionnaire that was distributed to residents across the ten WUP counties. The term “residents” in this paper refers to individuals that lived in the region for at least the past six months, including both full-time or part-time (seasonal or student) residents. In the face of the challenges caused by the current global coronavirus disease 2019 (COVID19) pandemic, the methodology adopted included an online survey distribution. An existing survey questionnaire [
9] was adapted as part of the design of a questionnaire to carry out an investigation of the perceptions of the WUP residents on 100% RE. The redesigned questionnaire was pretested with self-selected members and non-members of the university community. This helped us to establish whether the survey instrument could be easily completed by the general public within a short timeframe of fifteen minutes, as well as identify potential barriers for participants when trying to complete it. The feedback that was provided by these people after the pretest of the survey instrument was incorporated into the final draft of the questionnaire.
Appendix A contains the questionnaire, which was launched on the Survey Monkey platform. In general, perceptions were measured using the residents’ support for transitioning to a 100%-RE-sourced electricity supply.
The general goal of this survey was to examine the perceptions of residents in all ten WUP counties by investigating different opinions on a 100% RE transition for their electricity supply, including support for policies, project development, and participation. Specifically, it was geared toward knowing the following about WUP residents: (i) perceptions of and relative support for wind and solar technological options and the factors that influence support; (ii) support for policy mechanisms that would drive a 100% RE transition; (iii) willingness to participate, which was measured as a willingness to engage in behavior change or to pay for RE.
Table 1 shows the independent and dependent variables that were considered in this research.
Sampling Frame
The sampling framing for this research was limited to residents who could go online to complete a survey questionnaire in English. The survey was distributed online using purposive convenience and snowball methodologies. The survey was open online to the general public for 63 days in total during the period of 28 August to 29 October 2020 before the election month of November. The Survey Monkey link was emailed to contact persons at various public libraries in the WUP, with a request for publishing it on their websites and social media platforms. The same approach was taken when contacting public officials and asking them to share the link through county and city websites. The survey was also made available for residents through Facebook platforms, which were targeted toward ensuring a diversity of viewpoints among potential participants. These pages included local yard sale pages, Keweenaw Youth for Climate Action, Copper Country Christian School, Gogebic-Iron County Airport, Gogebic Community College, Michigan Technological University (including the halls and departments on campus), Escanaba Upper Elementary PTO, Escanaba Area public schools, Baraga area schools, Hancock public schools, L’Anse area schools, West Iron District Library, Munising School Public Library, Spies Public Library, WUPPDR (email), UP Politics and Public Policy, and Keweenaw People’s Movement. School contacts were requested to share the survey with parents and staff in their listserv. A follow-up email on the survey procedure was sent to the principals and contact persons of various schools in the WUP. The email provided information about the online survey and directions on how residents could complete it. A snowball approach was also deployed, where individuals were requested to share the survey with other residents within their network, such as on their personal Facebook, LinkedIn, Twitter timelines, and on the Keweenaw Now blog. Due to the snowballing approach, the frequency of shares on different social media platforms could not be ascertained. Contained in the survey was information about two participants winning a
$100 gift card in a raffle draw. Such a strategy is common to increase the speed of response, reduce the coverage error, and lower the cost of carrying out surveys [
49].
Due to the chosen sampling frame, the survey was expected to have a coverage error [
49]. Coverage error can be described as an error resulting from the exclusion of certain groups within a research study population, who may not have access to the sampling frame, such as the Internet, a landline telephone, etc. Previous research shows that while 73% of U.S. households have access to the Internet, about 83% of adults use the internet [
49]. To reduce the coverage error, Marquette, Delta, and Iron counties were physically visited to distribute posters containing information on the survey for people to participate in. Specifically, some small shops, restaurants, and bars in those places were visited and were requested to help post the invitation to participate in the online survey in front of their glass windows, doors, or public info boards.
The survey was designed and targeted to obtain perspectives of the WUP residents. Based on the total eligible voting population of 186,886 residents in the ten WUP counties, a confidence level (C.L.) of 95% was set at a confidence interval (C.I.) (error margin) of plus or minus 3.34%. This gave a target sample size of voting age respondents in the WUP of 857. For each of the counties, the set C.L. and C.I. were 95% and 10%, respectively, resulting in the following targeted sample sizes shown in
Table 2.
4. Results Analysis
4.1. Descriptive Statistics of the Results
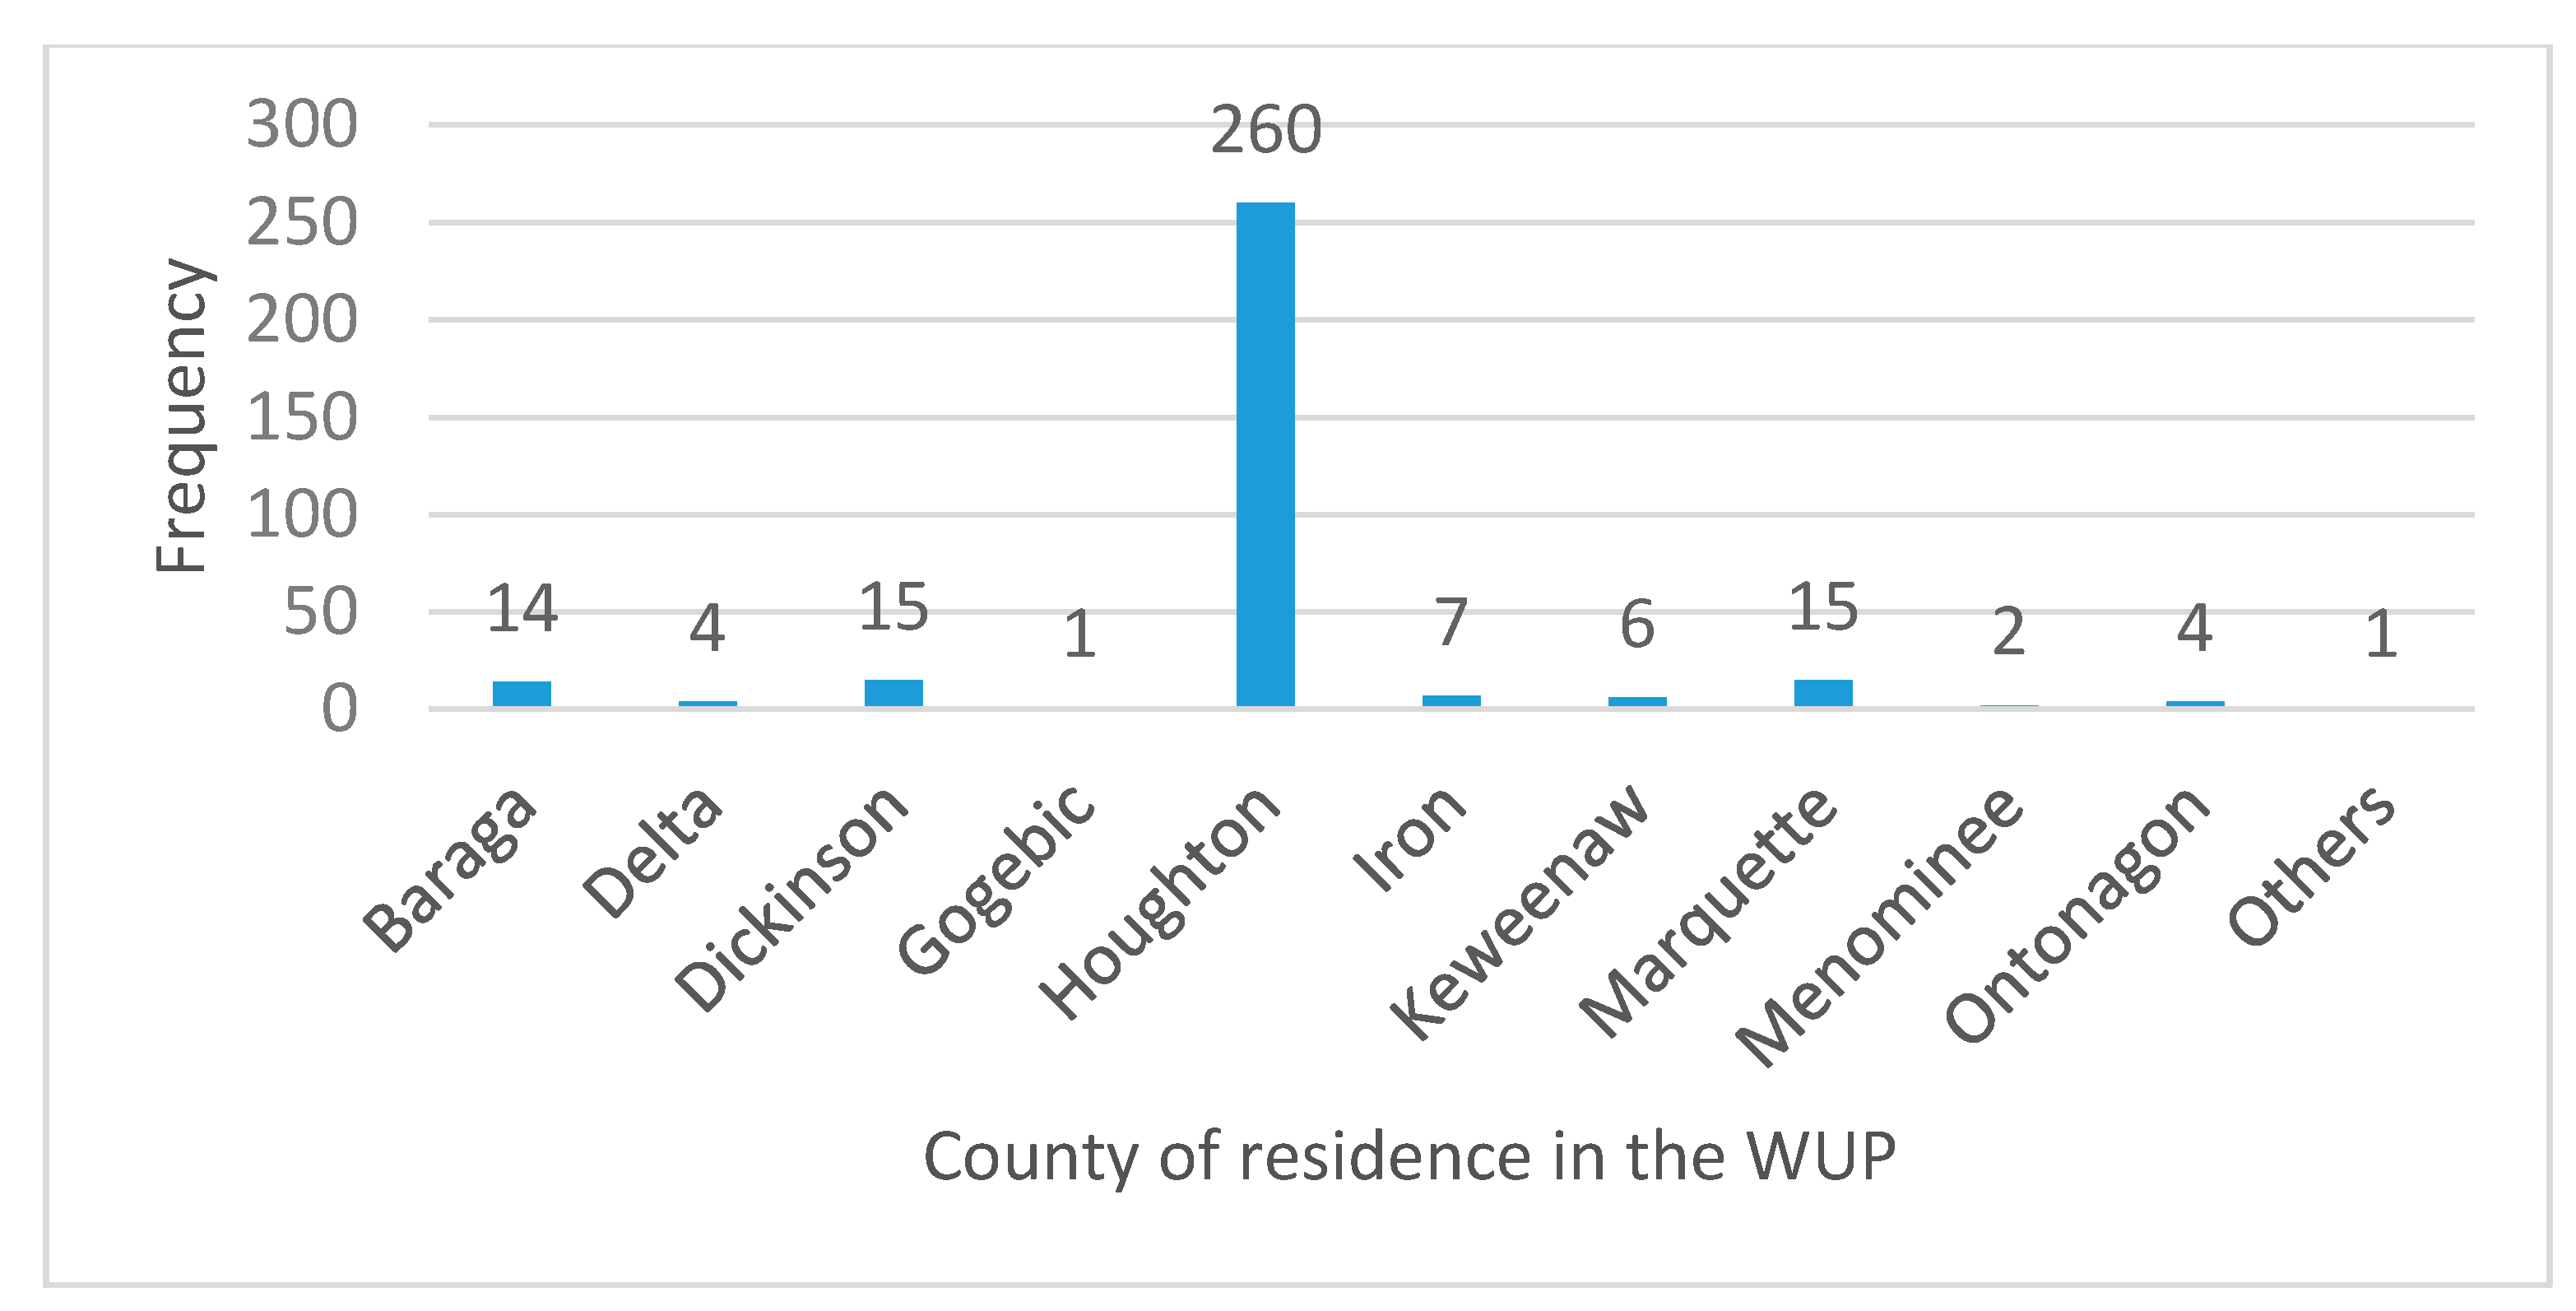
A total of 351 responses were received, out of which, only 327 indicated their county of residence and 1 respondent indicated “others.” The result showed a large turnout in a single county. Approximately 80% (260 people) of the respondents were from Houghton County, while the other 20% were spread across the remaining counties.
Figure 1 shows the frequency distribution of respondents by county of residence. Dickinson and Marquette each had 15 respondents, while Baraga has 14 respondents. Due to the low response rate from all the counties aside from Houghton, subsequent analysis was done by grouping respondents into two groups: Houghton county and non-Houghton county. The single respondent that indicated “others” was added to the non-Houghton county group.
4.1.1. Knowledge of RE Technologies in the WUP
RE Knowledge
On the question about knowledge of different RE technologies for electricity generation in the WUP, results showed that more than 60% of the 351 residents that responded had a little knowledge about solar and wind. In the case of hydro, however, the percentage was 10% less. Across each technology (see
Figure 2a–c), more residents indicated that they were either knowledgeable or very knowledgeable about solar and wind energy, compared to lower proportions for hydro. The knowledgeable rates (the combination of knowledgeable and very knowledgeable) as perceived by the WUP residents for each RE technology were approximately 35%, 28%, and 25% for solar, wind, and hydro, respectively. In addition, hydro was the RE technology with the lowest level of knowledge base among the respondents. While the overall result in this category shows low knowledge of RE across the three technologies, it does not indicate that the opinions of respondents are invalid. Rather, it means that a complementary interview of selected residents might be needed to obtain a full narrative of why each respondent selected their knowledge rate. This will help in ascertaining the veracity of their opinions for future policy and decision-making processes.
Support for RE Development
For the support of solar and wind energy development, a comparison between responses from Houghton County and non-Houghton counties was made. This was due to the low response rate from the remaining nine counties (aside from Houghton), which produced less than 70 responses in total. In the case of Houghton County, among the 258 respondents, the general distribution of responses was completely mirrored in the non-Houghton counties. While Houghton county had approximately 78% support for solar and 59% support for wind, among the non-Houghton respondents, 79% were supportive of solar and 62% were supportive of wind.
Table 3 below is a summary of the results of the frequency distributions of RE support. However, the results for both categories and the combined WUP showed a high positive skewness of the data, ranging from 1.2 to 2.2. This shows that the data was not normally distributed, i.e., non-symmetric, with most of the responses tilting toward support for RE.
4.1.2. Demographic Analysis of the Respondents
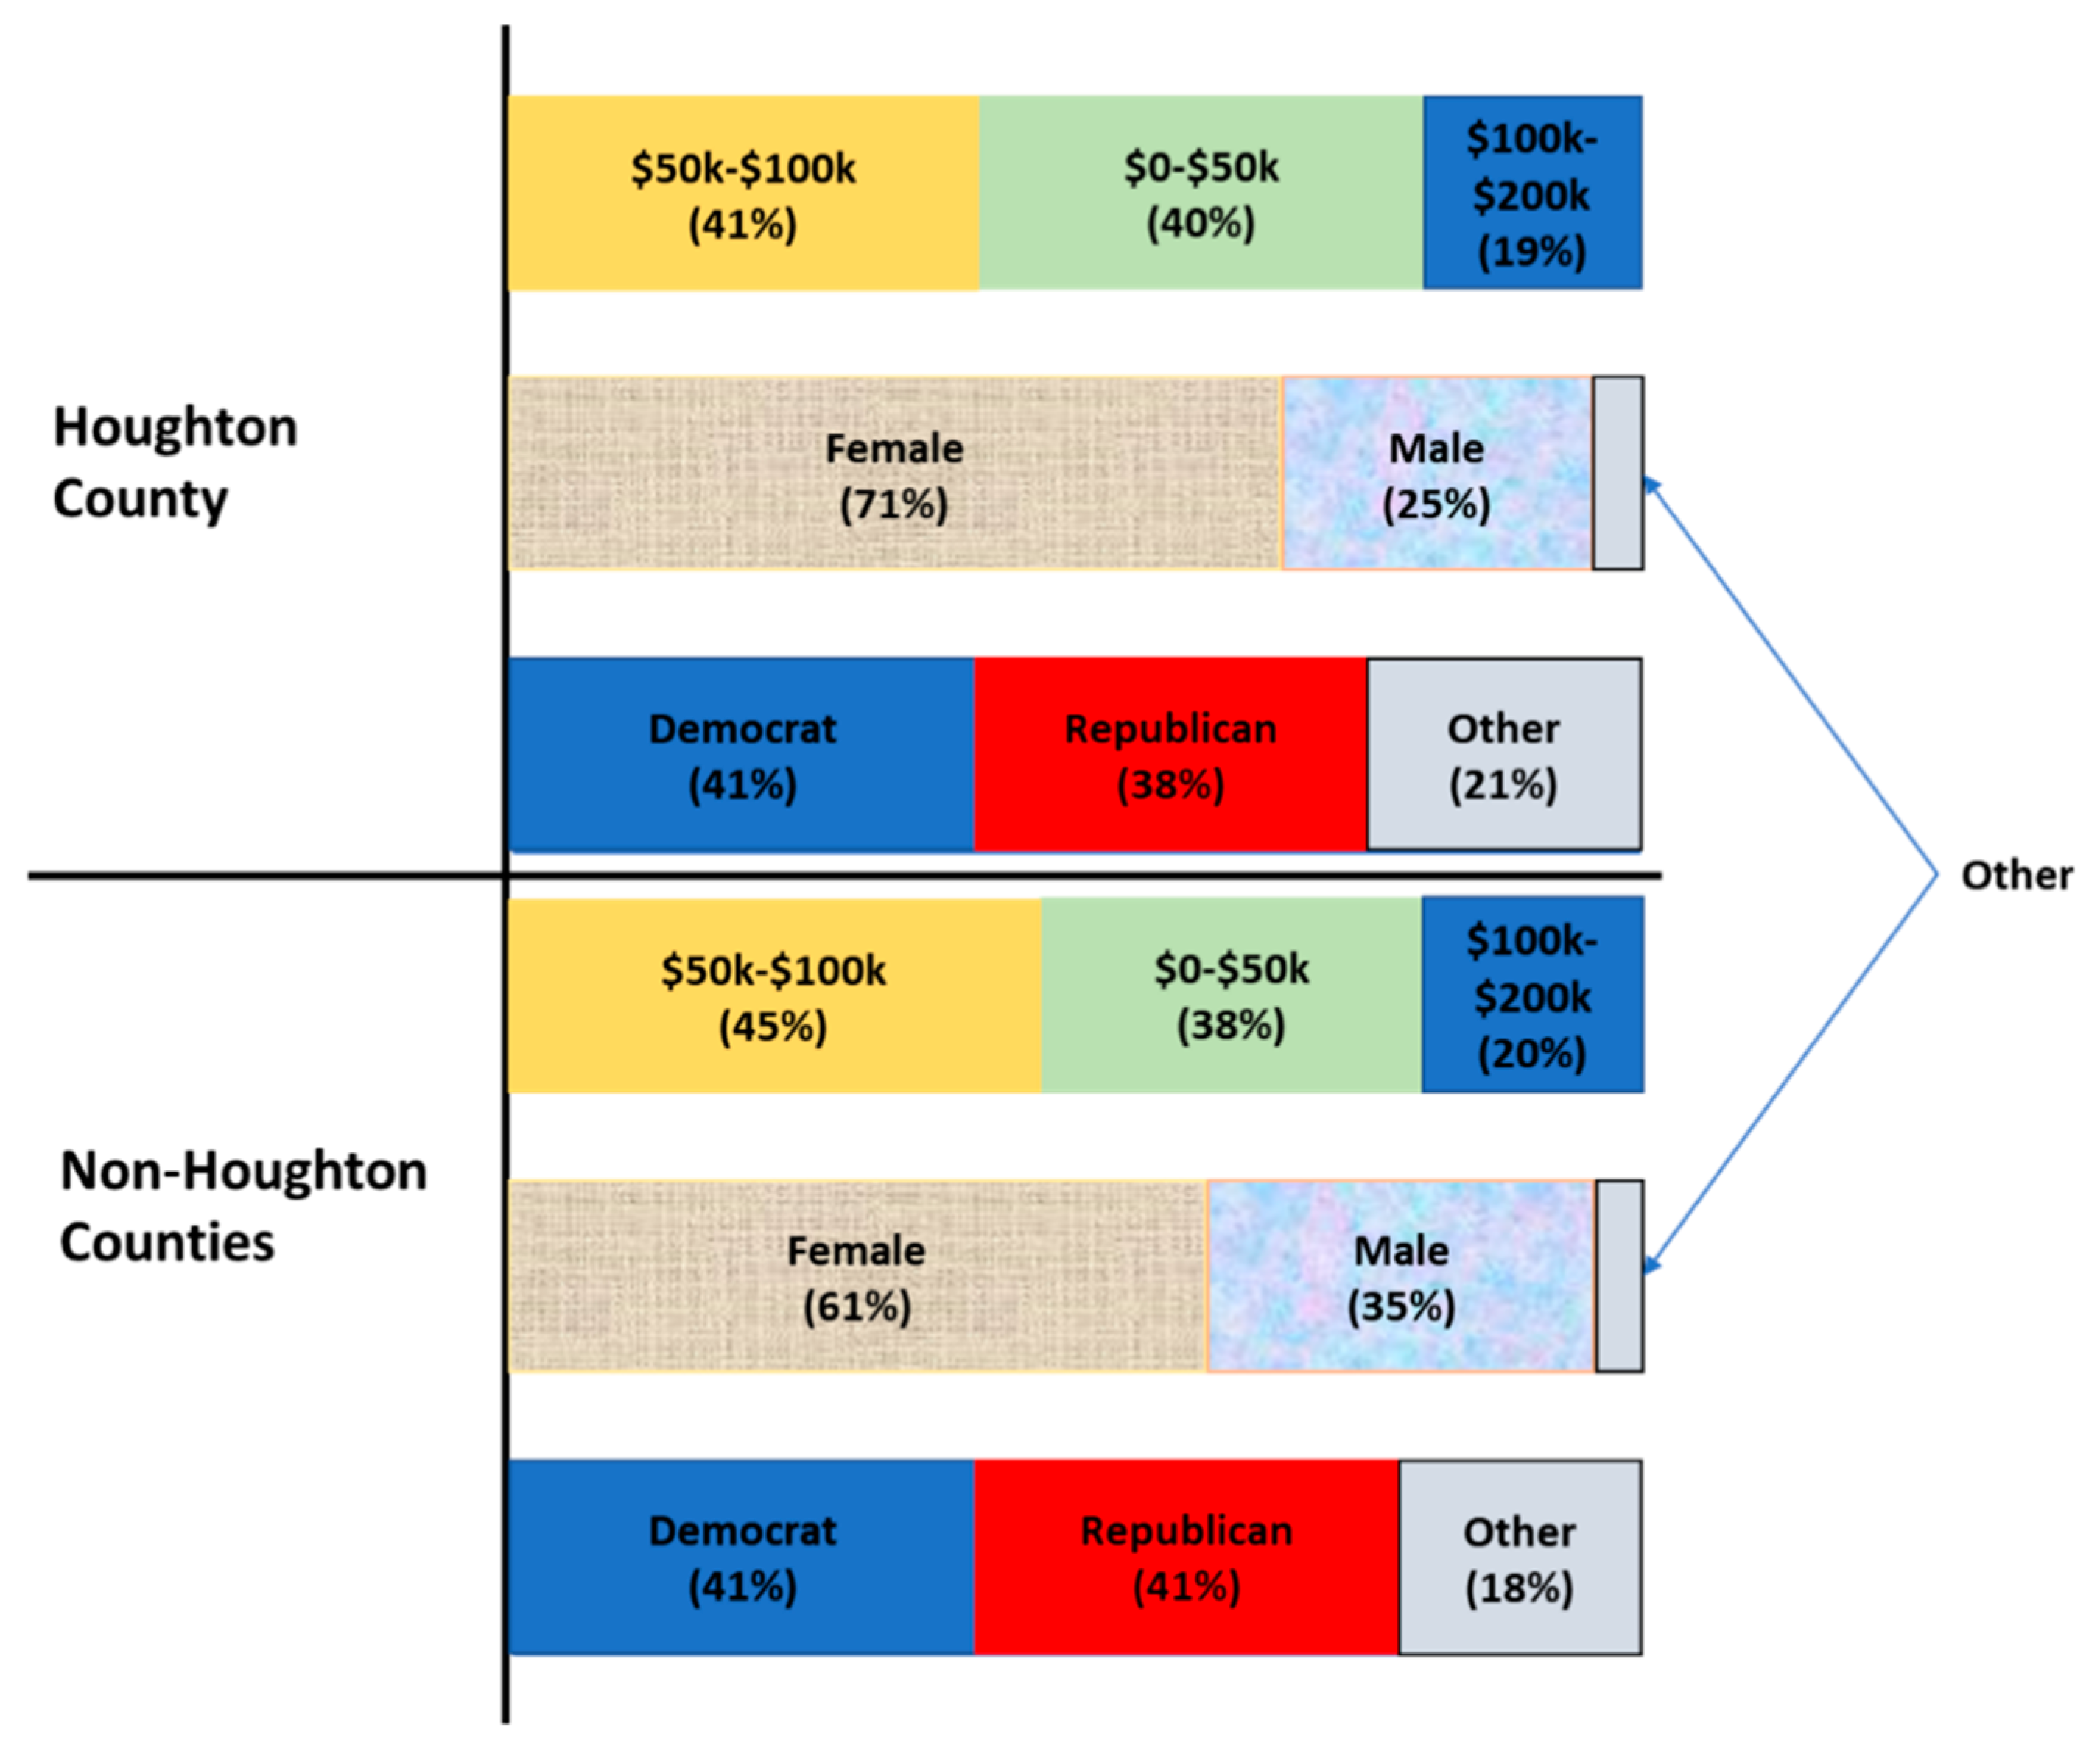
The most represented demographic among respondents was female respondents from Houghton County, where 62% of the 226 respondents indicated their gender as being female, while 22% indicated male. The rest did not respond to this question or indicated “other.” In the non-Houghton counties, 61% of respondents were female while 35% were male (see
Figure 3). The income distributions observed for Houghton and the combined rest of the counties in the WUP (non-Houghton counties) were close for the total of the combined categories of
$0–
$50,000 and
$50,000–
$100,000. While the combination gives 81% of respondents in Houghton County, it is 83% of respondents in the case of non-Houghton County. Similarity between the groups was also observed with the income distribution between
$100,000–
$200,000. These demographic results, especially the household income ranges, aligned with census data on social explorer [
47] for Houghton County. In the same vein, the population by household type also showed that the number of female householders doubles that of male householders on the census data. This is an indication of non-bias in the sampling.
For Houghton County respondents, 41% of the 102 respondents indicated a Democratic political affiliation, while 38% identified as Republican. For non-Houghton counties, 41% of the 62 residents who answered the question also identified as Democrats, while 41% were Republican. Those that indicated “others” as their political party affiliation are 21% and 18% for the Houghton and non-Houghton Counties respectively. As observed for income distribution, there is similarity in the distribution of political party affiliation between the two County categories. However, it is important to note that these sample sizes for both Houghton County and non-Houghton counties are not representative enough to make a general inference.
4.1.3. Installation, Finance, and Benefit Preferences
Installation Preferences
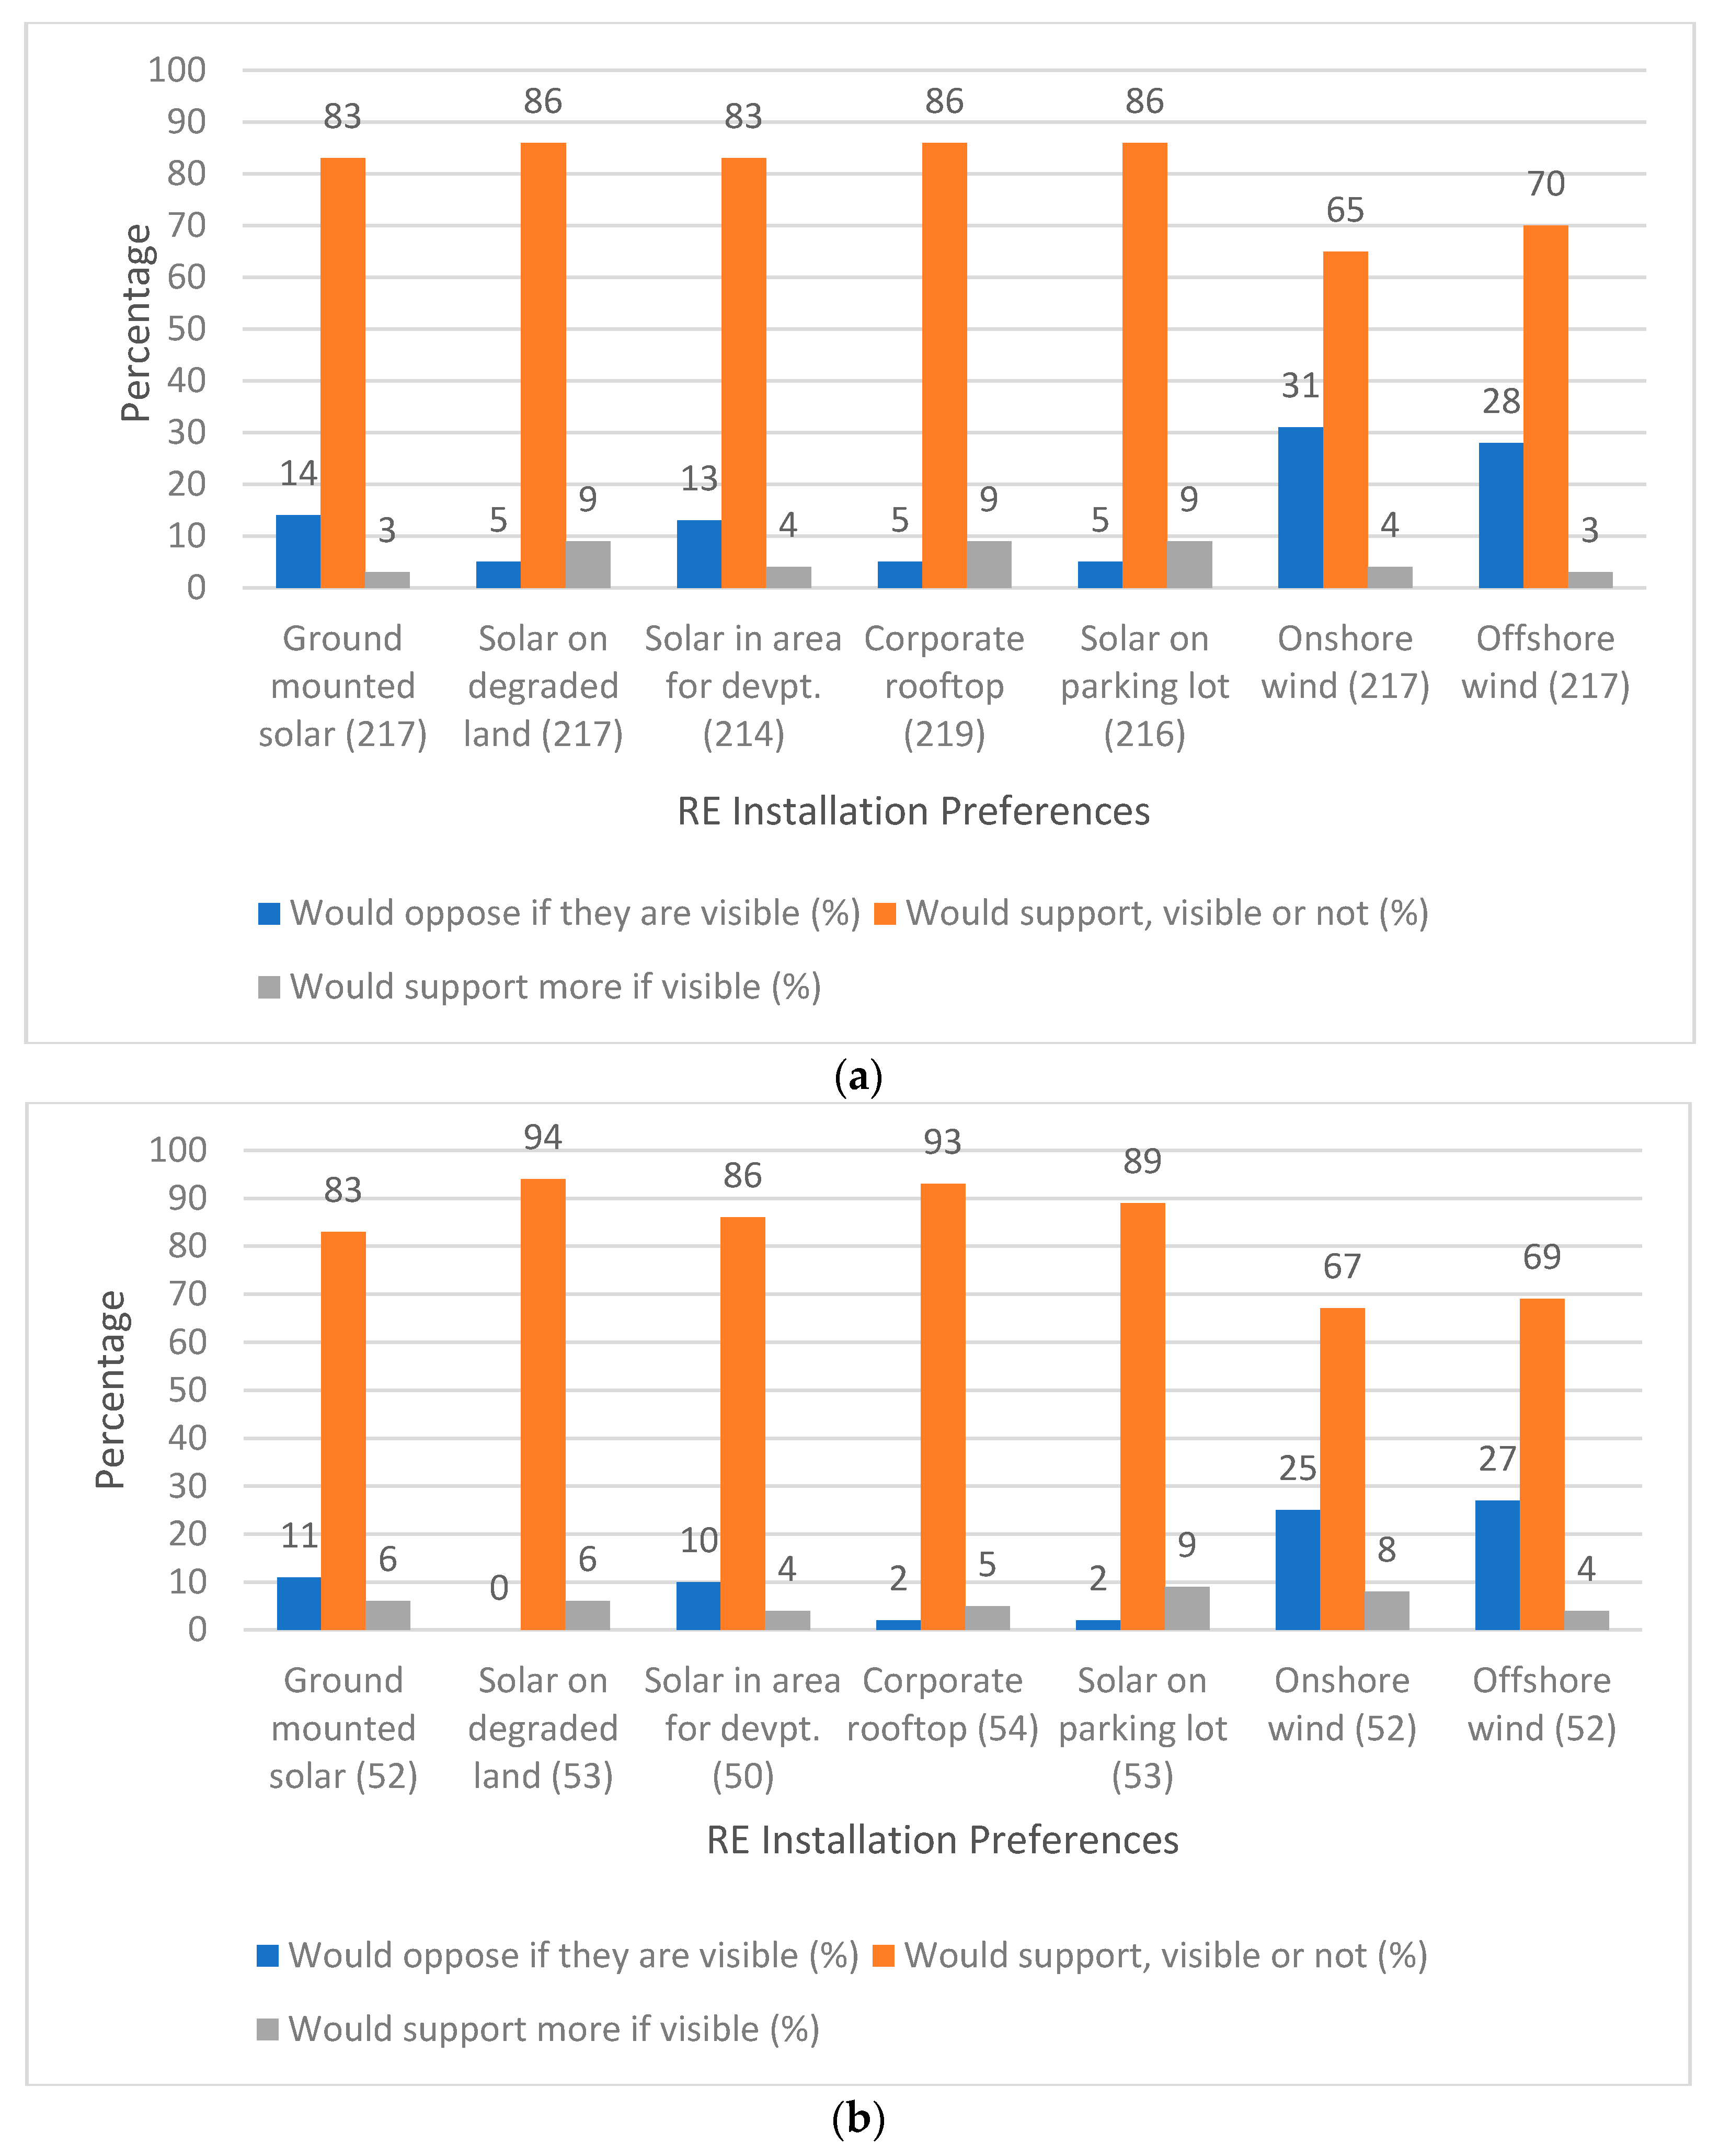
Another question asked in the survey relates to the kinds of RE technology installation options that residents would support and how their support would change based on the visibility of the technologies (
Figure 4a,b). The frequencies of each response in each category are given as numbers in parenthesis after the label on the
x-axis. In Houghton County, more than 80% of the respondents indicated that they would support all of the various RE installation options (see
Figure 4a), with 86% willing to support solar panels mounted in degraded land, panels on commercial or industrial rooftops, and panels that are shading parking lots or garages, and 83% indicating their support of ground-mounted solar technology and solar technology mounted in areas earmarked for development. All these responses are regardless of whether the panels are visible or not.
The levels of support for onshore and offshore wind were 65% and 70%, respectively. Additionally, between 3 and 9% of the respondents were willing to give more support to all these RE installation options if they were visible. On this spectrum, 9% were willing to support visible panels on each of degraded land, commercial or industrial rooftops, and parking lots. However, it is important to note the sharp difference between support for the various solar installation options and that of wind technology. On average, the absolute percentage difference in support regardless of visibility between all solar options and wind was approximately 17%. Furthermore, the opposition to wind installations (both onshore and offshore) was almost about 6 times as much as that of solar energy, despite the former having up to 70% support.
In the case of residents in non-Houghton counties (
Figure 4b), panels on commercial or industrial rooftops and on degraded lands had more than 90% support, higher than the results from Houghton County. Across the non-Houghton counties, there was no single response that was opposed to solar panels on degraded land. The same levels of lower support for onshore and offshore wind installations were observed in non-Houghton counties as for Houghton County. The responses also had a very close similarity between both places.
Project Financing Preferences
Residents responded to questions based on three predefined financing models. For model one, private developers or property owners can fund the project, own the system, and receive the return on investment. In model two, the local government invests in the renewable energy project with public funds and the return on investment can become part of the municipality’s public funds. For the third model, a “community renewable energy” development project allows members of the community to invest in renewable electricity production that is built locally. On the issue of preferences for the various RE project financing models,
Table 4 presents the distribution of residents’ responses from Houghton (orange color) and non-Houghton counties (blue color). The highest willingness to support rates in Houghton (combined “more likely” and “most likely”) was observed for privately funded projects developed as municipality renewable energy systems, where individual utility customers can elect to purchase the electricity generated, with 84% of 220 responses. In the non-Houghton counties, publicly funded projects developed as municipality RE systems, where individual utility customers can elect to purchase the electricity generated, had the highest support at 83%. As these two financing options with the highest supporting rates were very similar, it can be inferred that municipality RE development would attract the most support in the WUP in general. In both Houghton and non-Houghton counties, the options with the least support likelihood included privately funded projects by national or international companies for utilities’ purchase. The likelihoods that residents would be supportive of this project financing option were 35% and 36% for Houghton and non-Houghton counties, respectively.
Project Benefits
Respondents were asked about what they perceived to be the benefits of RE development. On average, all the categories of project benefits had more responses showing the likely support of residents (
Table 5). In Houghton County, 95% of respondents were more likely to support projects that provided jobs and other economic development benefits in their municipality and projects the provide lower electricity rates for individuals. These two benefits ranked highest among all others, although the “more likely to support” rate was generally high across all the benefits for Houghton County respondents. The benefit given the lowest response for “more likely to be supported,” at 61%, was for projects that create an increased tax base for the municipality.
In non-Houghton counties, 91% of the 56 respondents said they were more likely to support projects that provided jobs and other economic development benefits for their municipality. As in the case of Houghton County, projects that are geared toward creating taxes for the municipality also had the lowest levels of “more likely to support,” with 71% of respondents showing interest in it.
4.1.4. Summary of Descriptive Statistics of Survey
Support for solar energy was high and similar for Houghton and non-Houghton counties (>70%) compared to wind energy (<63%). Based on the response distribution in non-Houghton counties (other counties in the WUP), a greater female population are expected to support RE development from solar and wind energy technologies. Such an inference cannot be made of the male members in these counties due to the high data skewness.
Regarding installation preferences, solar panels on degraded land, such as landfills, stood out as the most likely to be supported by residents across the WUP. The project financing option with the highest support was municipally developed RE, either via private or public funding. Privately funded and owned projects by an international or national company would likely receive the most opposition in the WUP. Projects that provide jobs and other economic development benefits for the municipality and provide lower electricity rates for residents appeared to be on the radar of what the WUP residents would be more likely to support. This was true for both Houghton and non-Houghton counties.
4.2. Regression Analysis of Factors Influencing Support
Three hypotheses were developed for this research. The hypotheses that were tested in this research are as follows:
Hypothesis 1 (H1). Support for 100% RE in the WUP will be positively correlated with perceptions that RE has a positive impact on the environment.
Hypothesis 2 (H2). Support for 100% RE will be positively correlated with perceptions that RE will result in a possible reduction in electricity bills.
Hypothesis 3 (H3). WUP residents’ support for an energy efficiency program to reduce electricity consumption is positively correlated with support for a 100% RE transition.
Logistic regression analysis was also carried out to see how much influence some of the factors had on support for each of solar and wind energy development in Houghton County. All of the predictors (independent variables) were ordinal. In the case of energy consumption reduction, the Likert scale was from “I am likely to strongly oppose” to “I am likely to strongly support.” The predictors were converted to binary variables by collapsing “likely to support” and “likely to strongly support” categories to an equal likelihood (i.e., Yes = 1). Then, all “likely to oppose” and “likely to strongly oppose” were collapsed as unlikely (i.e., No = 0) as a worst-case scenario of opposition. The model was run with individual predictors rather than as an additive model.
The results show that in the case of support for both solar and wind energy, residents’ consideration of fossil fuel reduction as an important factor in RE development was statistically significant at
p < 0.05 (see
Table 6). Furthermore, their likelihood to participate in a municipally-led initiative that would reduce their energy consumption reduction by 5% was statistically significant at
p < 0.05, but only regarding support for wind development. The probabilities of having support for solar energy increased by a factor of 4.092, 2.939, 3.270, and 2.486 (beta coefficient) for the importance of fossil fuel reduction, positive impact on the environment, energy consumption reduction by 2%, and energy consumption reduction by 5%, respectively. The probabilities of having support for wind energy increased by a factor of 2.383 and 2.888 for the importance of fossil fuel reduction and energy consumption reduction by 5%, respectively. The importance of fossil fuel reduction increased this likelihood of residents’ support for solar energy development by approximately 10%, while the consumption reduction by 5% increased the support likelihood by 18%.
However, the likelihood to support solar energy development decreased with the perceived importance of electricity bill reduction. The same decrease in support for solar energy was observed for consumption reduction by 10% and adjusting consumption to match the RE.
The Nagelkerke R2 value for solar was approximately 0.8, while that of wind was 0.4. This shows that each of the independent variables was a strong predictor of support for solar energy development while being moderate support for wind energy development.
5. Discussion
Understanding the factors that will make residents more or less supportive of 100% RE is very important in the transition process. This is because the role of the public in terms of perceptions and acceptance is key to any sociotechnical transition [
13]. Another reason is that a public survey is one of the ways to garner public concern by subjecting plans and decisions to public acceptance. For instance, prior to the launch of a new product or technology into society, corporations or governments often sample public opinion through a survey or poll. The results from this research show that there was a positive relationship between public support for solar and wind energy development and whether the residents considered fossil fuel reduction as an important factor when supporting such developments. This positive relationship was also observed with support for energy consumption reduction by 2% and 5% to match the supply of available resources.
The general low response rate across the WUP did not meet the research sample target for inferential statistics of a 95% C.L and 3.34% margin error. While significant statistical inferences cannot be drawn for the WUP as a whole due to the low response rate from the counties, analysis of results for Houghton County alone can provide a roadmap of what to expect. The reason for this is that the sample size obtained from the county met the required sample size for a confidence level of 95%. The uniqueness of Houghton County could also mean some of the results are representative of counties in proximity, such as Baraga and Keweenaw. Houghton is the second-most populous county in WUP after Delta county. The county also has the third-highest population that is 18 years and above for participating in this research. Furthermore, Houghton is a host to two universities, namely, MTU and Finlandia, as well as a community college, namely, Gogebic Community College. These colleges employ residents from those counties in proximity as well as hosting businesses belonging to non-residents [
50].
In general, the knowledge level regarding RE was low in both Houghton and non-Houghton counties. The perceived knowledge level obtained in the survey was presented in a ranking form and does not provide further information on the specific knowledge they have about each technology. A future interview of these residents can help to gauge their knowledge base regarding RE.
Although approximately 80% of the respondents were in support of mid-to-large scale RE, there was a wide gap between support for solar energy and support for wind energy. It is, however, important to know what factors can make those in the neutral position support or oppose these energy technologies; if those respondents that are unsure of their support are assumed to fall into the opposing category, then about an equal split in these categories would be seen.
With 81% of the 220 respondents from Houghton County showing support for privately funded projects as municipally owned projects, where residents have the choice to either purchase the generated electricity or not, this financing option ranked as the highest among others. This preference must be carefully considered in future 100% RE planning since this could reflect interests in ensuring that there is a competitive energy market and/or shows how residents embrace democratic processes in energy decision-making. Furthermore, it aligns with the perspective of scholars working with the concepts of energy democracy, which is seen as a driver of a potential just energy transition to RE [
51].
Beyond environmental reasons, the economic benefits of low carbon and RE technologies, such as lower electricity prices, may hinder a resurgence of the coal industry. To gather support for 100% RE in Houghton County, for instance, projects offering job opportunities and other economic benefits for residents will likely receive higher levels of support. On the same spectrum, lower electricity rates for individuals as a personal benefit and income benefits for local farmers are other factors that may attract residents’ support. These three factors show the level of residents’ expectations from their energy system. Therefore, projects that will most directly benefit members should be on the radar in planning for a 100% RE transition in the WUP counties, especially Houghton County.
While a survey cannot replace the deeper forms of engagement, such as community-based participatory research [
52], it can serve as a foundation on which future energy planning in the community is built. For instance, some of the themes in the survey where the likelihood of support is low can be used in building an agenda for focus group interviews and discussions in future community engagement. Differences in RE technology preferences, for example, can help in identifying important topics of deliberation with local leaders, stakeholders, and policymakers. Solar energy technology installation on corporate or industrial rooftops, which has the highest likelihood of support by residents in both Houghton and non-Houghton counties, indicates the importance of including corporate stakeholders in future planning. While some scholars (e.g., [
53]) have opined that the energy transition from coal will be easy with the involvement of the community in the process, less attention is paid to the social dynamics involved in achieving such participation. Allowing public participation ensures that due process is followed in the planning and implementation processes. Such participation would make sure that community members or residents are given a fair share of any accompanying benefits and burdens from the RE project.
A survey of residents’ perceptions can serve as a foundation for building and incorporating future public engagement. Some of the various techniques for engaging the public include surveys, referenda, public hearings, negotiated rulemaking, consensus conferences, citizen panels, public advisory committees, and focus groups. Common themes in opinion research from surveys of residents can be a guide for future focus groups meetings and engagement with community members [
35,
54]. This survey questionnaire and the responses may therefore be useful in the preliminary stage of public recruitment for engagement in Houghton County and help in identifying where more resources need to be directed. Other counties with lower responses would need more outreach in the future, perhaps during a post-COVID19 period when residents might be under less socioeconomic pressures that the pandemic has caused.
The investigation of public perceptions, especially of residents and stakeholders as part of the socio-technical regime in STSTs, is a key component in the theory of socio-technical transitions [
13]. Understanding this perception can be combined with policy analysis in leading a successful and procedurally just energy transition to RE.
6. Conclusions
This research shows some of the important factors that can influence the WUP residents’ support for a 100% RE transition. Interest in the positive impacts on the environment, reduction in fossil fuel use, and energy consumption reduction positively predicted support for 100% RE development. The impact of consumption reductions to match renewable energy resources thus indicated the potential for energy efficiency programs’ acceptance in the studied area. Furthermore, projects that lower individual electricity bills while offering other direct economic benefits for residents and possess other municipality benefits, such as carpark shading and electric vehicle charging potential, should be considered in the planning of RE development. The visibility of renewable energy technologies will likely not hinder the public support of such a project.
While it may not be possible to conclusively state whether these factors can be generalized for all of the WUP counties due to the unrepresentativeness of the sample, the responses from Houghton County were sufficient to make inferences for the county. The online sampling frame used in this research may also present a weakness in terms of sampling bias, but this method was the most available option for assessing public perceptions in this time of the COVID19 global pandemic, economic shutdowns, and disruptions in socio-economic activities. The response rate prevented the capability to conclude how support differed from one county to another in the region. Nonetheless, the trend for Houghton County’s responses was similar to the responses from all the county participants, indicating that Houghton County residents did not report different perceptions regarding support for various forms of RE and the siting and financial types that may be involved in RE development.
The survey used in this research was intended to serve as a forerunner to an inclusive future participatory process for 100% RE generation in the WUP, a rural northern climate region in the state of Michigan. Future work should focus on increasing the response when surveying other counties in the WUP, along with the questions raised in this survey to get a more representative sample. Such work would require ensuring that the samples are more randomly collected. Furthermore, future community-engaged research, especially with respect to 100% RE development in Houghton County and elsewhere, should leverage the analysis in this paper when drawing a roadmap for the process of community-engaged explorations of a 100% RE transition.
In general, the methodology and survey instrument that were used in this research can be scaled and adapted for studying similar places across the United States and in other contexts during the preliminary stage of just 100% RE transition planning. As climate change discussions and the importance of STST in the electricity landscape increases, an investigation of the expectations and preferences of the wider public should be considered. Research on public perception in sociotechnical change such as this can be used as an integral part of public engagement. In the face of the twin climate change and current global pandemic challenges, the research approach in this paper offers a good option for gathering public perceptions of sociotechnical change.
Funding
This research was partially funded by the Great Lakes Research Center, MTU, and the Michigan Indigenous Community and Anishinaabe Renewable Energy Sovereignty (MICARES) research group.
Institutional Review Board Statement
The study project (IRB number 1635964-1) has been reviewed and determined to meet the following federal exemption category per 45 CFR 46.104d: Exemption Category: 2 (ii) (2) Research that only includes interactions involving educational tests (cognitive, diagnostic, aptitude, achievement), survey procedures, interview procedures, or observation of public behavior (including visual or auditory recording) if at least one of the following criteria is met: (ii) Any disclosure of the human subjects’ responses outside the research would not reasonably place the subjects at risk of criminal or civil liability or be damaging to the subjects’ financial standing, employability, educational advancement, or reputation; This determination is based on no greater than minimal risk to research participants. When a research project is determined to meet the criteria for an exempt status, it means the project as submitted is exempt from Michigan Technological Institutional Review Board (MTU-IRB) oversight and does not require annual continuing review. If you have any questions or need guidance on human subject research training, please contact HRPP personnel at 906-487-2902 or send an e-mail message to irb@mtu.edu.
Informed Consent Statement
Informed consent was obtained from all subjects involved in the study. The consent was received by each participant’s decision to participate in the online survey. Participants were duly informed of this means of consent to participate in the study.
Data Availability Statement
The data presented in this study are available on request from the corresponding author. The data are not publicly available due to confidentiality assurance of each participant’s information.
Acknowledgments
Special thanks to Chelsea Schelly from MTU for helping with proofreading and providing very useful feedback for this article. I would also like to acknowledge the effort of Zoe Reep from MTU for helping out with the survey information distribution in various WUP counties. The suggestions that were given by Mark Rouleau (also from MTU) on statistical analysis are also appreciated.
Conflicts of Interest
The author declares no conflict of interest.
Appendix A. Survey Questionnaire for Western UP County Residents (Survey Monkey)
Appendix A.1. How Would You Describe Your Current Level of Knowledge about Each of the Following Renewable Energy Sources for Electricity Supply?
Appendix A.1.1. Solar Energy
I have very little knowledge about solar energy
I have a little knowledge about solar energy
I am knowledgeable about solar energy
I am very knowledgeable about solar energy
Appendix A.1.2. Wind Energy
I have very little knowledge about wind energy
I have a little knowledge about wind energy
I am knowledgeable about wind energy
I am very knowledgeable about wind energy
Appendix A.1.3. Hydro Energy
I have very little knowledge about hydro energy
I have a little knowledge about hydro energy
I am knowledgeable about hydro energy
I am very knowledgeable about hydro energy
Appendix A.2. Please Indicate Your Level of Agreement with the Following
| | Strongly Disagree | Disagree | Neutral | Agree | Strongly Agree |
| It is the responsibility of all Americans to take action to address climate change | 0 | 0 | 0 | 0 | 0 |
| Using renewable energy can meaningfully address climate change | 0 | 0 | 0 | 0 | 0 |
| Solar energy technology is needed to meaningfully address climate change | 0 | 0 | 0 | 0 | 0 |
| Wind energy technology is needed to meaningfully address climate change | 0 | 0 | 0 | 0 | 0 |
| Hydro energy technology is needed to meaningfully address climate change | 0 | 0 | 0 | 0 | 0 |
Appendix A.3. Please Indicate Your Level of Agreement with the Following
| | Strongly Disagree | Disagree | Neutral | Agree | Strongly Agree |
| I would be more likely to support my municipality if I knew they’ve invested in renewable electricity | 0 | 0 | 0 | 0 | 0 |
| I think solar electricity is a good investment for local businesses | 0 | 0 | 0 | 0 | 0 |
| Solar electricity can meaningfully contribute to energy production for my community | 0 | 0 | 0 | 0 | 0 |
| I think wind electricity is a good investment for local businesses | 0 | 0 | 0 | 0 | 0 |
| Wind electricity can meaningfully contribute to energy production for my community | 0 | 0 | 0 | 0 | 0 |
| I think hydro electricity is a good investment for local businesses | 0 | 0 | 0 | 0 | 0 |
| Hydro electricity can meaningfully contribute to energy production for my community | 0 | 0 | 0 | 0 | 0 |
| Hydro electricity is most appropriate for commercial and business scale settings | 0 | 0 | 0 | 0 | 0 |
Appendix A.4. The following Questions Are about What You Value When It Comes to Thinking about Mid-To-Large-Scale Solar and Wind Energy Development in Your Municipality. Generally Speaking, Do You Support Solar Energy Development in Your Community?
Appendix A.5. When It Comes to Planning for 100% Renewable Electricity Development Projects in Your Community, Please Rate the Following Factors in Terms of Their Importance to You
| | Not at All Important | Slightly Important | Moderately Important | Very Important | Extremely Important |
| Reputation of renewable energy technology developer | 0 | 0 | 0 | 0 | 0 |
| Reputation of my utility company | 0 | 0 | 0 | 0 | 0 |
| Low cost of installation | 0 | 0 | 0 | 0 | 0 |
| Reduction in my electric bill | 0 | 0 | 0 | 0 | 0 |
| Positive impact on the environment | 0 | 0 | 0 | 0 | 0 |
| Leaving a positive legacy for future generations | 0 | 0 | 0 | 0 | 0 |
| Positive attitudes toward solar among my peers | 0 | 0 | 0 | 0 | 0 |
| Reduced dependence on imported fossil fuels | 0 | 0 | 0 | 0 | 0 |
Appendix A.6. According to the Michigan Public Service Commission (MPSC) in its Statewide Energy Assessment (SEA), Energy Efficiency Is Very Important in Ensuring Resilience in Grid Services, Limiting Energy Resources and Electricity Consumption, and Leading to a Corresponding Reduction in Electricity Expenses through Changes in Home Devices (TV, Refrigeration, Washing Machine, etc.) to More Efficient Ones or Those Involved in Retrofitting. Energy Efficiency Can also Facilitate Meeting Electricity Demands with Minimal Renewable Energy Resources
Appendix A.6.1. How More or Less Likely Are You to Participate in a Municipality-Led Initiative that Will Reduce the Electricity Consumption of Your Home Appliances by up to 10% of Your Current Demand?
Consumption Reduction by 2%
More likely
Less likely
Not likely
Consumption Reduction by 5%
More likely
Less likely
Not likely
Consumption Reduction by 10%
More likely
Less likely
Not likely
Appendix A.6.2. How Likely Are You to Adjust Your Consumption Pattern, such as Changing the Time You Perform Some Activities (e.g., Laundry) to Align with Renewable Electricity Generation?
Appendix A.7. When It Comes to Renewable Energy Development in Your County, Which of the Following Would You Identify as Benefits/Reasons You Would Support? (Please Select ALL that Apply.)
I believe RE technologies will provide economic benefits to me as a utility ratepayer
I believe RE will decrease my electricity rates
I believe RE will provide the economic benefit of jobs in my community
I believe RE has local environmental benefits
I believe RE has larger-scale (regional to global) environmental benefits
I believe RE has appealing or neutral aesthetic/visual impacts
I believe RE has positive health impacts for me and/or my family
None of the above
Appendix A.8. When It Comes to RE Development in Your Municipality/County, Which of the Following Would You Identify as the Reasons You Would Not Support? (PLEASE Select ALL that Apply.)
I do not like the aesthetic/visual impacts of RE technologies
I am concerned that RE technologies have negative and unacceptable health impacts
I am concerned that RE technologies have negative and unacceptable environmental impacts
I am concerned that RE technologies are not a good economic investment
I am concerned that RE development will increase my electricity rates
I am concerned that the economic benefits of RE technologies are unfairly distributed
I am concerned that RE will have a negative economic impact on me or my community
None of the above
Appendix A.9. What Kinds of Renewable Energy Installation Options would You Support and How Would Your Support Change Based on Visibility from Roads or homes in Your Community?
| | Would Strongly Oppose If They Are Visible | Would Oppose If They Are Visible | Would Support Whether or Not They Are Visible | Would Strongly Support If They Are Visible |
| Ground-mounted solar panels | | | | |
| Ground-mounted solar panels on previously degraded lands such as landfills | | | | |
| Ground-mounted solar panels in areas that were previously cleared for development purposes | | | | |
| Solar panels mounted on commercial or industrial rooftops | | | | |
| Solar panels shading parking lots and parking garages | | | | |
| Onshore wind turbine installation | | | | |
| Offshore wind turbine installation | | | | |
Appendix A.10. Financing Renewable Energy Development, such as Solar, Hydro, and Wind, Can Involve Different Financial Models
Private developers or property owners can fund the project, own the system, and receive the return on investment.
Local governments can also invest in the renewable energy project with public funds and the return on investment can become part of the municipality’s public funds.
A “community renewable energy” development project allows members of the community to invest in renewable electricity production that is built locally.
If renewable energy development were to occur in your community, what kind of financial model would you prefer? Please indicate your level of support:
| | Do Not Support | Less Likely to Support | More Likely to Support | Most Likely to Support |
| Public financing using public funds for projects on public buildings in your community | | | | |
| Privately funded projects built by local companies, with the electricity generated purchased by the utility | | | | |
| Privately funded projects built by national or international companies, with the electricity generated purchased by the utility | | | | |
| Privately funded projects developed as community renewable energy systems, where individual utility customers like yourself can elect to purchase the electricity generated | | | | |
| Publicly funded projects developed as community renewable energy systems, where individual utility customers like yourself can elect to purchase the electricity generated | | | | |
| Privately funded projects on private property, with the electricity generated going primarily to the property owner. | | | | |
Appendix A.11. Renewable Energy (Solar and Wind) Development Projects Involve a Series of Choices. For the Choices Below, Please Indicate which of the Following You Would Be Less and More Likely to Support or If Your Support Would Change if the Project Required Tree Removal. If Solar Development Were to Occur in Your Community, Would These Factors Change Your Support for the Project?
| | Less Likely to Support | More Likely to Support | Would Not Support If ANY Tree Removal Is Required |
| The project is developed with mixed uses in mind, for example, carport parking that also has a rooftop solar system, electric vehicle charging station, etc. | | | |
| The project is sited so that it provides a supplemental income for farmers in my municipality | | | |
| The project is designed to provide lower electricity rates to low-income households in my community | | | |
| The project provides jobs and other forms of economic development in my community | | | |
| The project is designed to provide lower electricity rates to schools in my community | | | |
| The project provides lower electricity rates for me personally | | | |
| The project provides a way for me to personally access electricity from renewable energy resources | | | |
| The project creates an increased tax base for my community | | | |
| The project reduces greenhouse gas emissions, which contributes to mitigating climate change | | | |
| The project is developed INSTEAD of putting light industrial development on that site | | | |
| The project is developed INSTEAD of putting a commercial building or strip mall on that site | | | |
| The project is developed INSTEAD of putting a new housing development on that site | | | |
| The project is developed INSTEAD of developing new fossil-fuel-based electricity resources | | | |
Appendix A.12. Demographic Information: Please Complete the Following Questions to Provide Some Demographic Data about Yourself. Please Remember that This Information Is Completely Voluntary and Confidential
Appendix A.12.1. In which Western UP County Is Your Primary Place of Residence Located?
Baraga__ Delta__ Dickson__
Gogebic__ Houghton__ Iron__
Keweenaw__ Marquette__ Menominee__
Ontonagon__ “Others”__
Appendix A.12.2. What Is Your Age?
18–29 years
30–39 years
40–49 years
50–59 years
60–69 years
70 years or older
Prefer not to answer
Appendix A.12.3. What Is Your Gender?
Male
Female
Other
Prefer not to answer
Appendix A.12.4. What Is Your Education Level?
Appendix A.12.5. What Is Your Total Annual Household Income Range?
$0 to $50,000
$50,000 to $100,000
$100,000 to $200,000
$200,000 to $300,000
$300,000 to $400,000
$400,000 to $500,000
Above $500,000
Prefer not to answer
Appendix A.12.6. What Best Describes Your Race (Choose All that Apply)?
White
Black or African American
Asian
American Indian or Alaska Native
Native Hawaiian or Other Pacific Islander
Other
Prefer not to answer
Appendix A.12.7. Are You Hispanic or Latino?
No
Yes
Prefer not to answer
Appendix A.12.8. What Is Your Political Affiliation?
Democrat
Republican
Other
Prefer not to answer
Appendix A.13. Please Provide a Phone Number/Email Address that Can Be Contacted If You Won the Draw for the $100 Gift Card
____________________
THANK YOU for taking the time to complete this survey!
References
- Kumar, S.; Managi, S. Energy price-induced and exogenous technological change: Assessing the economic and environmental outcomes. Resour. Energy Econ. 2009, 31, 334–353. [Google Scholar] [CrossRef]
- Goldstein, A.; Doblinger, C.; Baker, E.; Anadón, L.D. Patenting and business outcomes for cleantech startups funded by the Advanced Research Projects Agency-Energy. Nat. Energy 2020, 5, 803–810. [Google Scholar] [CrossRef]
- Stephens, J.C.; Wilson, E.J.; Peterson, T.R. Socio-Political Evaluation of Energy Deployment (SPEED): An integrated research framework analyzing energy technology deployment. Technol. Forecast. Soc. Chang. 2008, 75, 1224–1246. [Google Scholar] [CrossRef]
- Wolsink, M. Invalid theory impedes our understanding: A critique on the persistence of the language of NIMBY. Trans. Inst. Br. Geogr. 2006, 31, 85–91. [Google Scholar] [CrossRef]
- Wolsink, M. Wind power and the NIMBY-myth: Institutional capacity and the limited significance of public support. Renew. Energy 2000, 21, 49–64. [Google Scholar] [CrossRef]
- Geels, F.W.; Schot, J. Typology of sociotechnical transition pathways. Res. Policy 2007, 36, 399–417. [Google Scholar] [CrossRef]
- Adesanya, A.A.; Sommerfeldt, N.; Pearce, J.M. Achieving 100% Renewable and Self-Sufficient Electricity in Impoverished, Rural, Northern Climates: Case Studies from Western Upper Michigan, USA. Under Rev. 2020. [Google Scholar]
- Carlisle, J.E.; Kane, S.L.; Solan, D.; Joe, J.C. Support for solar energy: Examining sense of place and utility-scale development in California. Energy Res. Soc. Sci. 2014, 3, 124–130. [Google Scholar] [CrossRef]
- Schelly, C.; Price, J.; Delach, A.; Thapaliya, R.; Leu, K. Improving solar development policy and planning through stakeholder engagement: The Long Island Solar Roadmap Project. Electr. J. 2019, 32, 106678. [Google Scholar] [CrossRef]
- Geels, F.W.; Kemp, R. Dynamics in socio-technical systems: Typology of change processes and contrasting case studies. Technol. Soc. 2007, 29, 441–455. [Google Scholar] [CrossRef]
- Geels, I.F.W. The dynamics of transitions in socio-technical systems: A multi-level analysis of the transition pathway from horse-drawn carriages to automobiles (1860–1930). Technol. Anal. Strat. Manag. 2005, 17, 445–476. [Google Scholar] [CrossRef]
- Geels, F.W. Micro-foundations of the multi-level perspective on socio-technical transitions: Developing a multi-dimensional model of agency through crossovers between social constructivism, evolutionary economics and neo-institutional theory. Technol. Forecast. Soc. Chang. 2020, 152, 119894. [Google Scholar] [CrossRef]
- Geels, F.W. Disruption and low-carbon system transformation: Progress and new challenges in socio-technical transitions research and the Multi-Level Perspective. Energy Res. Soc. Sci. 2018, 37, 224–231. [Google Scholar] [CrossRef]
- Geels, F.W. From sectoral systems of innovation to socio-technical systems: Insights about dynamics and change from sociology and institutional theory. Res. Policy 2004, 33, 897–920. [Google Scholar] [CrossRef]
- Boudet, H.S. Public perceptions of and responses to new energy technologies. Nat. Energy 2019, 4, 446–455. [Google Scholar] [CrossRef]
- Diesendorf, M.; Elliston, B. The feasibility of 100% renewable electricity systems: A response to critics. Renew. Sustain. Energy Rev. 2018, 93, 318–330. [Google Scholar] [CrossRef]
- Becker, S.; Frew, B.A.; Andresen, G.B.; Zeyer, T.; Schramm, S.; Greiner, M.; Jacobson, M.Z. Features of a fully renewable US electricity system: Optimized mixes of wind and solar PV and transmission grid extensions. Energy 2014, 72, 443–458. [Google Scholar] [CrossRef] [Green Version]
- Hart, E.K.; Jacobson, M.Z. A Monte Carlo approach to generator portfolio planning and carbon emissions assessments of systems with large penetrations of variable renewables. Renew. Energy 2011, 36, 2278–2286. [Google Scholar] [CrossRef]
- Prehoda, E.; Winkler, R.; Schelly, C. Putting research to action: Integrating collaborative governance and community-engaged research for community solar. Soc. Sci. 2019, 8, 11. [Google Scholar] [CrossRef] [Green Version]
- Swofford, J.; Slattery, M. Public attitudes of wind energy in Texas: Local communities in close proximity to wind farms and their effect on decision-making. Energy Policy 2010, 38, 2508–2519. [Google Scholar] [CrossRef]
- Adesanya, A.A.; Sidortsov, R.V.; Schelly, C. Act locally, transition globally: Grassroots resilience, local politics, and five municipalities in the United States with 100% renewable electricity. Energy Res. Soc. Sci. 2020, 67, 101579. [Google Scholar] [CrossRef]
- Hess, D.J.; Gentry, H. 100% renewable energy policies in U.S. cities: Strategies, recommendations, and implementation challenges. Sustain. Sci. Pr. Policy 2019, 15, 45–61. [Google Scholar] [CrossRef] [Green Version]
- Hayley, M.B.; DeFrancia, K.; Schroder, A. Moving Towards 100% Renewable Energy: Drivers Behind City Policies and Pledges. In Proceedings of the 76th Annual Midwest Political Science Association Conference, Chicago, IL, USA, 5–8 April 2018. [Google Scholar]
- Sierra Club. 100 U.S. Cities are Committed to 100 Percent Clean, Renewable Energy. Sierra Club. 2018. Available online: https://www.sierraclub.org/press-releases/2019/03/100-us-cities-are-committed-100-percent-clean-renewable-energy (accessed on 12 February 2019).
- Sierra-Club. 100 Percent Clean Energy: The New Normal. n.d. Available online: https://www.sierraclub.org/articles/2019/05/100-percent-clean-energy-new-normal (accessed on 15 August 2019).
- National League of Cities. Number of Municipal Governments and Population Distribution. 2007. Available online: https://www.nlc.org/number-of-municipal-governments-population-distribution (accessed on 26 September 2020).
- Petrova, M.A. NIMBYism revisited: Public acceptance of wind energy in the United States. Wiley Interdiscip. Rev. Clim. Chang. 2013, 4, 575–601. [Google Scholar] [CrossRef]
- Delucchi, M.A.; Jacobson, M.Z. Providing all global energy with wind, water, and solar power, Part II: Reliability, system and transmission costs, and policies. Energy Policy 2011, 39, 1170–1190. [Google Scholar] [CrossRef]
- Rey-Hernández, J.M.; Yousif, C.; Gatt, D.; Velasco-Gómez, E.; San José-Alonso, J.; Rey-Martínez, F.J. Modelling the long-term effect of climate change on a zero energy and carbon dioxide building through energy efficiency and renewables. Energy Build. 2018, 174, 85–96. [Google Scholar] [CrossRef]
- Elliott, D. Energy efficiency and renewables. Energy Environ. 2004, 15, 1099–1105. [Google Scholar] [CrossRef]
- MPSC. MPSC Approves Part of DTE Electric Co.’s Renewable Energy Plan, Delays Decision on Future Wind Projects to Company IRP 2019. Available online: https://www.michigan.gov/mpsc/0,9535,7-395-93307_93313_17280-502194--,00.html (accessed on 17 July 2020).
- Devine-Wright, P.; Howes, Y. Disruption to place attachment and the protection of restorative environments: A wind energy case study. J. Environ. Psychol. 2010, 30, 271–280. [Google Scholar] [CrossRef]
- Haggett, C. Understanding public responses to offsore wind power. Energy Policy 2011, 39, 503–510. [Google Scholar] [CrossRef] [Green Version]
- Liu, L.; Walchale, A. 100 percent Renewable Electricity Plan for Leelanau County, Michigan; Research Report submitted to the School of Environment and Sustainability; University of Michigan: Ann Arbor, MI, USA, 2019. [Google Scholar]
- Jami, A.A.N.; Walsh, P.R. The role of public participation in identifying stakeholder synergies in wind power project development: The case study of Ontario, Canada. Renew. Energy 2014, 68, 194–202. [Google Scholar] [CrossRef]
- Ikejemba, E.C.; Schuur, P.C.; Van Hillegersberg, J.; Mpuan, P.B. Failures & generic recommendations towards the sustainable management of renewable energy projects in Sub-Saharan Africa (Part 2 of 2). Renew. Energy 2017, 113, 639–647. [Google Scholar] [CrossRef]
- Enevoldsen, P.; Sovacool, B.K. Examining the social acceptance of wind energy: Practical guidelines for onshore wind project development in France. Renew. Sustain. Energy Rev. 2016, 53, 178–184. [Google Scholar]
- Winkler, R.; Oikarinen, L.; Simpson, H.; Michaelson, M.; Gonzalez, M.S. Boom, bust and beyond: Arts and sustainability in Calumet, Michigan. Sustainability 2016, 8, 284. [Google Scholar] [CrossRef] [Green Version]
- Winkler, R. Living on Lakes: Segregated Communities and Inequality in a Natural Amenity Destination. Sociol. Q. 2013, 54, 105–129. [Google Scholar] [CrossRef]
- Dunn, K.; Jhaveri, K.; Lin, K.; Michalski, J.; Rego, B. SUN POWER: Examining the Costs and Benefits of Community Solar in the Keweenaw Bay Region of Michigan’s Upper Peninsula 2018. Research Report submitted to Dow Sustainability, University of Michigan: Ann Arbor, MI, USA. Available online: http://sustainability.umich.edu/media/files/dow/CommunitySolar-UP-Team4-2018-Report.pdf (accessed on 21 June 2020).
- Prehoda, E.; Pearce, J.M.; Schelly, C. Policies to overcome barriers for renewable energy distributed generation: A case study of utility structure and regulatory regimes in Michigan. Energies 2019, 12, 674. [Google Scholar] [CrossRef] [Green Version]
- State of Michigan. Executive Order 2019-14 UP Energy Task Force 2019. Available online: https://content.govdelivery.com/attachments/MIEOG/2019/06/07/file_attachments/1226627/EO2019-14UPEnergyTaskForce.pdf. (accessed on 22 April 2020).
- State of Michigan. State of Michigan Executive Directive; No.2020-10; Re: Building a Carbon Neutral Michigan. 2020. Available online: https://www.michigan.gov/whitmer/0,9309,7-387-90499_90704-540278--,00.html (accessed on 5 October 2020).
- Western Upper Peninsula Planning & Development Region. Community Solar Planning. 2017. Available online: https://www.wuppdr.org/regional-planning/community-solar-planning/ (accessed on 1 September 2019).
- Barnett, B.; Prehoda, E.W.; Kantamneni, A.; Winkler, R.L.; Schelly, C. Applying transdisciplinary research to enhance low-to-moderate income households’ access to community solar. In A Research Agenda for Environmental Management; Edward Elgar Publishing: Cheltenham, UK, 2019. [Google Scholar]
- Glisa. Western Upper Michigan. 2020. Available online: http://glisa.umich.edu/division/mi01 (accessed on 17 April 2020).
- Social Explorer. U.S. Census n.d. Available online: https://www.socialexplorer.com/profiles/essential-report/houghton-county-michigan.html (accessed on 21 March 2020).
- Ferrarini, T.H. Community and Economic Profiles for Michigan’s Upper Peninsula; An Economic Snapshot: Demographics, Labor Force, Major Employers, Government, Community Development, and More Featuring Data from 2014 and 2015. Available online: http://upeda.org/wp-content/uploads/2017/01/CountyProfile_2015_full.pdf (accessed on 3 October 2020).
- Dillman, D.; Jolene, A.D.; Smyth, L.M.C. Internet, Phone, Mail, and Mixed-Mode Surveys: The Tailored Design Method; John Wiley & Sons: Hoboken, NJ, USA, 2014. [Google Scholar]
- Backon, M.R.; Foltz, P. City of Houghton. 2019. Available online: https://www.cityofhoughton.com/wp-content/uploads/2020/02/2019-23-Complete_Master_Plan.pdf (accessed on 2 November 2020).
- Burke, M.J.; Stephens, J.C. Political power and renewable energy futures: A critical review. Energy Res. Soc. Sci. 2018, 35, 78–93. [Google Scholar] [CrossRef]
- Kantamneni, A.; Winkler, R.L.; Calvert, K. Incorporating Community: Opportunities and Challenges in Community Engaged Research; Edward Elgar Publishing: Cheltenham, UK, 2019. [Google Scholar]
- Carley, S.; Evans, T.P.; Konisky, D.M. Adaptation, culture, and the energy transition in American coal country. Energy Res. Soc. Sci. 2018, 37, 133–139. [Google Scholar] [CrossRef] [Green Version]
- State of Victoria D of S and E. Effective Engagement: Building relationships with community and other stakeholders; Book 3 the engagement toolkit. Melbourne: The Community Engagement Network, Resource and Regional Services Division. 2005. Available online: https://sustainingcommunity.files.wordpress.com/2018/05/effective-engagement-book-3.pdf (accessed on 25 November 2020).
| Publisher’s Note: MDPI stays neutral with regard to jurisdictional claims in published maps and institutional affiliations. |
© 2021 by the author. Licensee MDPI, Basel, Switzerland. This article is an open access article distributed under the terms and conditions of the Creative Commons Attribution (CC BY) license (http://creativecommons.org/licenses/by/4.0/).


