Article

Evaluating Different Catch Crop Strategies for Closing the Nitrogen Cycle in Cropping Systems—Field Experiments and Modelling

1
Grass and Forage Science/Organic Agriculture, Christian Albrechts University, 24118 Kiel, Germany
2
Department of Grass and Forage Science/Organic Agriculture, Wageningen University, P.O. Box 338, 6700 AH Wageningen, The Netherlands
3
Department of Agroecology, Aarhus University, 8830 Tjele, Denmark
*
Author to whom correspondence should be addressed.
Sustainability 2021, 13(1), 394; https://doi.org/10.3390/su13010394
Submission received: 19 November 2020 / Revised: 22 December 2020 / Accepted: 28 December 2020 / Published: 4 January 2021
(This article belongs to the Special Issue Suitable Agronomic Techniques for Sustainable Agriculture)

Abstract

:
For arable stockless farming systems, the integration of catch crops (CC) during the fallow period might be a key for closing the nitrogen (N) cycle, reducing N leaching and increasing the transfer of N to the subsequent crop. However, despite considerable research efforts, the fate of N in such integrated systems remains unclear. To address this, a two-year field experiment was carried out in northern Germany with different CC, including frost-tolerant and frost-killed CC. The experiment started following a two-year ryegrass/red clover ley, which was subsequently sown with a cereal (CE) or a grain legume (field pea, PE). This provided two contrasting systems with high residual N in autumn. The results showed high N uptake of the CC, ranging from 84 to 136 kg N ha−1 with PE as the pre-crop, and from 33 to 110 kg N ha−1 with CE. All CC reduced N leaching compared with the control, a bare fallow over autumn/winter. Of the various CC, the frost-killed CC showed higher leaching compared with the other CCs, indicating mineralisation of the CC residue in the later autumn/winter period. The process based APSIM (Agricultural Production SIMulator) model was used to simulate N cycling for a cereal grain legume rotation, including a frost-killed and a frost resistant CC. While the model simulated the biomass and the N uptake by the crops, as well as the reduction of N leaching with the use of CC well, it under-estimated N leaching from the frost-killed CC. The study showed that all CC were affective at reducing N leaching, but winter hard catch crops should be preferred, as there is a risk of increased leaching following the mineralisation of residues from frost-killed CC.

1. Introduction

Nitrate leaching losses from intensive cropping systems are a major contributor to elevated nitrogen (N) concentrations in waterways worldwide [1,2,3]. In arable systems, the use of catch crops (CC) during the fallow period might be a key for closing the N cycle, reducing N leaching and increasing the supply of N to the subsequent crop. The latter is especially important in stockless systems, regardless if these are conventionally or organically managed.
While in mixed farming systems in Europe, forage crops have traditionally been required as an additional source to meet the feed requirements of ruminants, these have become superfluous in specialized arable systems within the last 40 years. However, within the last decade agricultural policies focused increasingly on the integration of CC in arable systems. This has been driven by the ‘multifunctional benefits’ of CC, including reduction of runoff and soil erosion, increases in soil C sequestration, weed suppression, a reduction in N leaching, and in the case of a legume CC a valuable N source [4,5], and especially Catch crops in the autumn/winter period are mandatory in Denmark, and subsidized in Norway, Sweden, and Finland [6]. Triggered by the ‘greening direct payment strategy’ in Germany [7], the arable land with CC is also rapidly expanding [8]. Another incentive for growing CC are the recent fertilisation regulations in Germany [9], which permit the application of slurry to CC (as well as to early sown winter rape and winter barley), as these can efficiently take up the N applied through the slurry.
Many studies have been conducted to identify efficient CCs, regarding N leaching. However, this is not an easy task, as the effectiveness depends on environmental conditions during the growth period of the CC to ensure a high biomass growth, as well as during the decomposition of the CC residue. The latter is important for synchronising the N release and demand of the subsequent main crop. To enhance the growth of CC and their potential to reduce N leaching CC are often undersown into the spring cereal [6] or as an understorey into maize [10,11]. Non-legume CC have been found to take up as much as 200 kg N ha−1 [12], although under the climatic conditions in northern Germany values for N-accumulation in above- and belowground biomass around 80 kg N ha−1 seem more reasonable [13].
In stockless systems, the use of legume CC could also be valuable. However, as pure legume CC are less effective in reducing N leaching (Couëdel et al., 2018), mixtures of legume-non legumes have been promoted [14,15,16]. Based on an experiment in Switzerland and a linear model, which estimates the contributions of species identities and interactions on biomass, However, based on a meta-data analysis with 39 observations from irrigated agriculture, Quemada et al. [17] found that non-legume CC reduce N leaching by 50%, whereas legume CC and legume-non legume mixtures do not reduce N leaching. In contrast, based on a study in Denmark, Vogeler et al. [18] found the reduction in N leaching in CC mixtures can be as effective as non-legume CC, as long as the mixtures were balanced with a similar proportion of non-legumes and legumes. Under conditions, where the legume proportion was much higher than that of the non-legume, N leaching increased in their study. These results highlight that the use of legumes within CC mixtures can increase the risk of N leaching, especially under the maritime climate conditions of Northern Germany, where mild temperatures in autumn promote N release from catch crop residues and high rainfall increase the potential of N losses. Similarly, the use of freeze-killed CC can increase the risk of N leaching, as observed by Gollner et al. [19].
Agroecosystem models are widely used for estimating the effect of farm management on productivity and environmental impacts [20]. However, before such models can be used for scenario analyses as a basis for farm management decisions and policy guidance, they need to be tested based on field observations [21]. For evaluating the effect of CC, knowledge of the amount of N uptake of the CC and the subsequent N release is required for adjusting of N fertilization rates of the succeeding crop [22]. Among other models, the Agricultural Production SIMulator, (APSIM; [23]) has been widely used for simulating the effect of farm management strategies on productivity, profitability, and N losses for many different crops [24,25,26]. However, while APSIM has been tested in a wide range of environments, the model has only recently been tested for temperate zones in Europe, and only for a few selected crops [27,28,29,30]. Several model inter-comparison studies have also revealed that most models have considerable difficulties in simulating N dynamics in crop rotations [20,31]. Thus, further testing is required before APSIM can be used to optimise crop rotations with high productivity and low environmental impact. Especially the ability of the model to capture N flows within crop rotations and catch crops needs to be tested based on field observations.
The objectives of this study were to investigate the benefits of various catch crops following high N input by crop residues in reducing N leaching and increasing the growth and yield of the subsequent main crop. The hypothesis was that (i) frost-tolerant CC are more effective in reducing N leaching compared to frost-killed CC, and that (ii) legume non-legume mixtures can be as effective as pure non-legume CC, while also providing a valuable N source. Furthermore, the APSIM model was tested regarding the prediction of (i) production levels, (ii) nitrogen leaching losses, (iii) to see if the model can capture the effect of CC in such a system, including potential supply of N to the subsequent main crop, and (iv) to identify potential weaknesses of the APSIM model which require attention, when simulating complex crop sequences.

2. Materials and Methods

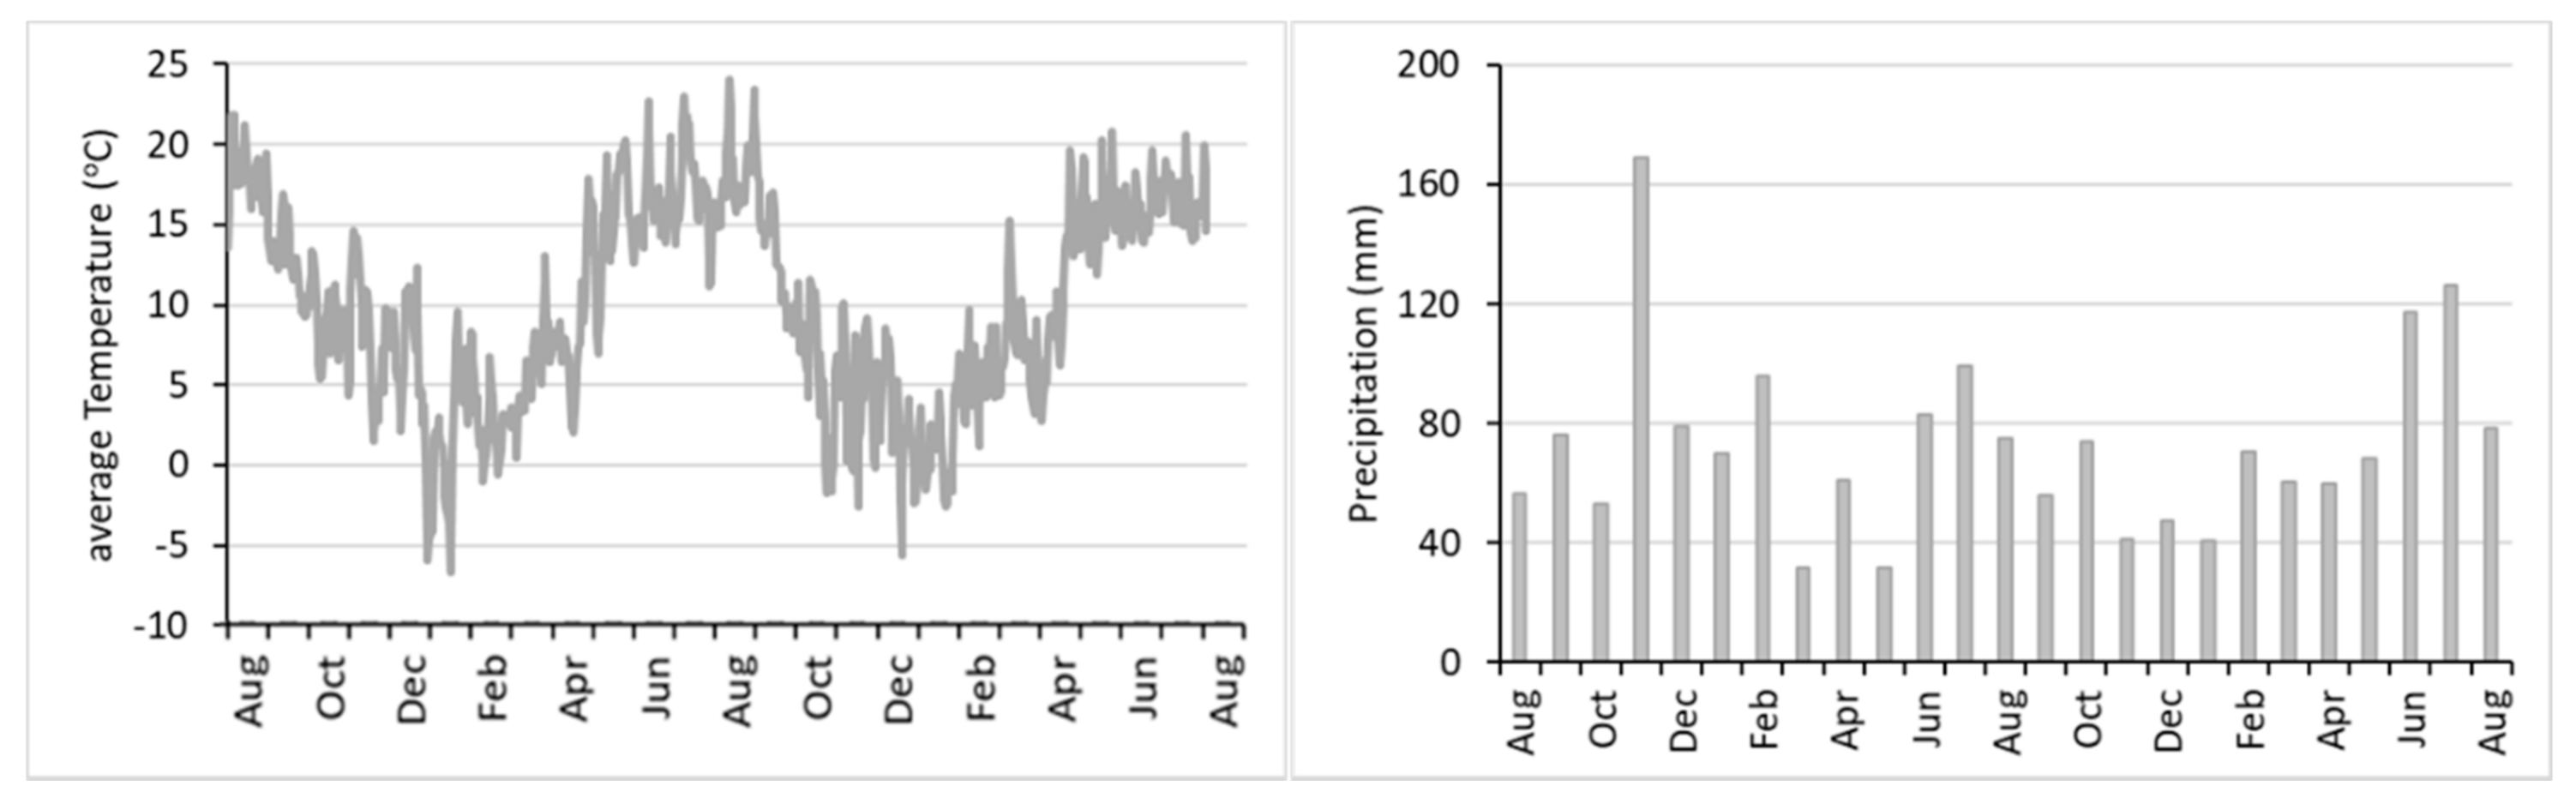
2.1. Study Site Description

The field experiment was carried out on the experimental farm ‘Bovenau’ located in the Eastern Upland part of Schleswig-Holstein (54°19′15′′ N, 9°48′27′′ E). The historical management of the site was arable land use with a 3-year conventional crop rotation (winter rape (Brassica napus)–winter wheat (Triticum aestivum)–winter barley (Hordeum vulgare)). In autumn 2012, the experimental plots were cultivated for two years with a ryegrass-red clover mixture, which was mulched three times a year in order to provide the following CC with high amounts of easily degradable organic N from crop residues [32]. The soil is classified as Cambisol, and has a sandy loam texture (79% sand, 16% silt and 6% clay), an organic carbon content of 1.4%, a pH of 5.5 and a bulk density of 1.5 Mg m−3 in the upper 300 mm. Further details are provided in the Appendix A (Table A1).
Meteorological data were obtained from a station located 0.25 km from the experimental site (Germany’s National Meteorological Service—DWD-Station 06105 “Ostenfeld”). The average annual rainfall at the site is 826 mm, and the average temperature 8.8 oC. Climatic conditions during the two experimental farming years (2015/2016 and 2016/2017) are shown in Figure 1. Winter temperatures often decline to below 0 °C. In the winter period in 2015/16, minimum temperatures were below 0 °C on 46 days and in 2016/17 on 58 days. The first frost occurred in 2015 on the 22nd of November, and in 2016 on the 26th of October.

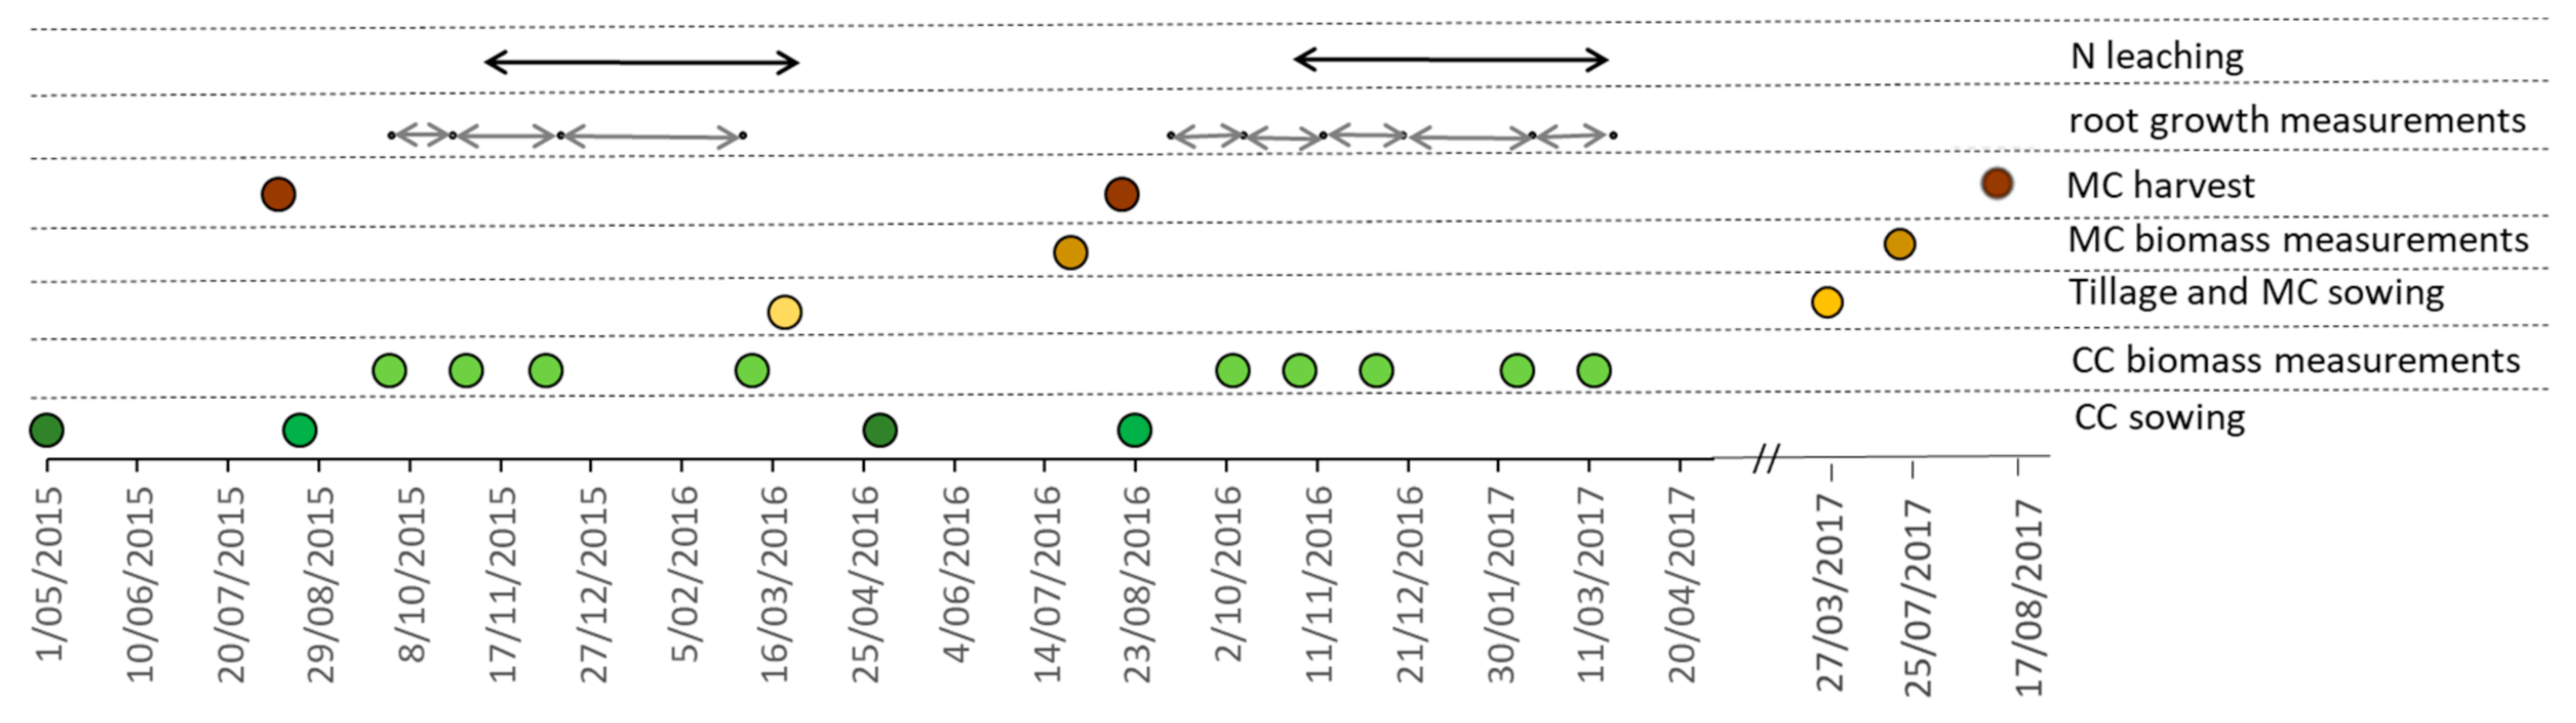
2.2. Crop Rotations and Experimental Setup

In late summer 2014, a crop rotation was established with ryegrass/red clover (Lolium perenne/Trifolium pratense)–summer wheat (Triticum aestivum)–winter triticale (Triticosecale cv. Securo)–fieldpea (Pisum sativum cv. Alvesta)–oat (Avena sativa cv. Max). Within this crop rotation, a CC field experiment was established in May 2015. The field experiments were carried out over two years, with August 2015 to July 2016 denoted as 2015 and August 2016 to July 2017 denoted 2016. To test the effect of the previous crop on CC biomass production and nitrogen retention, all CC treatments were established (on different fields) after either a cereal (CE) or a field pea (PE). In 2015 the CE was a summer wheat and in 2016 a winter triticale, which were sown at a rate of 160 kg ha−1 and 95 kg ha−1, and the PE was sown at a rate of 260 kg ha−1. Six different catch crop treatments and two different controls were implemented, as described below. A timeline of the experimental sowing, biomass sampling, and harvesting is presented in Figure 2. Experimental plots were laid out as a split plot design (year, previous crop, cover crop) with four replicates and a plot size of 4.5 m × 8.5 m. The design of the experimental layout in the two years in shown in the Appendix A (Table A2).
Three different CC species with different winter hardiness were used: a frost-killed white mustard (WM; Sinapis alba cv. Litember), a frost-tolerant turnip rape (TR; Brassica rapa L. var. silvestris cv. Jupiter), and a winter-hardy perennial ryegrass (RG; Lolium perenne cv. Kubus). Seeding rates were 20 kg ha−1 for WM and RG, and 12 kg ha−1 for TR. Additionally to these pure stands, all CC species were sown as bi-culture mixtures with a legume. For the WM the legume was a frost-killed (summer) common vetch (WM/SV; Vicia sativa cv. Ebena), for TR a frost-tolerant (winter) hairy vetch was used (TR/WV; Vicia villosa cv. Ostsaat Dr. Baumann), and for the RG a white clover (RG/WC; Trifolium repens cv. Vysoscan). For these mixtures, the seeding rates were for WM/SV 60 kg ha−1 with 83% SV (by weight); for RG/WC 13 kg ha−1 with 23 % WC; and for TR/WV 62 kg ha−1 with 81% WV. Plots under green fallow (GF; natural vegetation, volunteer pre-crop) and bare fallow (BF) served as controls.
The RG and the RG/WC were undersown into the main crop in late May. The other CCs (WM, WM/SV, TR, TR/WV) were sown after harvest of the main crop in late August, and tillage to a depth of 7 cm. In March, all CC were incorporated into the soil by mulching, roto-tilling and ploughing to a depth of 25 cm depth for seedbed preparation of the subsequent crop. Based on the six-year crop rotation, the succeeding crops following CC were PE after CE and oat after PE. All cover and main crops were sown with a pneumatic drill at a row distance of 12.5 cm.

2.3. Plant Measurements

2.3.1. Catch Crops

The aboveground biomass (AGB) of the catch crops was sampled periodically during the CC period from random quadrats (0.25 m2), by cutting the plant material to ground level. A subsample was dried (58 °C for 48 h) and milled to 1 mm for C/N analyses as described below. At each sampling date the AGB samples were separated into the functional groups ‘non-legume cover crop’, ‘legume cover crop’, ‘volunteer crop’ and ‘unsown species’. The results give the maximum AGB for each CC, which is the maximum AGB of each CC measured in autumn (the date on which this occurred was differed between the CC). Figure 2 gives an overview of the above- and belowground sampling activities.
Belowground biomass (BGB) growths during the CC season was measured using the ingrowth core method (Chen et al., 2016), with three cores per plot. For this mesh bags (synthetic fibre net, mesh size 1 mm, diameter 4 cm, length 60 cm) were filled with pre-sieved (≤1 mm) and root-free topsoil from the same field and placed into cores, which were installed into the soil at an angle of 45° relative to the soil surface, to a vertical depth of 30 cm. Further details are provided in [33]. The cores were sampled in short intervals, see Figure 2. During winter the ingrowth cores were installed in November, and remained in the soil until the end of March. After the cores were sampled, the roots were washed over a 0.63 mm sieve and manually separated from other soil constituents. The cumulative root growth in the bags over the entire period provided the belowground net primary production.

2.3.2. Main Crops

The aboveground biomass from the pre- and subsequent main crops were determined at harvest in August from a random quadrat (0.25 m2) in each plot. Afterwards, the commercial grain yields of each plots was measured by machine harvesting (Model Delta, Wintersteiger AG, Ried im Innkreis, Germany) and area of 12 m2. All samples were analyzed for C/N.

2.4. Plant and Soil Analysis

After oven drying for 48 h at 40 °C a subsample of the above- and belowground plant material was milled for further analysis through a 1 mm sieve (Cyclotec mill, Foss, Hillerød, Denmark). Subsequently all plant samples were analyzed for carbon and nitrogen and ash contents with an elemental analyzer (Vario Max CN, Elementar, Hanau, Germany) applying the DUMAS combustion method.
The root material was dried at 58 °C, milled in a ball-mill, and the C- and N-content also determined by the ‘Dumas combustion’ method.
Soil samples were taken at monthly intervals in the top layer (0–30 cm) with a Pürckhauer boring rod (inner diameter of 2 cm) to determine soil mineral N as the sum of ammonium and nitrate (NH4-N + NO3-N = Nmin) amounts. In each plot in three replicates were taken, and the replicated samples were mixed and then immediately frozen until further processing. For determining possible N movement through the soil profile, additional Nmin samples were taken to a depth of 90 cm, in three depth intervals (0–30, 30–60, 60–90 cm). These samples were taken at the beginning (August), the middle (November) and end (March) of the CC vegetation period, and in each plot. Subsamples were taken simultaneously to determine soil C and N content.
Extractions for mineral nitrogen (Nmin) were done in a 0.0125 M CaCl2 solution, and the extracts were determined photometrically for NO3 and NH4 using a dual channel continuous flow analyzer (San ++, Skalar Analytical B.V., Breda, Netherlands). Soil dry weight was determined parallel by oven-drying a subsample at 105 °C. For the determination of organic carbon (Corg) and total nitrogen (Nt) content soil samples were oven dried at 30 °C until constant weight, sieved to a size of 2 mm, ball milled (Model MM-2; Retsch GmbH, Haan, Germany), and measured by dry ‘Dumas combustion’ in a C/N-Analyzer (Vario Max CN, Elementar, Hanau, Germany). The soil bulk density (dB) was measured on undisturbed soil cores (100 cm3) in different layers (15; 45; 75 cm) at the beginning and end of the CC vegetation period.

2.5. Measurement of Nitrate Leaching

To determine N leaching over the autumn/winter period (October to April), ceramic suction cups (Mullit, with a cup pore size of 1 µm, length of 54 mm, and diameter of 20 mm, ecoTech. Bonn, Germany) were installed at a vertical depth of 75 cm with a vertical angle of 60° to minimize preferential flow. To gather free drainage water a vacuum of 0.4 bars was applied to the suction cups. Soil water samples were taken from November to March at weekly intervals. In each plot, water subsamples from four cups were pooled to one sample. Leachate samples were stored at −20 °C until analysis. Concentrations of total N, NO3-N, and NH4-N were determined photometrically using a dual channel continuous flow analyzer (SKALAR Analytical Instrument, Breda, the Netherlands). As NO3-N was by far the dominating fraction, only these data were used for calculating N leaching. The amount of percolating water was calculated by a climatic water balance model, using weather and soil data gathered from the experimental site, actual evapotranspiration [34], and specific crop coefficients [35,36] to correct for evaporation.

2.6. APSIM Model Description

APSIM is a modular, process-based simulation framework maintained by the APSIM Initiative (www.apsim.info). The key APSIM modules used in this study were the SurfaceOM and SoilN modules which simulate the dynamics of N and C on a daily time-step in the surface and in each soil layer, SoilWat model for simulating water and solute movement, and the crop modules wheat, oat, fieldpea and canola. The canola module with was used for simulating the Brassica catch crops, WM and FR.
For the setup of the various crops in APSIM default parameters were used, with only a few crop parameters changed. These changes were based on various APSIM calibrations that have been done for Europe, including the study by Knörzer et al. [29] for fieldpea and wheat, and the study by Hoffmann et al. [37] for canola. For the APSIM wheat model the Cultivar Batten was used, the thermal time from the start to the end of grain filling (Stage Code 7 to 8) was set to 790 °C d (within the recommended range of 500 to 800 °C d); and the critical and maximum grain N concentrations were reduced from 3% to 2% and 2.5 %. For WM and TR the optimum temperature was decreased to range from 10 and 22 °C instead of from 15 to 25 °C, and for WM the radiation use efficiency was increased from to 1.35 to 3.4 g MJ−1 [38].

2.7. APSIM Model Setup

Simulations were carried out for the following two-year crop rotation: summer wheat (Cultivar “Batten”)–catch crop (WM; Cultivar Mustard_39)–field pea (Cultivar “Parvie”)–catch crop–oats (Cultivar “Echidna”). A series of manager scripts [39] was used to describe the rotation management, including tillage operations, sowing times, residue defoliations and residue returns.
To capture the two year ryegrass/red clover ley prior to the crop rotation the SurfaceOM was initialised with an initial surface residue amount of 6 t ha−1 and a C:N of 20 [40]. Input variables such as tillage operations, sowing date, sowing density, were set according to the experimental management described above. To capture the effect of cold temperatures on the frost-killed WM, the WM was defoliated and killed in mid-December, and mineralisation of the crop residue was initiated after this. In 2016, based on observations, a third of the biomass was already removed following frost in November. As the biomass of the TR also decreased over winter, part of the TR biomass was likewise removed, and then added as a CC residue. At the end of March when the soil was tilled, the remaining TR was defoliated and killed, and the mineralisation of the crop residue again initiated after this. For the WM catch crop, another simulation was set up to account for the high proportion of volunteers. In this simulation, a third of the biomass was defoliated in winter, and the remaining crop was left until tillage to mimic the growth of the volunteer. As earlier modelling has shown that APSIM under-predicts the mineralisation of CC, a previous developed approach, in which the mineralisation is based on the C:N of the CC residue [41], was used. The aboveground biomass residue was added to the upper soil layer (0–200 mm), and based on observations 50% of the root biomass was added to the upper 300 mm, and the remaining to 300 to 800 mm. Finally, a simulation was set up to investigate the mineralisation rate of the frost-killed WM, assuming a “worst case scenario” regarding N leaching. In this simulation, all the N taken up by the WM until late autumn was added to the soil after the first few days of frost as mineral N (NH4-N), assuming that frost increases the water soluble compounds in the plant [42], 2000) and the leakage of ions and amino acids into the soil [43].

2.8. Calculation of N Leaching Loads

Nitrate leaching loads for the two pre-crops crops and the various CC across the two-year study were first related to the Nmin (0–90 cm) measured at the end of the vegetation period in August minus the maximum N uptake (Nuptakemax) of the CC:
NO3-N leaching = a + b Nmin(0–90) − c Nuptakemax
with a, b, and c being regression parameters.
As a next step, the mineralisation of N over the autumn (Nminer_autumn) period was included, as this is another source of N leaching [11]. The Nminer_autumn was calculated from the difference in Nmin (0–90 cm) measured in August and in November in the BF. As the rate is dependent on plant residues composition and environmental conditions, a relationship between the N leaching load and pre-crops, as well as different years can be established:
NO3-N leaching = a + b Nmin(0–90) + Nminer_autumn − c Nuptakemax

2.9. Statistical Analysis

The data were analysed using the statistical software R (Version 3.5.1. 2020) with the packages ‘nlme’ and ‘multcomp’. After a graphical residual analysis the data were assumed to be normally distributed and homoscedastic. The variables of the study were evaluated using an analysis of variances (ANOVA) based on a linear mixed model with the fixed factors year (Y), pre-crop (PC), catch crop (CC), and their interactions while block was assumed random. The results of the ANOVA are provided in the Appendix A (Table A2). After that, multiple contrast tests were conducted in order to compare the different levels of the fixed factors. Statistical significance was evaluated at p ≤ 0.05. Linear regression analysis was done to determine the parameter values for a, b, and c in Equations (1) and (2).

3. Results

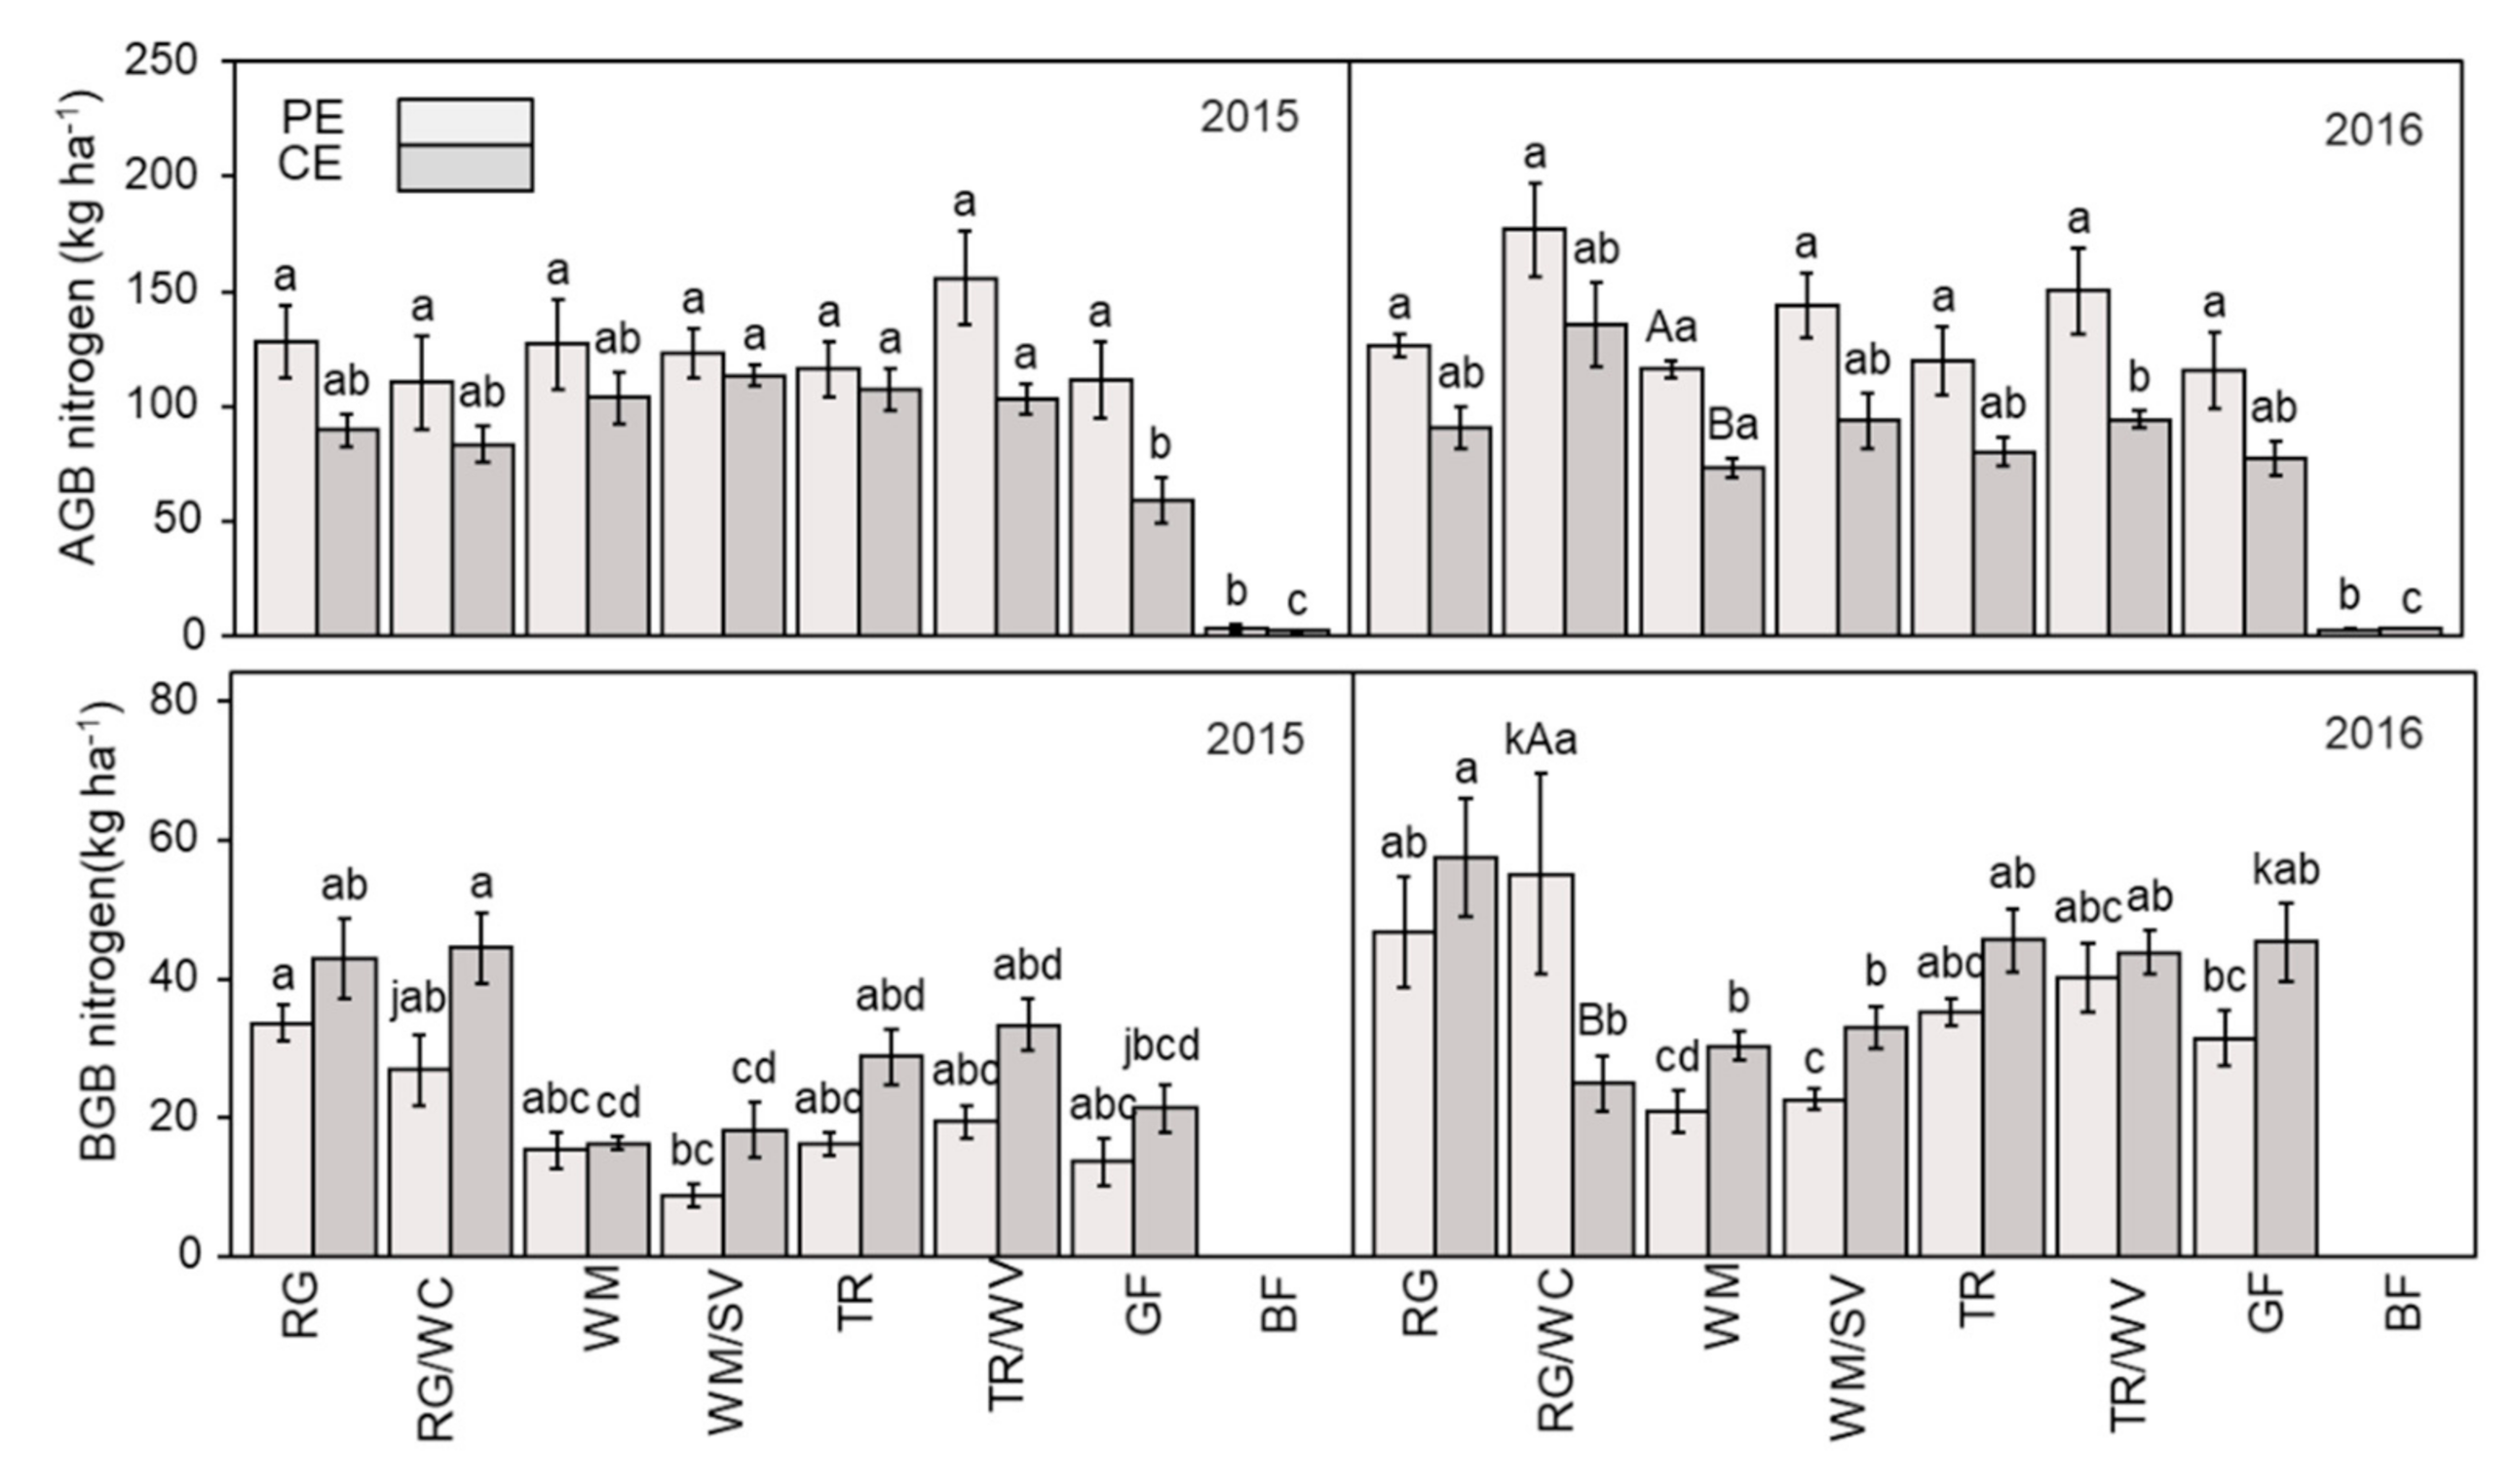
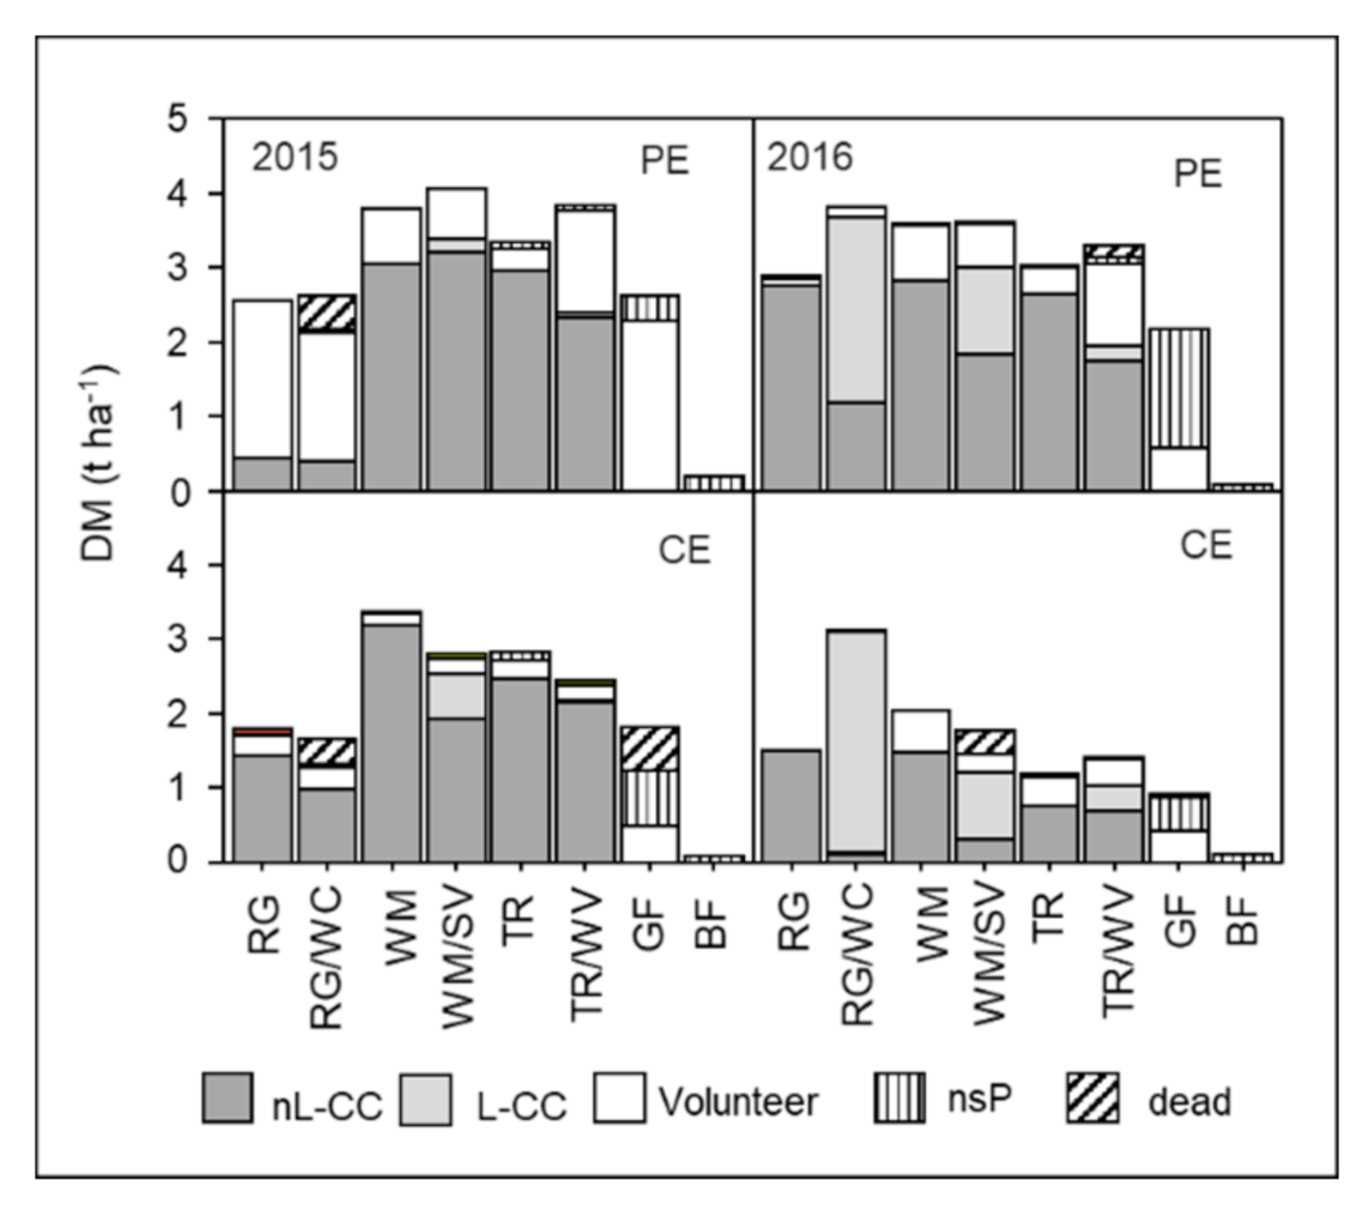
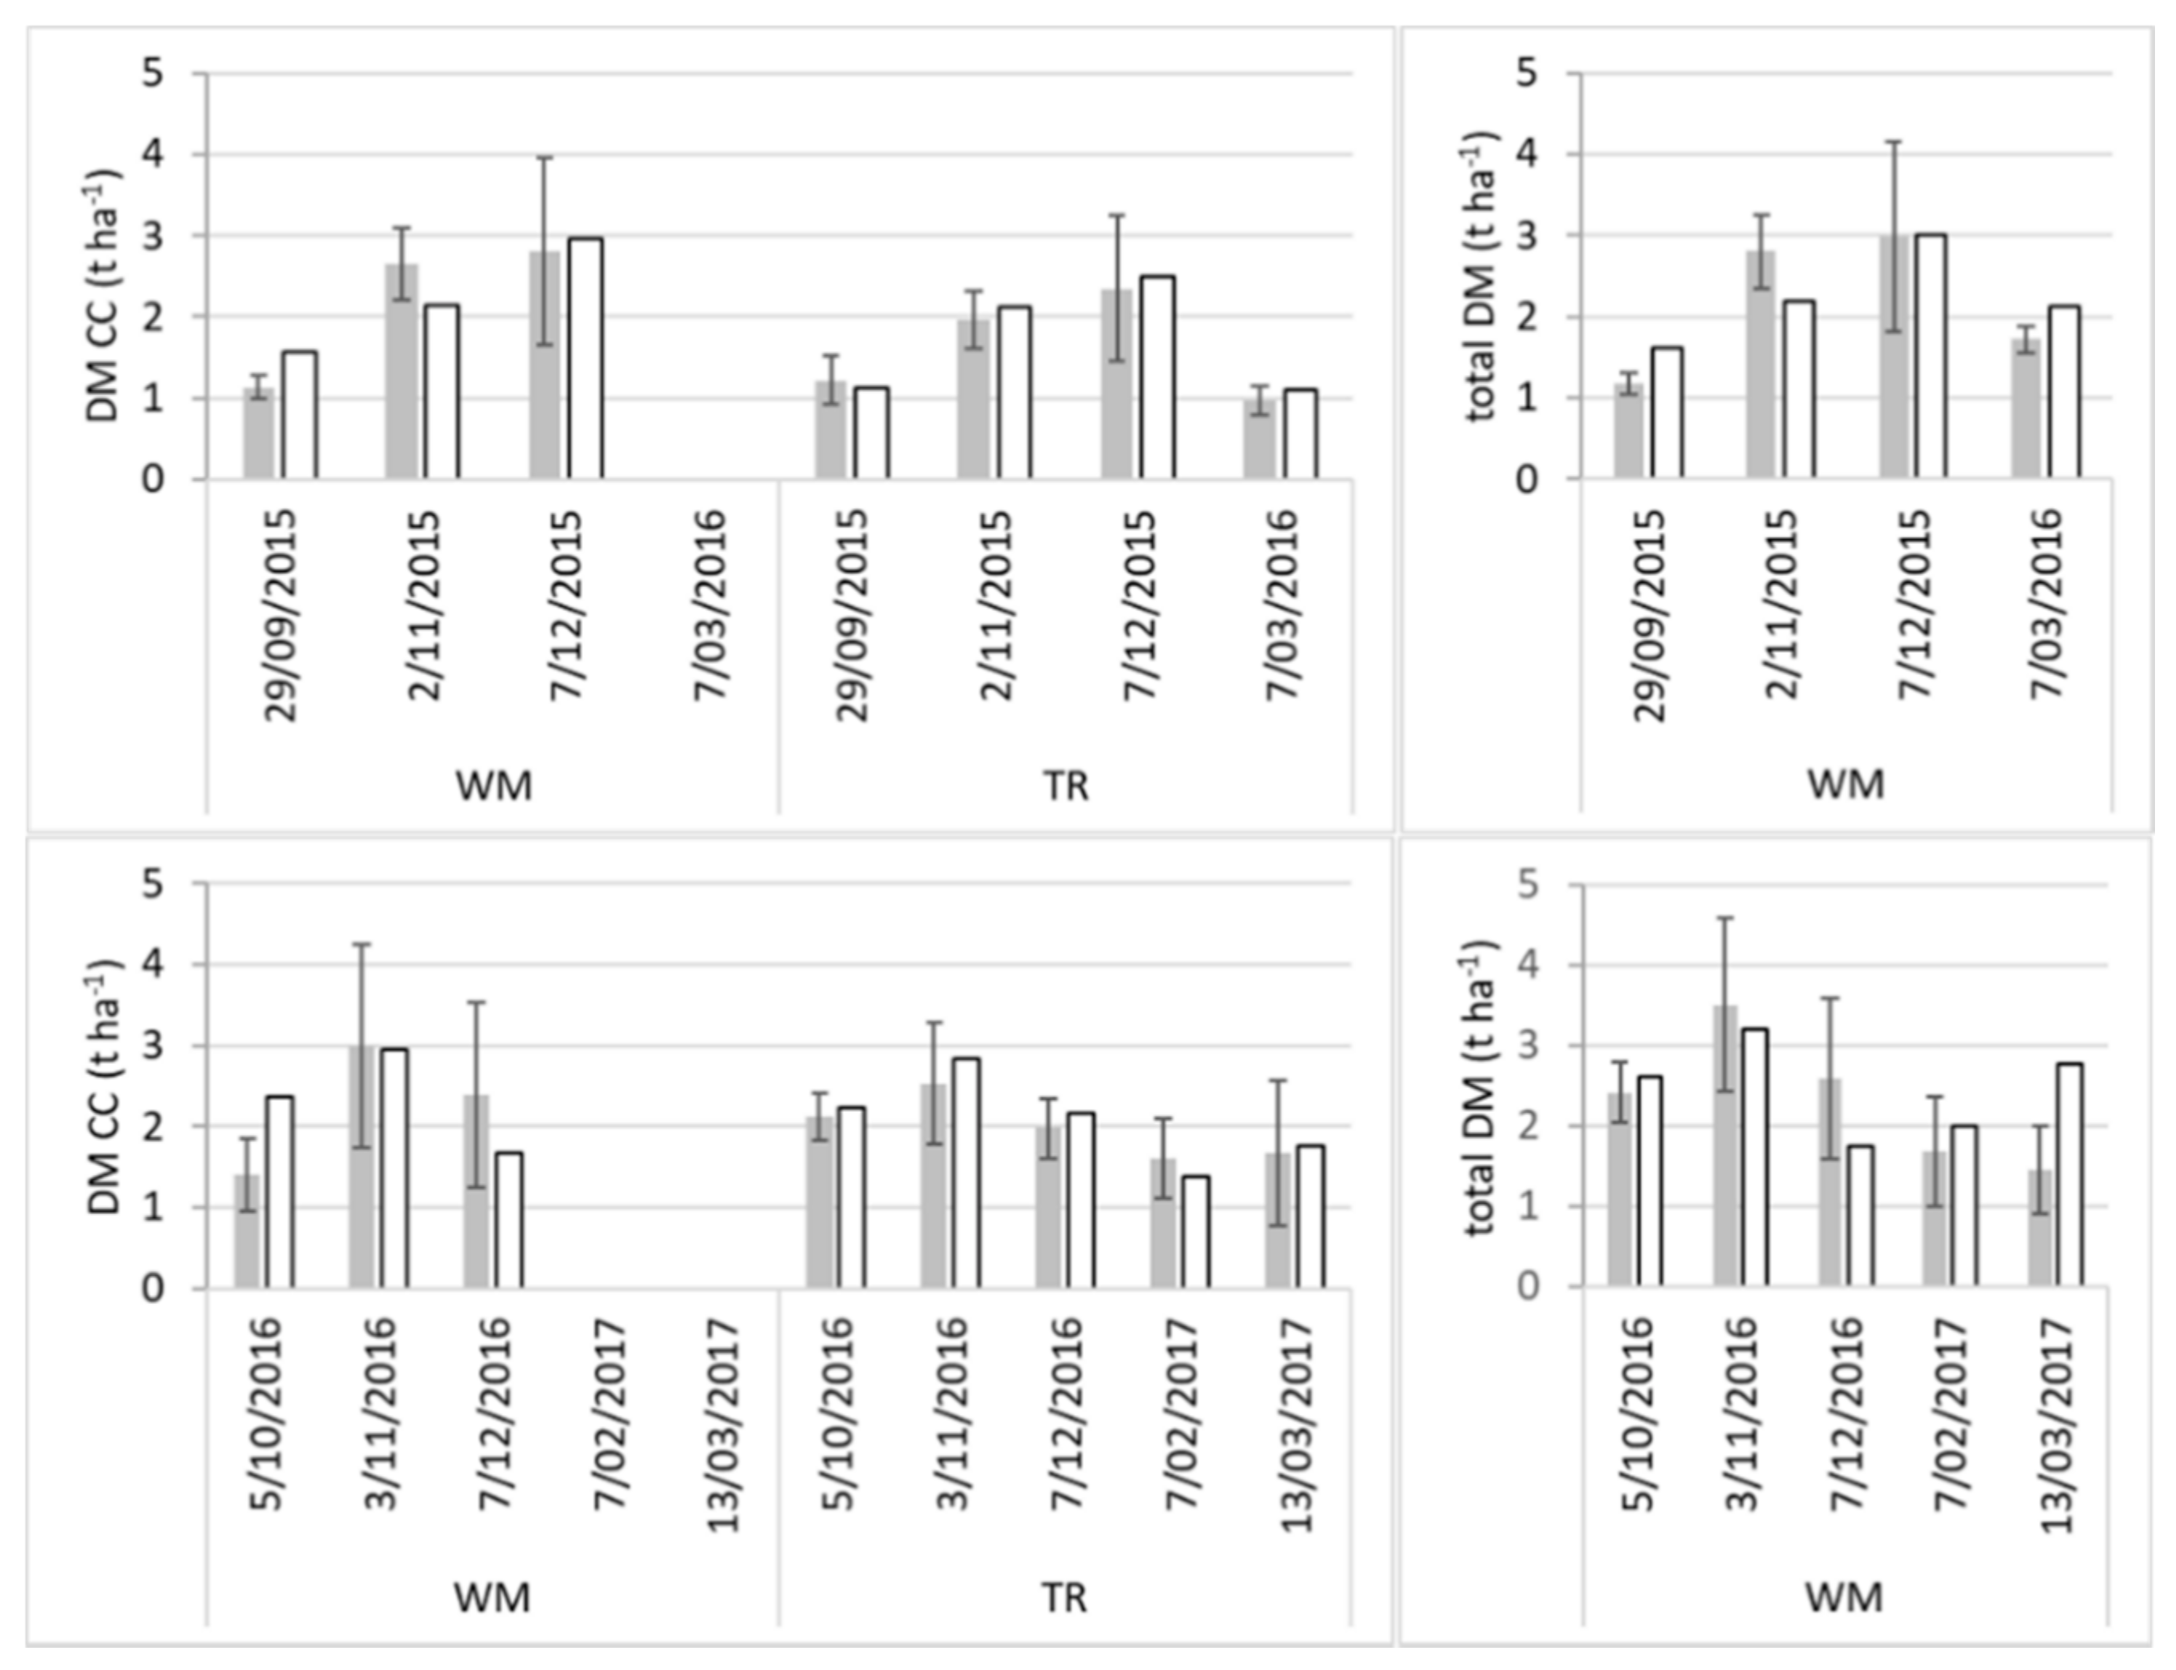
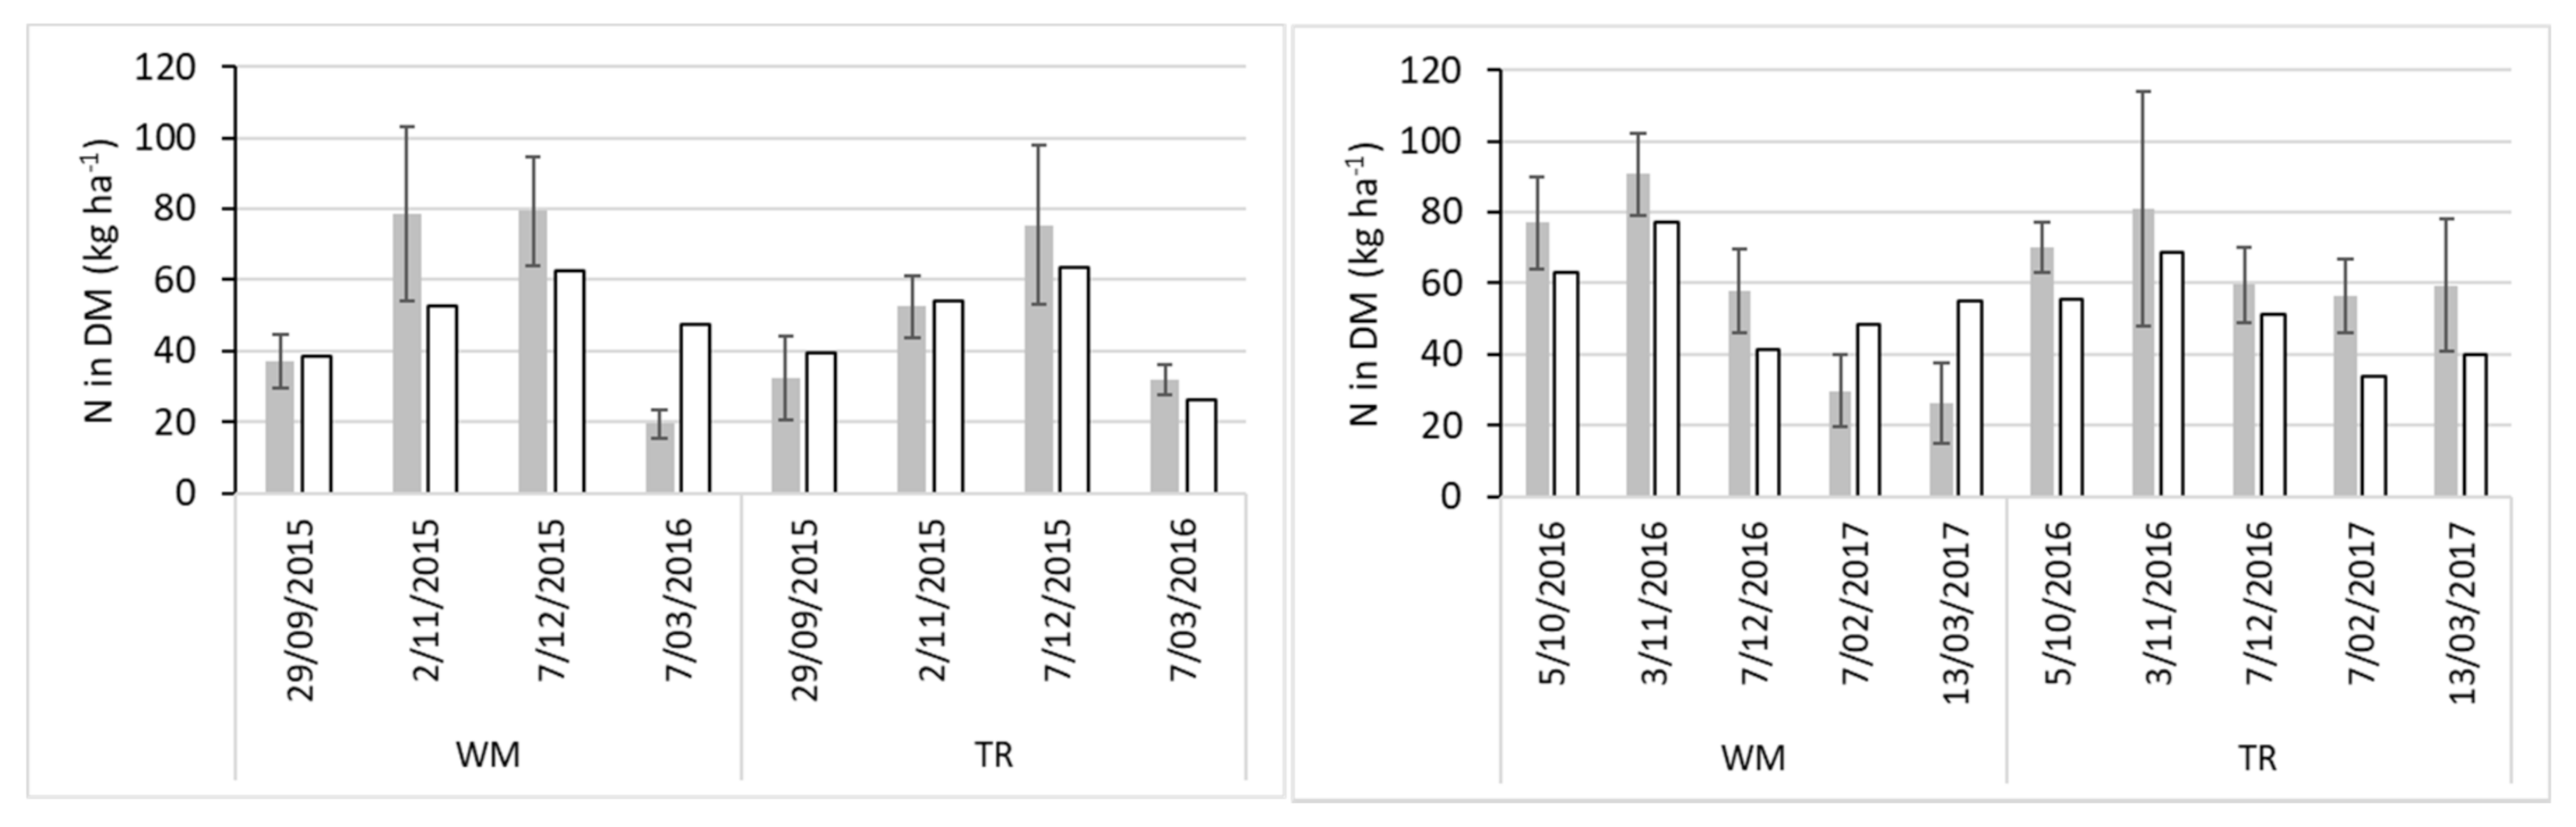
3.1. Catch Crop Biomass, N Uptake, and Carbon
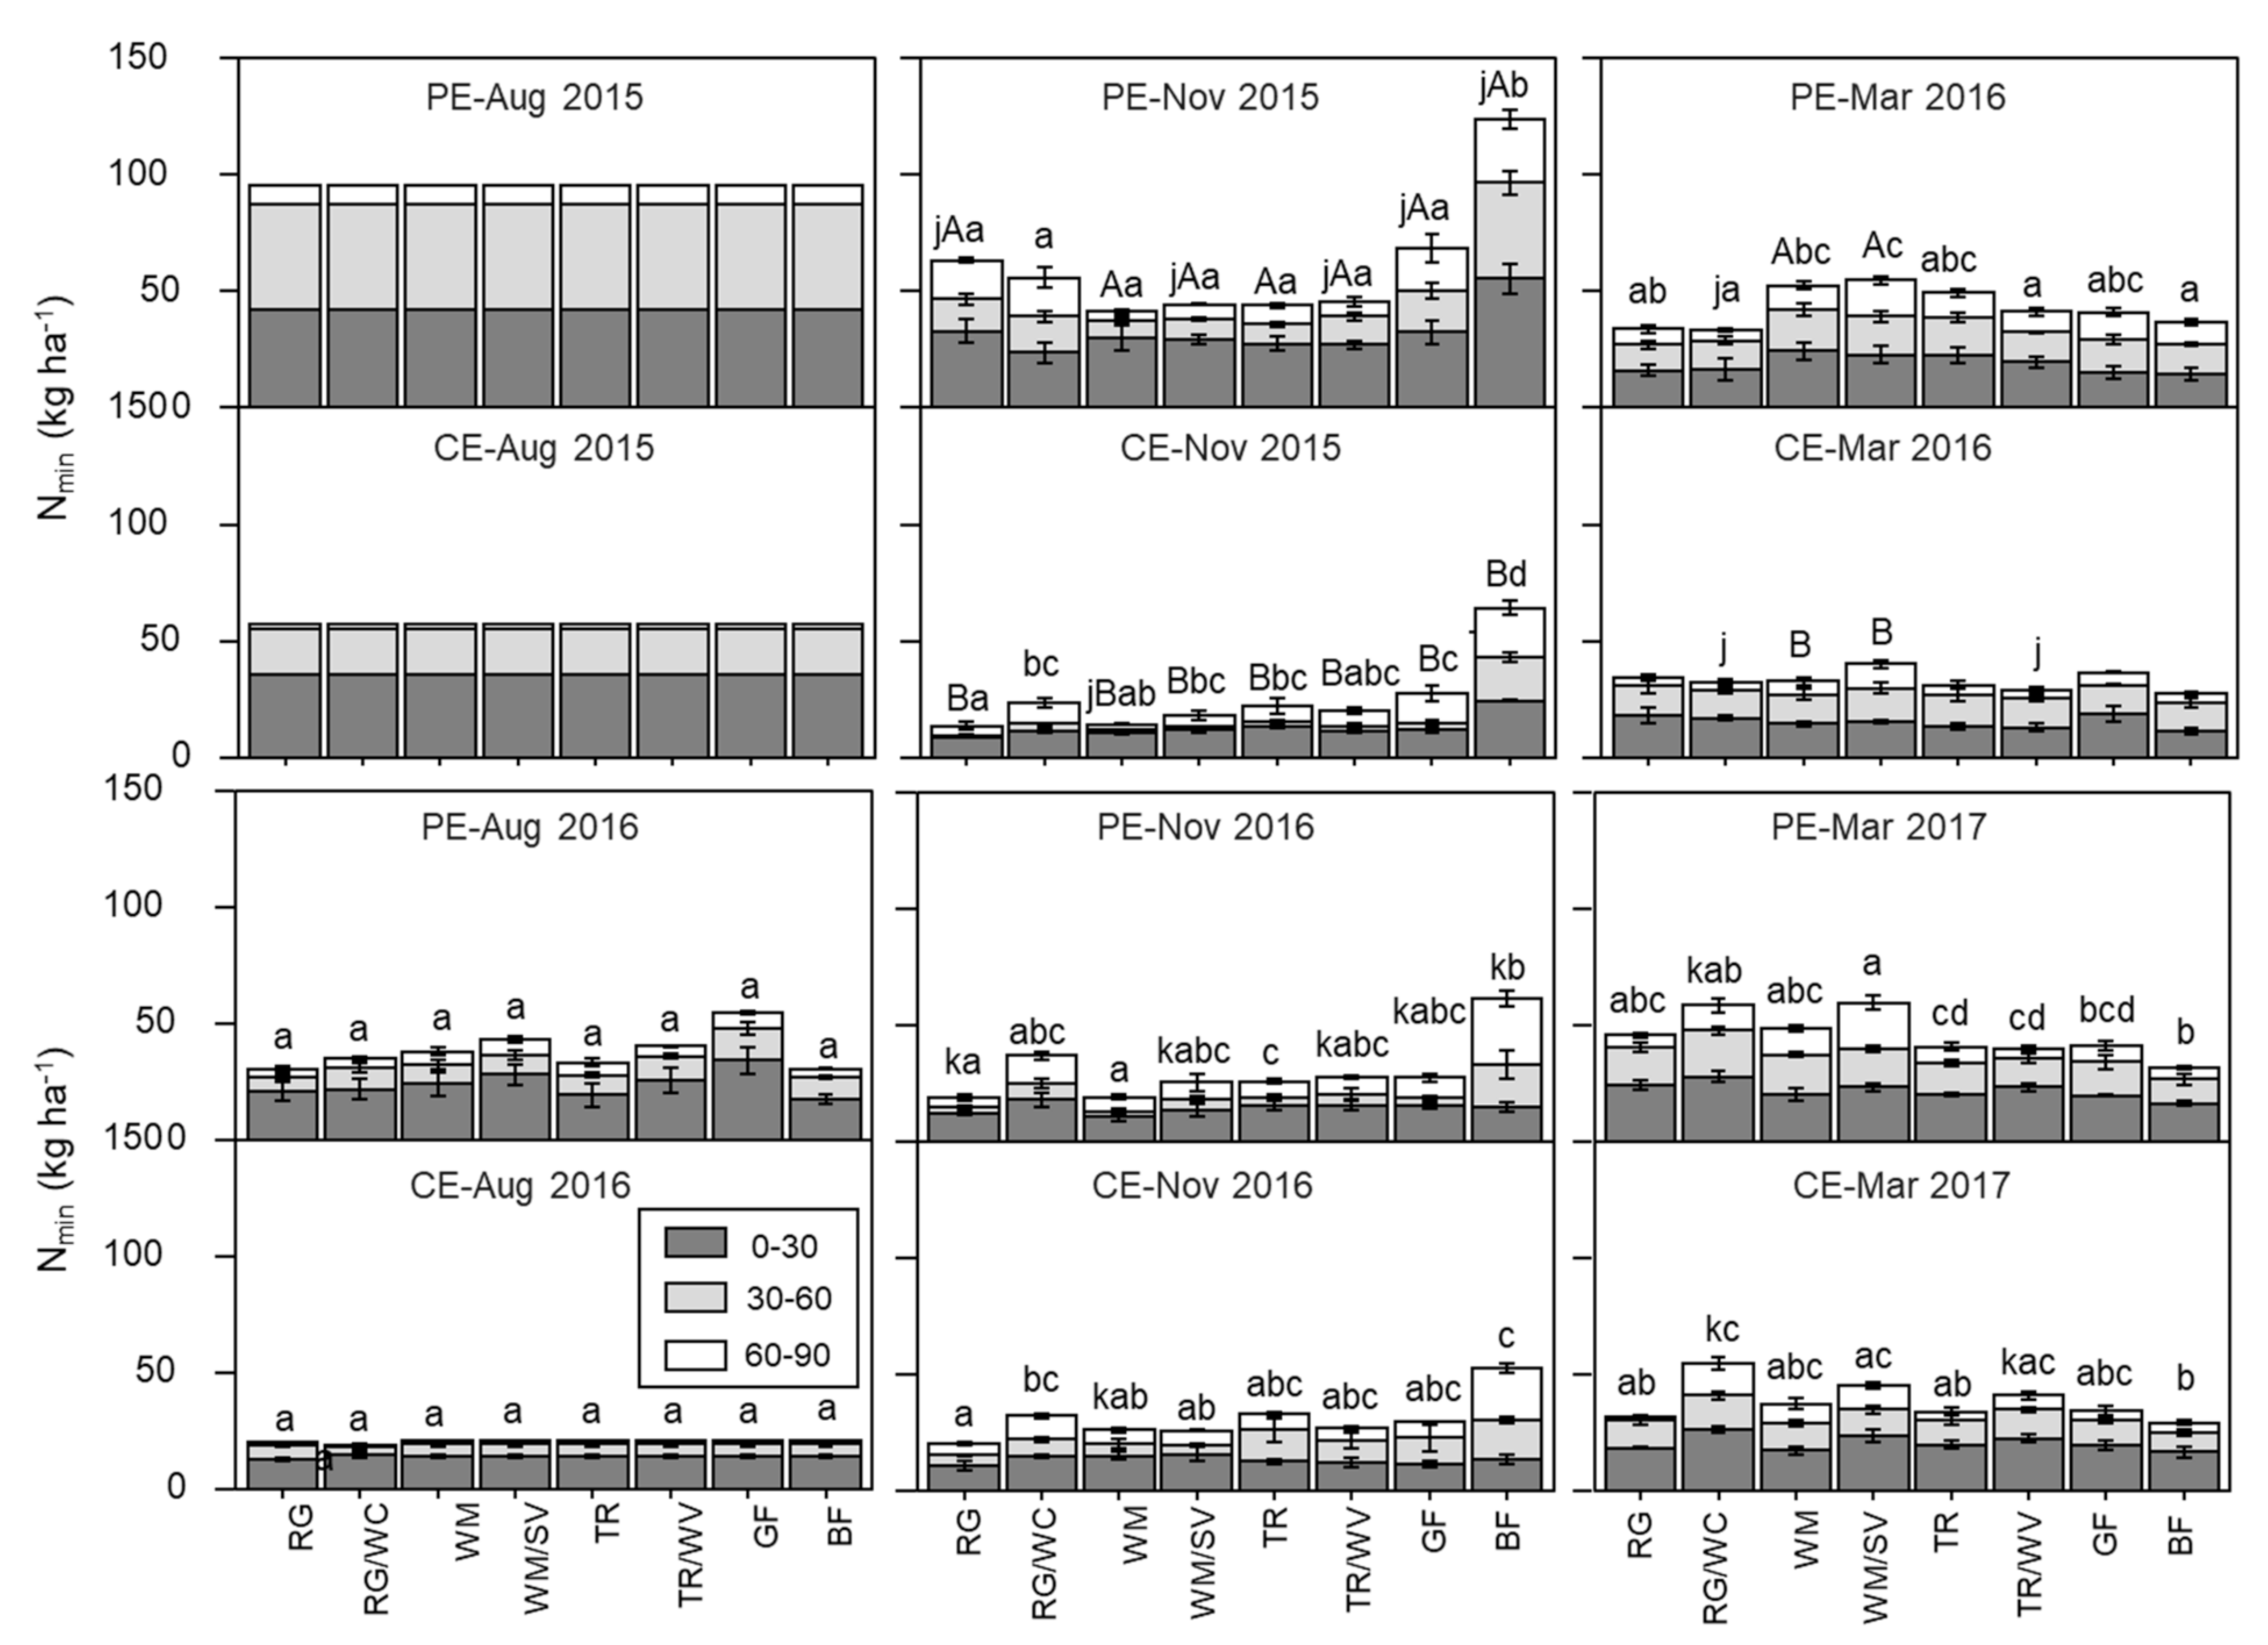
The maximum AGB of the CC in autumn was quite high in both years, with averages ranging from 1.1 to 3.9 t ha−1 (Table 1). While in 2016 the dry matter (DM) was higher with PE as a pre-crop compared to CE, the difference was only significant with RG, TR and TR/WV. Due to a poor establishment of the undersown RG/WC mixture in 2015, the biomass of this undersown CC was significantly lower compared to the other CC treatments. The carbon content was on average 42% of the DM, and ranged from 37% to 42% (data not shown). In 2016, the legume inclusion reduced the C:N, although not always significantly. A pre-crop effect on C:N was only significant in RG, where the ratio was higher following CE compared with PE.
The belowground biomass was in 2015 significantly higher under the RG and RG/WC, and also significantly higher under these CC when following CE compared with PE (Table 1). The latter is confounding by the high amount of PE volunteers under both RG and RG/WC (Figure 4). In 2016, only the RG showed a higher belowground DM compared with the other CCs, although this was not always significant. Most CCs showed a significantly higher belowground DM in 2016 compared with 2015. The RG also showed a high amount of N in the below-ground DM, but also a high C:N compared with the other CCs.
The average amount of N in the above ground biomass of the CC ranged from 84 to 136 kg N ha−1 with PE as the pre-crop, and from 33 to 110 kg N ha−1 following CE as the pre-crop (Figure 3). The inclusion of a legume in the CC did not increase the N in the DM significantly, apart from the N in 2016 with RG/WC. The N in the below ground biomass was highest in the RG and RG/WC, and lowest in the WM and WM/SV, although not always significantly. Apart from the RG/WC there were no significant differences between the pre-crop on the N in the below ground biomass.
The mixture composition of the CC shows a low legume content in the CC mixtures in the first year (2015), indicating a long-term N supply from the ryegrass/red clover which was grown for two years prior to the establishment of the study (Figure 4). Only the WM/SV following CE showed a good establishment of the legume, constituting 22% of the CC mixture. The poor establishment of the RG and RG/WC in the first year allowed a high establishment of volunteers. In 2016, the percentage of legumes was, as expected, lower with PE as a pre-crop (65% for RG/WC, 33% for WM/SV, and 6% for TR/WW), compared with CE (90% for RG/WC, 51% for WM/SV, and 23% for TR/WW). All CC treatments showed good weed suppression (non-seeded plants) in autumn, with no clear difference between the various CC (Figure 4).

3.2. Soil Nitrogen

In 2015, soil mineral N amounts (NO3-N and NH4-N) after harvest in August were much higher with PE as the pre-crop compared with CE (Figure 5). In November, soil Nmin was significantly higher under BF, and significantly higher following PE compared with CE. All CCs reduced Nmin significantly by up to 60%, due to their N uptake. Due to the lower initial Nmin in August following CE, Nmin in November was also significantly lower with CE as a pre-crop compared with PE. Following the drainage period, Nmin was lower under BF and the RG and RG/WC following PE. In the other treatments, Nmin either remained similar or even increased, suggesting mineralisation of CC residues over the winter period. This mineralised N is then available for the subsequent main crop. In the second year (2016), Nmin was also lower in August following CE compared with PE, and values were lower compared with 2015. Again, CC reduced Nmin compared with BF in November, and by March Nmin were increased under CC. Inclusion of a legume in the CC only resulted in higher Nmin, and thus a higher risk of N leaching in the RG/WC compared with RG following CE.

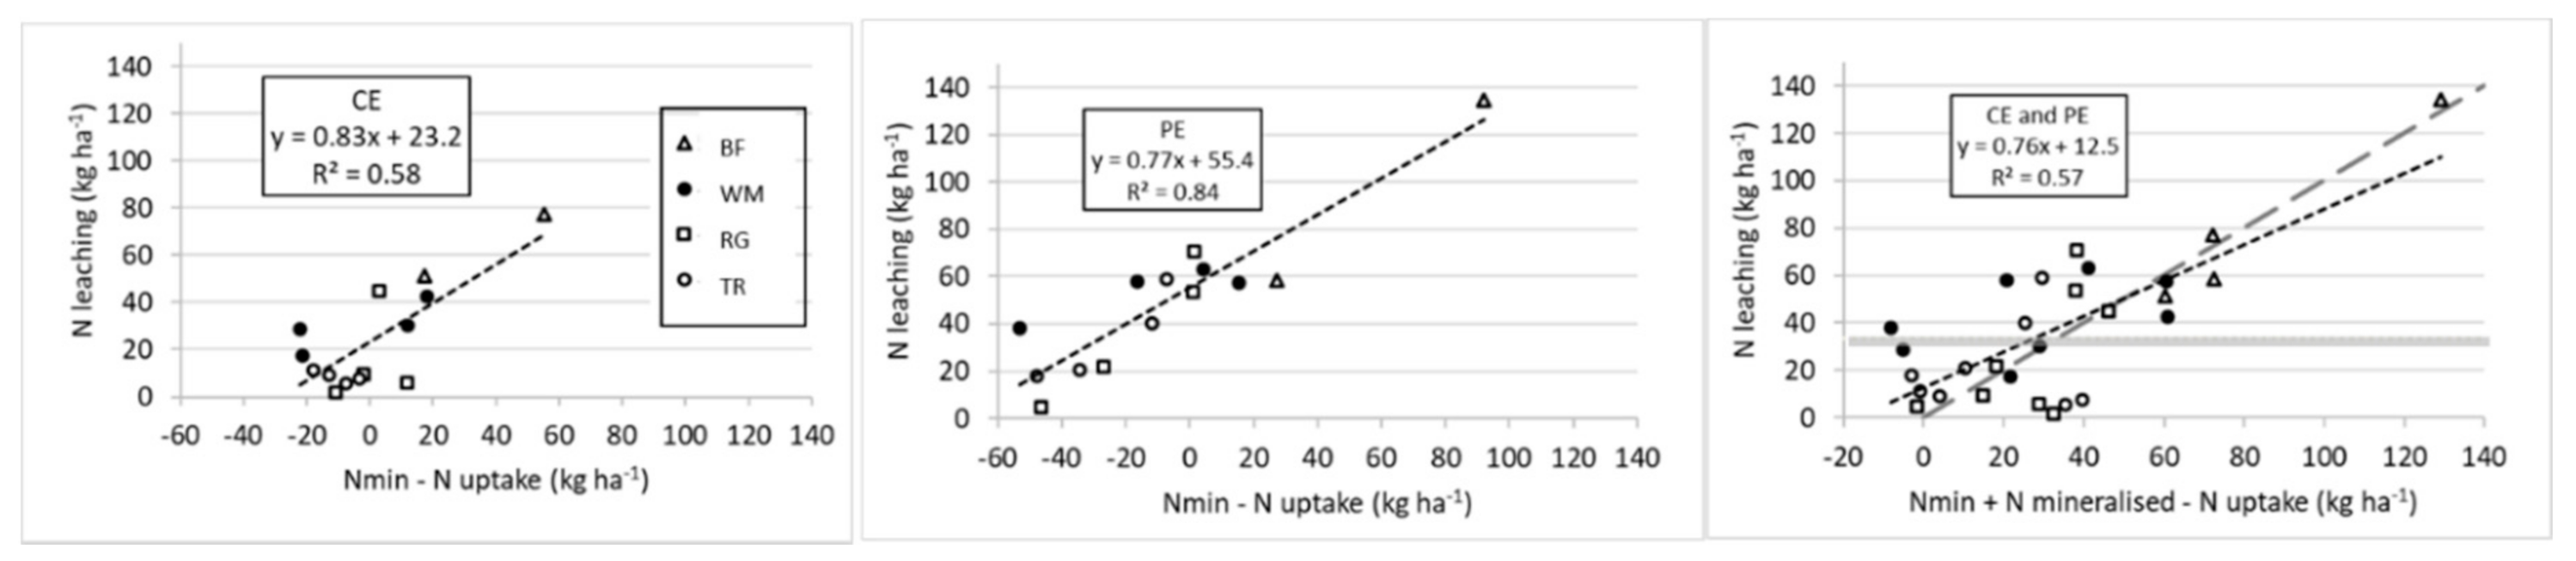
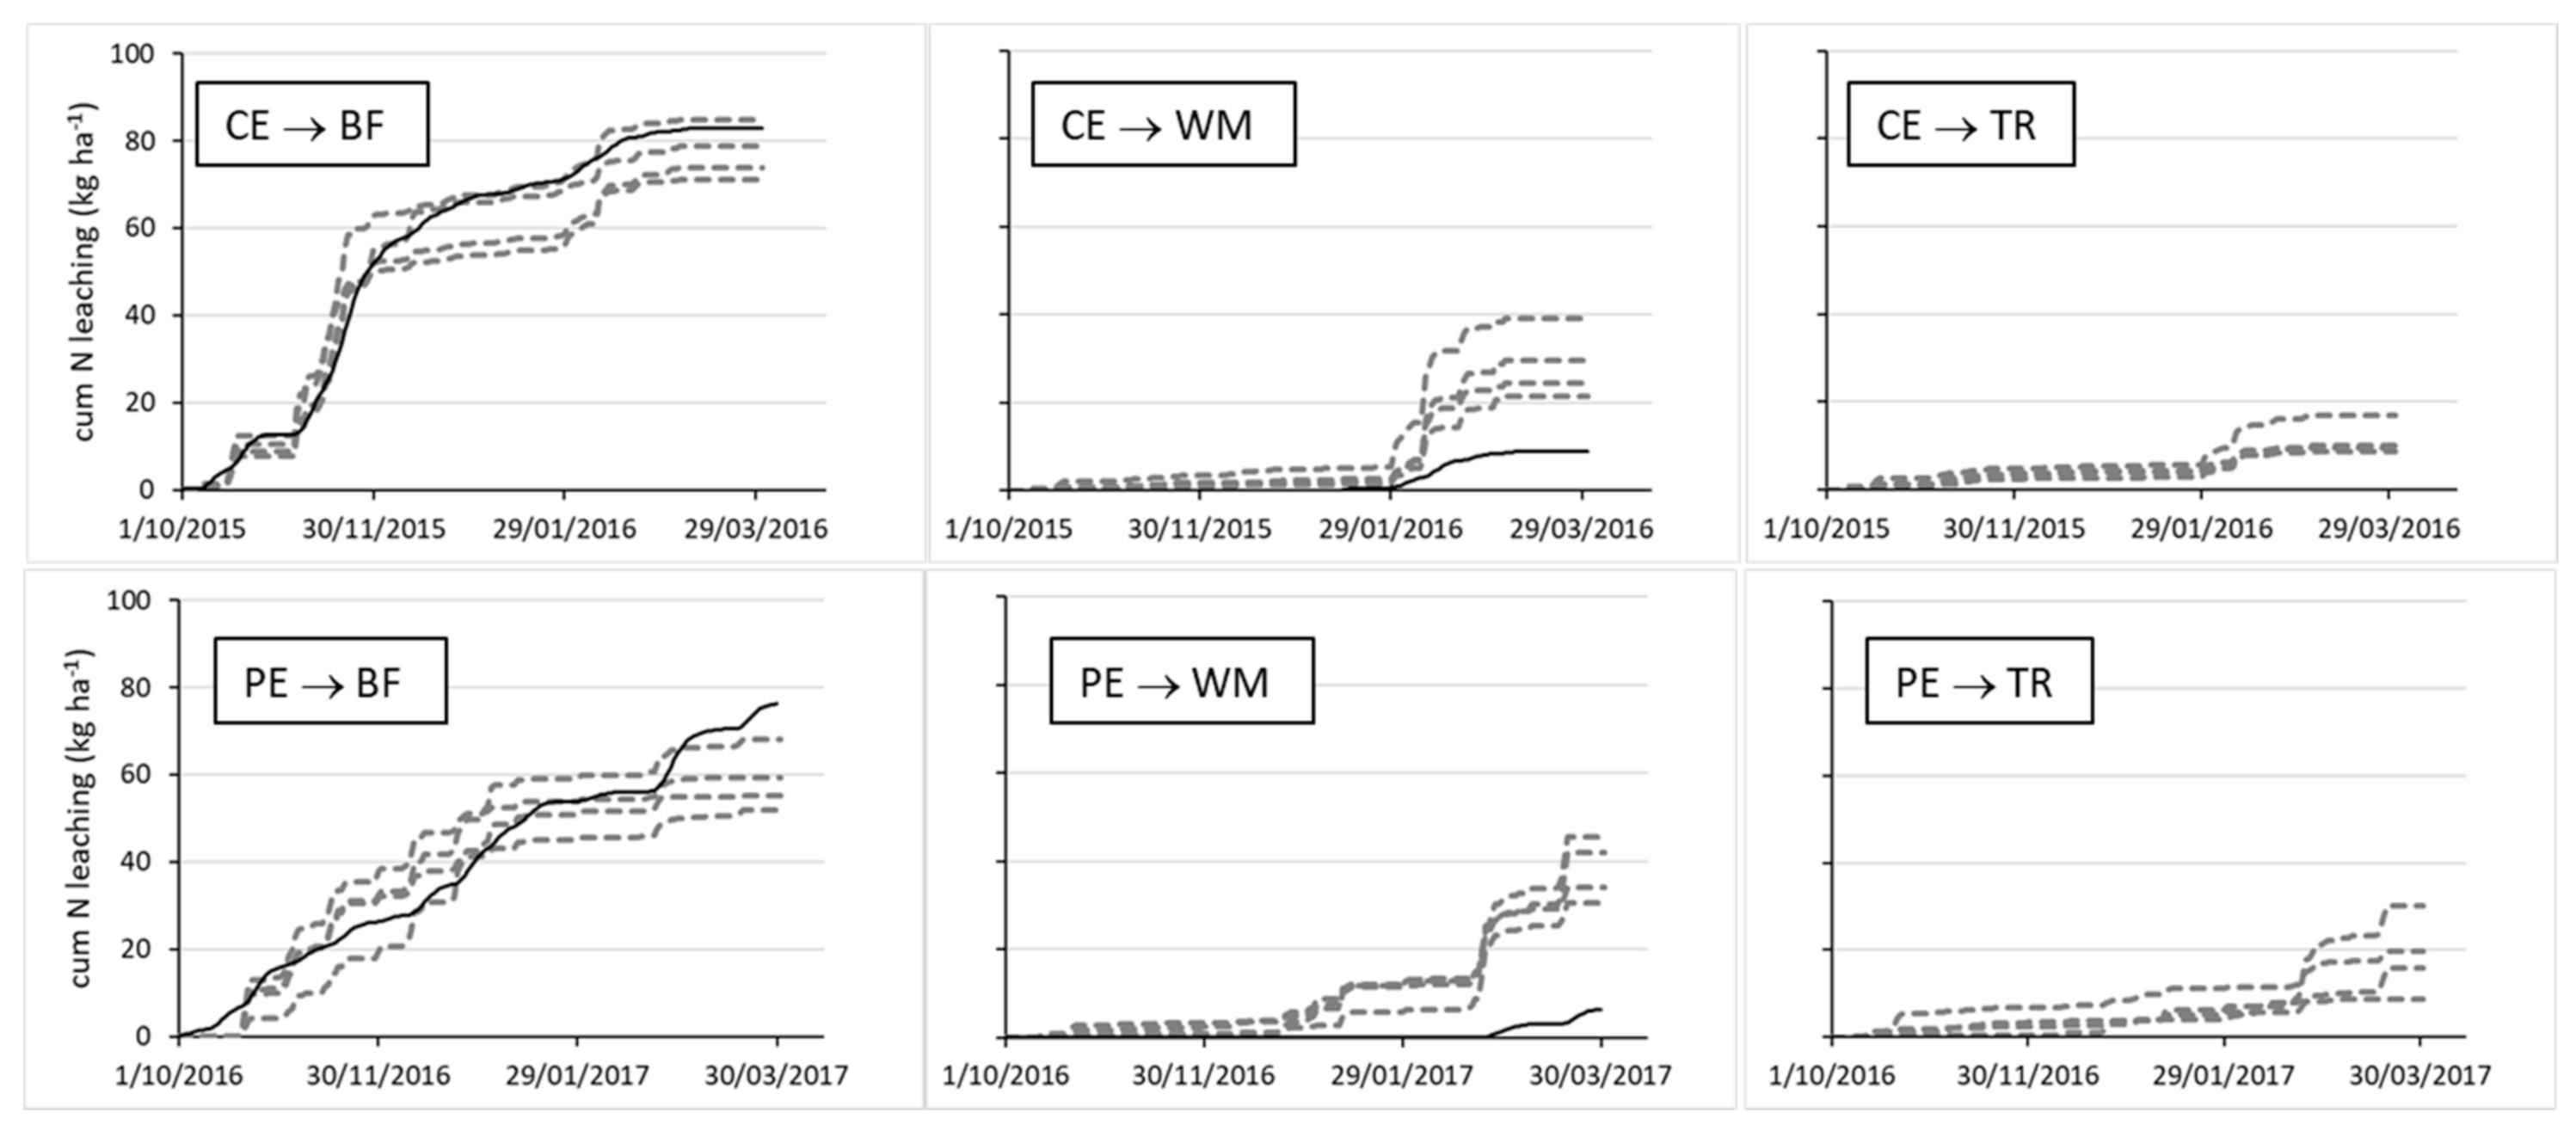
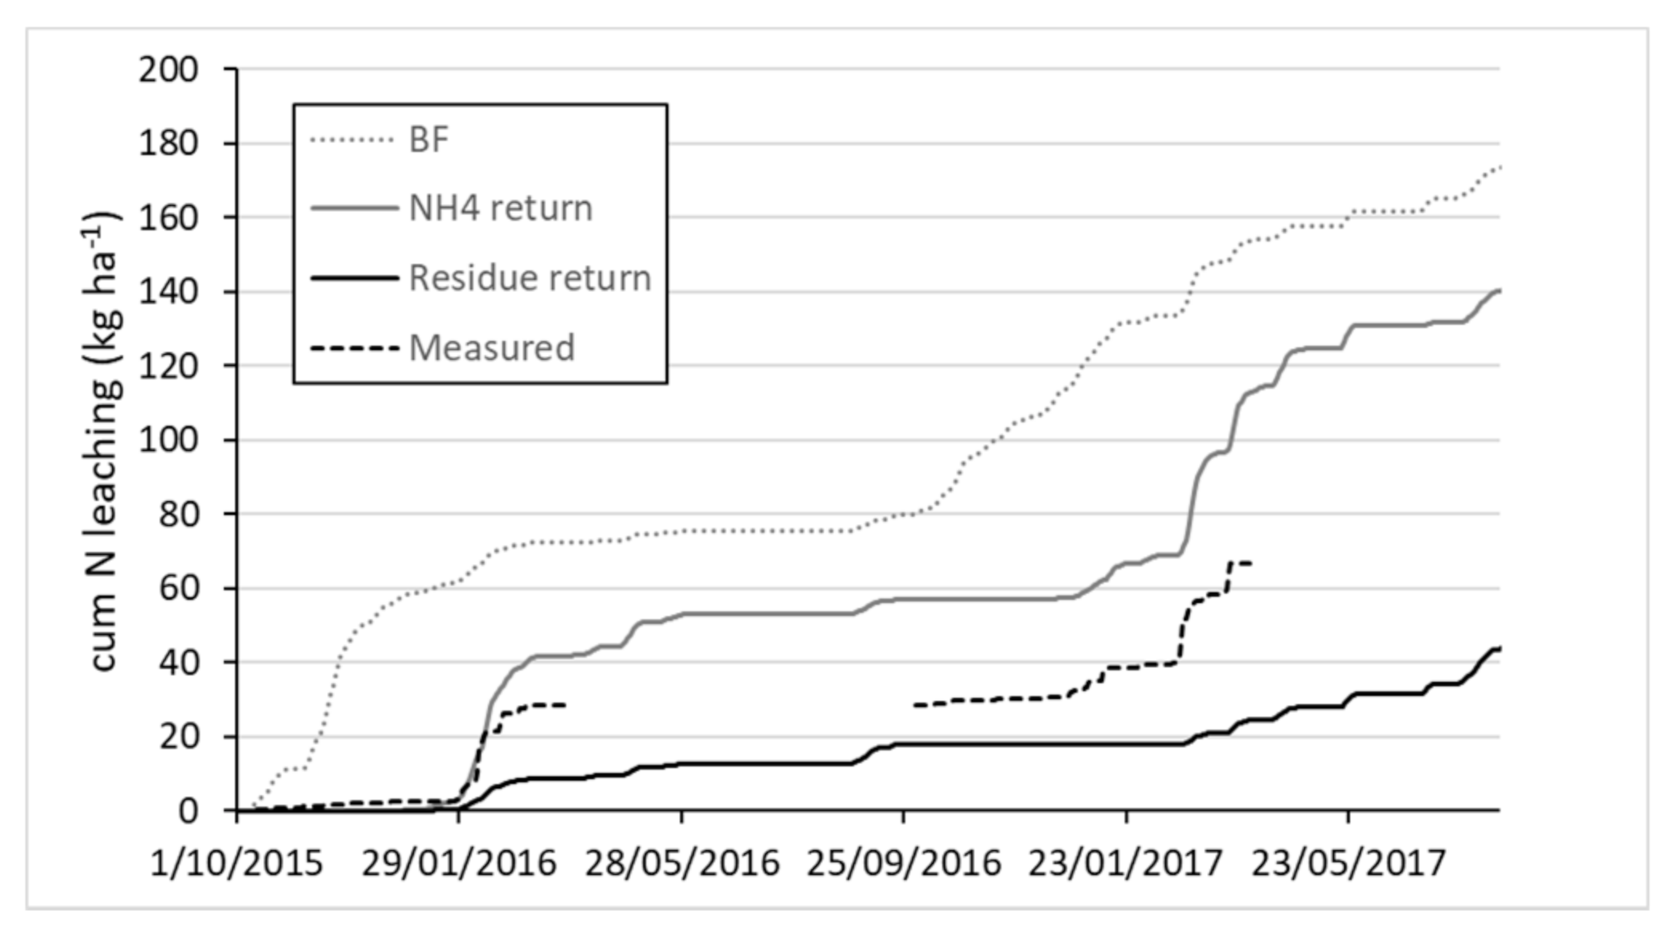
3.3. Nitrate Leaching

In 2015, the use of CC reduced N leaching compared with BF, although this was not significant with PE as the pre-crop (Figure 6). With CE as a pre-crop, lowest leaching was obtained with RG, RG/WC, TR, and TR/WV, while the frost-killed WM and WM/SV were not as effective. In 2016, N leaching was significantly reduced by the CC, apart from the WM/SV following PE and RG/WC following CE. While leaching following PE was higher compared with CE, this was not significant. Generally, the frost-killed WM showed higher leaching compared with the other catch crops, especially when in combination with a legume (SV).
The relatively high N leaching under the RG with PE as a pre-crop in 2015 is due to the poor establishment of the undersown RG in that year. Volunteers generally showed a similar reduction in N leaching as CC. Despite the high N uptake of the CC, N concentrations in the drainage exceeded the quality standard of 11.3 mg NO3-N l−1 with PE as the pre-crop in 2015, apart from TR. With CE as the pre-crop all CC reduced the N concentration to below the critical value. In 2016, both RG and TR reduced the N concentration to below the critical value, regardless if grown in pure stand or with a legume. The frost-killed WM was however not successful in reducing the N concentration to below the critical value.
Regression analysis shows a positive linear relationship between the nitrate leaching loads the difference between Nmin and N uptake Equation (1). The relationship was best described when the two pre-corps were separated (Figure 7), with R2 of 0.58 and 0.84 for CE and PE as pre-crops. According to this relationship, any additional kg of N taken up by the CC results in a decrease of about 0.8 kg N ha−1. Including the mineralisation of N over the autumn period in the regression analysis Equation (2), a positive linear relationship across the two years and including both CE and PE pre-crops was found, with an R2 of 0.56.
Apart from total N leaching losses, the NO3-N concentration in the soil water percolating towards the groundwater or the surface water via drainage systems is an important factor regarding environmental impacts. In accordance with the concentration-threshold of the EU water framework with a critical N-load of 50 mg nitrate l−1 and an average annual drainage rate of 250 to 300 mm in the study site area of Schleswig Holstein [44], the critical N-load is exceeded above an annual leaching load of around 28 to 36 kg N ha−1 (indicated as the shaded area in Figure 7). The results show that none of the CC can reduce leaching in such high N input systems consistently to below the critical N-load, although both RG and TR (either in pure stand or with their legume partners) are generally more efficient in reducing the annual N leaching load compared with the frost-killed WM, despite having similar N uptake.

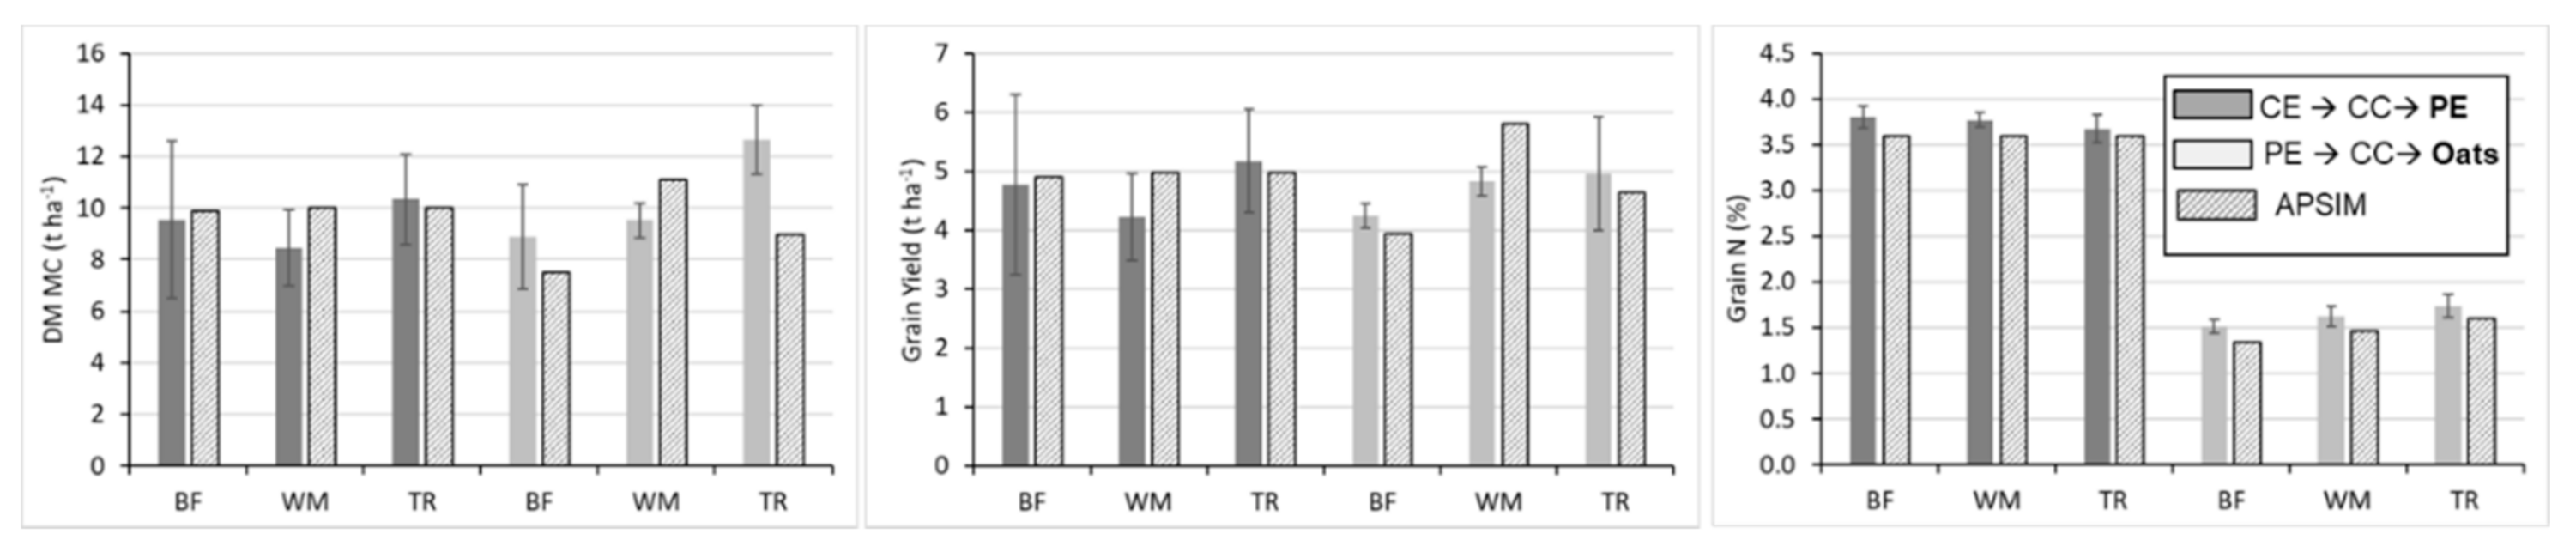
3.4. Effect of Catch Crop on Dry Matter and Yield of Subsequent Crop

Apart from the reduction in N leaching the supply of N to the subsequent main crop is a key factor for the selection of an efficient CC. There was no effect of the CC on the DM of PE, with similar yields of all treatments, including BF (Table 2). There was also no effect of CC on the DM of the subsequent oat in 2016, but in 2017 most CC increased the DM of the oats. This was only significant for RG, RG/WC, WM/SV and TR. The use of CC also did not increase the grain yield, apart from those of the oats with RG/WC as a CC. The amount of nitrogen in the oats and peas were also not significant different in 2016, but in 2017 the use of TR/WV increased the N amount in PE, and apart from WM all other CC increased the amount of N in oats.

3.5. APSIM Modelling of Crop Rotation

The first and important step in this modelling was to verify the model’s accuracy in predicting crop biomass and development, including both the CC and the main crop. This provides confidence in the prediction of water and N removed from the system via plant uptake, and thus in the simulated N leaching losses. Results showed that simulated CC yields agreed well with the measured data (Figure 8), with an R2 of 0.86 between measured and predicted data, and a slope of 1.02 of the regression line (forced through the origin). When accounting for the volunteers, which came through in the CC, APSIM simulations of the total DM also agreed well with the measurements (R2 of 0.43 and a slope of 0.99).
The simulated temporal N uptake of the CC is also within the measured range (Figure 9) with an R2 of 0.73 and a slope of 0.81). Only the volunteers in the WM simulations show a slightly too high N uptake in springtime.
The APSIM also predicts the DM, the grain yield and the grain N concentration of the MC following the CC well (Figure 10). Only for the oats following WM, the DM and grain yields are slightly over-predicted; and the DM of oats following TR is under-predicted.
The cumulative N leaching is well predicted for the BF in both years (Figure 11). The model also predicts the delayed start of the leaching (compared to the bare fallow) under the WM well, but the predicted N leaching is much lower compared to the measured values. Furthermore, in the simulations where volunteers were included no N leaching was predicted (simulations not shown in Figure 11). Similarly, for TR, no N leaching is predicted by APSIM. According to the measurements, about 30% of the N taken up by the WM is leached over the winter period, whereas for the TR only about 15% of the N taken up is leached.

4. Discussion

4.1. Above and Belowground Productivity of Catch Crops

The above ground biomass of the CC in autumn was quite high in both years, ranging from 1.2 to 4.1 t DM ha−1. In one of the years, the field pea as a pre-crop increased the DM of the CC, due to increased soil Nmin after harvest. In both years, CC took up substantial amounts of residual N, with an average ranging from 84 to 136 kg N ha−1 with PE as the pre-crop, and from 33 to 110 kg N ha−1 following WT as the pre-crop. These amounts are within reported values [12,13], although the potential uptake by CC depends on the soil mineral N contents in autumn and the temperature sum from seeding of CC to the following spring [13]. In the first year, the legume proportion of the CC mixtures biomass was very low, apart from SV following CE. This is consistent with the relatively high Nmin (>50 kg N ha−1) in August. In the second year, legume proportions were much larger, and in the RG/WC the WC out-performed the RG, constituting 65 and 90% of the CC mixture. Such an un-balanced non-legume to legume mixture, especially following WT has been shown to reduce the effectiveness of CC regarding N leaching [18]. Based on an experiment in Switzerland and a linear model, which estimates the contributions of species identities and interactions on biomass, Wendling et al. [45] found that a combination of 24% of a legume and 76% of a non-legume cover crop produced the highest biomass. The inclusion of a legume reduced the C:N of the CC mixture, although not always significantly. Among other constituents of plant residues, the C:N ratio has been related to the decomposition rate [41,46]. The lower C:N of the CC mixtures with legumes can thus potentially increase the risk of N leaching.
The below ground biomass was generally higher under the RG and RG/WC, and also higher when these CC followed WT compared with PE. The RG also showed a high amount of N in the belowground DM, but also a high C:N compared with the other CCs. This is in line with the higher observed allocation of C and N to the root system of grasses compared with non-grass species [47,48], which increases the potential for root-derived C stabilization in soil [49,50]. The lower shoot to root ratio following CE compared to PE is likely due to the lower N supply by the soil [51].

4.2. Leaching

The high N leaching and NO3-N concentrations above the critical N concentration in 2015, following PE indicate that under the climatic conditions in northwest Europe cropping of grain legumes can be problematic regarding N leaching. This is in line with previous results, which showed high N leaching loads following legume grains [2,52]. However, more critical regarding N leaching are grass clover leys, when ploughed in autumn [53,54]. In high N-input systems, high residual Nmin in the soil after harvest plus mineralisation over the autumn period can be above the N uptake potential of the CC, resulting in annual N-loads above the critical loads of nitrate of 50 mg nitrate l−1. When frost-killed CC are used potential mineralisation of the CC residue following frost can further increase the annual N load.
This highlights that an efficient management of N-fertilization is crucial and to mitigate N leaching losses, high Nmin values at the end of the vegetation period should be avoided, and N uptake in autumn should be enhanced. Apart from the use of CC, early sowing of winter cereals and late season tillage have been suggested as options for decreasing N leaching loads [55,56].
The high residual Nmin measured after PE confirms a high surplus of N and indicates a high mineralisation rate after the harvest, with a much higher risk of N leaching in the following drainage period following PE compared with CE. The use of CC reduced N min in autumn and the risk of N leaching after both, PE and CE. The high residual Nmin likely also resulted in the poor establishment of legumes within the CC mixtures, as they have a low ability to compete with non-legumes on soils with a high DM N content [57]. In the second year, CC were much more effective in reducing N leaching compared with the BF, likely due to better growing conditions for the CC with a higher DM [14]. Only the frost-killed WM and WM/SV following PE and RG/WC following CE showed N concentrations in the drainage water above the quality standard of 11.3 mg NO3-N l−1. The latter might be due to the mixture being dominated by WC, which comprised about 90% of the CC mixture. Several studies have shown a decrease in the efficiency of CC mixtures in reducing N leaching, with an increasing proportion of legumes in the mixture [18,58,59]. In the case of the frost-killed CC the higher leaching could also be attributed to N mineralized from the CC residues. As these leaves killed by frost have higher N contents compared with senescent leaves [42], the amount of N lost through frozen leaves can be substantial, not only via leaching but also through gaseous emissions as shown by Dejoux et al. [42]. In general, however, the results support findings that balanced CC mixtures of legumes and non-legumes can be as effective in reducing nitrate leaching as pure non-legume CC stands. While in this study volunteers and weeds resulted in a similar reduction in N leaching as the use of CC, other studies have found volunteers to be less effective than CC [60,61]. Furthermore, under the GF there was a large proportion of weeds, which can, especially in organic systems, become problematic [61].

4.3. DM and Grain Yields of Main Crops

Despite the reduction in N leaching, none of the CC increased the DM or grain yield of the PE compared with the BF over the autumn/winter period. This non-responsiveness to N supply from the CC might be masked by the N fixation of PE. The DM and the N taken up by subsequent oat was increased in one of the years by the use of CCs, while the grain yield of the oat was not significantly increased in any of the two years, apart from those in the oats with RG/WC as a CC. Results on the effects of CC on subsequent main crop are very different, with both increased and decreased yields being reported [22]. A lack of response to additional N supply from CC residues has been observed in several studies and this has been attributed to an incomplete mineralisation of the CC N during the growth of the subsequent main crop [14]. In temperate climates, like in NW Germany, temperatures in spring are often low, which results in slow decomposition of CC residues, and consequently a low use of the mineralised N by subsequent spring cereals.
The inclusion of a legume within the CC increased the DM of the oats in one of the years compared to the pure RG and WM, but not for the TR. While many other studies have found increased yields with legumes [12,45,62,63], the effectiveness seems to be highly dependent on environmental conditions during the development of the CC and the preceding drainage and leaching period.

4.4. APSIM Modelling

The APSIM predicted the dry matter, yield and N uptake by both the CC and the subsequent main crop well. However so far, the model was only used with pure CC, and further testing is required with CC mixtures and volunteers within the CC. The model also simulated the N leaching under the BF well, and showed the risk of N leaching from frost-killed CC. However, the amount of N leaching from these frost-killed CC was under-predicted in both years, suggesting a higher rate of N mineralisation from frost effected plant residues or roots. The discrepancies between measured and simulated N leaching could be due to the model underestimating N mineralisation from the catch crop residue. While the mineralisation approach used in the APSIM model for the CC residues has been parameterised based on incubation studies with low temperatures, the potential effect of frost on the residues might not be accounted for. The simulation run, where the N taken up by the WM was returned as mineral N (NH4-N) shows the same initial leaching behaviour as measured (Figure 12). This supports the hypothesis that after frost some of the plant N becomes soluble, and the remaining N going into pools with slower mineralisation rates. Another possibility is preferential flow of N due to changes in soil structure by the root system and through decayed root channels [64,65]. Especially the N derived from the (tap) roots of the frost-killed WM could move rapidly through macro-pores created by the roots or biological activity. The model does not account for such preferential flow yet, and to capture such dynamic soil structure effects in models is a challenge [66].
In a comparison of various process models, Yang et al. [67] also found that single models did not simulate N leaching from CC well, but the use of a multi-model ensemble was better at simulating N mineralisation and N leaching. Further studies are required to test such process-based models for simulating crop rotations, and to determine appropriate crop residues proportions and decay rates for the models’ various soil organic matter pools, which is very difficult [22]. Furthermore, the effect of frozen leaves and roots on N losses via leaching and gaseous emissions also needs to be considered before such models can be used to optimise N flows in crop rotations.

5. Conclusions

This study demonstrated the effect of different catch crops and catch crops mixtures including legumes on nitrate leaching in systems with high availability of plant residual N. All CC reduced N leaching compared with the bare soil, but could not always reduce the annual N load to the critical N load with respect to the EU-Nitrate directive threshold. Winter hard catch crops should be preferred, as there is a risk of increased leaching following mineralisation of residues from frost-killed CC. For the two pre-crop CC sequences, the soil mineral N content at the end of the vegetation period, the N mineralisation over the autumn period, and the autumn N uptake were the best predictors for N leaching. While CC with high N uptake in autumn are affective at reducing N leaching, to fulfil the requirements of the given environmental standards for water protection in the EU, high N loads in autumn need to be avoided. Process based models, like APSIM can be used to predict long term effects of CC on the N balance, including positive effects on the N uptake of the subsequent crop, as well as on potential leaching. However, while APSIM predicted crop growth and N uptake well, the model failed to predict N leaching from the frost-killed CC. This could either be due to a higher rate of N mineralisation from frost effected plant residues or preferential flow, which the model does not account for. So far, the model has also only be used for pure CC stands, and not for legume-non legume mixtures. Thus, before the model can be used to guide N-management of farming systems and increase nitrogen use efficiency for complex crop rotations, these issues need to be resolved.

Author Contributions

Conceptualization, R.L. and F.T.; methodology, R.L., M.B. and T.R.; formal analysis, M.B., C.K., I.V. and F.T.; writing—original draft preparation, M.B.; writing—review and editing, I.V., F.T. and T.R.; visualization, C.K.; funding acquisition, F.T. All authors have read and agreed to the published version of the manuscript

Funding

The research activities were funded by the rural development program of the federal state of Schleswig-Holstein (LPLR) as part of the European agricultural fund for rural development (EAFRD) called European innovation partnership for Agricultural productivity and Sustainability (EIP-Agri).

Acknowledgments

As part of the Operational Group (OG) “Nutrient Management and Yield Increase in Ecological Cash Cropping” we thank the Lead Partner of the project “Schleswig-Holstein Chamber of Agriculture” for their collaboration. Moreover, we would like to thank Michael Jürgens, Lars Wollenberg and Anna-Lena Nötzel for passionate assistance during the field measurements. Special thanks goes to Mario Hasler for his statistical advice. We acknowledge financial support by DFG within the funding programme Open Access Publiz-ieren. The data presented in this study are available on request from the corresponding author. Ethical review and approval were not applicable. Informed consent was obtained from all subjects involved in this study.

Conflicts of Interest

The authors declare no conflict of interest. The funders had no role in the design of the study; in the collection, analyses, or interpretation of data; in the writing of the manuscript, or in the decision to publish the results.

Appendix A

Table A1. Soil properties of different soil layers of the experimental site, with dB = soil bulk density.
Depth.Sand.Silt.Clay.pH.dB.Ntot.Corg.C:N.P.K.Mg..
(mm)(%)(%)(%) (Mg m−3)(%)(%) (mg 100 g−1)
0–30079.1665.51.50.141.4107.09.12.9
300–60080.155-.1.60.091.1125.26.63.4
600–90086.95-.1.50.020.3152.24.23.9
Table A2. Levels of significance (p < 0.05 *; p < 0.01 **; p < 0.001 ***) among the tested factors year (Y; 2015/16, 2016/17); pre-crop (PC; field pea, cereal); catch crop (CC; white mustard, white mustard + common vetch, turnip rape, turnip rape + hairy vetch, perennial ryegrass, perennial ryegrass + white clover, green fallow, bare fallow). Maximum above ground dry matter of the various catch crops (CC DM; t ha-1); above ground biomass (AGB DM; t ha−1); belowground biomass (BGB DM; t ha−1); total dry matter (Total DM; t ha−1); nitrogen in the above ground biomass (AGB N; kg ha−1); nitrogen in the below ground biomass (BGB N; kg ha−1); carbon: Nitrogen ratio in the above ground biomass (AGB C:N); dry matter of the subsequent main crop (MC DM t ha−1); nitrogen in the subsequent main crop (MC DM N; kg ha−1); grain yield of the subsequent main crop (MC GY; t ha−1); Mineral soil nitrogen contents after harvest of the previous crop in August (Nmin Aug; kg ha−1), at the beginning (Nmin Nov; kg ha−1) and the end of the drainage period (Nmin Mar; kg ha−1) in the soil depth 0–90 cm; average nitrate-N concentration in drainage water (NO3-N conc; ppm); cumulative amount of nitrate-N leached in the drainage period (NO3-N leaching; kg ha−1).
FactornumDFCC
DM
AGB
DM
BGB
DM
Total
DM
AGB
N
BGB
N
AGB
C:N
MC
DM
MC
DM N
MC
GY
Nmin
Aug
Nmin
Nov
Nmin
Mar
NO3-N
Conc
NO3-N
Leaching
Y1***ns****nsns***nsnsns******ns****
PC1ns****ns*ns***ns****Ns***ns****
CC7*********************nsns***Ns******ns*
Y: PC1**nsnsnsnsnsnsnsns*******ns***
Y: CC7***ns*****ns.***ns*nsNs******nsns
PC: CC7******ns***ns***nsns*Ns***nsnsns
Y: PC : CC7nsns***nsns***nsnsnsnsnnsns*ns

References

  1. Harrison, S.; McAree, C.; Mulville, W.; Sullivan, T. The problem of agricultural ’diffuse’ pollution: Getting to the point. Sci. Total Environ. 2019, 677, 700–717. [Google Scholar] [CrossRef] [PubMed]
  2. Biernat, L.; Taube, F.; Vogeler, I.; Reinsch, T.; Kluß, C.; Loges, R. Is organic agriculture in line with the EU-Nitrate directive? On-farm nitrate leaching from organic and conventional arable crop rotations. Agric. Ecosyst. Environ. 2020, 298, 106964. [Google Scholar] [CrossRef]
  3. Musacchio, A.; Re, V.; Mas-Pla, J.; Sacchi, E. EU Nitrates Directive, from theory to practice: Environmental effectiveness and influence of regional governance on its performance. AMBIO 2020, 49, 504–516. [Google Scholar] [CrossRef] [PubMed] [Green Version]
  4. Schipanski, M.E.; E Barbercheck, M.; Douglas, M.R.; Finney, D.M.; Haider, K.; Kaye, J.P.; Kemanian, A.R.; Mortensen, D.A.; Ryan, M.R.; Tooker, J.F.; et al. A framework for evaluating ecosystem services provided by cover crops in agroecosystems. Agric. Syst. 2014, 125, 12–22. [Google Scholar] [CrossRef]
  5. Salonen, J.; Ketoja, E. Undersown cover crops have limited weed suppression potential when reducing tillage intensity in organically grown cereals. Org. Agric. 2020, 10, 107–121. [Google Scholar] [CrossRef] [Green Version]
  6. Aronsson, H.; Hansen, E.M.; Thomsen, I.K.; Liu, J.; Ogaard, A.F.; Känkänen, H.; Ulén, B. The ability of cover crops to reduce nitrogen and phosphorus losses from arable land in southern Scandinavia and Finland. J. Soil Water Conserv. 2016, 71, 41–55. [Google Scholar] [CrossRef] [Green Version]
  7. Zinngrebe, Y.; Pe’er, G.; Schueler, S.; Schmitt, J.; Schmidt, J.; Lakner, S. The EU’s ecological focus areas—How experts explain farmers’ choices in Germany. Land Use Policy 2017, 65, 93–108. [Google Scholar] [CrossRef]
  8. Statistisches Bundesamt. Land- und Forstwirtschaft, Fischerei Methodische Grundlagen der Agrarstrukturerhebung; Statistisches Bundesamt: Wiesbaden, Germany, 2016.
  9. BMEL. Organic Farming in Germany. Available online: https://www.bmel.de/SharedDocs/Downloads/EN/Agri-culture/OrganicFarming/Organic-Farming-in-Germany.pdf?__blob=publicationFile (accessed on 16 November 2020).
  10. Alonso-Ayuso, M.; Gabriel, J.L.; Pancorbo, J.L.; Quemada, M. Interseeding cover crops into maize: Characterization of species performance under Mediterranean conditions. Field Crops Res. 2020, 249, 107762. [Google Scholar] [CrossRef]
  11. Wachendorf, M.; Büchter, M.; Volkers, K.; Bobe, J.; Rave, G.; Loges, R.; Taube, F. Performance and environmental effects of forage production on sandy soils. V. Impact of grass understorey, slurry application and mineral N fertilizer on nitrate leaching under maize for silage. Grass Forage Sci. 2006, 61, 243–252. [Google Scholar] [CrossRef]
  12. Justes, E. Cover Crops for Sustainable Farming; Springer: New York, NY, USA, 2017; pp. 1–91. [Google Scholar]
  13. Komainda, M.; Taube, F.; Kluß, C.; Herrmann, A. Above- and belowground nitrogen uptake of winter catch crops sown after silage maize as affected by sowing date. Eur. J. Agron. 2016, 79, 31–42. [Google Scholar] [CrossRef]
  14. Möller, K.; Reents, H.-J. Effects of various cover crops after peas on nitrate leaching and nitrogen supply to succeeding winter wheat or potato crops. J. Plant Nutr. Soil Sci. 2009, 172, 277–287. [Google Scholar] [CrossRef]
  15. Rinnofner, T.; Friedel, J.K.; Pietsch, G.; Freyer, B.; Kruijff, R. Effect of catch crops on N dynamics and following crops in organic farming. Agron. Sustain. Dev. 2008, 28, 551–558. [Google Scholar] [CrossRef]
  16. De Notaris, C.; Olesen, J.E.; Sørensen, P.; Rasmussen, J. Input and mineralization of carbon and nitrogen in soil from legume-based cover crops. Nutr. Cycl. Agroecosyst. 2020, 116. [Google Scholar] [CrossRef]
  17. Quemada, M.; Baranski, M.; Lange, M.N.J.N.-D.; Vallejo, A.; Cooper, J.M. Meta-analysis of strategies to control nitrate leaching in irrigated agricultural systems and their effects on crop yield. Agric. Ecosyst. Environ. 2013, 174, 1–10. [Google Scholar] [CrossRef] [Green Version]
  18. Vogeler, I.; Hansen, E.M.; Thomsen, I.K.; Østergaard, H.S. Legumes in catch crop mixtures: Effects on nitrogen retention and availability, and leaching losses. J. Environ. Manag. 2019, 239, 324–332. [Google Scholar] [CrossRef] [PubMed]
  19. Gollner, G.; Fohrafellner, J.; Friedel, J.K. Winter-hardy vs. freeze-killed cover crop mixtures before maize in an organic farming system with reduced soil cultivation. Org. Agric. 2020, 1–7. [Google Scholar] [CrossRef]
  20. Salo, T.J.; Palosuo, T.; Kersebaum, K.C.; Nendel, C.; Angulo, C.; Ewert, F.; Bindi, M.; Calanca, P.; Klein, T.W.; Moriondo, M.; et al. Comparing the performance of 11 crop simulation models in predicting yield response to nitrogen fertilization. J. Agric. Sci. 2016, 154, 1218–1240. [Google Scholar] [CrossRef] [Green Version]
  21. Kersebaum, K.-C.; Boote, K.J.; Jorgenson, J.S.; Nendel, C.; Bindi, M.; Frühauf, C.; Gaiser, T.; Hoogenboom, G.; Kollas, C.; Olesen, J.; et al. Analysis and classification of data sets for calibration and validation of agro-ecosystem models. Environ. Model. Softw. 2015, 72, 402–417. [Google Scholar] [CrossRef]
  22. Sieling, K. Improved N transfer by growing catch crops—A challenge. J. Kulturpflanz. 2019, 71, 145–160. [Google Scholar]
  23. Holzworth, D.P.; Huth, N.I.; Devoil, P.G.; Zurcher, E.J.; Herrmann, N.I.; McLean, G.; Chenu, K.; Van Oosterom, E.J.; Snow, V.; Murphy, C.; et al. APSIM—Evolution towards a new generation of agricultural systems simulation. Environ. Model. Softw. 2014, 62, 327–350. [Google Scholar] [CrossRef]
  24. Teixeira, E.; Brown, H.; Chakwizira, E.; de Ruiter, J. Predicting yield and biomass nitrogen of forage crop rotations in New Zealand using the APSIM model. Food Security form Sustainable Agriculture. In Proceedings of the 15th ASA Conference, Lincoln, New Zealand, 15–19 November 2010. [Google Scholar]
  25. Kandulu, J.; Thorburn, P.; Biggs, J.; Verburg, K. Estimating economic and environmental trade-offs of managing nitrogen in Australian sugarcane systems taking agronomic risk into account. J. Environ. Manag. 2018, 223, 264–274. [Google Scholar] [CrossRef] [PubMed]
  26. Zhang, Y.; Feng, L.; Wang, E.; Wang, J.; Li, B. Evaluation of the APSIM-Wheat model in terms of different cultivars, management regimes and environmental conditions. Can. J. Plant Sci. 2012, 92, 937–949. [Google Scholar] [CrossRef] [Green Version]
  27. Asseng, S.; Van Keulen, H.; Stol, W. Performance and application of the APSIM Nwheat model in the Netherlands. Eur. J. Agron. 2000, 12, 37–54. [Google Scholar] [CrossRef]
  28. Hoffmann, M.P.; Isselstein, J.; Rötter, R.P.; Kayser, M. Nitrogen management in crop rotations after the break-up of grassland: Insights from modelling. Agric. Ecosyst. Environ. 2018, 259, 28–44. [Google Scholar] [CrossRef]
  29. Knörzer, H.; Lawes, R.; Robertson, M.; Graeff-Hönninger, S.; Claupein, W. Evaluation and Performance of the APSIM Crop Growth Model for German Winter Wheat, Maize and Fieldpea Varieties in Monocropping and Intercropping Systems. J. Agric. Sci. Technol. 2011, 1, 698–717. [Google Scholar]
  30. Vogeler, I.; Hansen, E.M.; Nielsen, S.; Labouriau, R.; Cichota, R.; Olesen, J.E.; Thomsen, I.K. Nitrate leaching from suction cup data: Influence of method of drainage calculation and concentration interpolation. J. Environ. Qual. 2020, 49, 440–449. [Google Scholar] [CrossRef] [PubMed]
  31. Yin, X.; Kersebaum, K.C.; Kollas, C.; Manevski, K.; Baby, S.; Beaudoin, N.; Öztürk, I.; Gaiser, T.; Wu, L.; Hoffmann, M.; et al. Performance of process-based models for simulation of grain N in crop rotations across Europe. Agric. Syst. 2017, 154, 63–77. [Google Scholar] [CrossRef]
  32. EEC. Commission Regulation (EC) No 889/2008 of 5 September 2008 laying down detailed rules for the implementation of Council Regulation (EC) No 834/2007 on organic production and labelling of organic products with regard to organic production, labelling and control. In Official Journal of the European Union; EEC: Luxembourg, 2008; Available online: http://data.europa.eu/eli/reg/2008/889/oj (accessed on 16 November 2020).
  33. Loges, R.; Bunne, I.; Reinsch, T.; Malisch, C.S.; Kluß, C.; Herrmann, A.; Taube, F. Forage production in rotational systems generates similar yields compared to maize monocultures but improves soil carbon stocks. Eur. J. Agron. 2018, 97, 11–19. [Google Scholar] [CrossRef]
  34. Mohrlok, U. Bilanzmodelle in der Grundwasserhydraulik: Quantitative Beschreibung von Strömung und Transport im Untergrund. Ph.D. Thesis, Karlsruhe University, Kaslu, Germany, 2009. [Google Scholar]
  35. Häckel, H. Meteorologie, Ulmer, Stuttgart, 4th ed.; INFINIBU Das Buchuniversum: Düsseldorf, Deutschland, 1999; 448p, ISBN 9783825213381. [Google Scholar]
  36. Löpmeier, F.J. Berechnung der Bodenfeuchte und Verdunstung mittels agrarmeteorologischer Modelle. Z. Bewässerungswirtsch. 1994, 29, 157–167. [Google Scholar]
  37. Hoffmann, M.P.; Jacobs, A.; Whitbread, A. Crop modelling based analysis of site-specific production limitations of winter oilseed rape in northern Germany. Field Crop. Res. 2015, 178, 49–62. [Google Scholar] [CrossRef]
  38. Thiébeau, P.; Justes, E. Effect of N status on leaf area index and radiation use efficiency of white mustard (Sinapis alba L.). In Proceedings of the VIII ESA Congress: European Agriculture in a Global context, Copenhagen, Denmark, 11–15 July 2004. [Google Scholar]
  39. Moore, A.D.; Holzworth, D.; Herrmann, N.I.; Brown, H.E.; De Voil, P.G.; Snow, V.; Zurcher, E.; Huth, N.I. Modelling the manager: Representing rule-based management in farming systems simulation models. Environ. Model. Softw. 2014, 62, 399–410. [Google Scholar] [CrossRef]
  40. Loges, R. Yield, Forage Quality, Dinitrogen Fixation and pre Crop Value of Red Clover and Red Clover/Grass-Mixtures. Ph.D. Thesis, Kiel University, Kiel, Germany, 1998. Available online: https://orgprints.org/2174/ (accessed on 31 December 2020). (In German, English summary).
  41. Vogeler, I.; Cichota, R.; Thomsen, I.K.; Bruun, S.; Jensen, L.S.; Pullens, J.W.M. Estimating nitrogen release from Brassicacatch crop residues—Comparison of different approaches within the APSIM model. Soil Tillage Res. 2019, 195, 104358. [Google Scholar] [CrossRef]
  42. Dejoux, J.-F.; Recous, S.; Meynard, J.-M.; Trinsoutrot, I.; Leterme, P. The fate of nitrogen from winter-frozen rapeseed leaves: Mineralization, fluxes to the environment and uptake by rapeseed crop in spring. Plant Soil 2000, 218, 257–272. [Google Scholar] [CrossRef]
  43. Radoglou, K.; Cabral, R.; Repo, T.; Hasanagas, N.; Sutinen, M.-L.; Waisel, Y. Appraisal of root leakage as a method for estimation of root viability. Plant Biosyst. Int. J. Deal. Asp. Plant Biol. 2007, 141, 443–459. [Google Scholar] [CrossRef] [Green Version]
  44. Tetzlaff, B.; Keller, L.; Kuhr, P.; Kreins, P.; Kunkel, R.; Wendland, F. Räumlich differenzierte Quantifizierung der Nährstoffeinträge ins Grundwasser und in die Oberflä-Chengewässer Schleswig-Holsteins unter Anwendung der Modellkombination RAUMIS-GROWA-WEKU-MEPhos; Final Report; Jülich Forschungszentrum: Jülich, Germany, 2017; Available online: https://www.schleswig-holstein.de/mm/downloads/Fachinhalte/Wasserrahmenrichtlinie/endberichtNaehrstoffmodellierung.pdf (accessed on 2 January 2021).
  45. Wendling, M.; Charles, R.; Herrera, J.; Amossé, C.; Jeangros, B.; Walter, A.; Büchi, L. Effect of species identity and diversity on biomass production and its stability in cover crop mixtures. Agric. Ecosyst. Environ. 2019, 281, 81–91. [Google Scholar] [CrossRef] [Green Version]
  46. Nicolardot, B.; Recous, S.; Mary, B. Simulation of C and N mineralisation during crop residue decomposition: A simple dynamic model based on the C:N ratio of the residues. Plant Soil 2001, 228, 83–103. [Google Scholar] [CrossRef]
  47. Redin, M.; Recous, S.; Aita, C.; Chaves, B.; Pfeifer, I.C.; Bastos, L.M.; Pilecco, G.E.; Giacomini, S.J. Root and Shoot Contribution to Carbon and Nitrogen Inputs in the Topsoil Layer in No-Tillage Crop Systems under Subtropical Conditions. Rev. Bras. Ciênc. Solo 2018, 42, e0170355. [Google Scholar] [CrossRef] [Green Version]
  48. Pietola, L.; Alakukku, L. Root growth dynamics and biomass input by Nordic annual field crops. Agric. Ecosyst. Environ. 2005, 108, 135–144. [Google Scholar] [CrossRef]
  49. Kätterer, T.; Bolinder, M.A.; Andrén, O.; Kirchmann, H.; Menichetti, L. Roots contribute more to refractory soil organic matter than above-ground crop residues, as revealed by a long-term field experiment. Agric. Ecosyst. Environ. 2011, 141, 184–192. [Google Scholar] [CrossRef] [Green Version]
  50. Angst, G.; Angst, S.; Frouz, J.; Peterse, F.; Nierop, K.G.J. Preferential degradation of leaf- vs. root-derived organic carbon in earthworm-affected soil. Geoderma 2020, 372, 114391. [Google Scholar] [CrossRef]
  51. Meurer, K.H.E.; Bolinder, M.A.; Andrén, O.; Hansson, A.-C.; Pettersson, R.; Kätterer, T. Shoot and root production in mixed grass ley under daily fertilization and irrigation: Validating the N productivity concept under field conditions. Nutr. Cycl. Agroecosyst. 2019, 115, 85–99. [Google Scholar] [CrossRef] [Green Version]
  52. Hauggaard-Nielsen, H.; Mundus, S.; Jensen, E.S. Nitrogen dynamics following grain legumes and subsequent catch crops and the effects on succeeding cereal crops. Nutr. Cycl. Agroecosyst. 2009, 84, 281–291. [Google Scholar] [CrossRef]
  53. Korsaeth, A.; Bakken, L.R.; Riley, H. Nitrogen dynamics of grass as affected by N input regimes, soil texture and climate: Lysimeter measurements and simulations. Nutr. Cycl. Agroecosyst. 2003, 66, 181–199. [Google Scholar] [CrossRef]
  54. Djurhuus, J.; Olsen, P. Nitrate leaching after cut grass/clover leys as affected by time of ploughing. Soil Use Manag. 1997, 13, 61–67. [Google Scholar] [CrossRef]
  55. Korsaeth, A.; Henriksen, T.M.; Bakken, L.R. Temporal changes in mineralization and immobilization of N during degradation of plant material: Implications for the plant N supply and nitrogen losses. Soil Biol. Biochem. 2002, 34, 789–799. [Google Scholar] [CrossRef]
  56. Myrbeck, Å.; Stenberg, M.; Rydberg, T. Establishment of winter wheat—Strategies for reducing the risk of nitrogen leaching in a cool-temperate region. Soil Tillage Res. 2012, 120, 25–31. [Google Scholar] [CrossRef]
  57. Bergkvist, G.; Stenberg, M.; Wetterlind, J.; Båth, B.; Elfstrand, S. Clover cover crops under-sown in winter wheat increase yield of subsequent spring barley—Effect of N dose and companion grass. Field Crop. Res. 2011, 120, 292–298. [Google Scholar] [CrossRef]
  58. Kramberger, B.; Gselman, A.; Podvršnik, M.; Kristl, J.; Lešnik, M. Environmental advantages of binary mixtures of Trifolium incarnatum and Lolium multiflorum over individual pure stands. Plant Soil Environ. 2012, 59, 22–28. [Google Scholar] [CrossRef] [Green Version]
  59. White, C.M.; Dupont, S.T.; Hautau, M.; Hartman, D.; Finney, D.M.; Bradley, B.; Lachance, J.C.; Kaye, J.P. Managing the trade off between nitrogen supply and retention with cover crop mixtures. Agric. Ecosyst. Environ. 2016, 237, 121–133. [Google Scholar] [CrossRef] [Green Version]
  60. Henke, J.; Böttcher, U.; Neukam, D.; Sieling, K.; Kage, H. Evaluation of different agronomic strategies to reduce nitrate leaching after winter oilseed rape (Brassica napus L.) using a simulation model. Nutr. Cycl. Agroecosyst. 2008, 82, 299–314. [Google Scholar] [CrossRef]
  61. Askegaard, M.; Olesen, J.E.; A Rasmussen, I.; Kristensen, K. Nitrate leaching from organic arable crop rotations is mostly determined by autumn field management. Agric. Ecosyst. Environ. 2011, 142, 149–160. [Google Scholar] [CrossRef]
  62. Gabriel, J.L.; Alonso-Ayuso, M.; García-González, I.; Hontoria, C.; Quemada, M. Nitrogen use efficiency and fertiliser fate in a long-term experiment with winter cover crops. Eur. J. Agron. 2016, 79, 14–22. [Google Scholar] [CrossRef] [Green Version]
  63. Fontaine, D.; Eriksen, J.; Sørensen, P. Cover crop and cereal straw management influence the residual nitrogen effect. Eur. J. Agron. 2020, 118, 126100. [Google Scholar] [CrossRef]
  64. Guo, L.; Liu, Y.; Wu, G.-L.; Huang, Z.; Cui, Z.; Cheng, Z.; Zhang, R.-Q.; Tian, F.-P.; He, H. Preferential water flow: Influence of alfalfa (Medicago sativa L.) decayed root channels on soil water infiltration. J. Hydrol. 2019, 578. [Google Scholar] [CrossRef]
  65. Yousefi, G.; Safadoust, A.; Mahboubi, A.; Gharabaghi, B.; Mosaddeghi, M.R.; Ahrens, B.; Shirani, H. Bromide and lithium transport in soils under long-term cultivation of alfalfa and wheat. Agric. Ecosyst. Environ. 2014, 188, 221–228. [Google Scholar] [CrossRef]
  66. Gerke, H.H. Bypass Flow in Soil. Encycl. Math. Geosci. 2011, 100–105. [Google Scholar] [CrossRef]
  67. Yang, X.; Lu, Y.; Ding, Y.; Yin, X.; Raza, S.; Tong, Y. Optimising nitrogen fertilisation: A key to improving nitrogen-use efficiency and minimising nitrate leaching losses in an intensive wheat/maize rotation (2008–2014). Field Crop. Res. 2017, 206, 1–10. [Google Scholar] [CrossRef]
Figure 1. Daily mean air temperature (°C) and cumulative monthly precipitation at the experimental site during the experimental periods from August 2015 to August 2017.
Sustainability 13 00394 g001
Figure 2. Timeline of selected field operations with the main crop (MC)/pre-crop either a field pea or a cereal and catch crops (CC) either ryegrass or ryegrass/white clover undersown in May, or white mustard, white mustard/summer vetch, turnip rape, and turnip rape/winter vetch sown after harvest of the main crop (MC).
Sustainability 13 00394 g002
Figure 3. Amounts of nitrogen in the above ground biomass (AGB) and below ground biomass of the various catch crops for two different years (averages from 4 replicates and standard deviations). Measurements were done in November, and either with a field pea (PE) or a cereal (CE) as the pre-crop. RG = ryegrass, WM = white mustard, TR = turnip rape, GF = Green Fallow, BF = bare fallow, WC = white clover, SV = summer vetch, WV = winter vetch. Small letters indicate significant difference between treatments, capital letters between pre-crop and k/j between years.
Sustainability 13 00394 g003
Figure 4. Species separation (averages from 4 replicates) of the various catch crops (CC), with nL = non legume and L = legume, and nsP = non seeded plants. Measurements were done in November, and either with a field pea (PE) or a cereal (CE) as the pre-crop. RG = ryegrass, WM = white mustard, TR = turnip rape, GF = Green Fallow, BF = bare fallow, WC = white clover, SV = summer vetch, WV = winter vetch.
Sustainability 13 00394 g004
Figure 5. Mineral soil nitrogen amounts in three different depth after harvest of the main crop (August), and at the beginning (November) and the end of the drainage period (March) for two consecutive years. The pre-crop was either field pea (PE) or a cereal (CE) and different catch crops were used: RG = ryegrass, WM = white mustard, TR = turnip rape, GF = Green Fallow, BF = bare fallow, WC = white clover, SV = summer vetch, WV = winter vetch. Small letters indicate significant difference between treatments, capital letters between pre-crop and k/j between years.
Sustainability 13 00394 g005
Figure 6. Average nitrate-N concentration in drainage water as measured by suction cups and cumulative amount of nitrate-N leached over two drainage periods depending on the pre-crop, with either field pea (PE) or a cereal (CE) and different catch crops: RG = ryegrass, WM = white mustard, TR = turnip rape, GF = Green Fallow, BF = bare fallow, WC = white clover, V = vetch. The dotted line shows the critical NO3-N concentration. Small letters indicate significant difference between treatments, capital letters between pre-crop and k/j between years.
Sustainability 13 00394 g006
Figure 7. N leaching load as a function of soil mineral N content in the upper 90 cm of the soil minus the N taken up by the various catch crops (CC) with either a field pea (PE) or a cereal (CE) as the pre-crop. Also shown are results which included the N mineralised over the autumn period. The results are from two leaching periods (October 2015 to March 2016 and October 2016 to March 2017). The dotted line shows the regression line, the broken line the 1:1 line, and the shaded area indicated the critical N load thresholds based on drainage amount between 200 and 500 mm and a critical N-load of 50 mg nitrate l−1.
Sustainability 13 00394 g007
Figure 8. Measured and APSIM predicted dry matter of the catch crop over the autumn/winter period with WM = white mustard and TR = turnip rape, and for the WM the total DM including volunteers.
Sustainability 13 00394 g008
Figure 9. Measured and APSIM predicted N in the dry matter of the catch crop, including volunteers in the WM over the autumn/winter period with WM = white mustard and TR = turnip rape.
Sustainability 13 00394 g009
Figure 10. Measured and APSIM predicted dry matter (DM), grain yield, and grain N concentration of the subsequent main crop (MC), which was either oats or field pea (PE) depending on the pre-crop (either a cereal, CE, or PE) and either with a bare fallow, or a catch crop over the autumn/winter period with WM = white mustard and TR = turnip rape.
Sustainability 13 00394 g010
Figure 11. Measured (broken lines, with four replicates) and APSIM (solid line) predicted cumulative nitrate leaching over two different drainage periods following a cereal in 2015 and a field pea in 2016, and with either a bare fallow over the autumn/winter period or a catch crop, with WM = white mustard and TR = turnip rape.
Sustainability 13 00394 g011
Figure 12. APSIM predicted cumulative nitrate leaching with either a bare fallow (BF) over the autumn/winter period or a white mustard (WM) catch crop (CC). The residue of the white mustard was either returned to the various soil organic matter pools of APSIM based on the C:N ratio of the residue or the N taken up by the CC was returned as mineral N (NH4-N). Cumulative measured N leaching is also shown.
Sustainability 13 00394 g012
Table 1. Maximum above ground dry matter of the various catch crops (CC DM; t ha−1), total above ground biomass (AGB; t ha−1), belowground biomass (BGB; t ha−1), total dry matter (= AGB + BGB) and carbon: nitrogen in the DM, for two different years (averages from 4 replicates and standard errors). Measurements were done in November, and either with a field pea (PE) or a cereal (CE) as the pre-crop. RG = ryegrass, WM = white mustard, TR = turnip rape, GF = Green Fallow, BF = bare fallow, WC = white clover, SV = summer vetch, WV = winter vetch. Lowercase letters indicate significant difference between treatments, capital letters between pre-crop and k/j between years.
VariableYearPre-CropRGRG/WCWMWM/SVTRTR/WVGFBF
CC DM(t ha−1)2015PE0.45 ja (0.23)0.40 a (0.23)3.05 b (0.18)3.20 b (0.89)2.96 b (0.32)2.33 b (0.63)0.0 a0.0 a
CE1.44 ab (0.18)1.14 ab (0.36)3.20 jc (0.39)1.94 ac (0.29)2.46 jac (0.38)2.15 ac (0.13)0.0 b0.0 b
2016PE2.76 ka (0.23)1.19 ab (0.67)2.82 a (0.77)1.83 a (0.61)2.65 Aa (0.28)1.74 a (0.22)0.0 b0.0 b
CE1.49 ab (0.29)0.29 b (0.20)1.48 abk (0.27)0.30 b (0.13)0.76 bkB (0.03)0.70 b (0.20)0.00.0
AGB DM(t ha−1)2015PE2.55 a (0.31)2.62 a (0.25)3.79 b (0.16)4.06 ab (0.45)3.34 ab (0.15)3.84 ab (0.44)2.62 ab (0.44)1.9 c (0.08)
CE1.78 a (0.10)1.69 a (0.17)3.37 b (0.42)2.80 j,b (0.95)2.82 jab (0.31)2.44 jab (0.21)1.63 a (0.25)1.1 c (0.03)
2016PE2.86 Aa (0.20)3.82 a (0.53)3.58 a (0.48)3.62 a (0.48)3.04 Aa (0.36)3.30 Aa (0.48)2.18 Aa (0.28)0.9 b (0.01)
CE1.50 Bab (2.86)2.87 a (3.64)2.05 a (1.53)1.78 kab (0.26)1.19 kBb (0.09)1.41 kBb (0.10)0.96 Bb (0.13)0.10 c (0.01)
BGB DM(t ha−1)2015PE0.99 Aa (0.12)0.98 ab (0.22)0.44 bc (0.07)0.28 bc (0.03)0.47 jAb (0.05)0.57 jAb (0.07)0.40 jAb (0.10)0.08 c (0.02)
CE2.42 Ba (0.3)2.11 ja (0.29)0.51 jb (0.27)0.55 jbc (0.11)0.93 Bce (0.13)1.04 jBe (0.12)0.88 Bbce (0.15)0.10 d (0.01)
2016PE2.54 a (0.54)1.56 ab (3.29)0.66 Ab (0.11)0.68 Ab (0.06)1.00 kab (0.07)1.18 kAa (0.14)1.01 kab (0.14)
CE3.46 a (0.51)0.58 kb (0.10)1.36 kbc (0.07)1.62 kBac (0.27)2.02 ac (0.40)1.86 kBa (0.15)3.00 ac (0.73)
Total DM(t ha−1)2015PE3.54 ja (0.35)3.60 a (0.21)4.24 a (0.22)4.34 a (0.48)3.81 a (0.14)4.41 a (0.42)3.02 a (0.47)2.6 b (0.10)
CE4.2 a (0.31)3.80 ab (0.41)3.88 ab (0.43)3.35 ab (0.05)3.75 ab (0.30)3.48 ab (0.32)2.50 b (0.33)2.1 jc (0.02)
2016PE5.40 ka (0.38)5.38 ab (0.72)4.24 ab (0.56)4.30 ab (0.48)4.04 ab (0.41)4.48 ab (0.45)3.19 b (0.23)0.9 c (0.01)
CE4.96 a (0.41)3.45 ab (0.42)3.40 b (0.09)3.40 ab (0.30)3.21 ab (0.32)3.27 b (0.09)3.96 ab (0.72)1.0 kc (0.01)
C:N AGB2015PE11.7 jAa (0.78)12.9 ab (1.31)15.4 ab (1.78)15.1 ab (1.76)13.5 ab (1.79)12.3 a (0.58)11.7 a (0.52)16.0 jb (1.20)
CE16.3 jBa (0.70)18.6 jab (1.52)16.4 abc (1.67)12.0 c (0.36)14.5 abc (0.69)13.8 bc (0.75)17.4 abc (1.42)15.9 jab (0.83)
2016PE15.6 kAa (0.51)11.7 b (0.52)16.1 ab (1.94)13.0 b (0.42)15.7 ab (2.24)12.4 b (0.70)11.9 b (0.98)10.8 kb (0.34)
CE20.0 kBa (0.81)11.1 kbc (0.44)20.8 a (1.58)13.0 bc (1.52)14.7 c (1.14)12.1 bc (0.97)13.6 bc (1.26)10.7 kb (0.27)
Table 2. Dry matter (DM), grain yield, and nitrogen of the DM of the subsequent main crop (MC), which was either oats or field pea (PE) depending on the pre-crop (either PE or a cereal (CE) and different catch crops: RG = ryegrass, WM = white mustard, TR = turnip rape, GF = Green Fallow, BF = bare fallow, WC = white clover, SV = summer vetch, WV = winter vetch. Lowercase letters indicate significant difference between treatments, capital letters between pre-crop and k/j between years.
VariableYearPre-CropMCRGRG/WCWMWM/SVTRTR/WVGFBF
MC DM(t ha−1)2015PEOats11.9 (1.08)11.5 (0.76)11.7 A (0.79)11.8 A (0.88)10.9 (0.90)11.8 (1.35)11.5 A (0.65)10.3 (1.01)
CEPE8.2 (2.04)8.2 (0.73)6.2 B (0.87)6.7 B (1.03)8.6 (1.11)9.5 (1.30)7.6 B (0.62)8.1 (0.56)
2016PEOats11.1 a (0.44)14.0 b (0.57)9.5 ac (0.106)11.1 a (0.53)12.5 ab (0.70)10.8 abc (0.84)11.2 abc (0.69)8.9 c (0.34)
CEPE13.3 (1.46)11.5 (1.04)13.7 (2.24)12.2 (2.13)12.1 (1.80)12.5 (0.41)10.4 (1.63)9.0 (0.95)
MC Grain Yield(t ha−1)2015PEOats5.2 ab (0.41)5.1 a (0.15)4.8 ab (0.45)5.4 ab (0.39)4.1 b (0.06)4.5 ab (0.49)4.6 ab (0.25)4.0 ab (0.48)
CEPE4.1 (1.02)4.1 (0.36)3.1 (0.43)3.3 (0.52)4.3 (0.56)4.8 (0.65)3.8 (0.31)4.0 (0.28)
2016PEOats4.9 ab (0.44)5.1 ab (0.27)4.8 a (0.11)4.7 ab (0.38)5.0 ab (0.48)5.3 ab (0.46)4.4 ab (0.35)4.2 b (0.12)
CEPE6.6 ab (0.73)5.7 ab (0.52)6.8 ab (1.12)6.1 ab (1.07)6.0 ab (0.90)6.3 b (0.20)5.2 ab (0.81)4.5 a (0.47)
MC DM N(kg ha−1)2015PEOats130.0 (15.60)122.6 A (8.05)122.2 (11.19)125.8 (12.07)109.8 A (12.74)139.7 A (24.20)102.8 A (6.86)105.8 A (17.00)
CEPE274.8 (53.27)312.9 B (33.45)224.0 (36.08)225.5 (28.11)270.1 B (22.79)307.8 B (31.79)265.4 B (21.48)270.0 B (17.44)
2016PEOats107.3 Aab (7.20)140.5 Aa (11.13)87.8 Abc (8.14)112.4 ab (5.43)125.8 Aa (8.48)99.5 Aab (6.83)104.3 abc (8.86)67.2 Ac (4.26)
CEPE299.0 Bab (52.27)292.7 Bab (29.38)317.3 Bab (46.23)278.0 ab (57.08)265.9 Bab (30.03)286.1 Bb (13.12)244.5 ab (45.59)189.1 Ba (17.06)
Publisher’s Note: MDPI stays neutral with regard to jurisdictional claims in published maps and institutional affiliations.

