Article

University Teaching in Times of Confinement: The Light and Shadows of Compulsory Online Learning

Department of Pedagogy, Faculty of Education, Psychology and Social Work, University of Lleida, 25001 Lleida, Spain
*
Author to whom correspondence should be addressed.
Sustainability 2021, 13(1), 375; https://doi.org/10.3390/su13010375
Submission received: 2 December 2020 / Revised: 28 December 2020 / Accepted: 30 December 2020 / Published: 4 January 2021
(This article belongs to the Collection Sustainable Teaching and Learning Strategies in the Digital Age)

Abstract

:
A quantitative study was carried out with the aim of analyzing the perspective of the students in relation to the factors that have influenced quality teaching during the confinement period resulting from the SARS-CoV-2 pandemic. To do this, an ad hoc questionnaire was designed and conducted in the months of June–July 2020. The sample consisted of 893 people who were studying at various Spanish universities. The results show little diversity in teaching methodologies; virtual teaching was carried out with the same parameters as face-to-face teaching. The role of the student body was one of passivity, consisting of little interaction with the teachers. Although it is true that there were no difficulties in following the course, there was limited attention paid to the emotional well-being of the students. Amongst the conclusions garnered significant, we point out the need to develop the adaptability of university teaching staff to unforeseen situations, as well as a continuing reflection on the model used in the teaching process mediated by digital technologies and the importance of promoting greater autonomy and self-regulation during learning.

1. Introduction

The disease derived from the SARS-CoV-2 virus has spread rapidly throughout the world, forcing millions of people into confinement. In March 2020, the World Health Organization [1] declared it a pandemic and, as a protective measure, universities around the world had to postpone or cancel all in-person learning and activities. The confinement brought about a drastic change, quite literally, from one day to the next. The result of this pivotal point was that the students could no longer physically attend their educational institutions.
Focusing on the university environment and, specifically our context (Catalonia, Spain), the university professors had to switch from in-person learning to a completely online learning model without any prior notice beginning in March 2020 through to the end of the academic year (July 2020). This situation caused a certain level of stress and concern throughout the educational ecosystem, and in particular, the academic administration, professors, and students, as the learning process is designed to take place in person. We would agree on this point with [2] when it states that quality teaching must include planification with adaptations to special situations and alternative teaching-learning systems.

2. Theoretical Framework

There are many studies, such as those of [3,4] or [5], which explain that by applying certain methodological strategies and using technological tools, professors can significantly be helped to develop their academic activities. These show that in order to make headway in the improvement of training through digital technologies, the support and day-to-day monitoring of the student body is essential. At the same time, it is important to keep the mental health and well-being of the student body in mind as well as that of the teaching staff which is of equal importance. To carry this out properly requires a skill set of knowledge, proficiency, and adeptness which cannot be acquired overnight [6].
The situation takes on an even more important relevancy if we consider the report issued by [7], among others, which indicates that “[didactic] methodologies continue to be mostly traditional (59.7%). Active methodologies are applied in a lower percentage (34%) and only a minority could be described as innovative (5.3%)”. This report shows that all the elements for a quick transition to a learning process more in line with the needs of younger people studying at the university are still not in place.
This situation is even more worrisome given that there is a notable deficit in digital skills. The study by [8] shows that the use of digital technologies in the classroom is much lower than the expectations of the students. Countries such as Chile, Nicaragua, Guatemala, El Salvador, Bolivia, or some regions of Africa still have large geographic areas with low connectivity [9,10], despite having made meritorious advances in respect to training programs in the area of education.
There is one more element linked to the management of emotions which [11] and Wade et al. [12] emphasize in their studies, the necessity to recognize and investigate the effects on mental health derived from the health crisis. In other words, a social and personal crisis is now being experienced as a result of social isolation from friends, interruption of daily activities and family difficulties. The following being an immediate challenge which could manifest later in the form of difficulties with school reintegration or academic performance [13]. This situation has been exacerbated in vulnerable groups as they may be at a greater risk of having mental health problems.
In short, quality teaching, especially in times of crisis, can only be achieved if the participation and involvement of key players in education is high [14,15,16,17] agree that elements such as content, organization, tutorials, evaluation, and technological environments are core variables that affect the quality of teaching.
Focusing on the aspects of online training processes, the studies [18,19,20,21] offer us a series of key variables that have guided the following study:
  • Quality virtual teaching/learning cannot transfer the same methodologies and classroom content from in-person learning to a virtual modality.
  • A pedagogical learning model based on virtuality prioritizes the accompaniment and tutoring of the student body.
  • Virtual teaching allows some flexibility in the learning process but requires planning and systematization of the procedure.
  • Emphasis should be placed on meaningful and significant content for the student body.
  • Telematic knowledge is important. Students should be familiar with new technologies and the Internet, otherwise, this could be a major obstacle to a virtual teaching-learning process.
  • Satisfaction in learning is important.
In establishing the specific elements/inputs that our study focuses on, it has become evident that certain issues [22] have been brought to light as a result of the rapid pace teaching has acquired in relation to the process mediated by technology. We will go into detail below.
First of all, the technological tools, material and resources which have been used and the digital skills of those involved must be discussed and taken into account.
Indeed, the students tend to have a good level of competence with the ICT tools (especially at the communicative, interactive and collaborative level [23]). What has been brought into evidence is the low digital competence of teachers. According to the OECD [24], only 40% of educators at all educational levels consider themselves prepared to use digital technologies to teach classes.
Adding to this low level of competence is the fact that the teaching is considered as a process of the transmission of content [25]. For this reason, the use of technologies in university education is limited to a basic use, which maintains the pedagogical model of the professor as an axis to transmit knowledge and uses a limited spectrum of technological tools [26].
Another fundamental element, which we have also focused our study on, is the planification process and all those (professors, administrators, managers) involved.
We consider that one of the problems related to these aspects has to do with the generalized conception that virtual training is considered as being of an inferior quality when compared to face-to-face learning. The teaching staff has not considered the incorporation of technologies in university education as an opportunity to generate an improved quality teaching that might even substitute face-to-face learning [27,28,29,30].
This point has been aligned with the new Action Plan for Digital Education 2021–2027 of the European Commission, which enhances the focus on digital education as a fundamental means for the necessary transformation in all social sectors, understood as a key instrument of fair and inclusive recovery for all citizens [31].
Therefore, we believe that the professor should increasingly understand and plan their subjects under the paradigm of considering themselves as a guide, mediator, and advisor who creates spaces and opportunities for the student to promote autonomous, critical and reflective learning [32,33].
Finally, we have considered a third axis which refers to the quality and emotional consequences of confinement.
Studies such as [34,35] analyze the effort that the student body has had to make to adapt to a new form of training which requires greater discipline and commitment [36]. Variables such as social isolation, possibility of internet connection, financial situation and anxiety related to the pandemic should be included. These issues leave students in a digital divide caused by multiple factors and were enhanced by the confinement situation as a consequence of the pandemic [37,38,39].
Studies show that students felt lost with the emergency teaching that was carried out, basically because they had not developed their capacity for self-regulation and autonomy of learning [40]. Likewise, the students, being bereft of face-to-face contact, had to grapple with an expository teaching, where the professors were channels of information, therefore leaving the students isolated and disoriented when faced with the amount of materials and activities which they did not know how to address. This situation thus multiplied the lack of involvement, disorientation, and understanding and of tasks [35].
Finally, we agree with [41] that non-face-to-face teaching based on digital technologies could promote teaching-learning methodologies that enhance autonomy and self-assessment as well as focusing efforts on making students aware of what competency objectives are intended to be achieved with the subsequent development of activities.
In the article we would like to present this study which was developed at the University of Lleida, during lockdown and confinement from March to June 2020. An ad-hoc questionnaire was applied to various Spanish universities with the objective of analyzing the perspective of the students in relation to the teaching carried out during the confinement and identify proposals for improvement.
Above all, we were interested in taking a closer look at specific aspects related to the teaching-learning process: the role of the student body, the use of digital tools, emotional management, and the quality of teaching.

3. Materials and Methods

3.1. Methodological Approach Information Collection Strategy

The main objective is to analyze the factors that have had an impact on what the students considered quality teaching during the period of confinement from the view of students who actively took part in this particular type of educational setting.
The sudden and improvised change from in-person learning or face-to face learning to a virtual classroom as a consequence of the compulsory confinement of the population during the COVID-19 pandemic has produced a situation worthy of analysis. The perspective of the students on how this online learning was carried out will help us to look for improvement strategies by analyzing different intervening factors, such as the relationships that were established, the engagement of the students, and the availability of resources.
To do this, an ad-hoc questionnaire was used. This questionnaire was given out to the university student population of 20 state public universities which were chosen at random. One part of this questionnaire consists of the identification of the informants with data such as gender, age, degree and is information which will have no effect on the rest of the data, followed by 49 items with answers based on a Likert scale and grouped in different sections or blocks:
  • technological device and material and resources used by the students
  • subject planification and direct student involvement
  • digital skills that surveyed student claims to have
  • emotional state resulting from lockdown and confinement
  • mutual interaction between professors and students
  • perceived quality by student of virtual learning
The different sections of the questionnaire were established according to the studies cited in the theoretical framework as well as other factors such as the digital tools and materials used, digital competence of the protagonists, the professor-student interactions and an adequate planification all of which are decisive to defining the quality of online teaching
As an exception, open-ended questions were introduced in the section corresponding to the emotional state derived from the confinement situation. This section has been introduced as an exception in order to determine if the confinement produced any variation in the mood of the students that had an impact on the vision of the teaching developed which have been converted into a numerical format for greater convenience in the descriptive statistical treatment of the data.
Finally, the last section aims to obtain concrete data on the perceived quality of the online teaching received during the confinement but coming from the students’ perspective.
The questionnaire used a content validation process by calculating consensus of the responses that are generated by an appropriately selected panel of judges: 12 judges, 6 experts on the subject and 6 representatives who participated in the sample. The judges analyzed the different items of the questionnaire following validation criteria established in advance: pertinence, uniqueness, and relevance.
Reliability was studied through the coefficient of Cronbach’s Alpha of the complete questionnaire (49 items) and the result indicates that the degree of reliability achieved by this sample in the instrument is very good: 0.837 (95% CI: 0.820–0.854). The reliability of each section has been estimated with the Intraclass Correlation coefficient, which is comparable to Cronbach’s “Alpha” Coefficient. In this case the reliability by sections is between 0.722 and 0.863, which is very good.
This description has been carried out with the distribution of the response percentage to each option, mean, median y standard deviation (SD) due to the aforementioned Likert format of the items.

3.2. Characterization of the Sample

As previously mentioned, the data collection was carried out among 20 randomly chosen universities.
A total of 893 participants have been collected. This sample can be considered statistically representative of the study population, with the assumptions of high N (>20,000) and maximum variance (p = q = 50%), so that with a confidence coefficient of 95%, the maximum margin of error is 3.2, and is totally acceptable.
The origin of the participants is mainly undergraduate students 63% (1st: 38.8%; 2nd: 24.1% and 18% are 3rd and 4th year students) while 19.1% are doing master’s or doctorate studies.
With a probabilistic random sampling, the sample has been considered representative and its distribution has been adjusted to the university student population pyramid where there are more students in undergraduate degrees than in master’s degrees and doctorates. In addition, there is a greater concentration in the first years of the degree. In summary, the informants in the sample were random, considering that the aim was to have knowledge of the university student in general, although the relevance from one course to another may be of help in establishing differentiated strategies when implementing online teaching.
In terms of gender, the female population study is clearly in the majority compared to the male (82.1% vs. 17.8%). Their ages range between 18 and 63 years with a median age of 22 years. 79.3% range up to 25 years of age; 11.9% of the oldest are over 30, including 5.3% over 40 and 0.6% over 50. The mean age is 23.7 years (95% CI: 23.2–24.1; standard ± 7.2 years) The mean age of the women is somewhat higher (24.9) than that of men (23.4).

3.3. Process and Data Analysis

The students were first informed that their participation was voluntary, and that the treatment of the information would be totally anonymous. To reach all students, the questionnaire was administered online.
To perform the statistical analysis, the computer application: IBM-SPSS-25 (reference: IBM Corp. Released 2017. IBM SPSS Statistics v 25.0 for Windows; Armonk, NY, USA) was used.
A descriptive analysis of the data was carried out with the usual statistical techniques and tests of centrality (mean, median) and variability (standard deviation and range) together with the distribution of the percentage response frequency. Cronbach’s “alpha” Coefficient and Intraclass Correlation to estimate reliability was also used. Given the lack of adjustment to statistical normality, non-parametric contrast tests were used: Friedman (for repeated measures), Mann–Whitney (to compare two independent groups with each other) and Kruskal–Wallis (when more than two groups are compared) The effect size was estimated on the R2 scale.
The level of significance set is the usual 5% (significant if p < 0.05) except in the KS test of goodness of fit where only serious deviations are considered significant, that is, at 1% (p < 0.01).

4. Results

In order to analyze the perspective of the students in relation to the instruction carried out during the confinement period and to define those questions susceptible to improvement, a descriptive analysis by sections was first carried out and added to possible correlations. Independent variables were also considered.

4.1. Descriptive Analysis

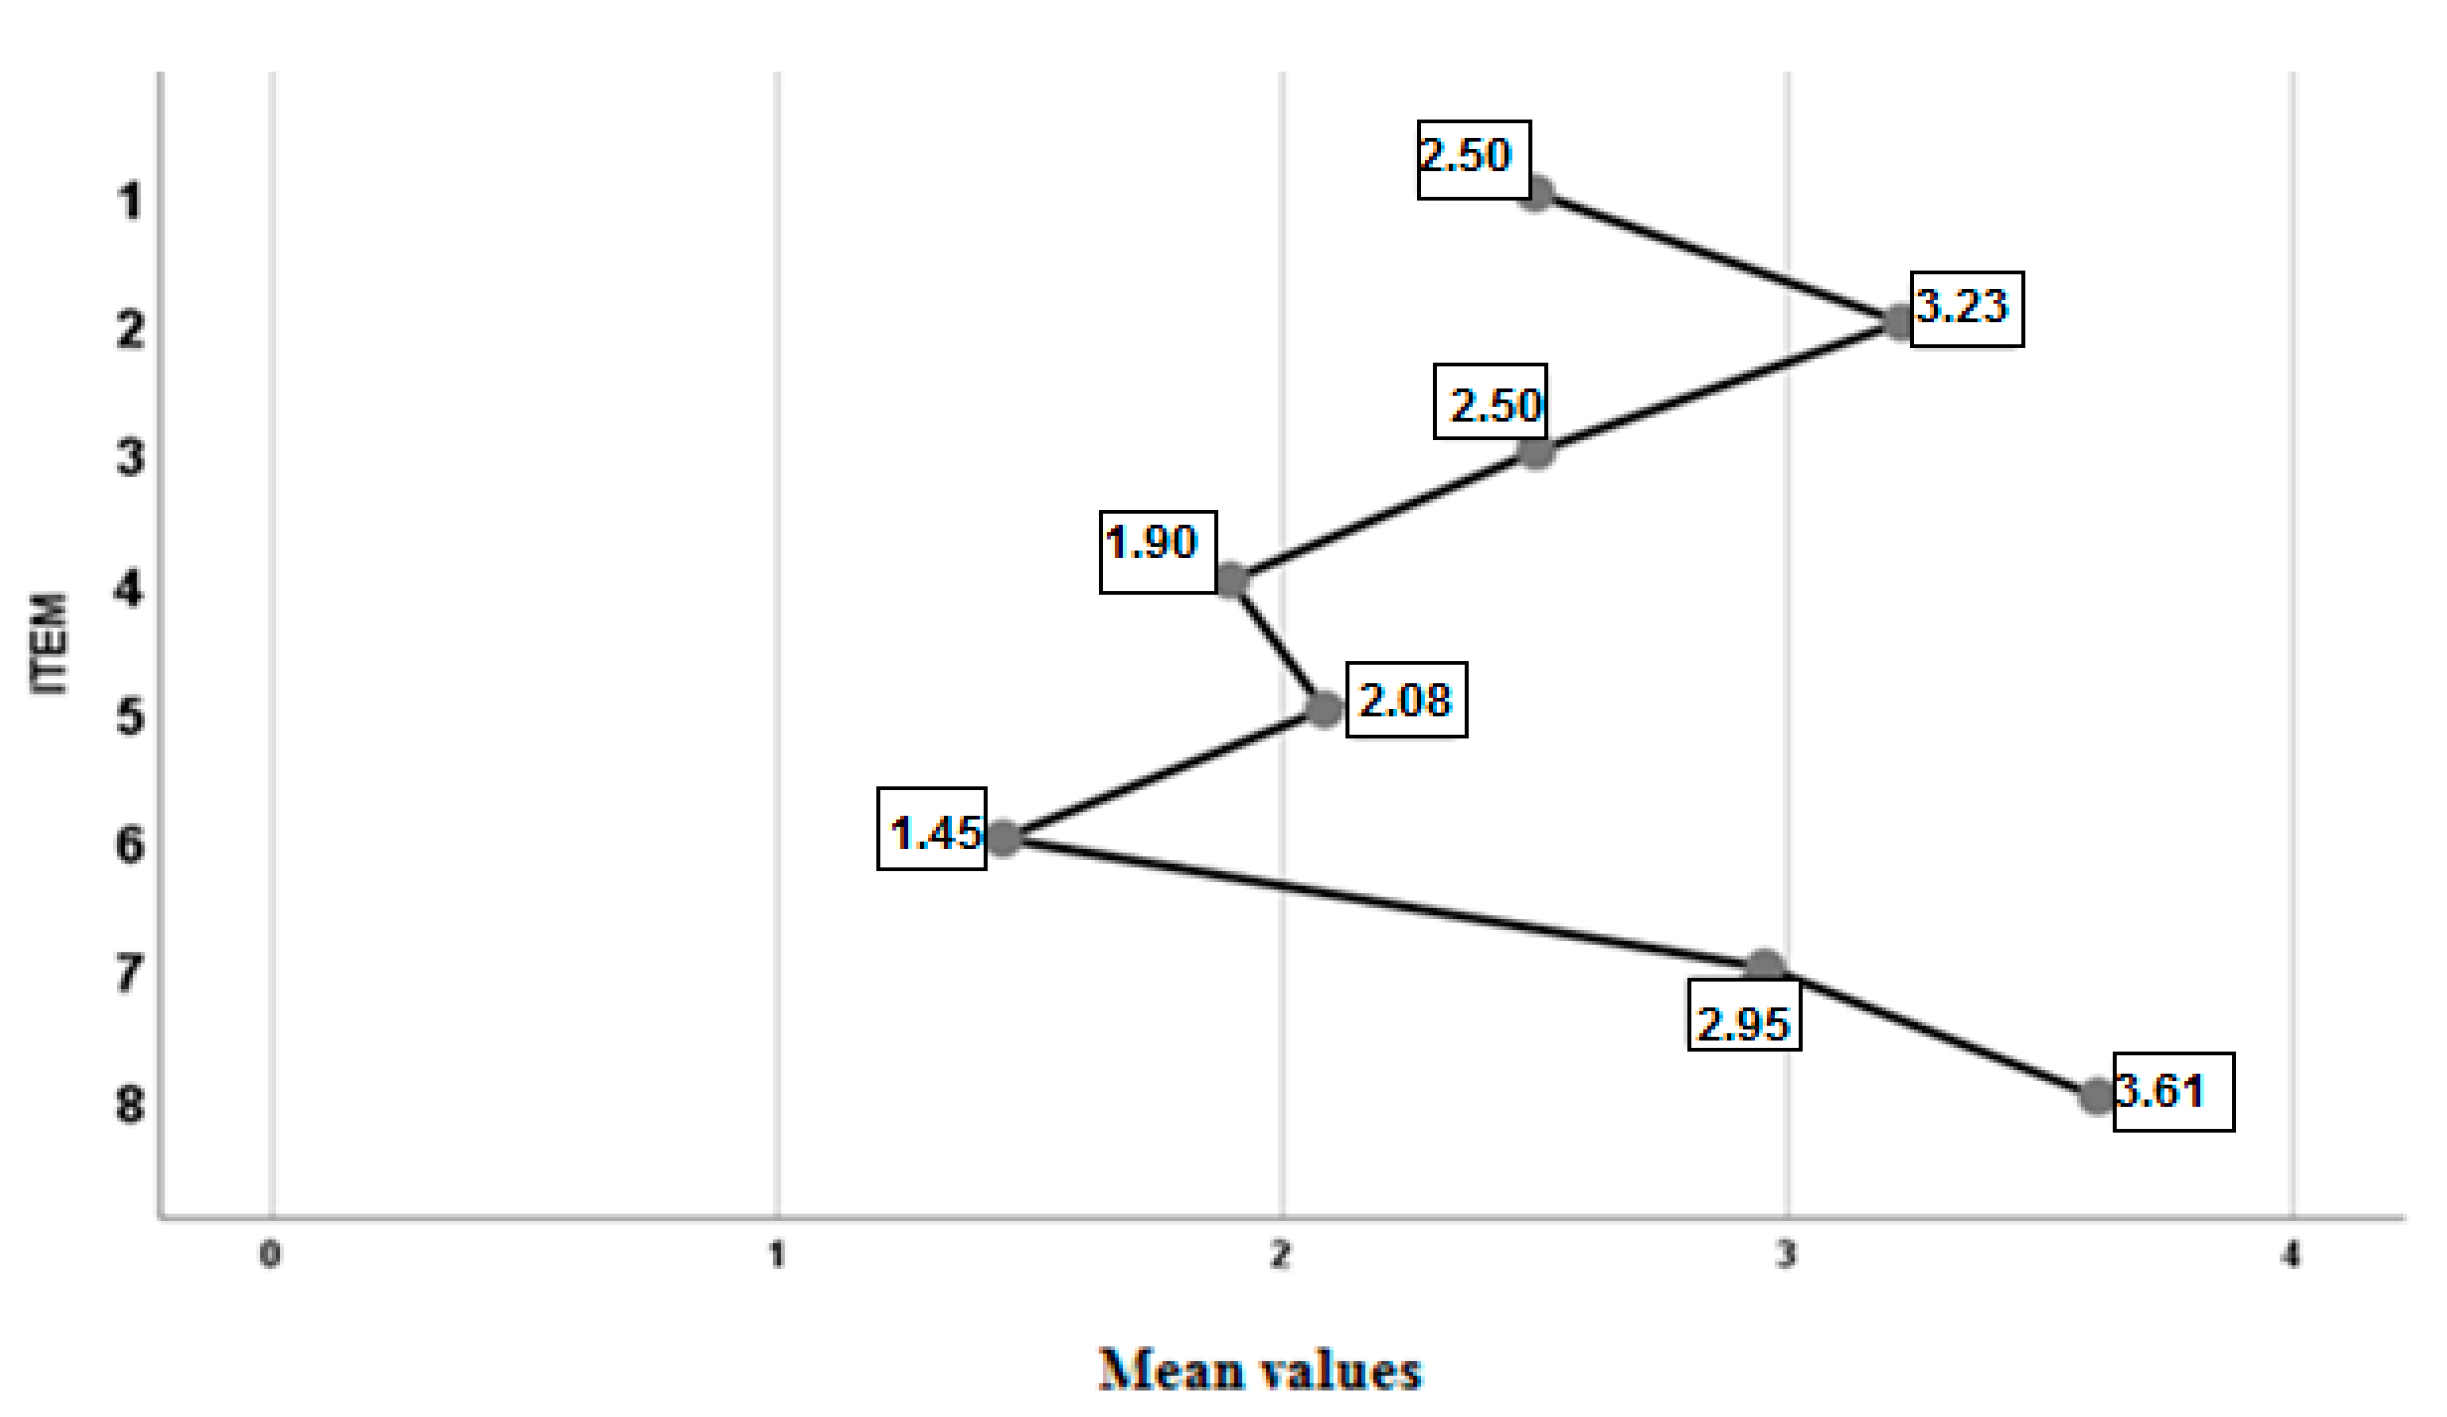
Technological devices, materials, and resources used: This section is made up of the following items: 1. I was familiar with the technological device that we have used. 2. In general terms the technological devices were easy to use. 3. I have used only basic digital tools (institutional email, virtual university campus…). 4. I have worked with online materials that were visual, attractive and motivating. 5. The teaching staff only gave me access to closed source and proprietary software resources. 6. The students [we] have participated in the development of materials and resources. 7. Materials and resources were easy to access and download. 8. I have a computer and internet at home for work (Table 1):
The majority of the surveyed population stated that they were familiar with the technological devices used and that it was easy to manage. Closed source and proprietary software resources such as institutional email or the virtual campus of the university were fundamentally used. Another data to highlight is that the majority (76.2%) of the surveyed population had a computer and internet connection at home to work.
Considering the participants who answered all the items of this dimension (N = 875; Figure 1), the resulting mean values (between 1.45 and 3.61) have been compared, finding statistically significant differences between them, with p < 0.001 (Friedman: value = 2107.91; p-value = 0.000000; very large effect size: R2 = 0.337). These significant differences also suggest that a large majority of the students had the necessary resources; a computer and internet connection at home as well as the fact that they were familiar with the technological tools used. On the contrary, we found significant differences in the fact that the students were never involved in the creation of materials and resources since they used closed-source and proprietary software resources/material provided by the professors.
In this same section, we wanted to inquire about how instruction is carried out with the item “Teaching has adapted to the confinement situation, and due to the impossibility of conducting face-to-face classes, can you indicate what teaching actions have been carried out and/or what the majority of the professors use and how often?”; we received 12 ordinal response items that we have coded to resemble the Likert scale used in the first part of this section in the following way: 0 = no, 1 = once a month, 2 = once every two weeks, 3 = once a week, 4 = more than twice a week. Since the responses are ordinal in nature, it would have been more appropriate to work with the medians, but since the mean values are similar to those of their medians, we decided to make the contrasts with the mean values of each item. 
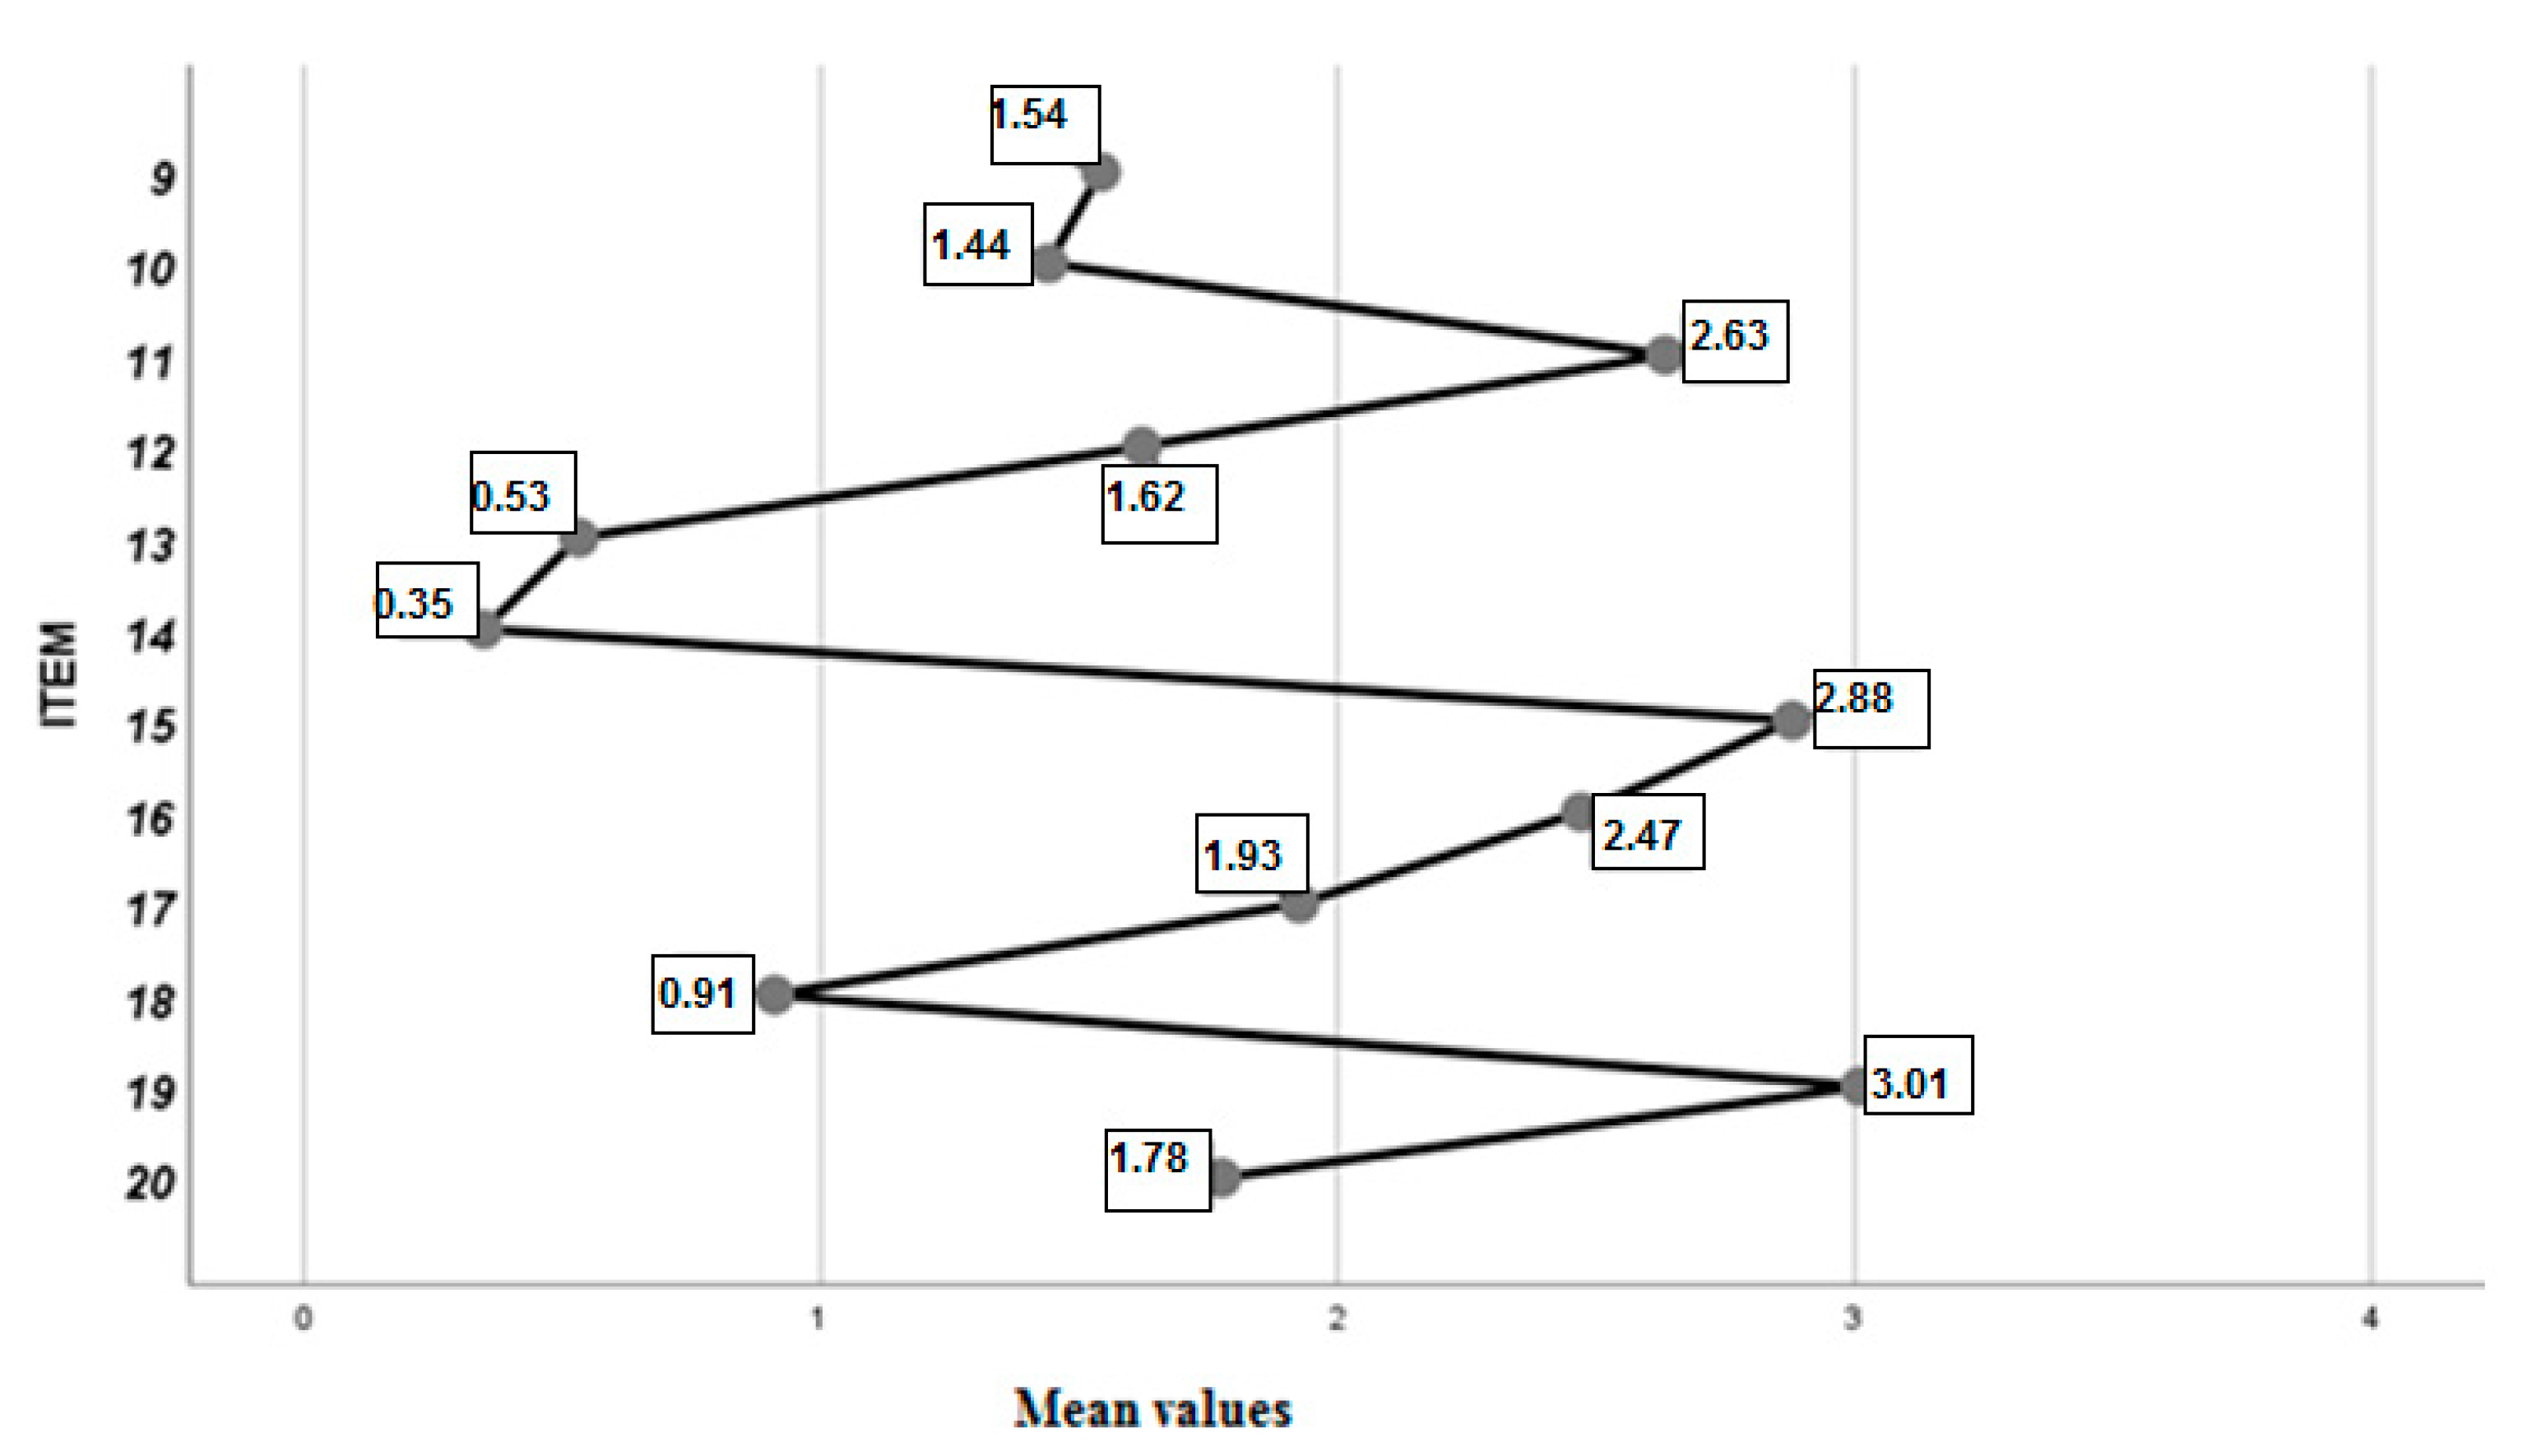
Table 2 contains the descriptions of this 2nd group of items. The degree of reliability is remarkable (0.722). When reviewing the responses, we observed that 3 items were more concentrated in the upper part of the scale, that is, having a greater frequency of use (No. 19, 15 and 11); In other words, online teaching was mainly focused on: video conferences for the whole class, individual activities, and uploading documents to the platform. The averages of these items indicate that the professors interacted this way once a week. However, the data show us that video conferences on an individual level (by way of individual tutorials) as well as video conferences with experts (No. 18 and especially 13 and 14) were used less, approximately once a month.
The mean values of those who had answered the complete set of items (N = 827; Figure 2) were contrasted, which vary in the range between 0.35 and 3.01 points (similar to those in the table above). The differences observed between these items are highly significant with p < 0.001 (Friedman: value = 3156.50; p-value = 0.000000; very large effect size: R2 = 0.358). The contrast between the means can be confirmed as at least once a month the professors planned concrete actions once a week focused on group video conferences. The frequency was extended to more than a month if the programmed action was related to individual tutorials or the participation of experts. These actions have the lowest average.
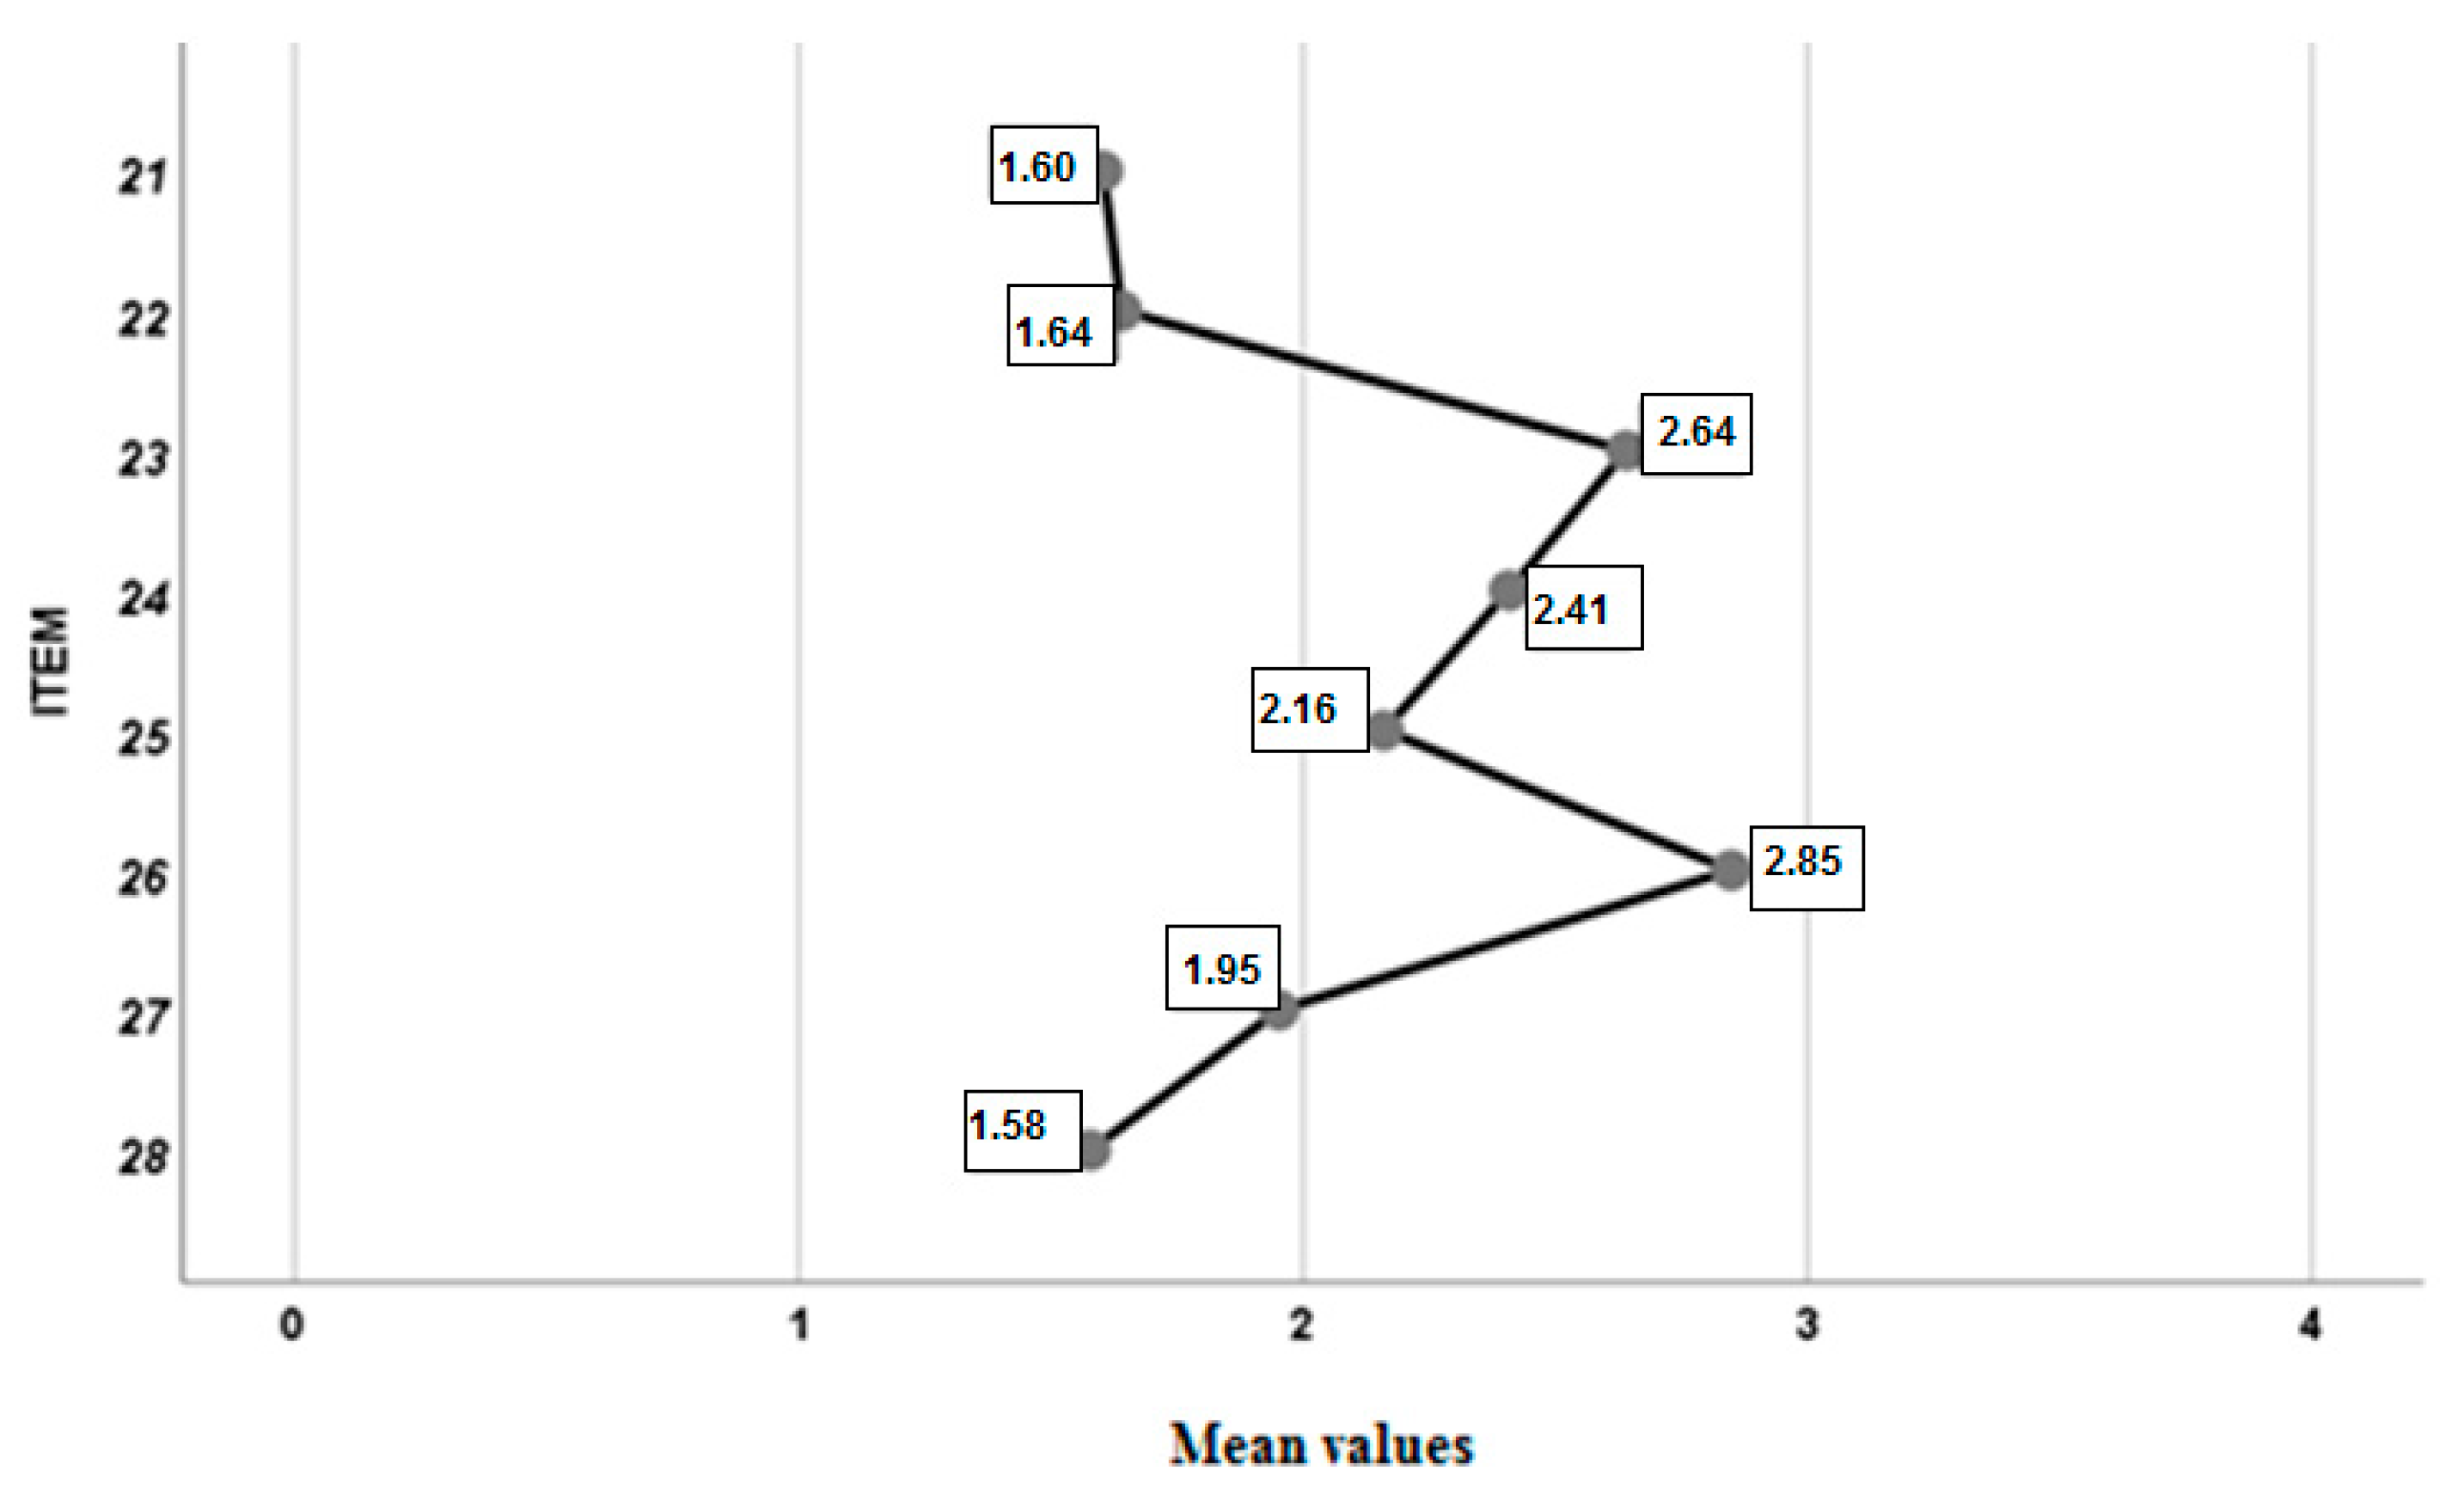
Subject planification: This dimension consists of 8 items in Likert format: 21. The organization of online learning was clear from the first moment: tasks to be carried out, delivery method, delivery periods, and evaluation activities. 22. The workload to be carried out has been adequate for the time established to do it. 23. The online sessions respect the timetables of the face-to-face sessions, facilitating no overlapping periods online between subjects. 24. The evaluation was adapted to the online model. 25. The evaluation criteria was made clear. 26. To convey the content of the curriculum, documents have been posted and activities requested on these documents. 27. To convey the content of the curriculum, mostly online video classes have been used, with little or no interaction from the students. 28. Students have been asked to participate in the curriculum process (preparing materials, sharing resources, etc.). Reviewing the responses (Table 3), one can see a greater variability than in previous items.
Nevertheless, we can observe two items (No. 26 and 23) where there is a higher frequency of response in the upper part of the scale. That is to say that the online sessions respect the timetables of the face-to-face sessions, facilitating no overlapping periods online between subjects and that these sessions also consisted of conveying the content of the curriculum, through online video classes with little or no interaction with the students. On the contrary, we observed that several items (No. 21, 22, and 28) had a greater tendency towards the lower end of the response scale. This puts into evidence the students’ opinion that the organization of online teaching was not clear from the first moment: tasks to be carried out, form of delivery, delivery periods, evaluation activities. In addition, the workload was not adjusted to the time established to do it and the students have not been asked to participate in the curriculum process (preparing materials, sharing resources, etc.).
Contrasting the mean values of these items (Figure 3), which range between 1.58 and 2.85 points, finding highly significant differences between them, with p < 0.001 (Friedman: value = 1072.22; p-value = 0.000000; large effect size: R2 = 0.171).
This leads to the verification that the students conclusively state that the on-line teaching which was carried out focused primarily on conveying the content of the curriculum by the professor through video conferences, and therefore promoting a passive attitude of the student body.
Digital skills: This dimension has been defined with 3 items on a Likert scale: 29. I have skills using ICT tools and that has made it easier for me to follow through with online work. 30. I need to find out or ask for help to be able to technologically solve some of the activities to be carried out: videos, PowerPoint, etc. 31. I have received training to teach online and to use the tools we have used.
Item 29 is formulated in a direct sense (more response value = greater digital competence/skills), while items 30 and 31 (Table 4) must be recoded in reverse so that a higher value corresponds to greater digital competence/skills. 7. The results are all concentrated in the high values that imply a greater degree of digital competence (around 3 points out of 4) and is corroborated when the same students state that they have not needed to ask for help to solve technological issues or have had to receive specific training to be able to cope with the online instruction that was developed, and the use of the technological tools used.
Emotional state: This dimension is made up of 8 items (
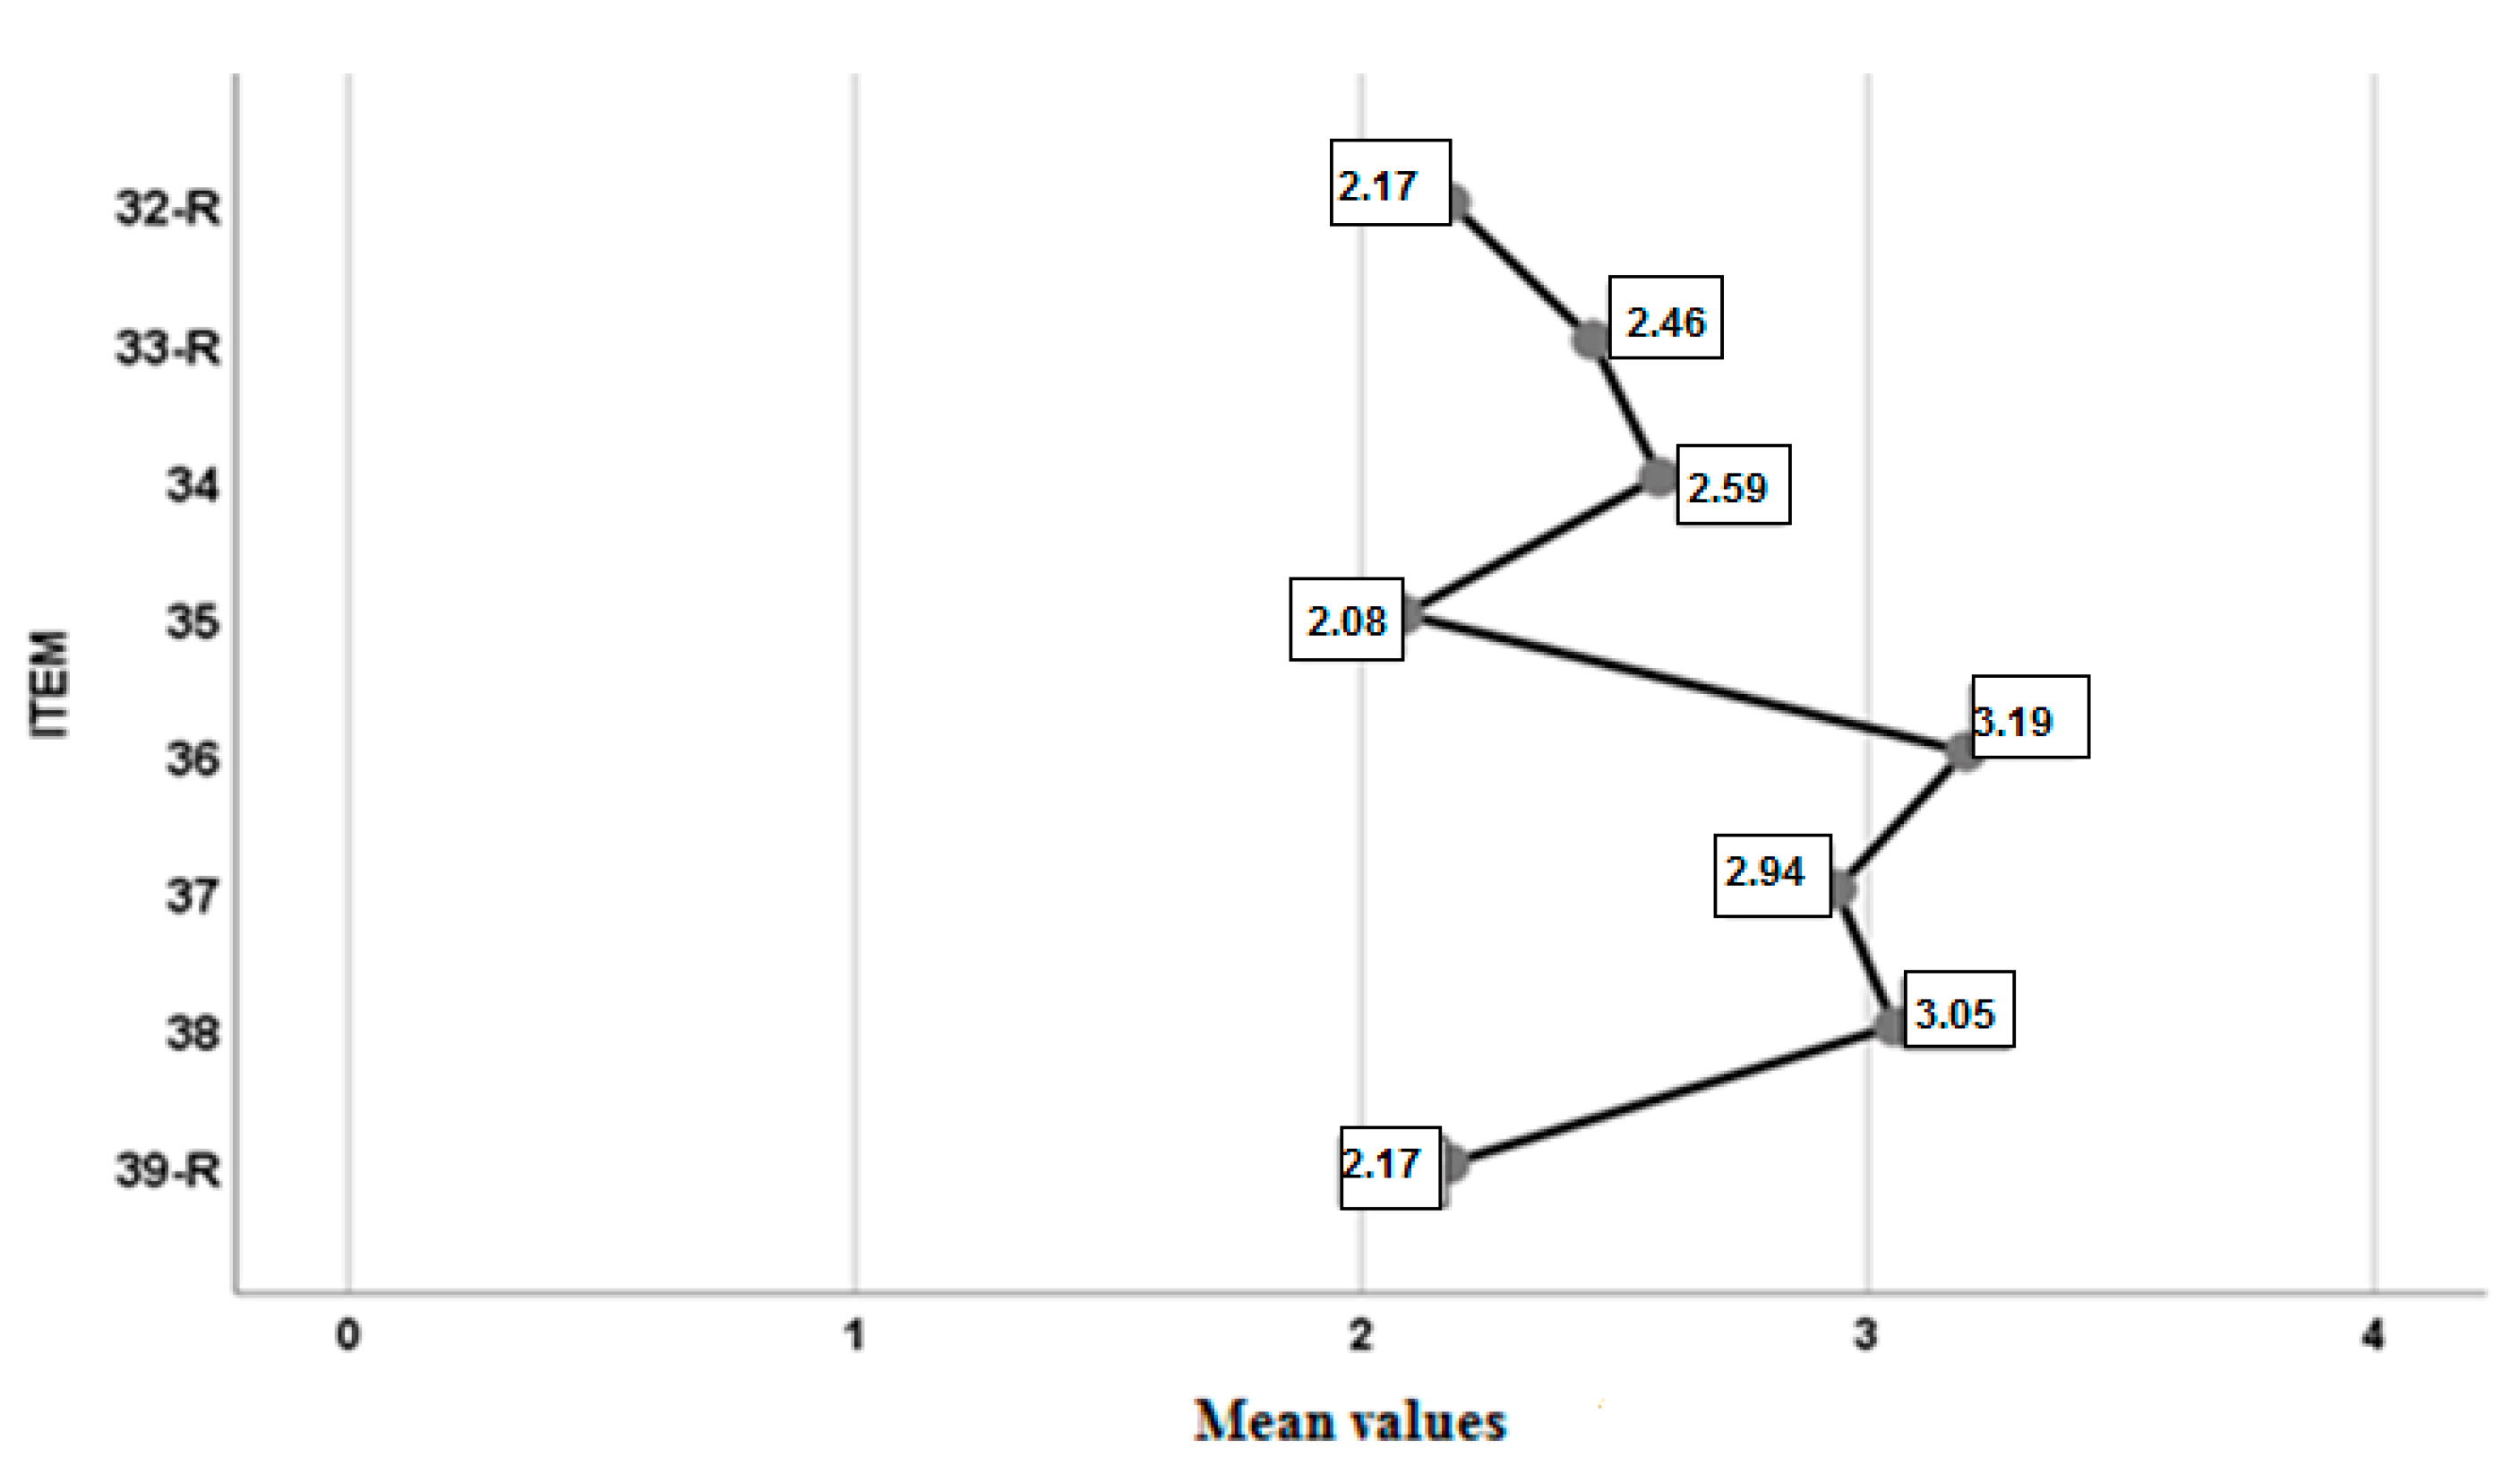
Table 5), those of which maintain the previous Likert format: 32. The professors were attentive to the emotional state of the students as well as took a constant interest in their students. 33. The professors have adapted the tasks to be carried out while considering the emotional state of the students during confinement. 34. In the confinement situation, the changeover to online instruction has given me an additional state of anxiety. 35. I have always felt willing to do what the professors have sent me and without having the possibility of contributing anything or interacting. 36. During this confinement I have felt uneasy and concerned about the situation. 37. [I am] feeling down and sad about the situation. 38. [I have] anxiety and a desire to end the confinement. 39 [I] accept what happens in a calm state. Item 39 has an inverse statement to the previous ones and therefore has been recoded in reverse, expressing a higher score represents a worse emotional state with more type symptoms: restlessness, dejection, anxiety, uneasiness, etc. Items 32 and 33 were inversely related to all the others and, and reviewing their statements, it was observed to be convenient to recode them in reverse as well. Therefore, calling attention to the answers of the respondents where they underline that their emotional state was one of concern about the situation as well as anxiety with wishes that the confinement would end. The data also indicates that the professors have not always been attentive to the emotional state of their students and have not taken this situation into account by adapting their academic tasks.
By contrasting the mean values of the participants who had responded to all the items in this dimension (N = 870; Figure 4) and whose values ranged between 2.08 and 3.19 points; the differences observed between these items are highly significant with p < 0.001 (Friedman: value = 1153.84; p-value = 0.000000; large effect size: R2 = 0.156). It mainly highlights that the emotional state experienced in these months of confinement is restlessness and concern about the situation, with anxiety, dejection and sadness, and hoping that the confinement will come to an end as soon as possible.
Professors have not taken this situation into account when adjusting virtual tasks and this has added to levels of anxiety to the radical change in the way of receiving instruction, which is now online.
Interactions: With 6 items on a Likert scale which are: 40. The professor has always been attentive to answering and giving directions. 41. The professor answered the queries quickly (approximately, no more than 24–48 h to do so). 42. The professors have encouraged proactive and positive interactions in the different online meetings: video classes, emails, forums…. 43. I have participated actively because I felt that my contributions were considered. 44. We have worked as a team and we have interacted with each other. 45. Most of the activities proposed were individual and we have only interacted with the professor in the case of a doubt and to turn in the activities. The last item has a negative relationship with the rest, which implies that its statement generates inverse responses to the rest. For this reason, it has been recoded in the opposite direction, with the intention that all the items can be interpreted in such a way that, the higher the value, the higher the degree of interaction. The description of the responses (Table 6) in almost all the items places the group in the lower middle zone, which is therefore an indicator of the degrees of medium-low interaction. In this sense, one item stands out (No. 43: active participation) with more responses in the two lowest values. This is followed by another item (No. 45 inverted) with a trend in the same sense as the previous one and that implies a lesser degree of agreement with the statement raised by that item.
That is to say, the students have stated that most of the activities proposed were individual and that the interactions they had with the professors were to clarify doubts or to deliver activities. They have not felt challenged to participate actively since they did not believe that their contributions were considered by the professors.
Perceived quality: lastly, this block is made up of 4 items with the usual Likert response (0–4), whose degree of reliability is very high (0.863). 46. Evaluate the online instruction that you have done during confinement. 47. Evaluate the attention of the professor with online instruction. 48.Evaluate the quality of the activities and the time it takes to do them. 49. Evaluate the tools and resources that have been used.
The description (Table 7) places the group of participants in the middle area of the scale. One item has stood out (No. 48: quality of activities and time) with a worse evaluation than the others, as more responses are concentrated in the lower values of the scale. This leads us to the conclusion that the quality of teaching has been met with approval, but only minimally, and what students most negatively valued is the quality of the activities proposed and the inadequate time frame in which to carry them out.

4.2. Differential Analysis

The mean values of the different items are contrasted (using non-parametric tests) based on three possible differential factors (Table 8): Sex, Academic course level and Age. We will only present those items where there are significant differences (p < 0.05) and at the same time considering the R2 effect analysis if it is low (<2%) or very low (<1%).
The female population of the study have demonstrated more restlessness and have been more worried about the situation, experiencing feelings of anxiety, sadness, and wanting to end the confinement. However, the male population have stated that they have not been able to contribute nor interact in the online instruction. Nevertheless, it can also be observed that in these cases the R2 effect in the gender variable for these items is low, that is, there is not much difference between genders.
In the case of the levels of education variable, we have significant differences in the items that appear in Table 9, although it must also be stated that R2 is low.
It should be noted that the students of the last course in undergraduate studies and of the master’s and doctorate courses (second stage of tertiary education) stated that the tasks, forms of delivery, periods, and evaluation activities were made clear from the first moment, and in summary, the workload to be carried out in teaching online was adjusted to the established time, in contrast to the students of lower courses.
The students of the first stage of tertiary education affirm that they have had to interact in groups and state that the interactions with the professors have been scarce except for doubts and delivery of individual activities.
And finally, and by age, only significant differences appear with an H value of 54.44 and an R2 of 0.073 in relation to item 21 in favor of students with an age ≥31 years that we can extend to ages 26–30. These coincide with the master and doctorate studies which already have contrasting information stating that the organization of online instruction was clear from the first moment: tasks to be carried out, delivery method, delivery periods, and evaluation activities.

5. Discussion

The ongoing COVID-19 health crisis and, consequently, confinement, has been an opportunity to experiment with other teaching and learning systems. However, the results of the study show that it is necessary to continue to advance forward in how to improve class sessions mediated by digital technologies and resources. Our study agrees with [42] as most students are not satisfied with this learning experience. Obstacles such as online content design were identified. Little interaction was also observed in the requirements, forms, and delivery periods of the activities. The effects of the pandemic on mental health and emotional support for younger university students have not been considered by the teaching staff. Like the study of [43], this has not been taken into account when adjusting the activities in the new formats. In the field of education, and more specifically higher education, we should discuss whether we consider only the student body as an agent that receives the service produced by the teaching staff, or if the latter should also be considered as a receiver, since the professor is also immersed in a broader system. It is evident that the student body is a key agent in the teaching-learning process; in fact, the new scenarios are based on a participative learning and teaching model–flipped learning (either face-to-face or virtual). However, the results coincide with the study [44] which indicates that students in postgraduate courses have a greater educational path and a greater capacity to carry out a more autonomous study than the younger students in the first stages of the University.
The results have shown that methodological limitations exist in teaching, [45]. From this perspective, we consider it necessary to continue promoting different methodological strategies that allow the development of competencies aimed at the autonomy of the student body on the one hand, and the use of techniques for planning and design in the virtual field on the other [15]. We refer to flipped learning as an example [44], learning by doing, learning by interacting, learning by searching, learning by sharing, collaborative learning, and other flexible training models [46].
The key takeaways from the results of the study are the idea of minimizing instruction and generating educational environments where the autonomous and creative thinking of the student is enhanced. The change of the teaching role is necessary; one must take on the role of guide, mediator and advisor in order to create spaces and opportunities for the student to promote autonomous, critical and reflective learning.
Students have brought to light the need for a true methodological transformation. As a result, it is necessary to start with digital, as well as pedagogical, competency training of the teaching staff with a redefinition of the subjects which will grant flexibility when faced with a possible scenario of switching from a face-to-face learning to a mixed one (hybrid) or to a completely online scenario, and, in addition, will allow for a continuous evaluation of the student body [47,48,49].
In definitive, organizing university teaching while considering the opinions of the students will allow for a better organization, communication and involvement of all people [50].

6. Conclusions

Regarding students, the main conclusion we draw is that although they show a more than an acceptable level of competence in the use of technological tools and the skills to handle them, there is a lack of autonomy as well as the capacity for self-regulation and self-reflection in order to carry out their tasks. This therefore shows a considerable level of dependence on the figure of the professor; this fact is more notable in the first-year students, reducing its incidence in the later stages of tertiary education. Regarding the teaching staff, the study leads us to conclude that the level of competence regarding the use of technological tools can be improved, not only in relation to the skills to apply them, but also in the need to understand that the development of virtual teaching also entails the need to develop and enhance the competence part linked to interaction and communication with students. A substantial model change in the teaching-learning process is necessary and must incorporate the use of other ways of relating to the learners, which should somehow be sufficient to compensate for the lack of a shared physical space with them. Online teaching implies didactic methodologies and planification that go beyond the transposition of the face-to-face class and transmitter of knowledge, to cyberspace.
It would be a serious mistake to fall into this trend, as it would run the risk of wasting the opportunity to advance towards new training models, and, on the contrary, cause a significant qualitative setback in the field of university teaching.
The perspective coming from the students has demonstrated issues which need to be improved so that online teaching is of quality. With this study, the objective data has put forth evidence which helps to give us a clear understanding of what is really happening in university teaching. The confinement brought on as a result of the pandemic has been a tsunami of sorts, which has exposed the cracks in teaching.
It is time to act and implement teaching models that are flexible, that conform to a true competence training and where the student is the true protagonist, whether it is an online, face-to-face, or a hybrid model.
The present study may have limitations, such as considering all students as a whole, without differentiating degrees, courses, etc. but, indeed, what this study provides is key data on the perception of students about emergency teaching that arose before an emergency state, from which the lessons learned must be extracted in order to advance towards quality in teaching, where the student is jointly responsible for the teaching-learning process.

7. Patents

There are no patents resulting from this study.

Author Contributions

The contribution of all authors has been balanced in all phases of the development of this study, both in the empirical part (creation and validation of the instrument, data collection and analysis) and in the writing part of this manuscript and of its various parts. Even the writing of the discussion and the conclusions have been produced from a debate among the contributors of the work, which has allowed for enriching the arguments based on the different opinions. All authors have read and agreed to the published version of the manuscript.

Funding

This study has been subsidized by the DOTS University Chair (Chair for the Development of Healthy and Sustainable Organizations and Territories), approved by agreement No. 193/2017 of the Governing Council of the University of Lleida on 19 July 2017.

Institutional Review Board Statement

Ethical review and approval were waived for this study, due to not involving personally identifiable nor sensitive data.

Informed Consent Statement

Student consent was waived due to not involving personally identifiable nor sensitive data.

Data Availability Statement

The data presented in this study are available on request from the corresponding author. The data are not publicly available due to the conditions of the project contract with the funder: DOTS University Chair (Chair for the Development of Healthy and Sustainable Organizations and Territories).

Conflicts of Interest

The authors declare no conflict of interest.

References

  1. Organización Mundial de la Salud. Coronavirus Disease 2019 (COVID-19). 2020. Available online: https://apps.who.int/iris/bitstream/handle/10665/331475/nCoVsitrep11Mar2020-eng.pdf (accessed on 10 September 2020).
  2. Zapata-Ros, M. Calidad en enseñanza abierta online universitaria: Del aula virtual al MOOC. Campus Virtuales 2015, 2, 86–107. [Google Scholar]
  3. Ali, M.I.; Gatiti, P. The COVID-19 (Coronavirus) Pandemic: Reflections on the Rols of Librarians and Information Professionals. Health Inf. Libr. J. 2020, 37, 158–162. [Google Scholar] [CrossRef] [PubMed] [Green Version]
  4. Peyravi, M.; Ahmadi, M.M.; Shamspour, N.; Soltani, A. Public Education and Electronic Awareness of the New Coronavirus (COVID-19): Experiències from Iran. Disaster Med. Public Health Prep. 2020, 14, e5–e6. [Google Scholar] [CrossRef] [PubMed] [Green Version]
  5. Sahu, P. Closure of Universities Due to Coronavirus Disease 2019 (COVID-19). Impact on Education and Mental Health of Students and Academic Staff. Cureus 2020, 12, e7541. Available online: https://assets.cureus.com/uploads/review_article/pdf/30110/1586023338-20200404-31941-udrn9q.pdf (accessed on 21 September 2020).
  6. Arteaga, C.; Enriquez, N.; Chuquimia, J.L. Desafiaments metodològics en l’educació virtual: Aproximació a les complexitats de l’ensenyament virtual i el rescat del valor contacte social. Fides Ratio Rev. Difusió Cult. Científica Univ. Salle Bolívia 2015, 10, 99–114. [Google Scholar]
  7. Red Vives de Universidades. Via Universitària: Accés, Condicions D’aprenentatge, Expectatives i Retorns dels Estudis Universitaris (2017–2019); Xarxa Vives d’Universitats: Barcelona, Spain, 2019. [Google Scholar]
  8. Sanaa, A. How technology has shaped university students’ perceptions and expectations around higher education: An exploratory study of the United Arab Emirates. Stud. High. Educ. 2019, 45, 2513–2525. [Google Scholar] [CrossRef]
  9. Jiménez, A.G.; Pascual, A.G. Internet y África: De la brecha a la esperanza digital. Redes Lib. Comun. 2013, 3, 113–131. [Google Scholar]
  10. Sánchez, M.D.; Añorve, J.R.; Alarcón, G.G. Les TIC a la educació superior, innovacions i reptes/The ICT in higher education, innovations and challenges. RICSH Rev. Iberoam. Ciències Soc. Hum. 2017, 6, 299–316. [Google Scholar]
  11. Betz, C.L. COVID-19 and school return: The need and necessity. J. Pediatr. Nurs. 2020, 54, A7–A9. [Google Scholar] [CrossRef]
  12. Wade, M.; Prime, H.; Browne, D.T. Why we need longitudinal mental health research with children and youth during (and after) the COVID-19 pandemic. Psychiatry Res. 2020, 290, 113143. [Google Scholar] [CrossRef]
  13. Artino, A.R. Motivational beliefs and perceptions of instructional quality: Predicting satisfaction with online training. J. Comput. Assist. Learn. 2008, 24, 260–270. [Google Scholar] [CrossRef]
  14. Zapata-Ros, M. Evaluación de competencias en entornos virtuales de aprendizaje y docencia universitaria. RED Rev. Educ. Distancia 2010, 1, 1–34. [Google Scholar]
  15. Pomares, J.; Gómez, G.J.G.; Lorenzo, G.; Lledó, A.; Roig-Vila, R. Gestión de Calidad, Autoaprendizaje y Docencia Virtual en el Máster Universitario en Automática y Robótica; Octaedro: Barcelona, Spain, 2017. [Google Scholar]
  16. Montes, R.; Rodríguez-Pina, G.; González, M.; & Gea, M. Enseñanza Online y Recursos de Aprendizaje Abiertos: Recomendaciones de Procedimientos Basados en Modelos de Calidad. 2018. Available online: https://cv.udl.cat/access/content/group/6f8ac44c-3a78-45ad-80bf-cc59cf49c838/Projecte%20COVID-19/Bibliografia/Montes_Rodriguez%20Pina_Gonzalez_Gea_2012.pdf (accessed on 30 October 2020).
  17. Hazim, J.A.; Rodríguez, J.P.F.; Estrada, A.F. Estándares para evaluar la calidad de cursos virtuales en la Educación Superior. UCE Cienc. Rev. Postgrado 2019, 7, 1–8. [Google Scholar]
  18. Yarbro, J.; Arfstrom, K.M.; McKnight, K.; McKnight, P. Extension of a Review of Flipped Learning. Flipped Learning Network. 2014, pp. 2–17. Available online: https://flippedlear-ning.org/wp-content/uploads/2016/07/Extension-of-FLipped-Learning-LIt-Review-June-2014.pdf (accessed on 6 November 2020).
  19. Moraros, J.; Islam, A.; Yu, S.; Banow, R.; Schindelka, B. Flipping for success: Evaluating the effectiveness of a novel teaching approach in a graduate level setting. BMC Med. Educ. 2015, 15, 1–10. [Google Scholar] [CrossRef] [PubMed] [Green Version]
  20. Del Arco, I.; Flores, O.; Silva, P. El desarrollo del modelo flipped classroom en la universidad: Impacto de su implementación desde la voz del estudiantado. Rev. Investig. Educ. 2019, 37, 451–469. [Google Scholar] [CrossRef]
  21. Fernández-Regueira, U.; Gewerc, A.; Llamas-nistal, M. El profesorado universitario de Galicia y la enseñanza remota de emergencia: Condiciones y contradicciones. Campus Virtuales 2020, 9, 9–24. [Google Scholar]
  22. Cabero-Almenara, J. Aprendiendo del tiempo de la COVID-19. Rev. Electrónica Educ. 2020, 24, 1–3. [Google Scholar] [CrossRef]
  23. Vázquez-Cano, E.; Urrutia, M.L.; Parra-González, M.E.; Meneses, E.L. Analysis of Interpersonal Competences in the Use of ICT in the Spanish University Context. Sustainability 2020, 12, 476. [Google Scholar] [CrossRef] [Green Version]
  24. OCDE. TALIS 2018 Results (Volume I): Teachers and School Leaders as Lifelong Learners; OECD Publishing: Paris, France, 2019. [Google Scholar] [CrossRef]
  25. Samaniego, G.; Marqués, L.; Gisbert, M. El profesorado universitario y el uso de Entornos Virtuales de aprendizaje. Campus Virtuales 2015, 4, 50–58. [Google Scholar]
  26. Maor, D.; Currie, J.K. The use of technology in postgraduate supervisión pedagogy in two Australian universities. Int. J. Educ. Technol. High. Educ. 2017, 14, 1. [Google Scholar] [CrossRef] [Green Version]
  27. Guri-Rosenblit, S. La enseñanza electrónica (e-teaching) en la educación superior: Un prerrequisito esencial para el aprendizaje electrónico (e-learning). J. New Approaches Educ. Res. 2018, 7, 100–105. [Google Scholar] [CrossRef] [Green Version]
  28. Cabero-Almenara, J. Formación del profesorado universitario en TIC. Aplicación del método Delphi para la selección de los contenidos formativos. Educación XX1 2014, 17, 111–132. [Google Scholar] [CrossRef] [Green Version]
  29. Cabero-Almenara, J.; Barroso, J. ICT teacher training: A view of the TPACK model/Formación del profesorado en TIC: Una visión del modelo TPACK. Cult. Educ. 2016, 28, 633–663. [Google Scholar] [CrossRef]
  30. Pinto, A.; Cortés, O.; Alfaro, C. Hacia la transformación de la práctica docente: Modelo espiral de competencias TIC TAC TEP. Pixel-Bit. Rev. Medios Educ. 2017, 51, 37–51. [Google Scholar] [CrossRef] [Green Version]
  31. Comisión Europea. Digital Education Action Plan. 2021–2027: Resetting Education and Training for the Digital Age. European Union. 2020. Available online: https://ec.europa.eu/education/sites/education/files/document-library-docs/deapcommunication-sept2020_en.pdf (accessed on 27 November 2020).
  32. Muñoz, L.V.A.; Cárdenas-Rodríguez, R.; Caro, T.T. Introducción: Innovación docente en el ámbito de la Universidad. Rev. Humanid. 2017, 31, 11–15. [Google Scholar] [CrossRef] [Green Version]
  33. Prendes, M.P.; Sánchez, F.M.; Porlán, I.G. Competencia digital: Una necesidad del profesorado universitario en el siglo XXI. RED Rev. Educ. Distancia 2017, 56, 1–22. Available online: http://www.um.es/ead/red/56/prendes_et_al.pdf (accessed on 28 November 2020). [CrossRef]
  34. Pérez-López, E.; Atochero, A.V.; Rivero, S.C. Educación a distancia en tiempos de COVID-19: Análisis desde la perspectiva de los estudiantes universitarios. RIED Rev. Iberoam. Educ. Distancia 2021, 24, 331–350. [Google Scholar] [CrossRef]
  35. Fernández, A.; Paricio, J.; Ibarra-Sáiz, M.S.; Rodríguez-Gómez, G. No es cuestión de medios, sino de modelo. Escenarios de reducción de la presencialidad. In REDU 2020 Red Estatal de Docencia Universitaria; REDU: Zaragoza, Spain, 2020. [Google Scholar]
  36. UNESCO. COVID-19 y Educación Superior: De los Efectos Inmediatos al día Después. UNESCO-IESALC. 2020. Available online: http://www.iesalc.unesco.org/wp-content/uploads/2020/05/COVID-19-ES-130520.pdf (accessed on 27 November 2020).
  37. La Velle, L.; Newman, S.; Montgomery, C.; Hyatt, D. Initial teacher education in England and the Covid-19 pandemic: Challenges and opportunities. J. Educ. Teach. 2020, 46, 596–608. [Google Scholar] [CrossRef]
  38. Domínguez, M.; Rodríguez, N. Adaptación exprés a la actividad pedagógica no presencial durante la pandemia. In Proceedings of the 4th International Virtual Conference on Educational Research and Innovation, Madrid, Spain, 23–24 April 2020; pp. 665–666. [Google Scholar]
  39. Alvarez-Alvarez, C.; García-Prieto, F.J. Brecha digital y nuevas formas académicas en la escuela rural española durante el confinamiento. Educar 2021. en prensa. [Google Scholar] [CrossRef]
  40. García-Marcos, C.; López-Vargas, O.; Cabero-Almenara, J. Autorregulación del aprendizaje en la formación Profesional a distancia: Efectos de la gestión del tiempo. RED Rev. Educ. Distancia 2020, 62, 1–34. [Google Scholar] [CrossRef]
  41. Zapata-Ros, M. Calidad en entornos ubicuos de aprendizaje. Revista de Educación a Distancia (RED) 2012, 31, 1–12. [Google Scholar]
  42. Bataineh, K.B.; Atoum, M.S.; Alsmadi, L.A.; Shikhali, M. A Silver Lining of Coronavirus: Jordanian Universities Turn to Distance Education. Int. J. Inf. Commun. Technol. Educ. (Ijicte) 2020, 17, 1–11. [Google Scholar]
  43. Van Der Velden, P.G.; Contino, C.; Das, M.; Van Loo PBosmans, M.W. Anxiety and depression symptoms, and lack of emotional support among the general population before and during the COVID-19 pandemic. A prospective national study on prevalence and risk factors. J. Affect. Disord. 2020, 277, 540–548. [Google Scholar] [CrossRef] [PubMed]
  44. Flores, O.; Del Arco, I.; Silva, P. The flipped classroom model at the university: Analysis based on professors’ and students’ assessment in the educational field. Int. J. Educ. Technol. High. Educ. 2016, 13, 1–12. [Google Scholar] [CrossRef] [Green Version]
  45. Imbernón, F.; Silva, P.; Guzmán, C. Competencias en los procesos de enseñanza-aprendizaje virtual y semipresencial. Comunicar 2011, 18, 107–114. [Google Scholar]
  46. Flores, O.; Del Arco, I.; Silva, P. 5. Modelos Flexibles De Formación: Una Respuesta a las necesidades actuales. Docencia universitaria e innovación. In Docencia Universitaria e Innovación Evolución y Retos a Través de los CIDUI; Carrasco, S., de Corral, I., Eds.; Octaedro: Barcelona, Spain, 2019. [Google Scholar]
  47. García-Peñalvo, F.J.; Corell, A. La CoVId-19: ¿enzima de la transformación digital de la docencia o reflejo de una crisis metodológica y competencial en la educación superior? Campus Virtuales 2020, 9, 83–98. Available online: http://hdl.handle.net/10366/144140 (accessed on 27 November 2020).
  48. Cabero-Almenara, J.; Llorente-Cejudo, C. Covid-19: Transformación radical de la digitalización en las instituciones universitarias. Campus Virtuales 2020, 9, 25–34. [Google Scholar]
  49. Kulinski, H.P.; Cobo, C. Expandir la Universidad Más Allá de la Enseñanza Remota de Emergencia Ideas Hacia un Modelo Híbrido Post-Pandemia; Outliers School: Barcelona, Spain, 2020. [Google Scholar]
  50. Repo, P.; Matschoss, K. Social Innovation for Sustainability Challenges. Sustainability 2020, 12, 319. [Google Scholar] [CrossRef] [Green Version]
Figure 1. Line graph with mean. Technological devices, materials and resources used. N = 875. IBM SPSS Statistics 25 used for charts and graphs.
Sustainability 13 00375 g001
Figure 2. Line graph with mean. Teaching actions that have been used and/or are being used by the majority of professors and with what frequency. N = 827. IBM SPSS Statistics 25 used for charts and graphs.
Sustainability 13 00375 g002
Figure 3. Line graph with mean. Technological devices, materials and resources used. N = 874. IBM SPSS Statistics 25 used for charts and graphs.
Sustainability 13 00375 g003
Figure 4. Line graph with mean. Emotional state. N = 827. IBM SPSS Statistics 25 used for charts and graphs.
Sustainability 13 00375 g004
Table 1. Descriptive analysis. Items of technological devices, materials, and resources used. Reliability: (IC: 0.574–0.652).
N° Item N % Response (Answer)Descriptive Statistics
0 1 2 3 4 MeanMedianStandard Deviation (SD)
01 886 8.9 9.5 23.3 39.6 18.7 2.50 3.00 1.16
02 888 0.6 2.1 15.1 38.6 43.6 3.23 3.00 0.82
03 884 14.5 25.2 30.3 16.3 13.8 2.50 3.00 1.30
04 885 8.1 19.8 38.3 23.3 10.6 1.90 2.00 1.24
05 886 9.8 13.1 23.6 24.1 29.3 2.08 2.00 1.08
06 888 31.2 25.2 20.4 13.9 9.3 1.45 1.00 1.31
07 885 1.7 6.4 19.5 39.0 33.3 2.96 3.00 0.97
08 886 0.6 3.8 5.3 14.1 76.2 3.62 4.00 0.80
Table 2. Descriptive analysis. Teaching actions that have been used and/or are being used by the majority of professors and with what frequency. Reliability: 0.722 (IC: 0.694–0.750).
N° ItemN% Response (Answer)Descriptive Statistics
01234MeanMedianStandard Deviation
0987943.311.47.225.412.71.531.001.55
1087742.013.312.822.39.61.441.001.45
1188213.09.810.240.027.02.583.001.33
1287030.623.813.816.415.41.621.001.45
1387771.614.95.84.82.90.520.001.00
1487880.111.25.02.11.70.340.000.81
158738.68.112.728.641.92.873.001.28
1687019.99.110.927.133.02.443.001.51
1787615.623.425.324.211.41.922.001.25
1887855.019.69.510.45.60.920.001.25
198764.76.612.436.639.63.003.001.10
2087727.419.418.018.416.91.782.001.45
Table 3. Descriptive analysis. Items of subject planification. Reliability: 0.767 (IC: 0.743–0.790).
N° ItemN% Response (Answer)Descriptive Statistics
01234MeanMedianStandard Deviation
2189225.325.824.112.112.71.611.001.32
2289224.224.624.714.811.81.652.001.31
2388710.911.018.222.437.42.643.001.36
248909.815.224.426.124.62.413.001.28
2588613.420.022.325.818.42.162.001.31
268835.97.216.935.334.72.863.001.15
2789016.421.025.822.614.21.972.001.29
2888827.622.723.416.99.31.581.001.30
Table 4. Descriptive analysis. Items of subject planification. 7.
N° ItemN% Response (Answer)Descriptive Statistics
01234MeanMedianStandard Deviation
298912.24.619.928.345.03.093.001.01
30-R8936.013.911.518.749.82.923.001.31
31-R8875.46.014.816.257.63.154.001.20
Table 5. Descriptive analysis. Emotional state. Reliability: 0.770 (IC: 0.746–0.792).
N° ItemN% Response (Answer)Descriptive Statistics
01234MeanMedianStandard Deviation
32-R89110.919.926.227.315.82.172.001.23
33-R8938.614.825.924.326.42.453.001.26
3488912.811.814.726.034.62.583.001.39
358899.420.935.919.614.22.082.001.16
368863.65.811.425.853.43.204.001.08
378915.67.116.829.041.52.943.001.17
388824.46.916.123.549.13.063.001.15
39-R88810.917.625.533.712.42.192.001.19
Table 6. Descriptive analysis. Interactions Reliability: 0.737 (IC: 0.709–0.763).
N° ItemN% Response (Answer)Descriptive Statistics
01234MeanMedianStandard Deviation
408823.615.233.729.318.32.432.001.06
418807.415.725.831.619.52.403.001.18
428838.817.131.028.814.32.232.001.16
4388314.623.826.623.811.21.932.001.23
448779.710.615.827.136.72.713.001.32
45-R87918.316.022.426.716.52.072.001.35
Table 7. Descriptive analysis. Perceived quality. Reliability: 0.863 (IC: 0.848–0.877).
N° De ItemN% Response (Answer)Descriptive Statistics
01234MeanMedianStandard Deviation
468807.820.134.927.210.02.112.001.08
478797.315.136.527.513.52.252.001.10
4887914.027.529.217.611.61.852.001.21
498786.314.532.832.214.22.342.001.08
Table 8. Comparative inferential analysis. Differences in the items of the Questionnaire depending on the GENDER of the participants.
N° De ItemN/Mean (Standard Deviation)Test De Mann-WhitneyEffect Size R2
WomanManValue ZUp
357252.00 (1.16)1592.48 (1.08)4.76 **0.0000.025
377273.03 (1.13)1592.53 (1.25)5.09 **0.0000.028
387183.16 (1.07)1592.65 (1.36)4.42 **0.0000.030
** = Highly significative.
Table 9. Comparative inferential analysis. Differences in the items of the Questionnaire depending on the ACADEMIC COURSE LEVEL of the participants. Comparative inferential analysis.
N° De ItemN/Mean (Standard Deviation)Test de Kruskal-WEffect Size: R2
Year 1Year 2Year 3/4Master’s/DoctorateValue Hp
123351.92 (1.46)2091.43 (1.39)1551.06 (1.33)1671.80 (1.43)46.90 **0.0000.052
213451.43 (1.16)2141.28 (1.24)1591.86 (1.48)1702.15 (1.37)48.83 **0.0000.061
223451.42 (1.24)2141.50 (1.22)1591.68 (1.41)1702.28 (1.25)53.08 **0.0000.065
443393.17 (1.01)2092.68 (1.30)1572.01 (1.53)1682.49 (1.32)77.32 **0.0000.104
45-R3392.40 (1.21)2112.21 (1.20)1571.41 (1.48)1681.84 (1.40)61.75 **0.0000.075
** = Highly significative.
Publisher’s Note: MDPI stays neutral with regard to jurisdictional claims in published maps and institutional affiliations.

