Visual Comfort in Modern University Classrooms


Abstract
:1. Introduction
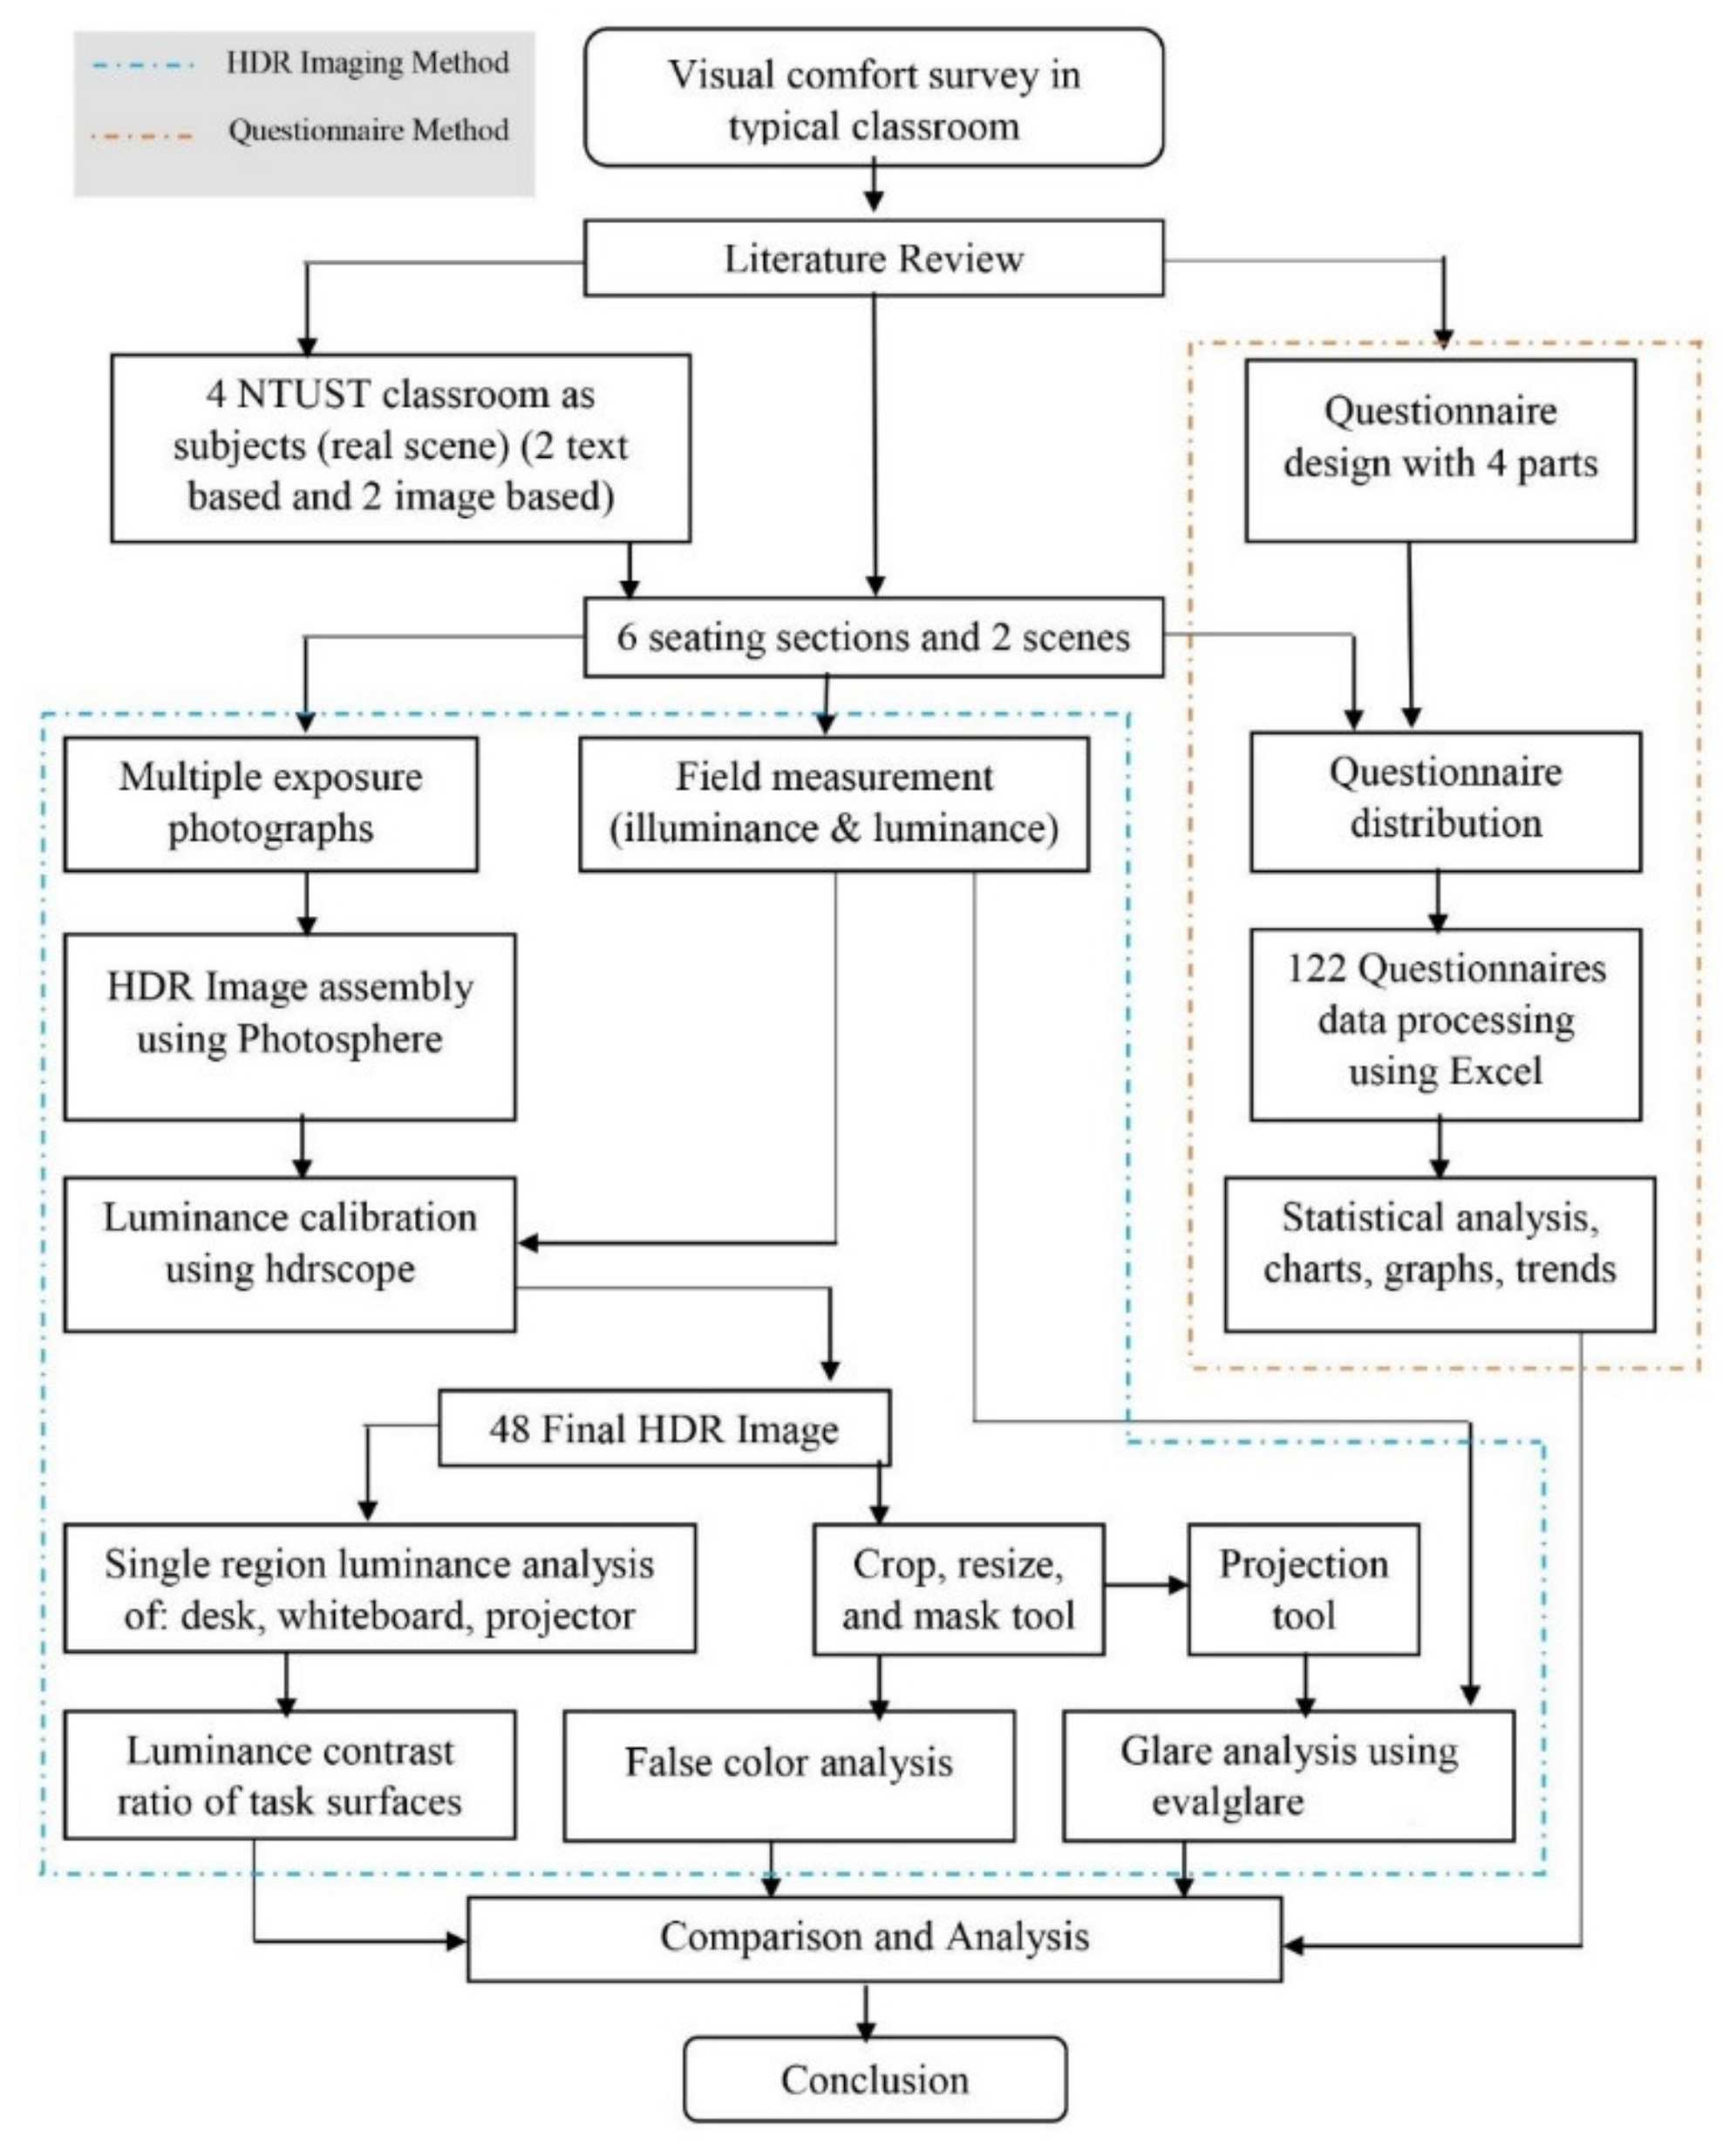
2. Methodology
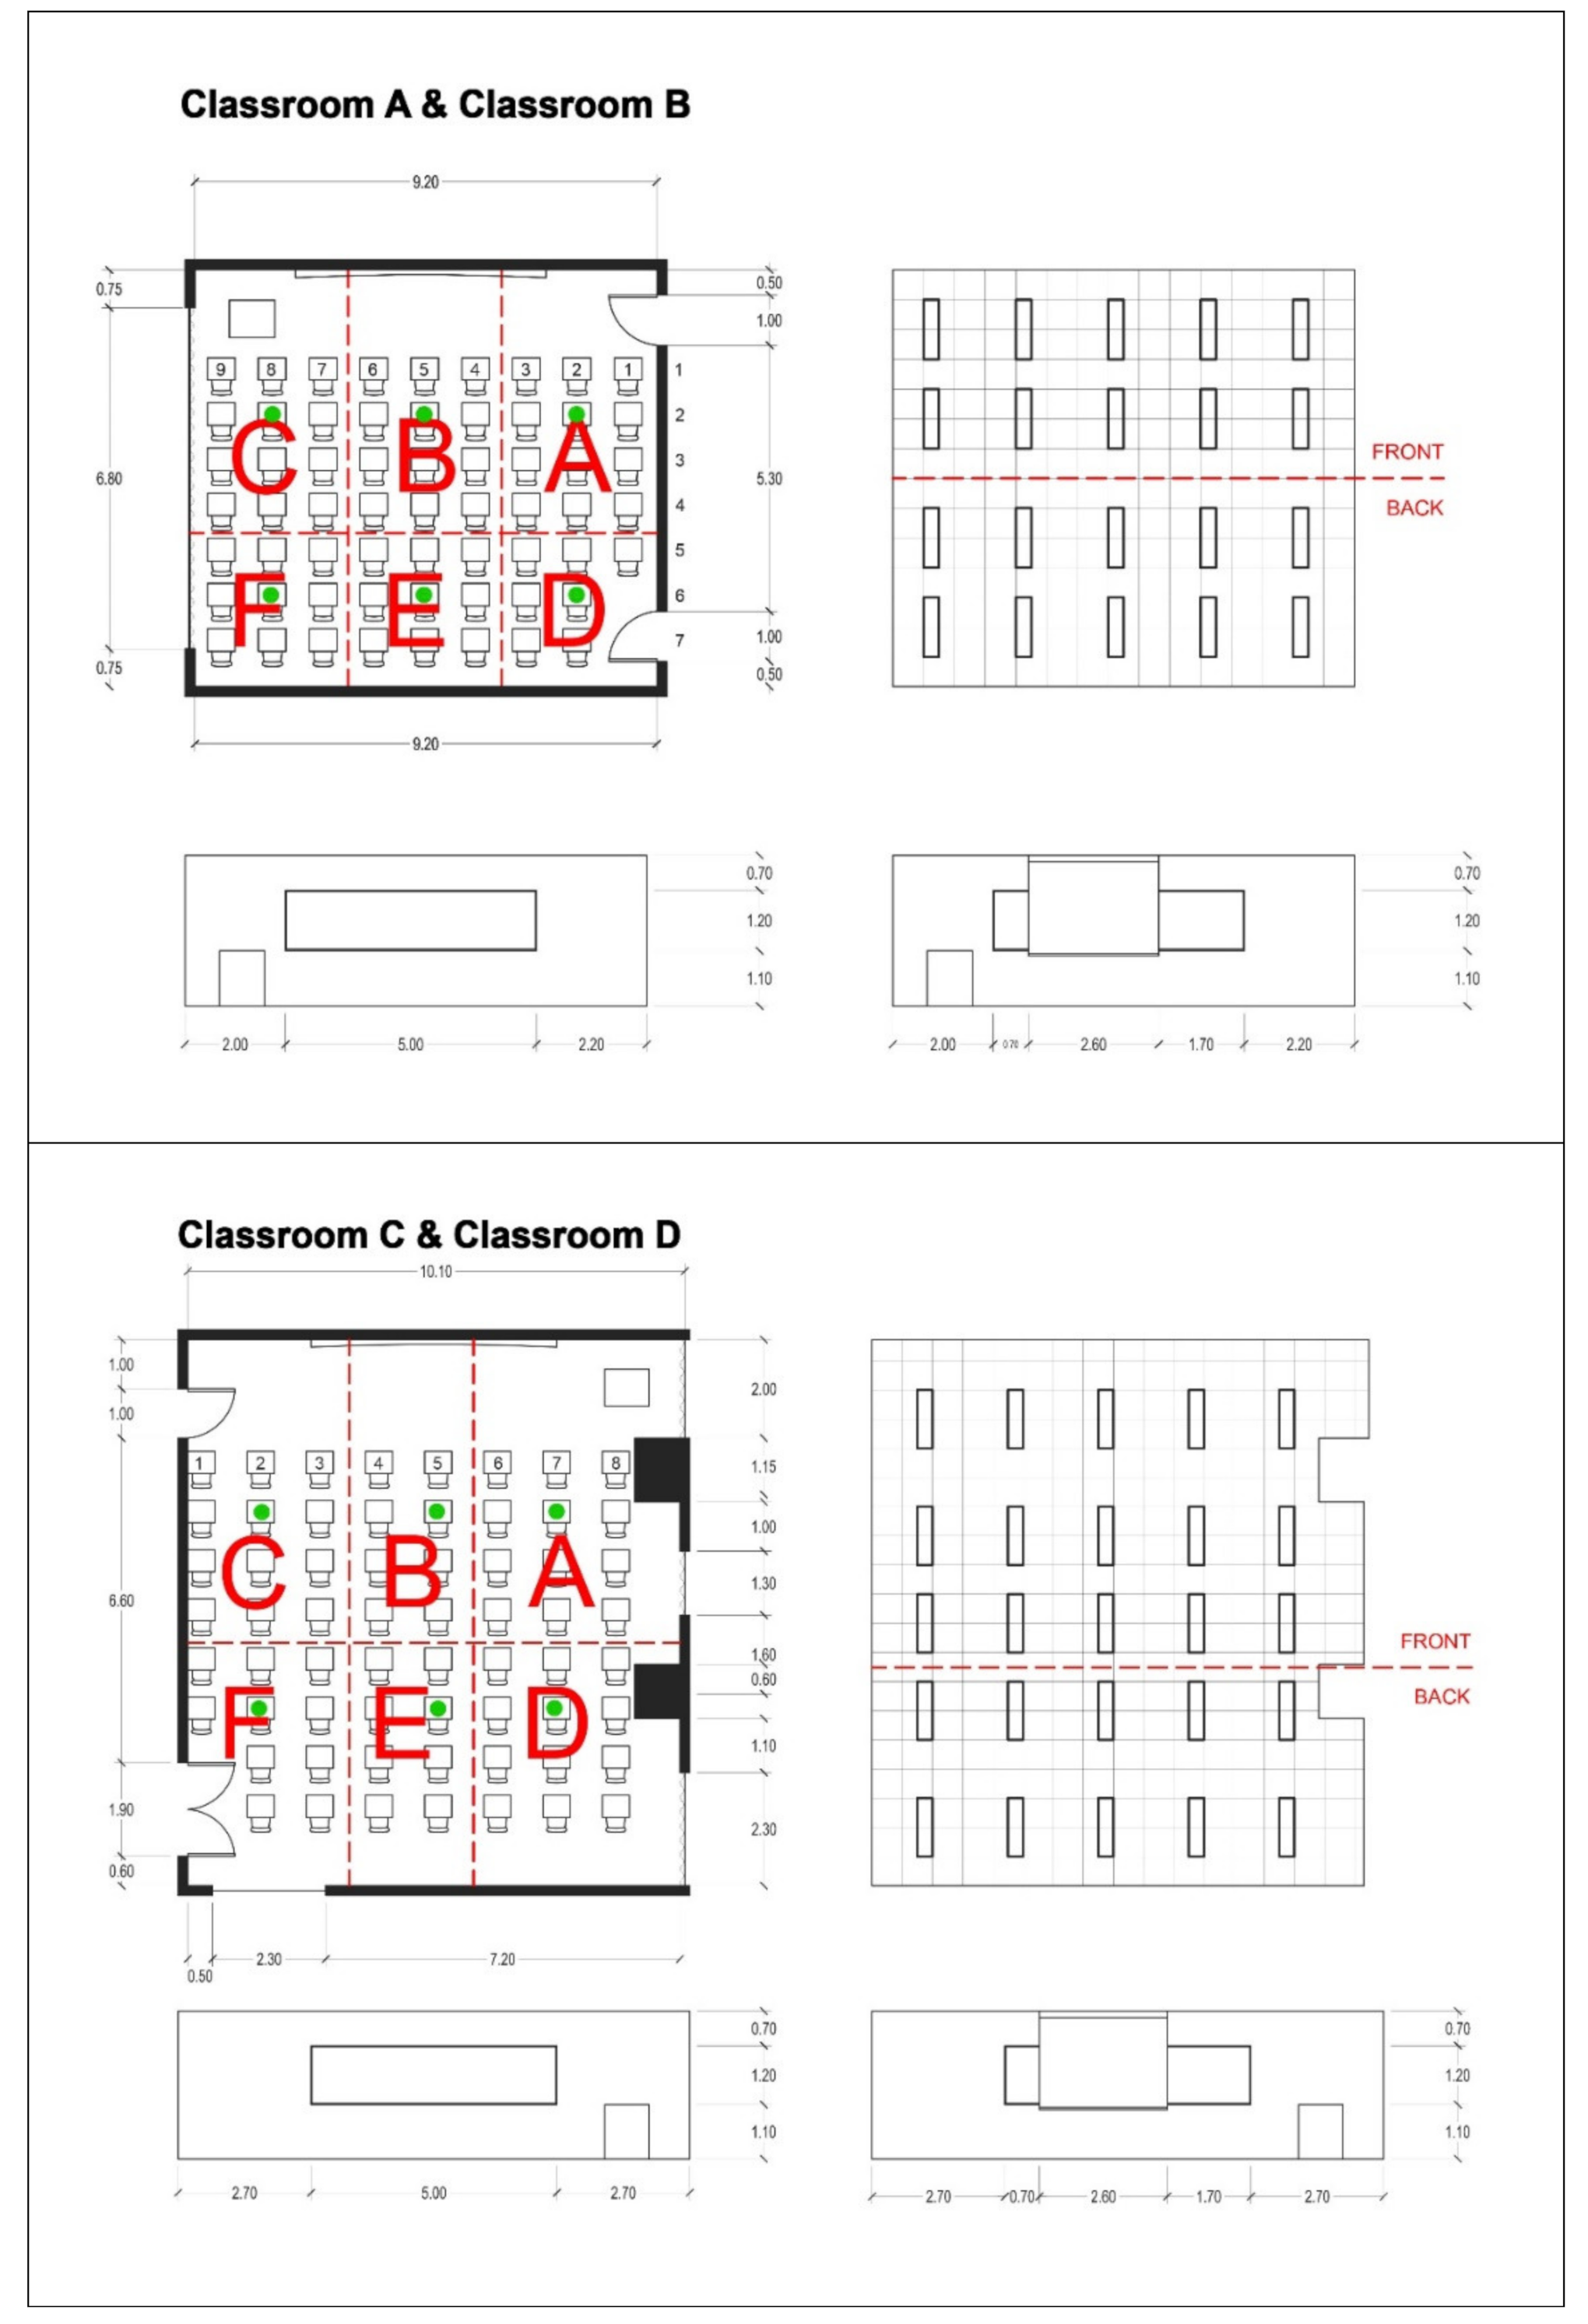
2.1. Subject Classroom
2.2. Questionnaire Survey
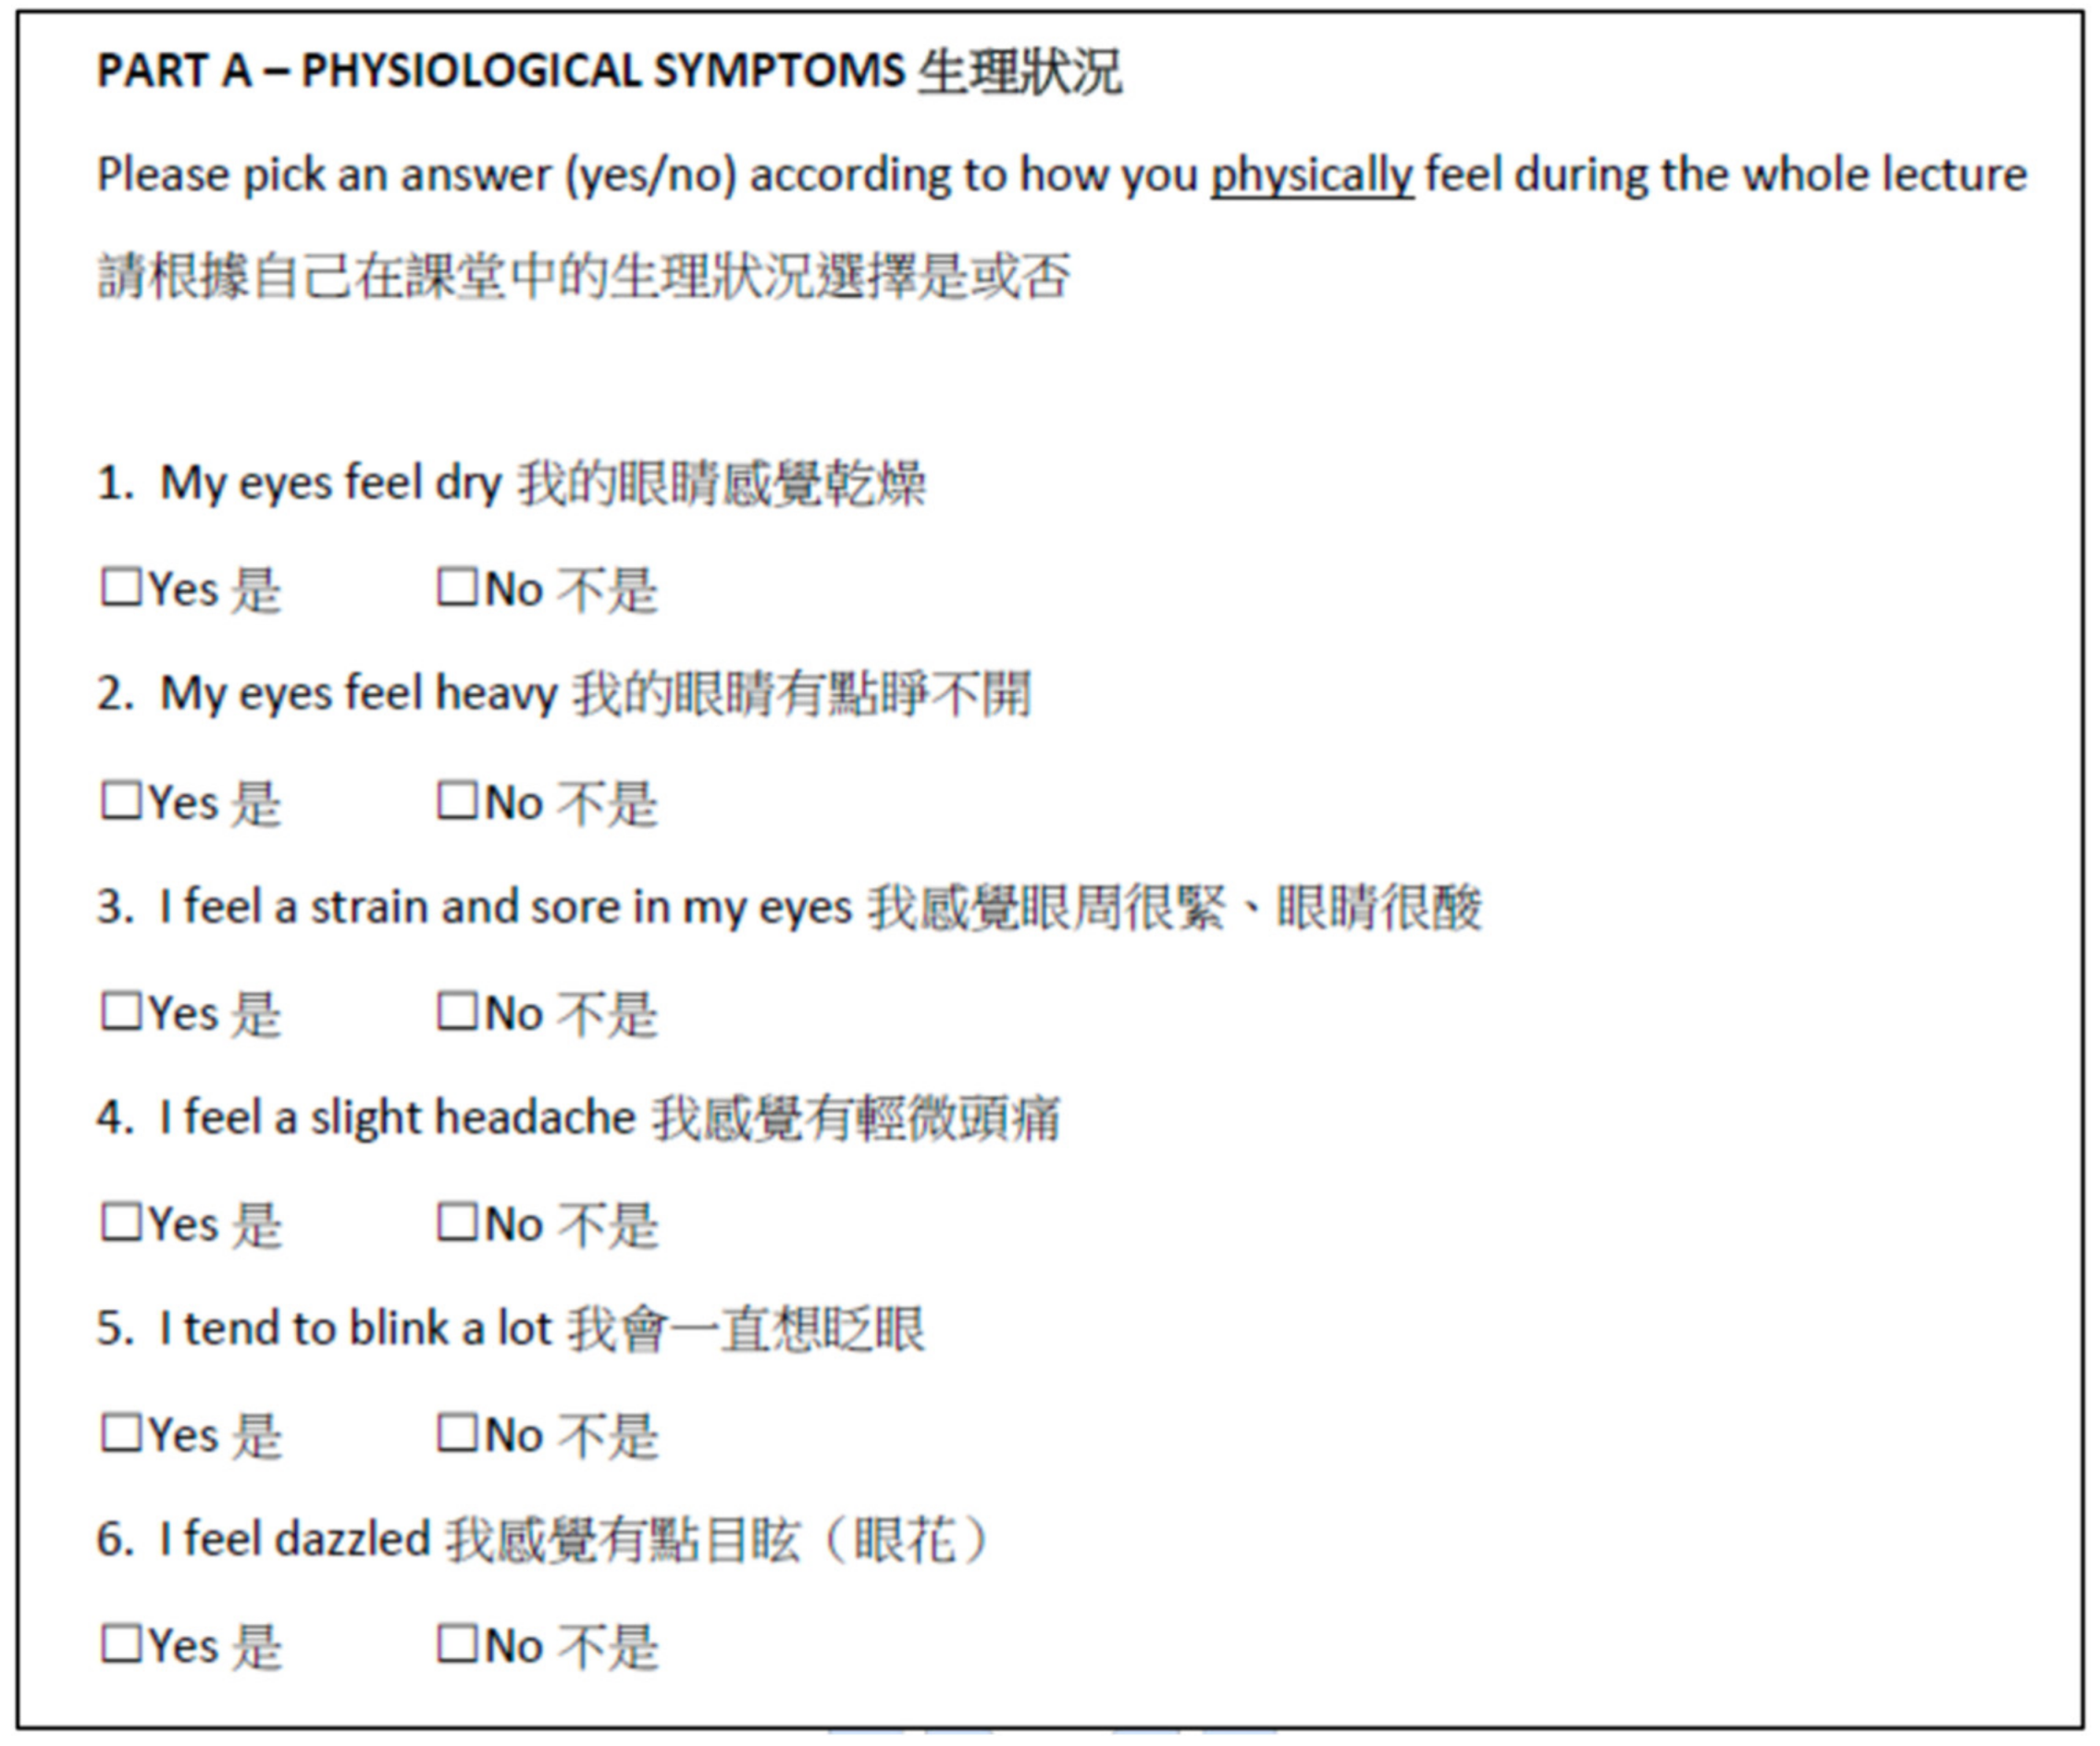
2.2.1. Physiological Symptoms
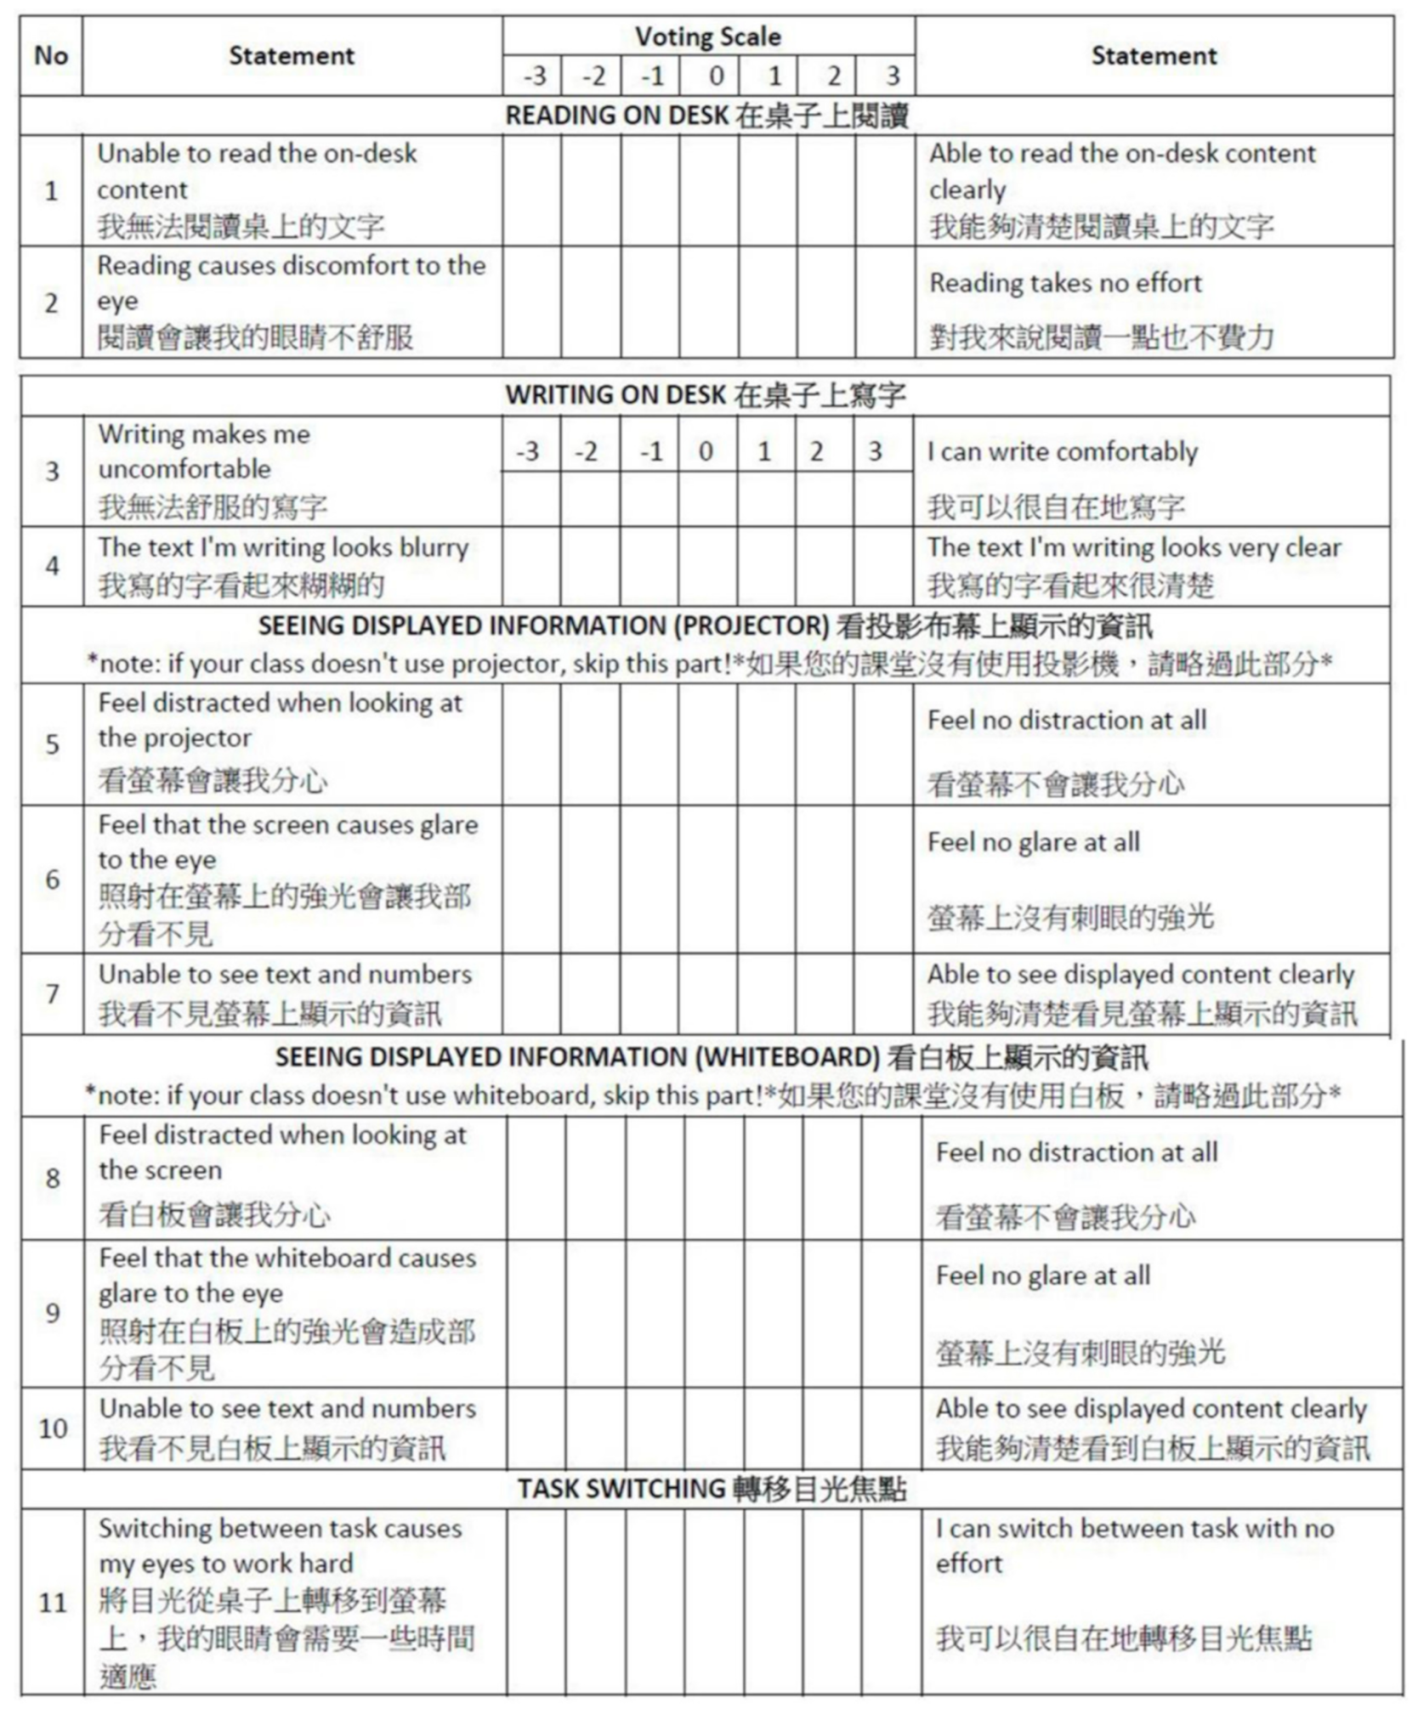
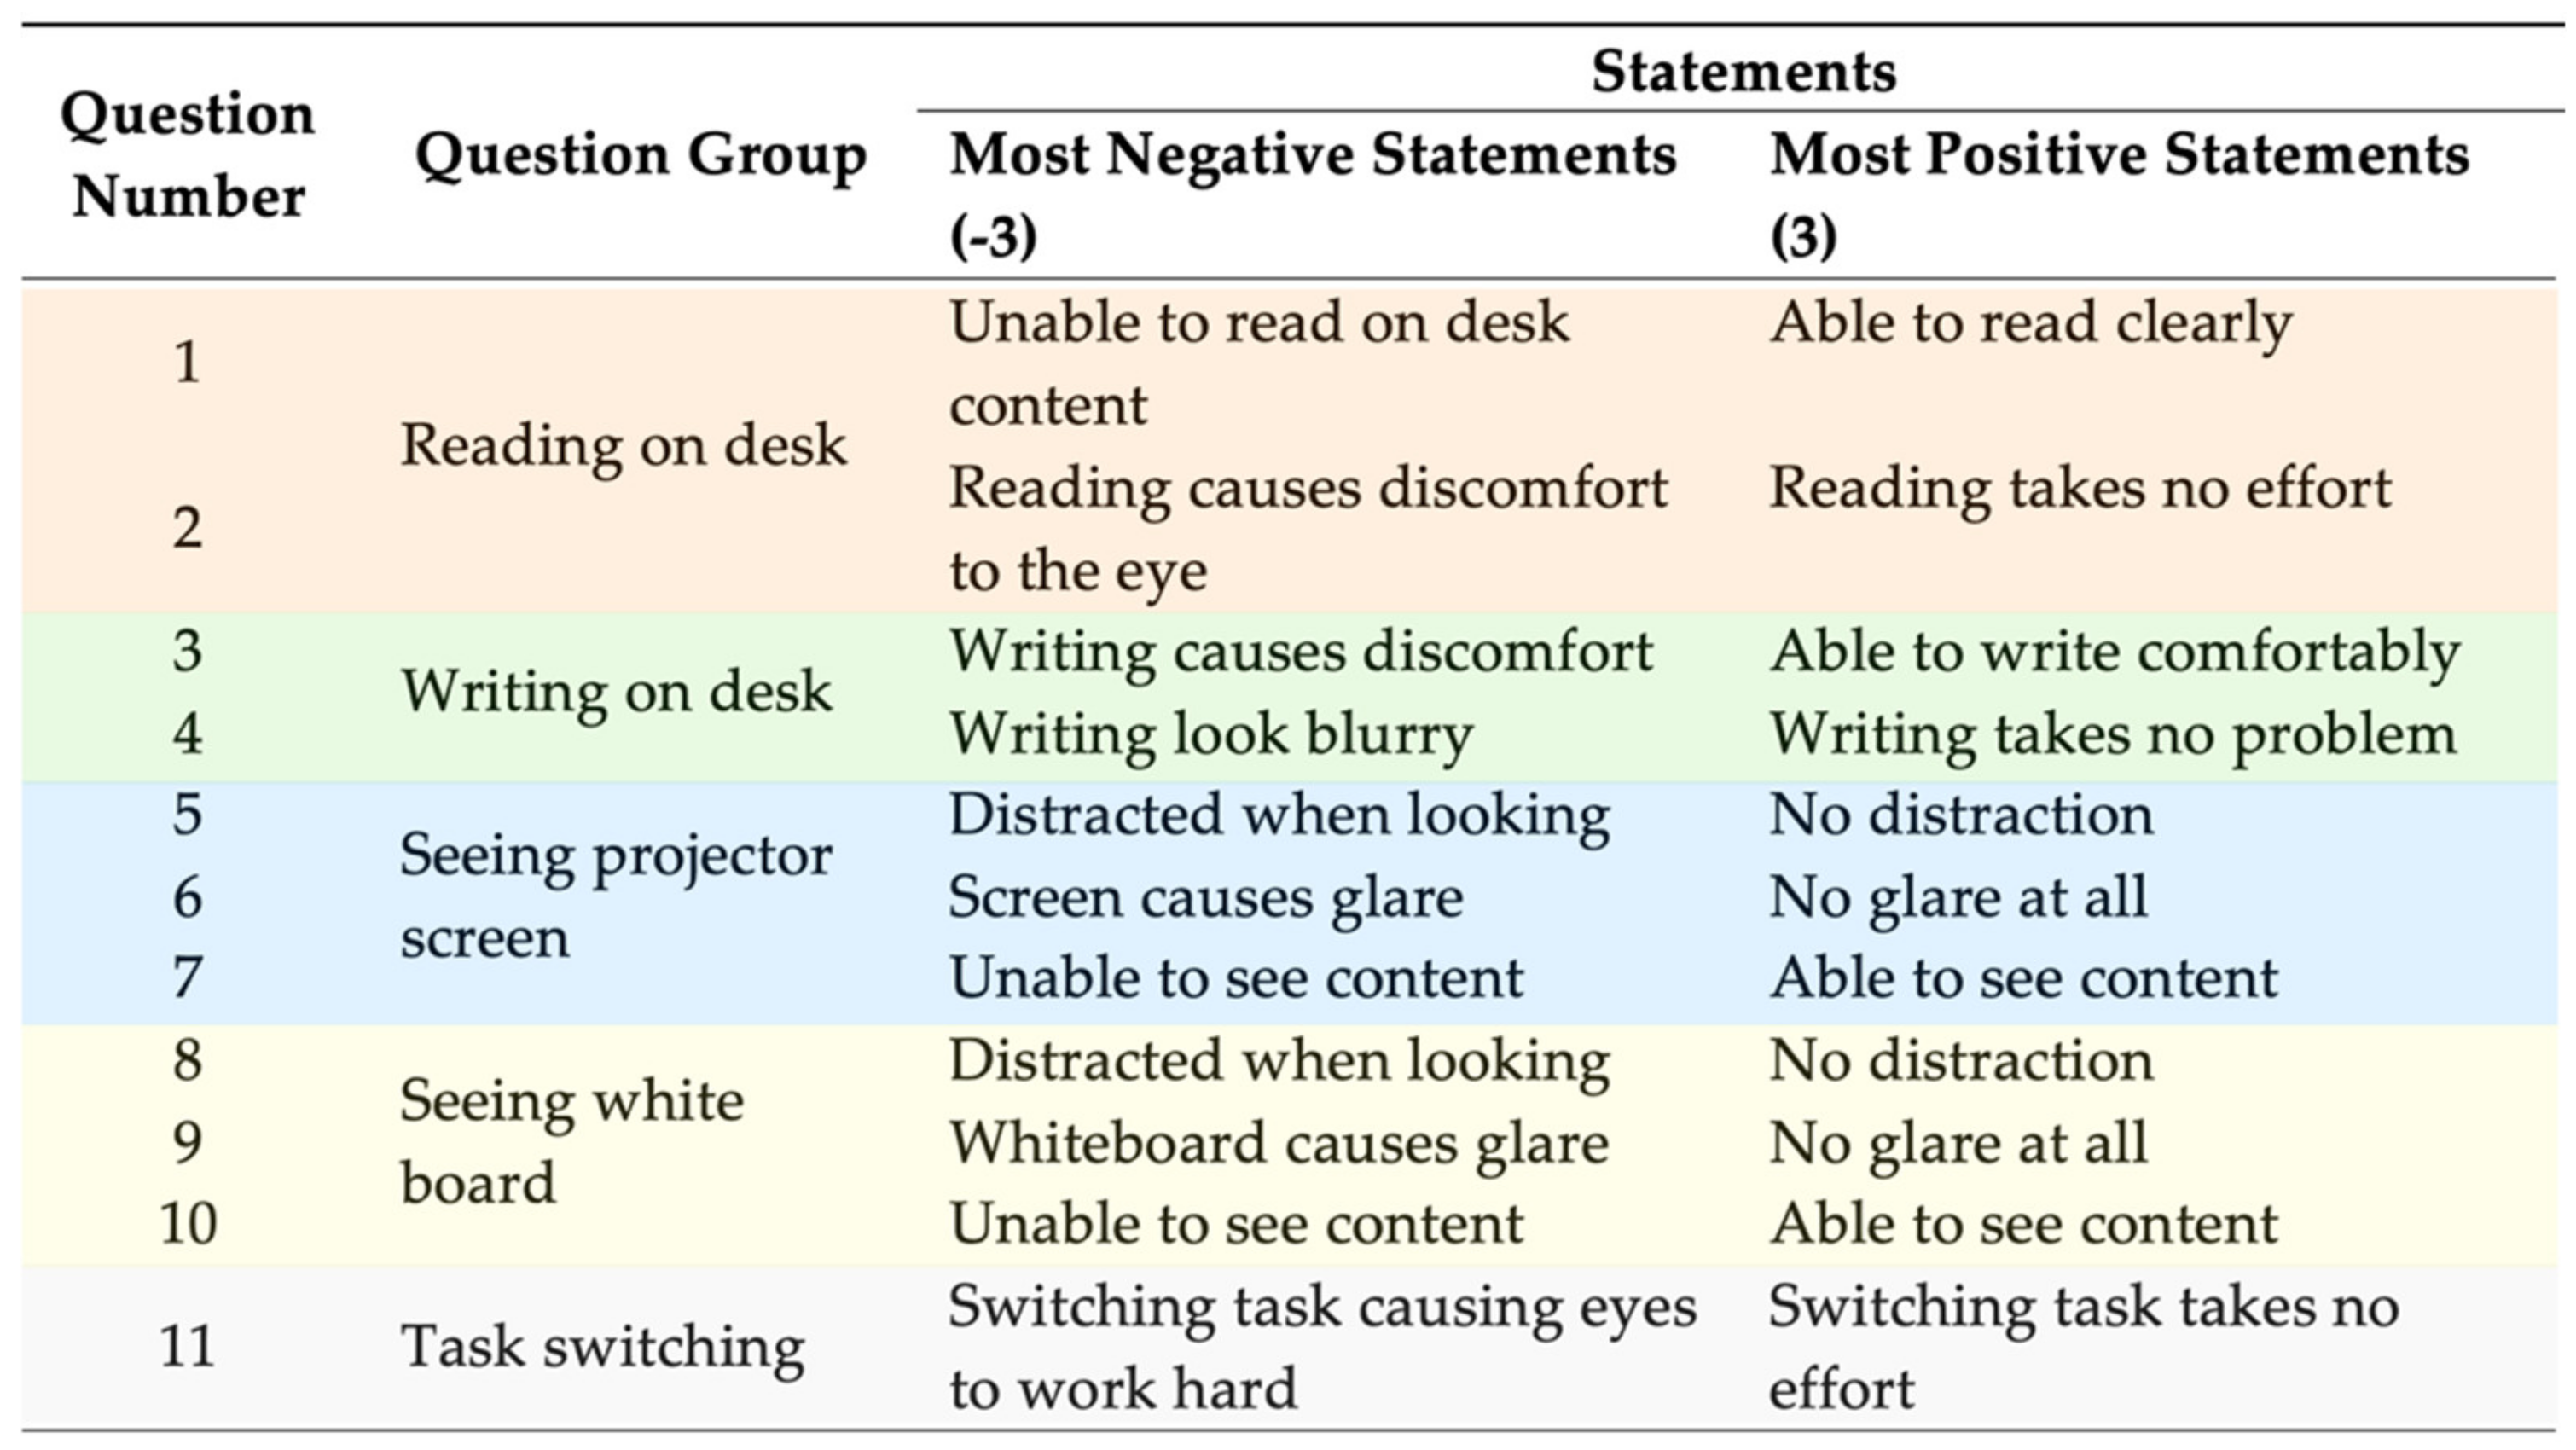
2.2.2. Visual Annoyance and Task Performance
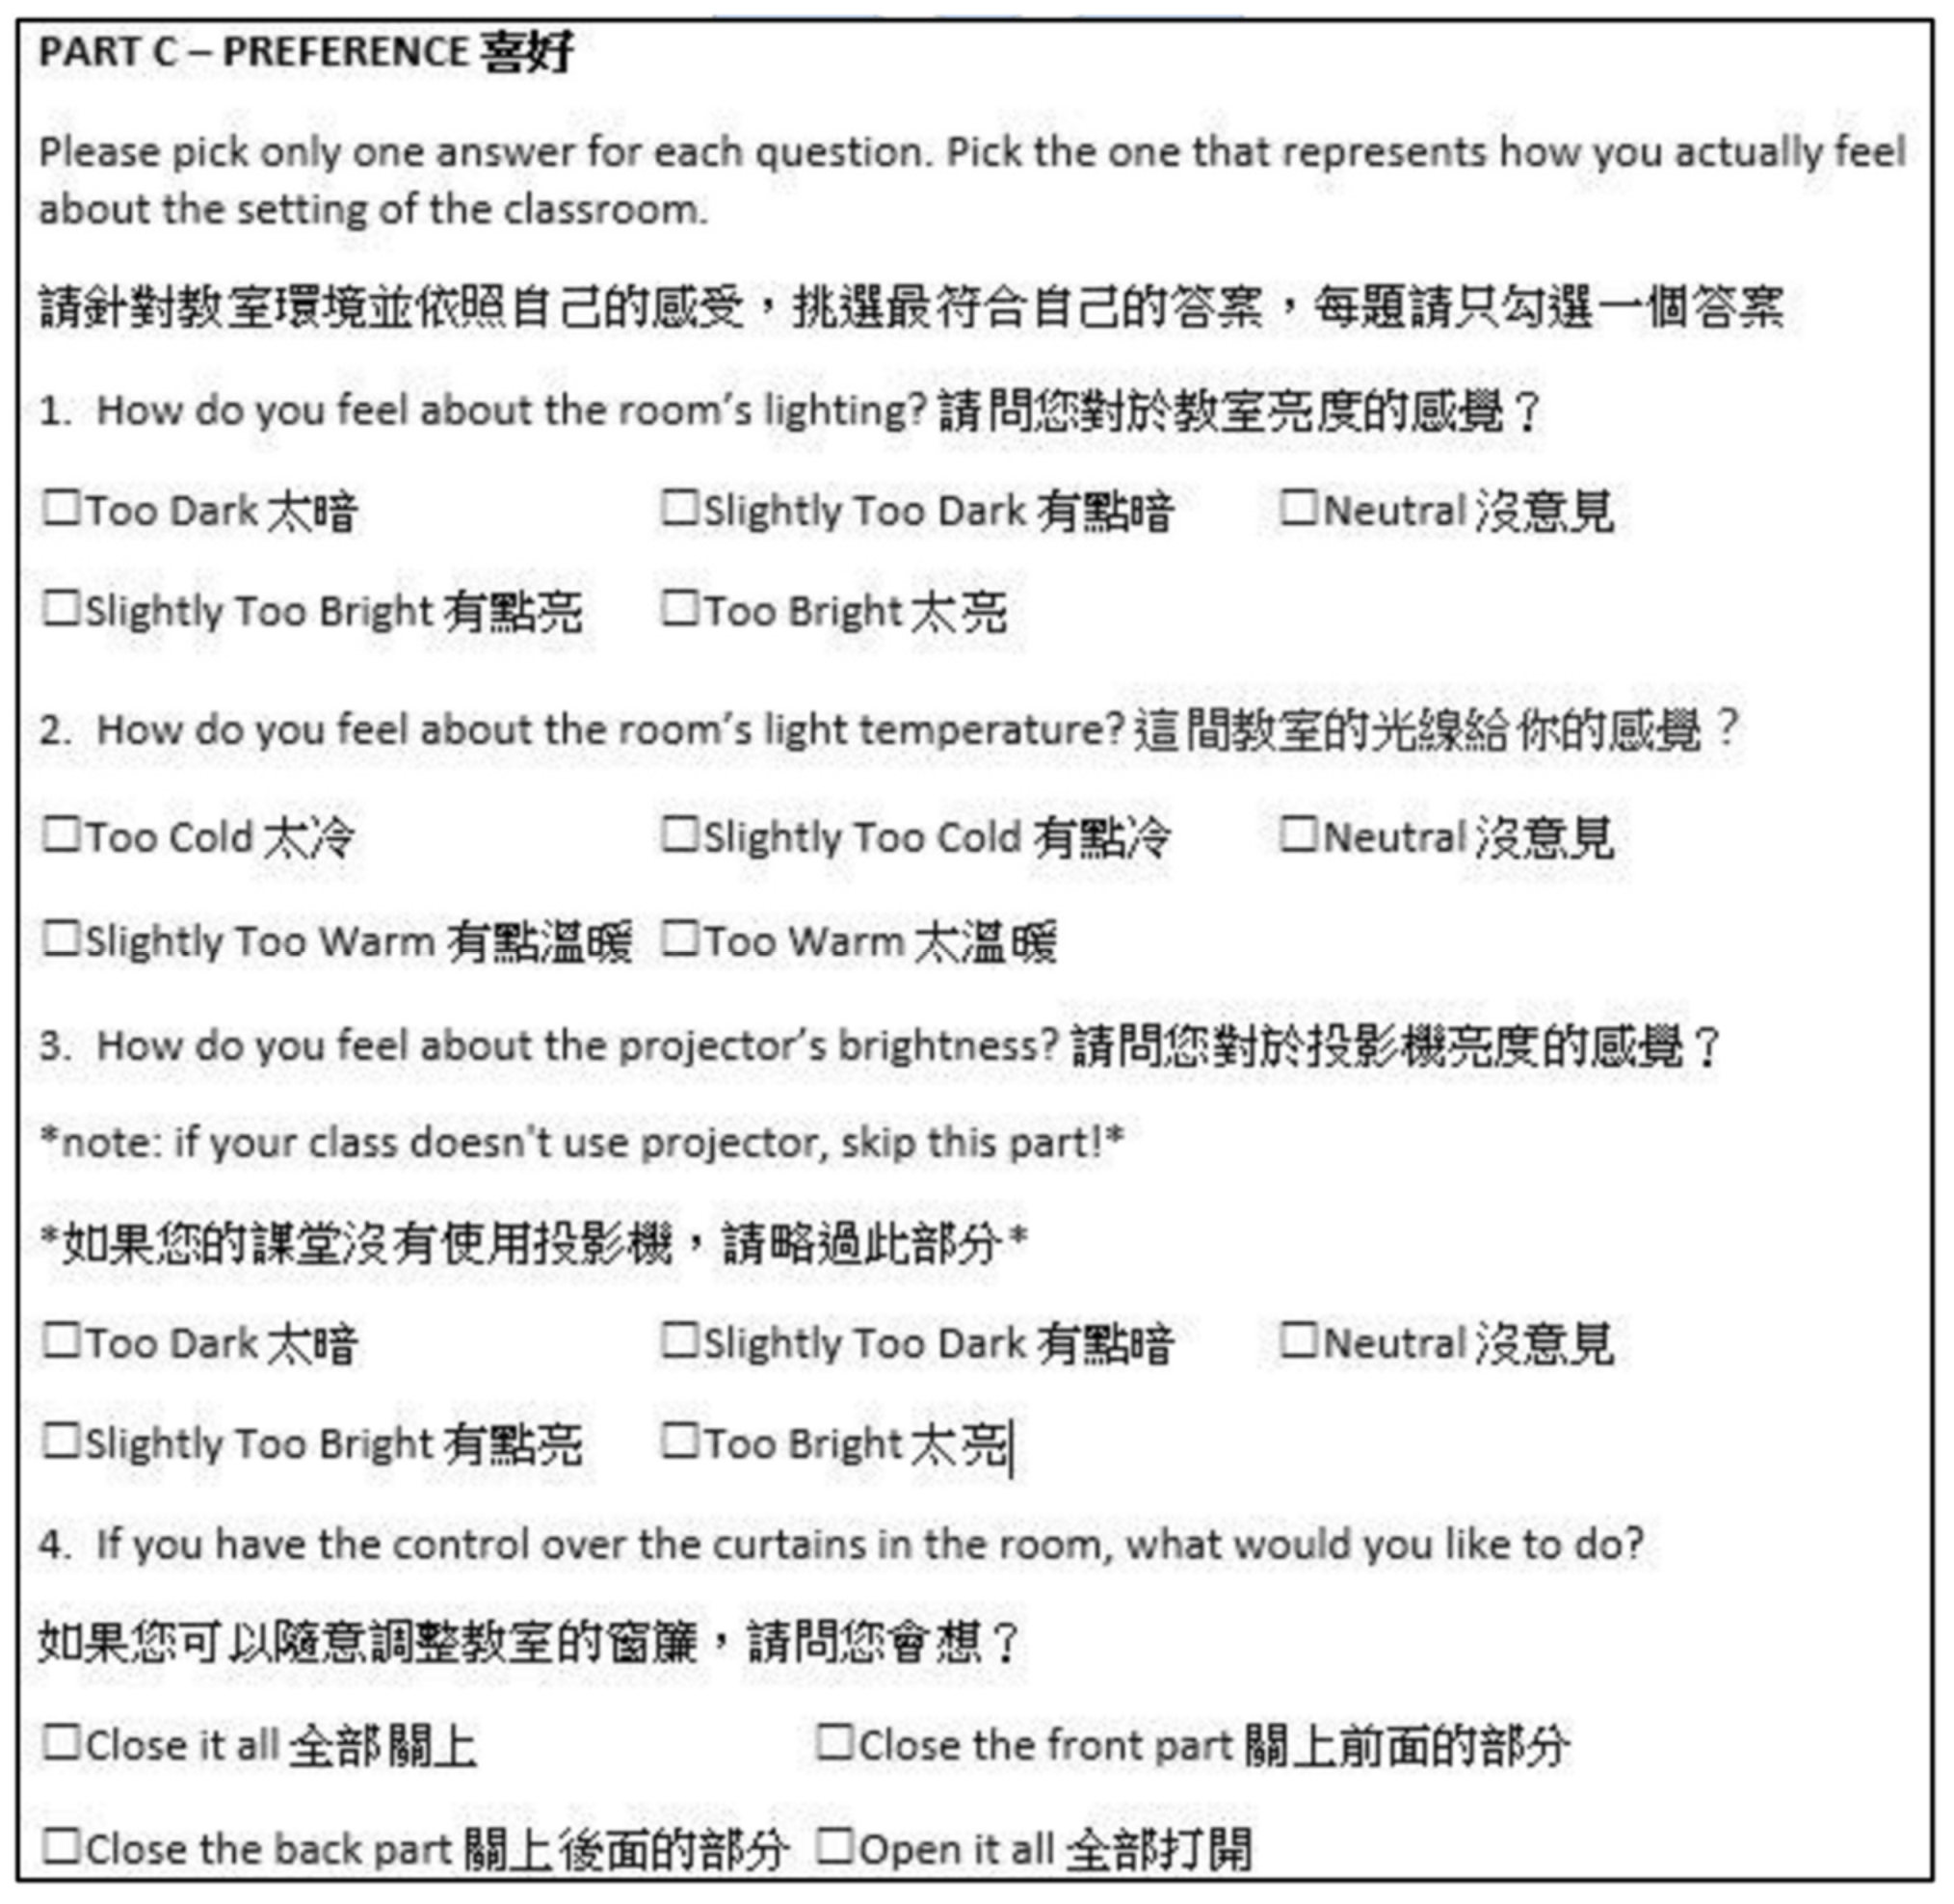
2.2.3. User Preference
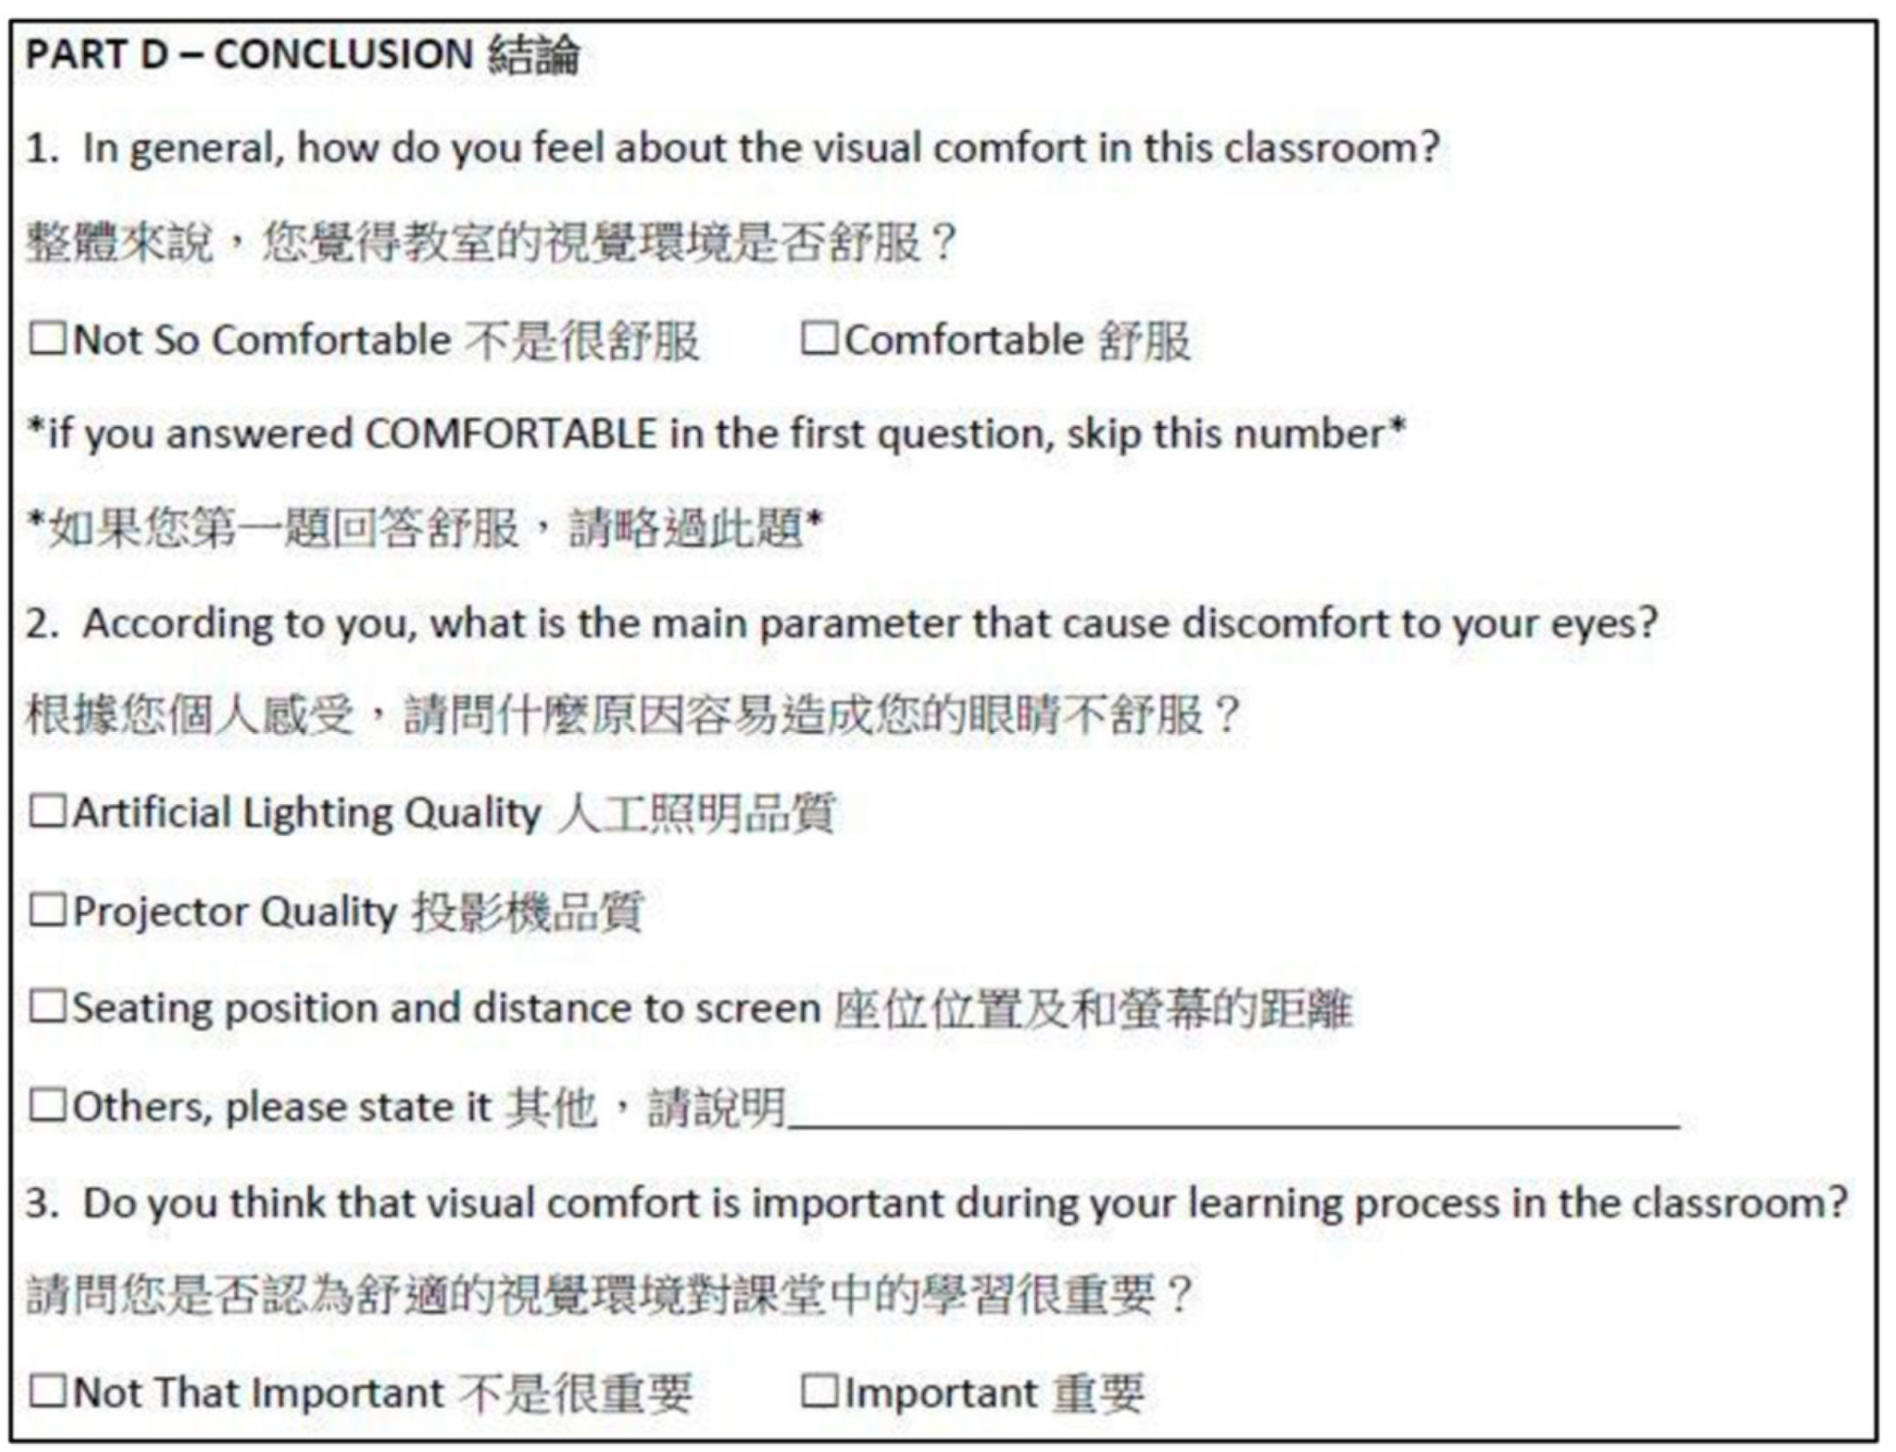
2.2.4. General Conclusion
2.3. Field Measurements and Data Processing
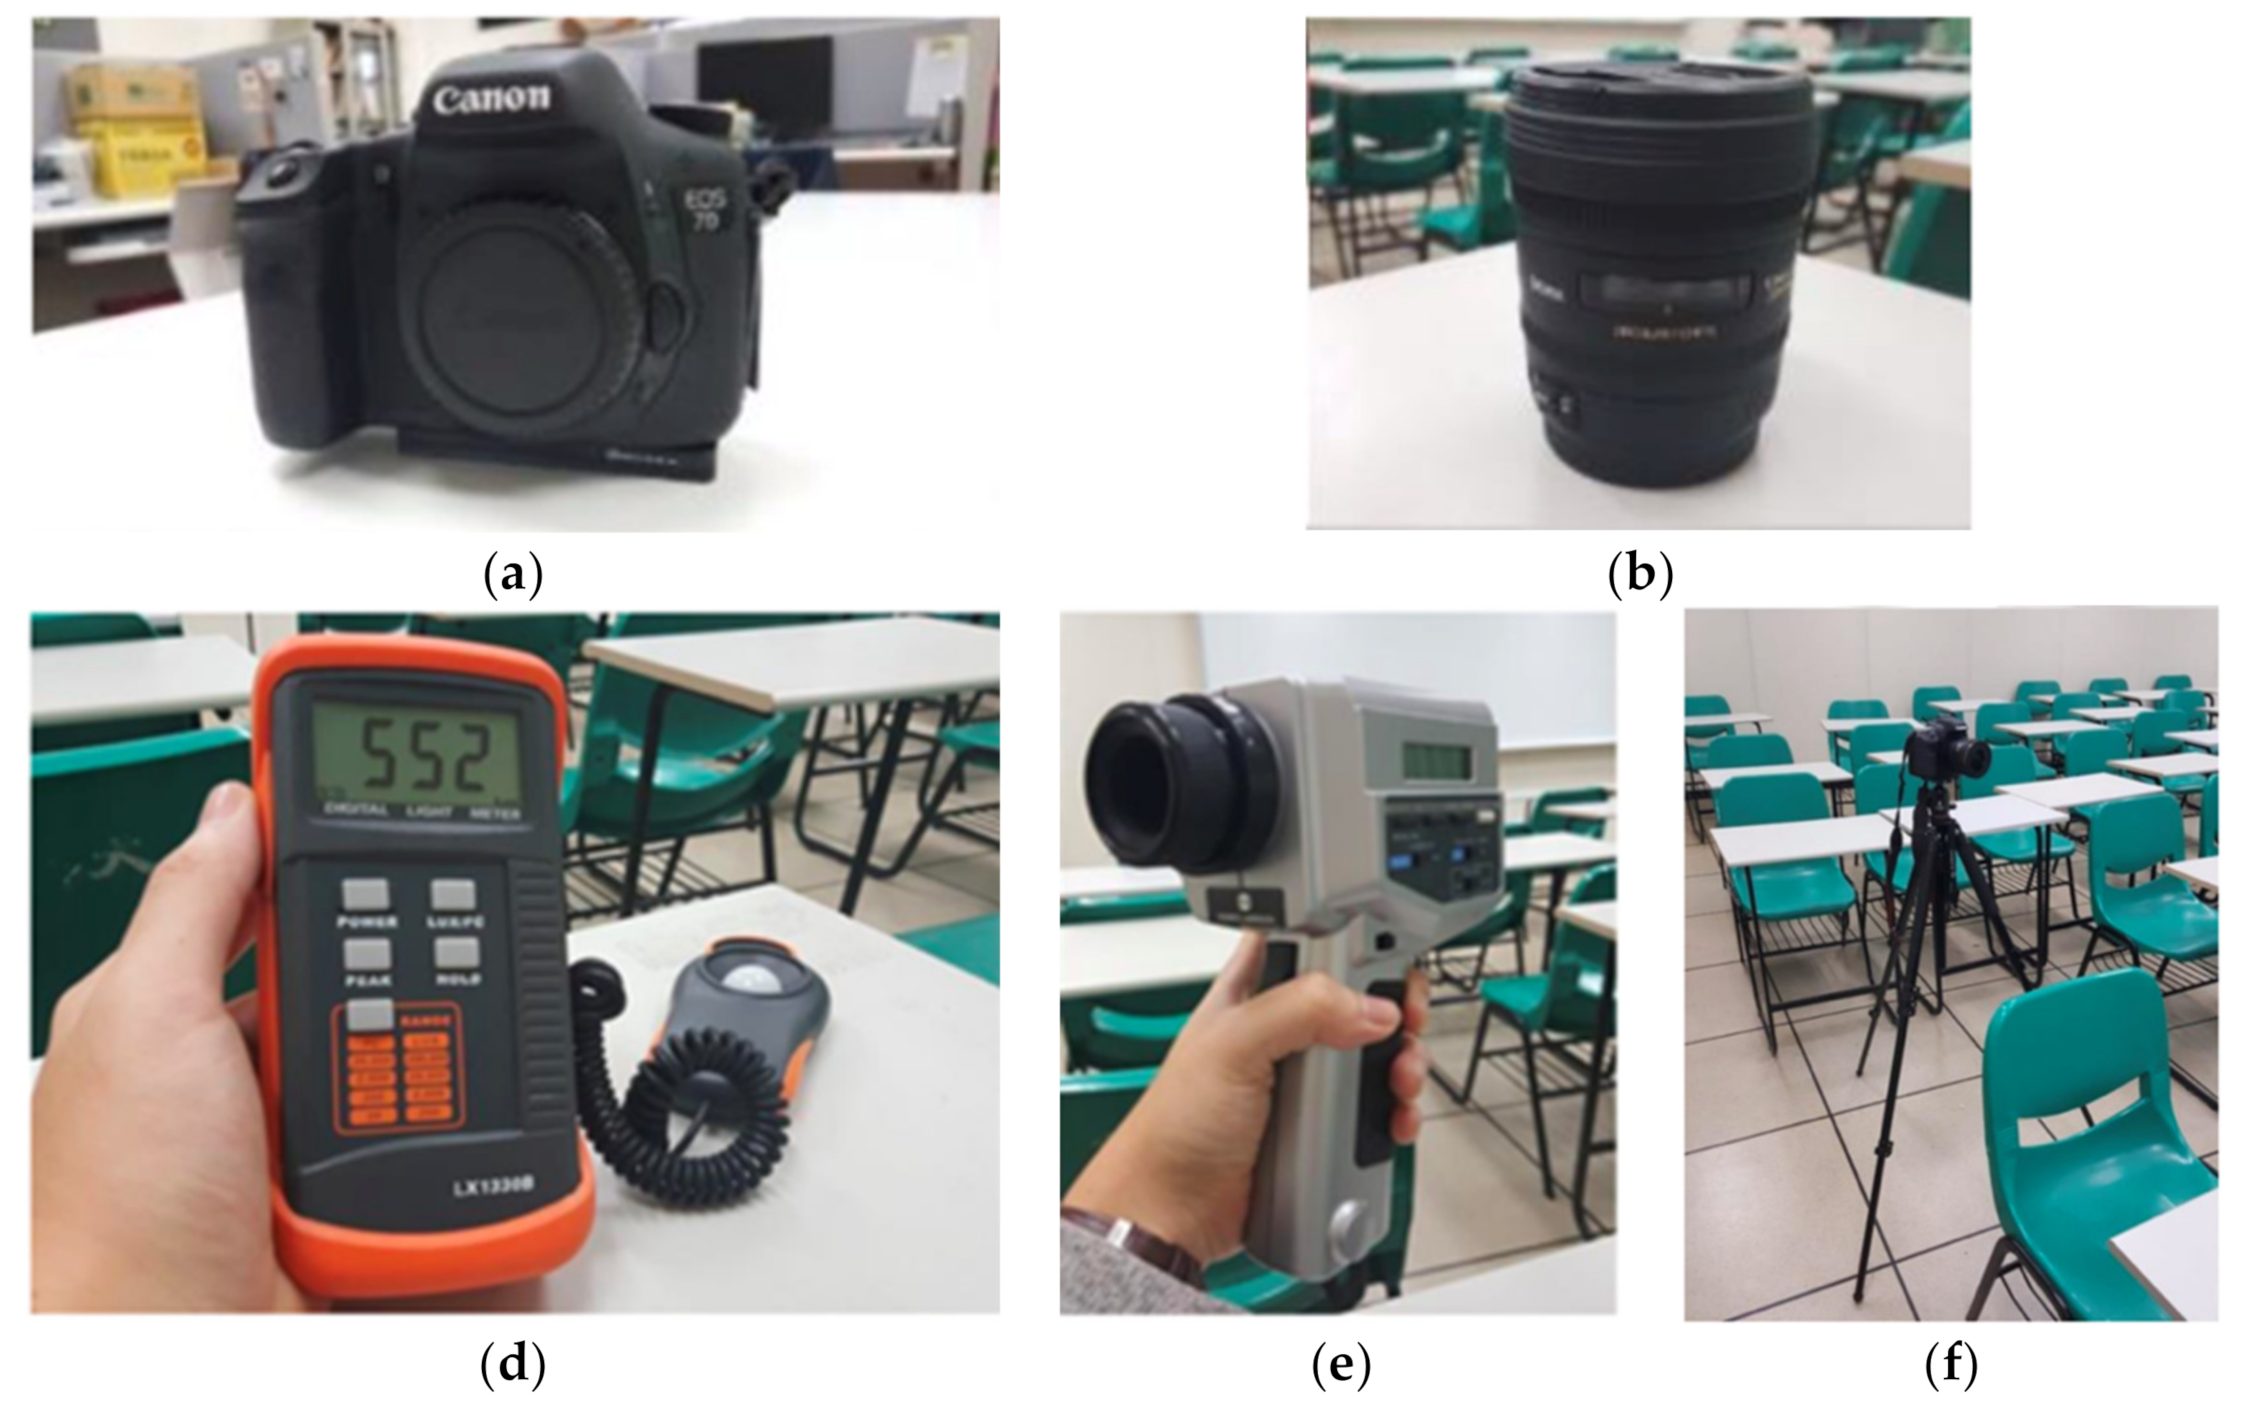
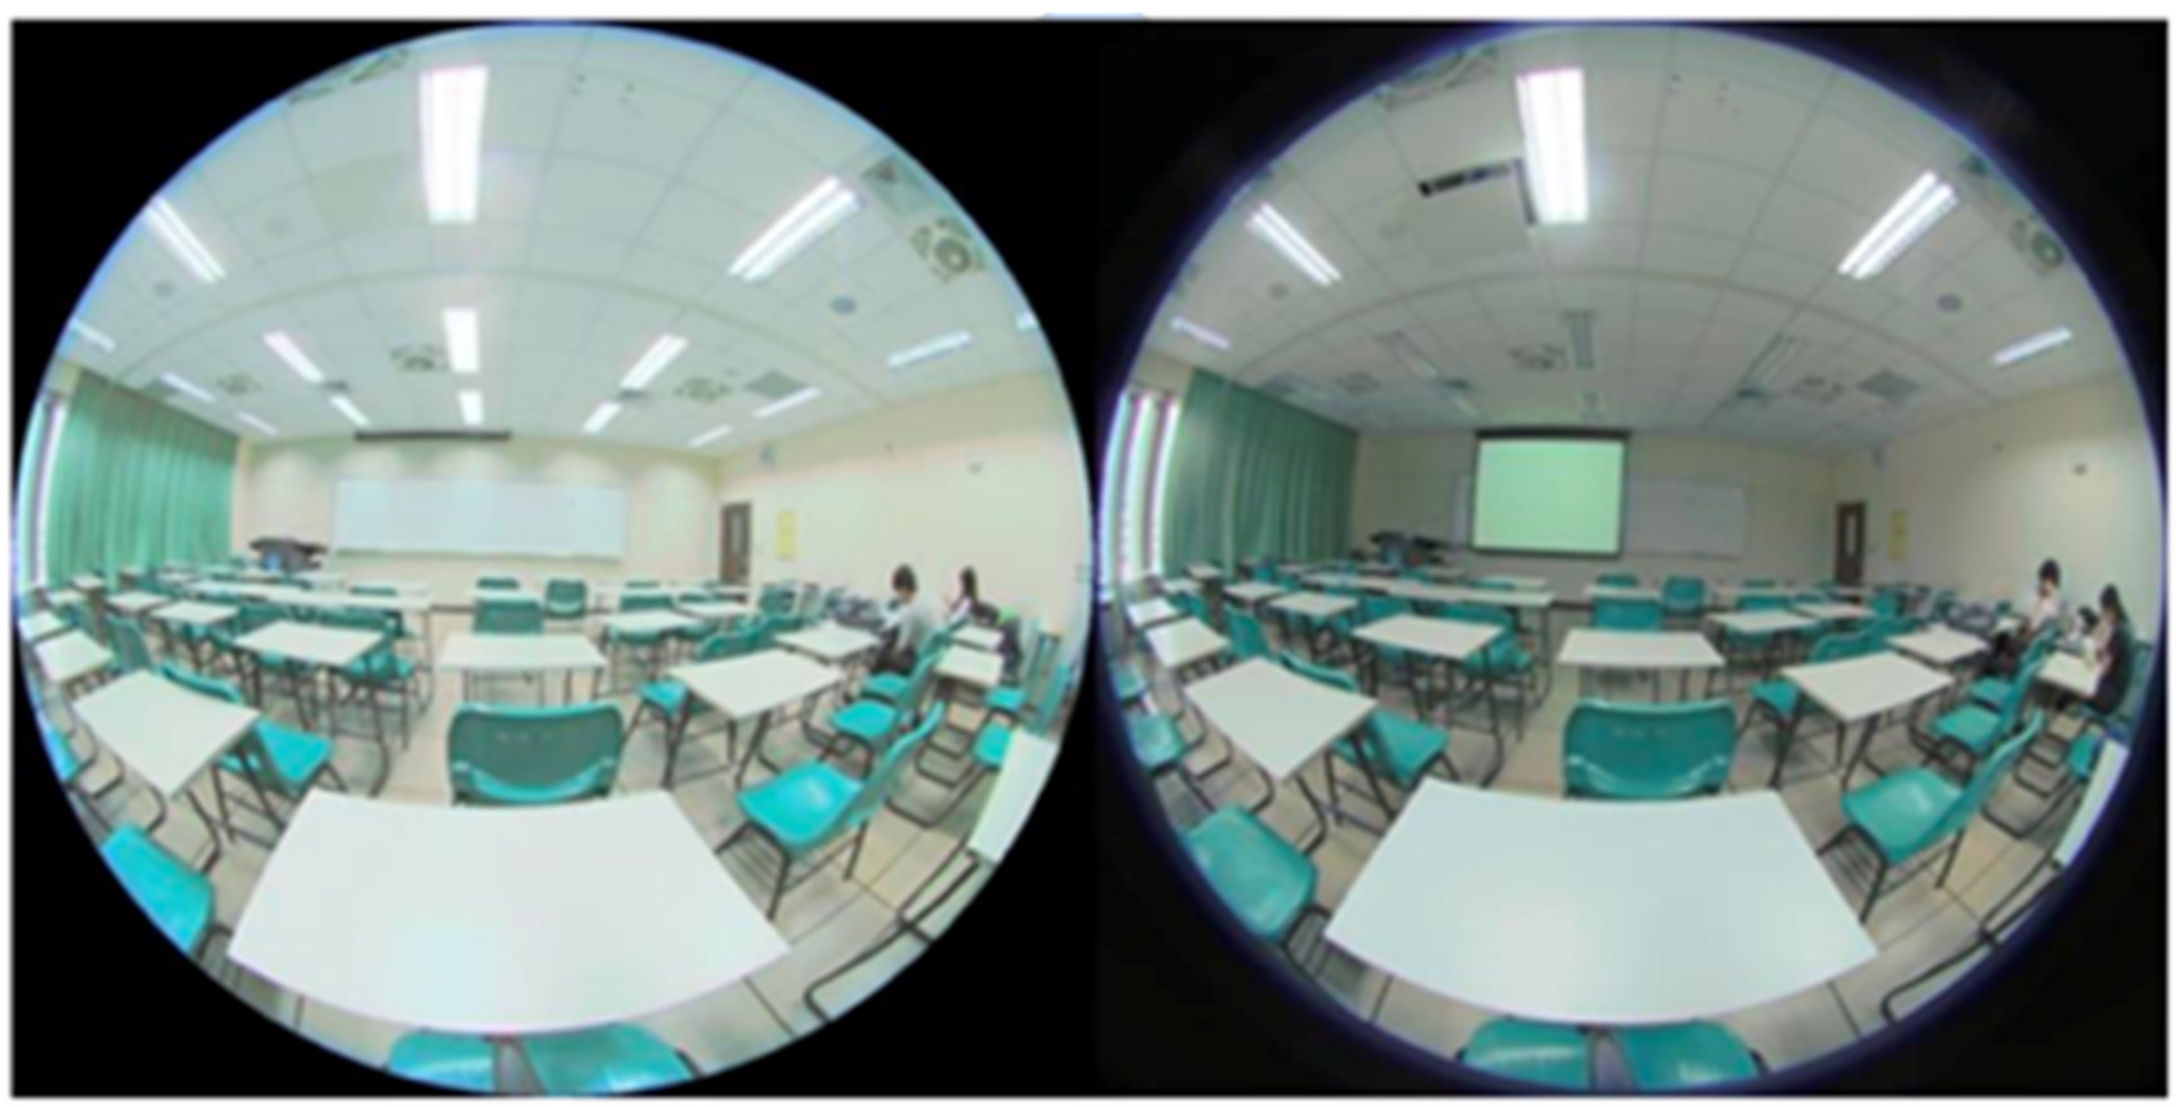
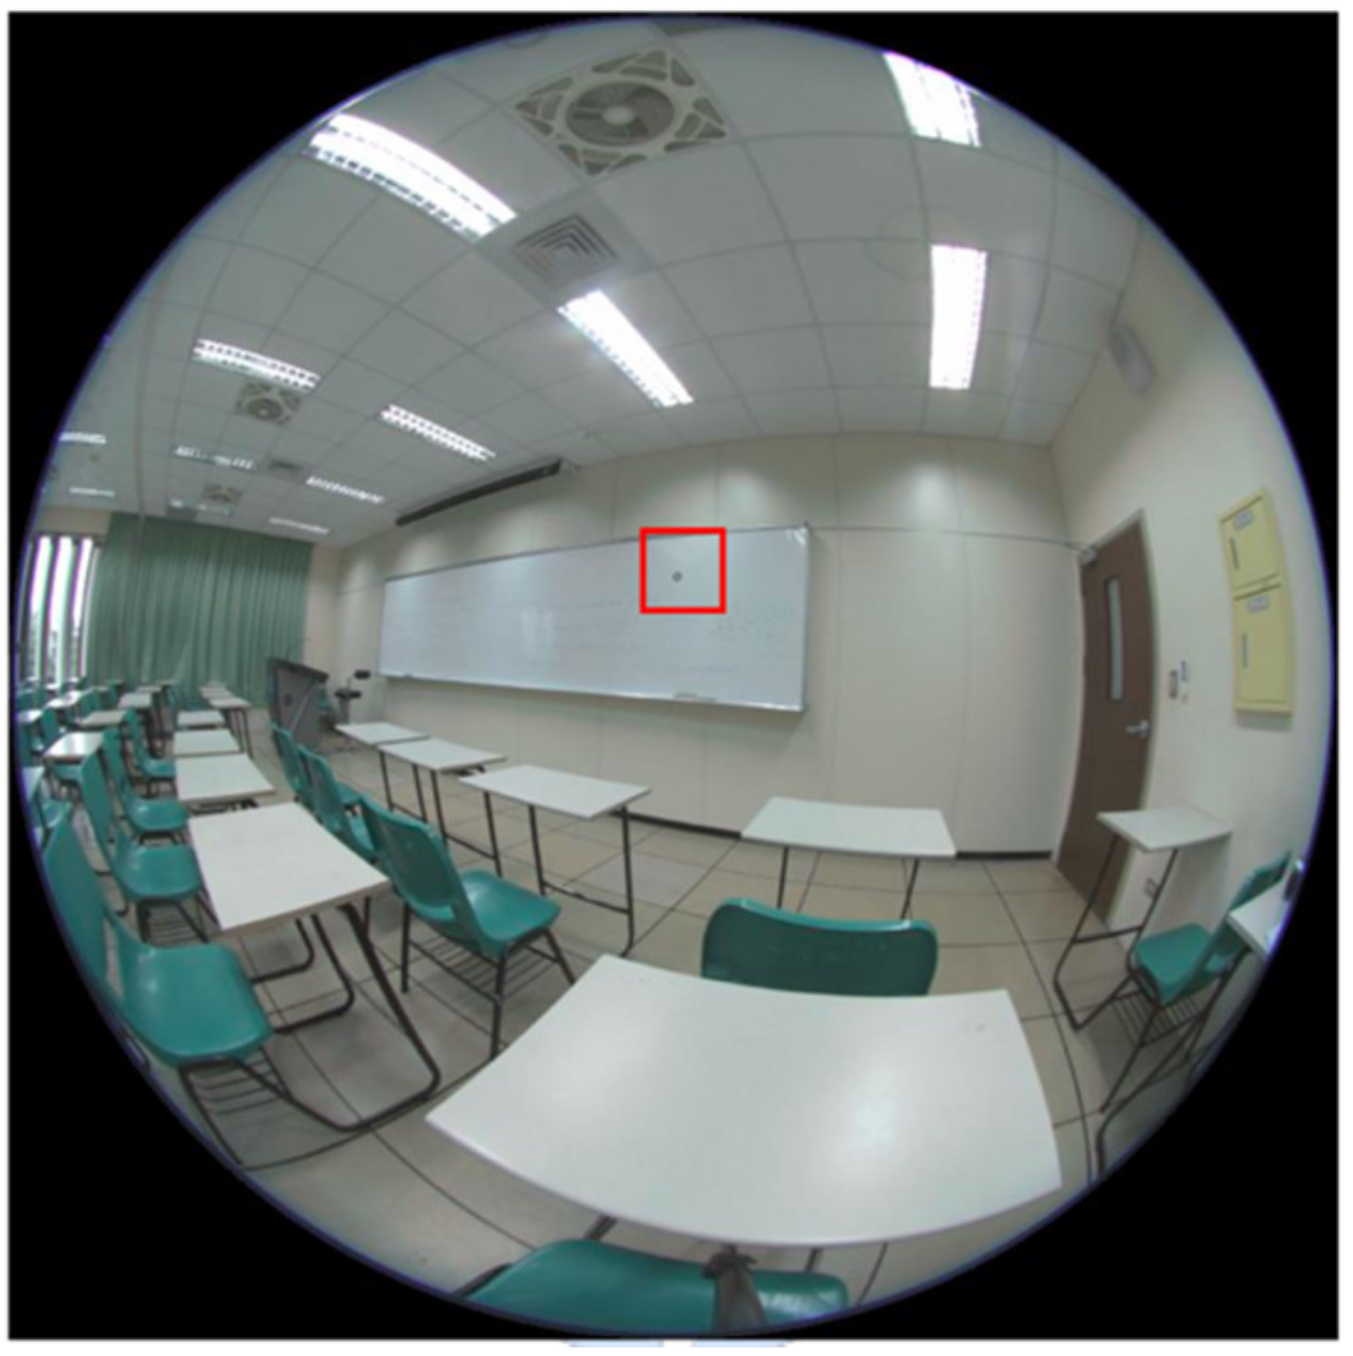
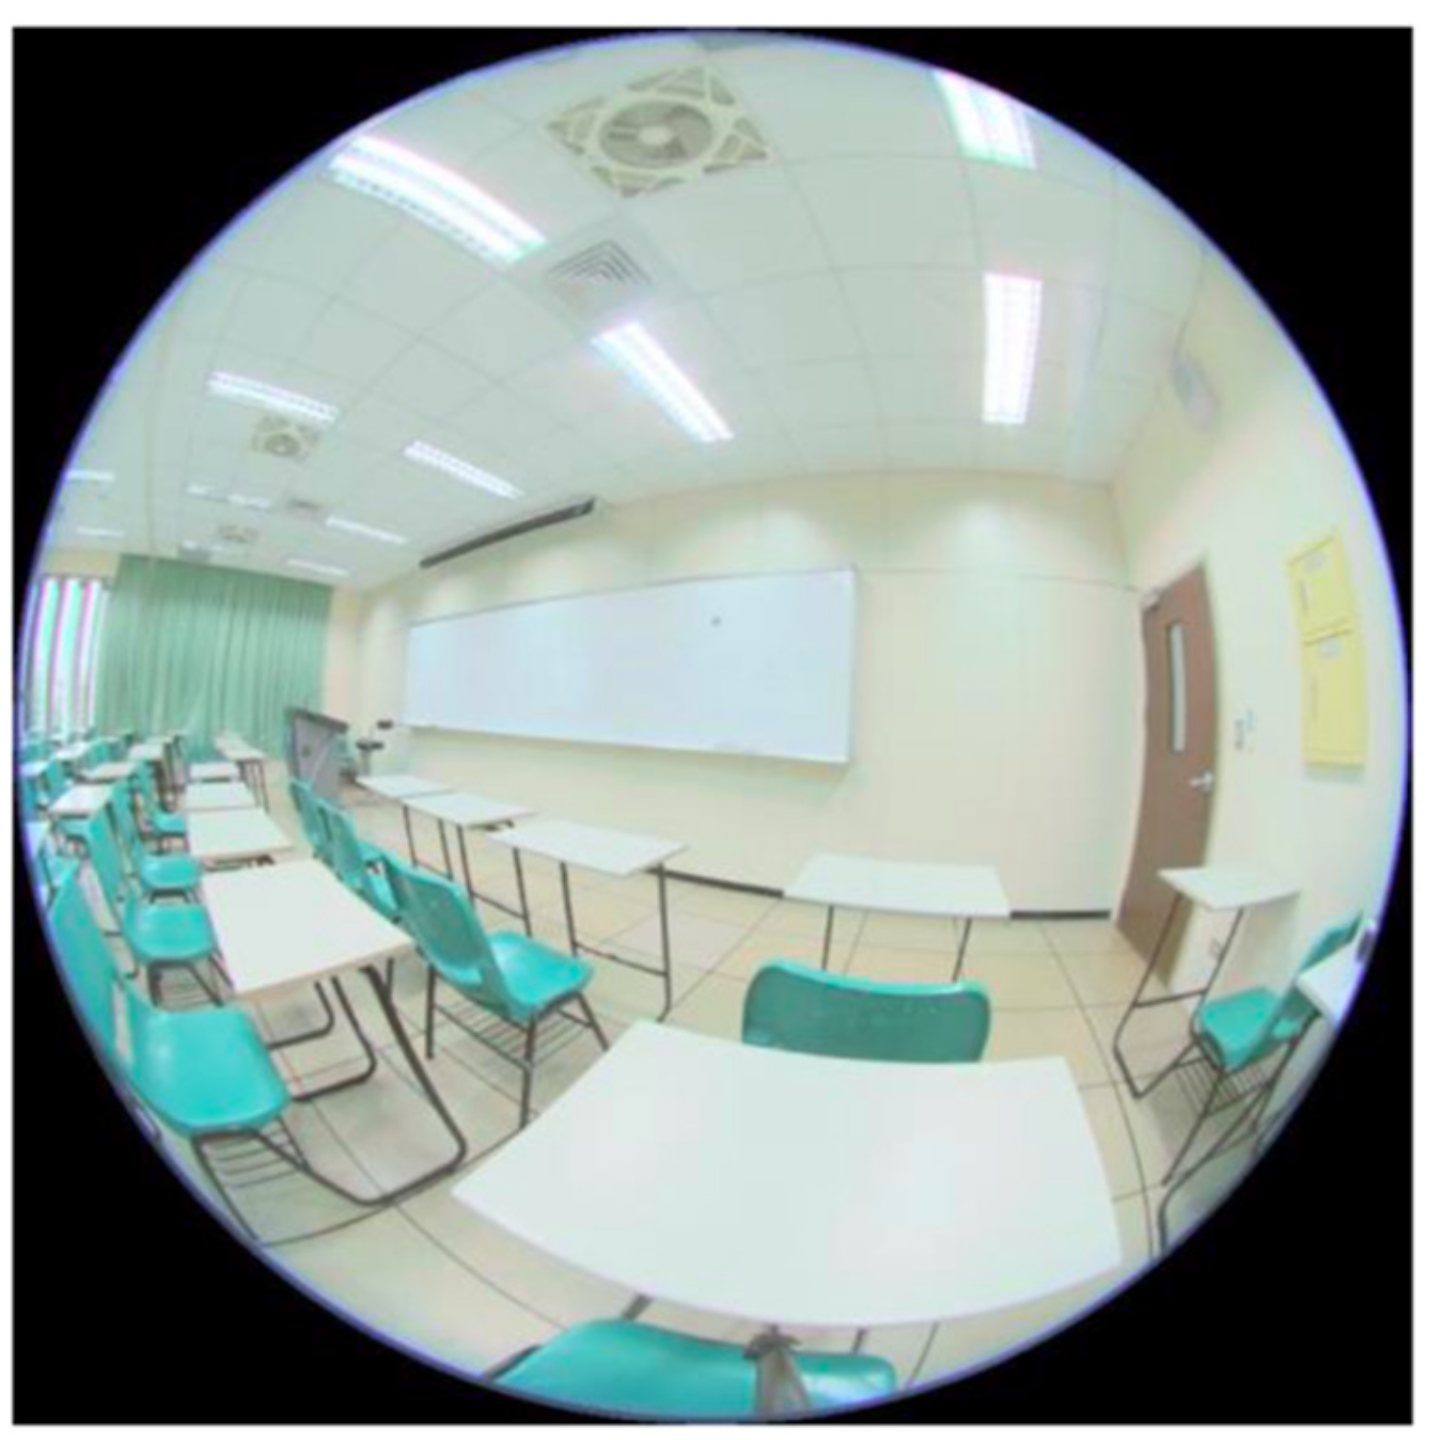
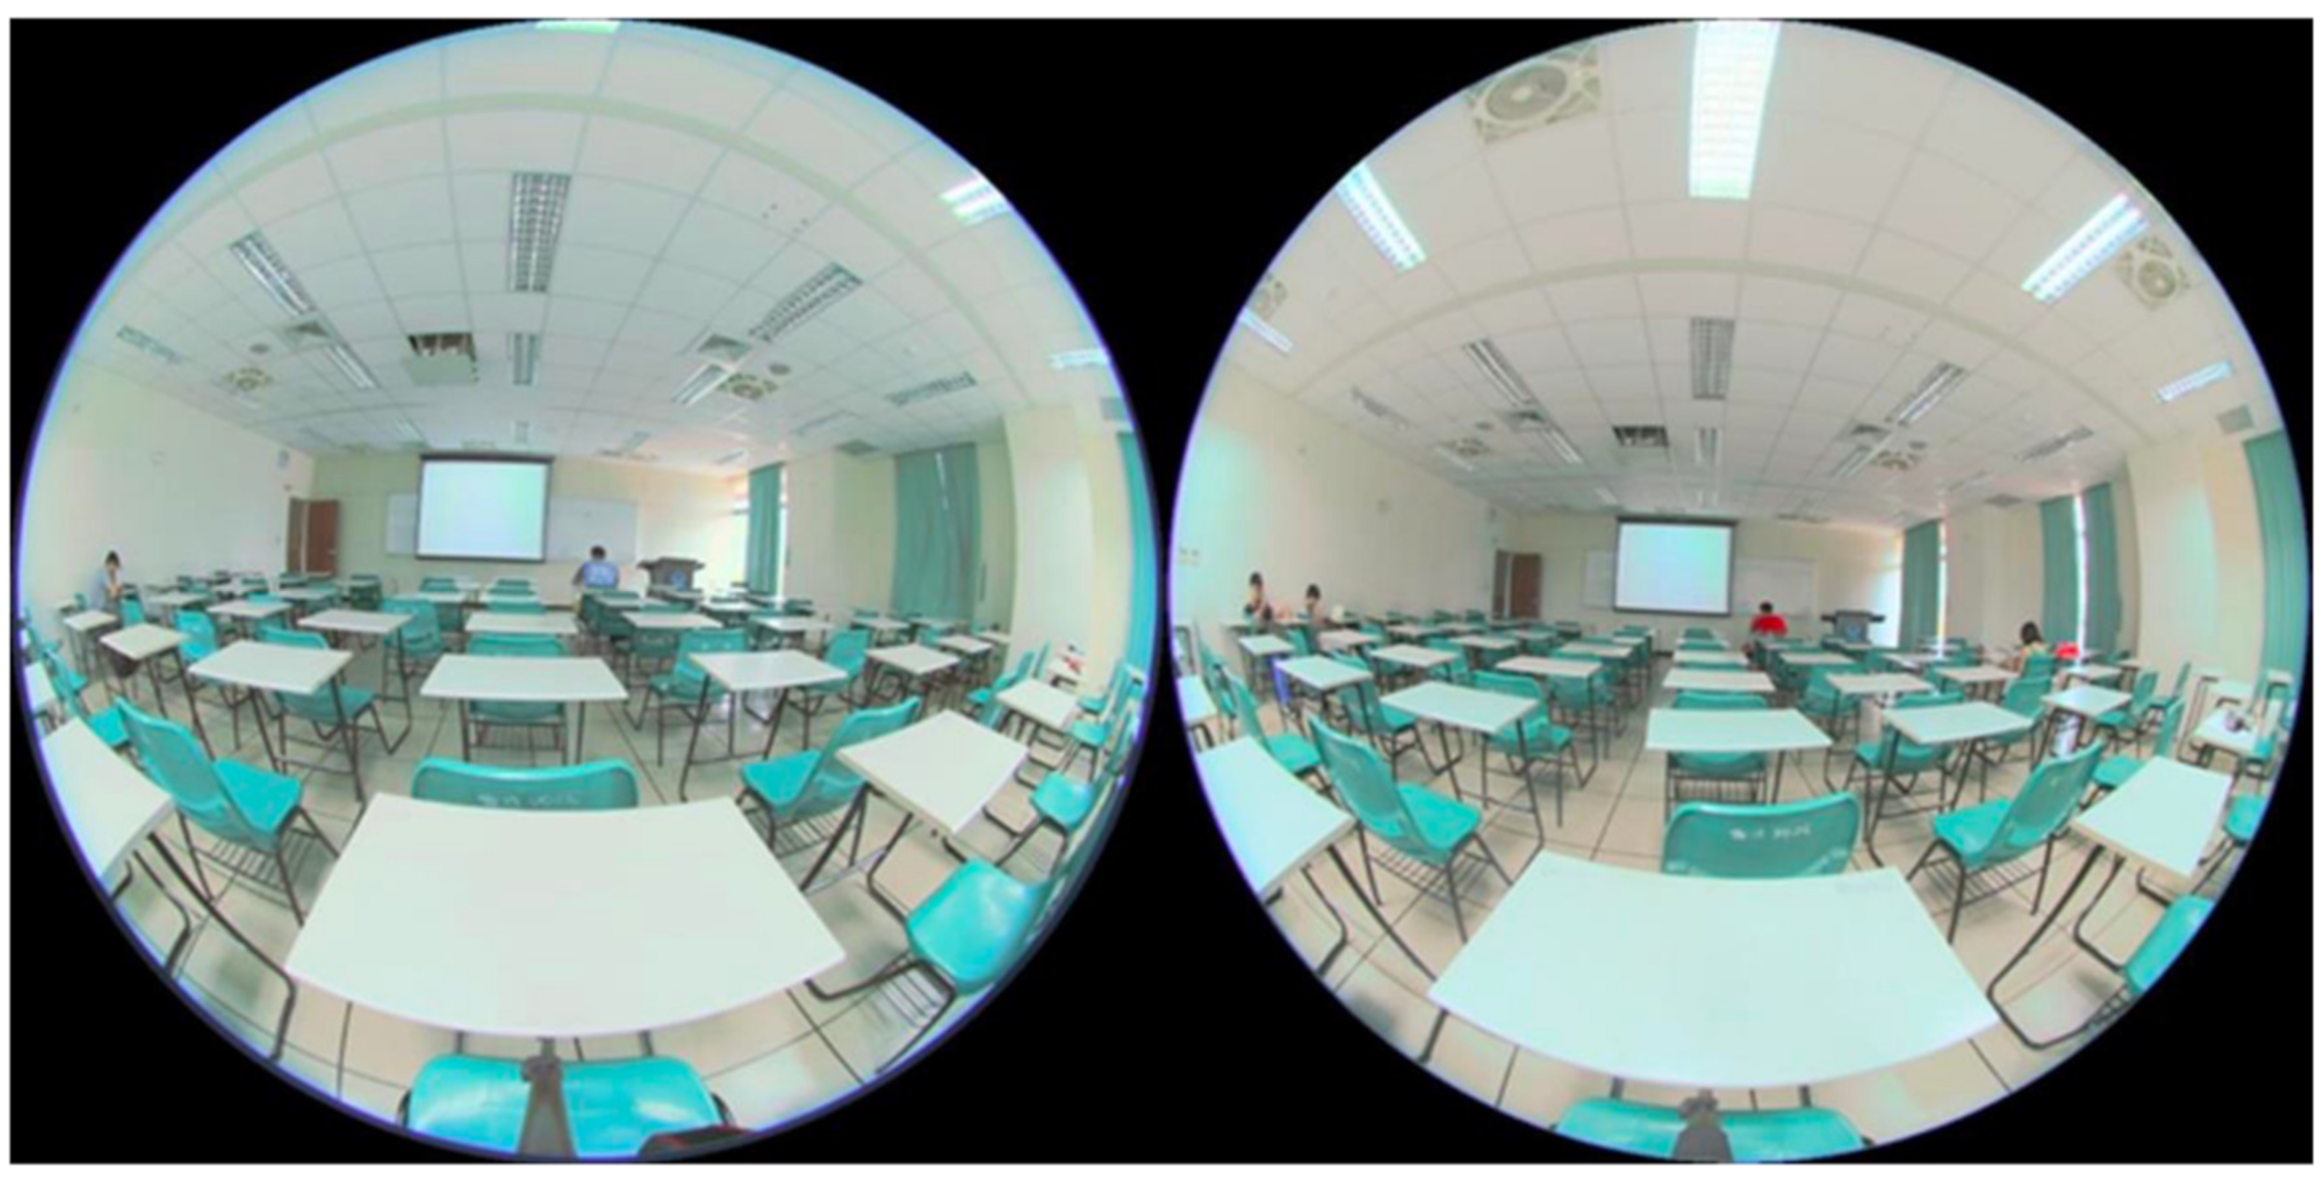
2.3.1. HDR Capture and Field Measurement
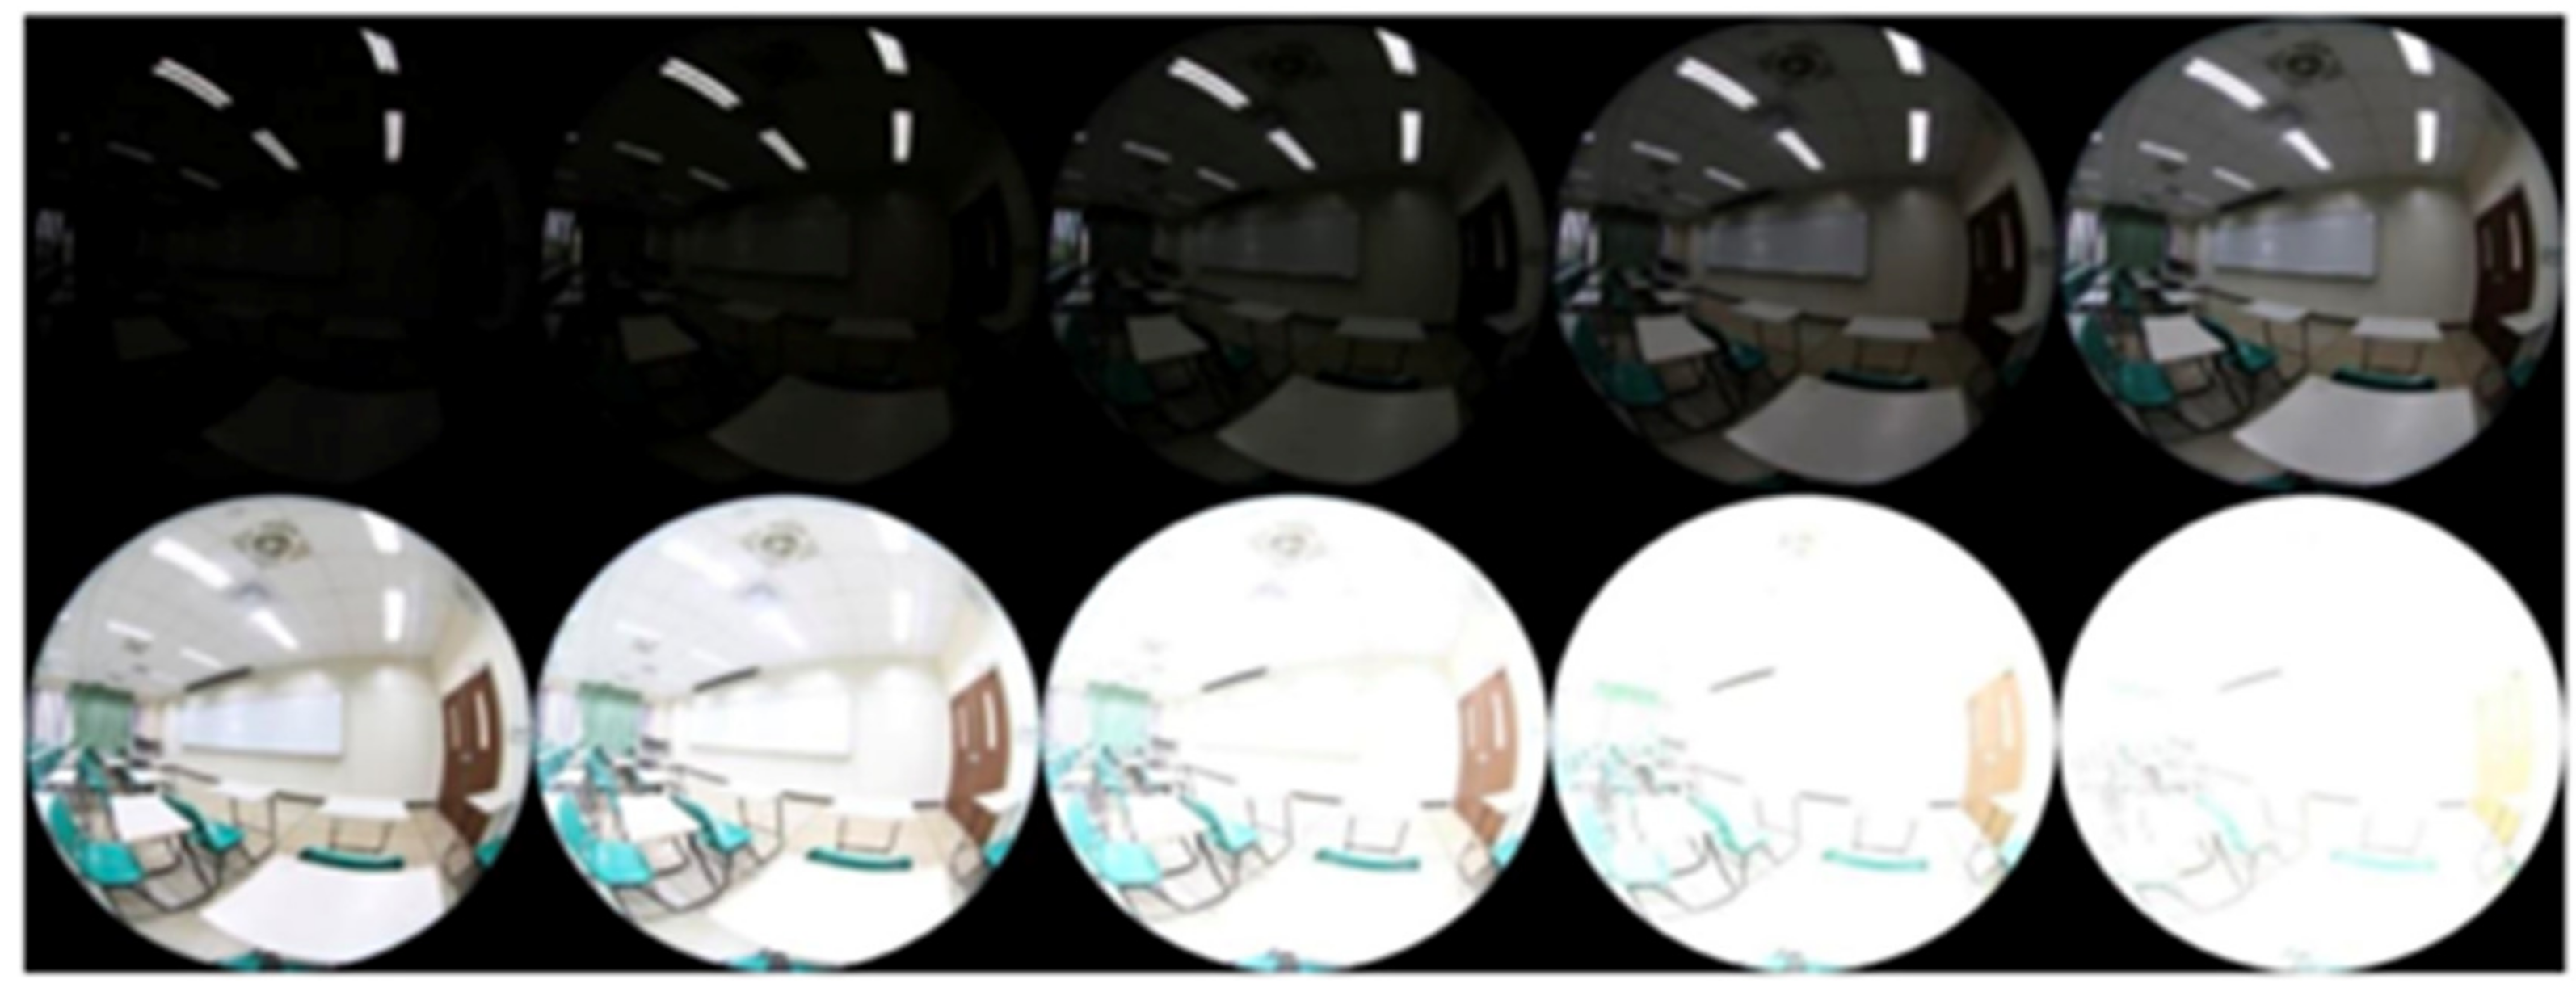
2.3.2. HDR Image Compiling and Luminance Calibration
2.3.3. Glare Analysis by Evalglare
3. Results and Discussions
3.1. Questionnaire Results
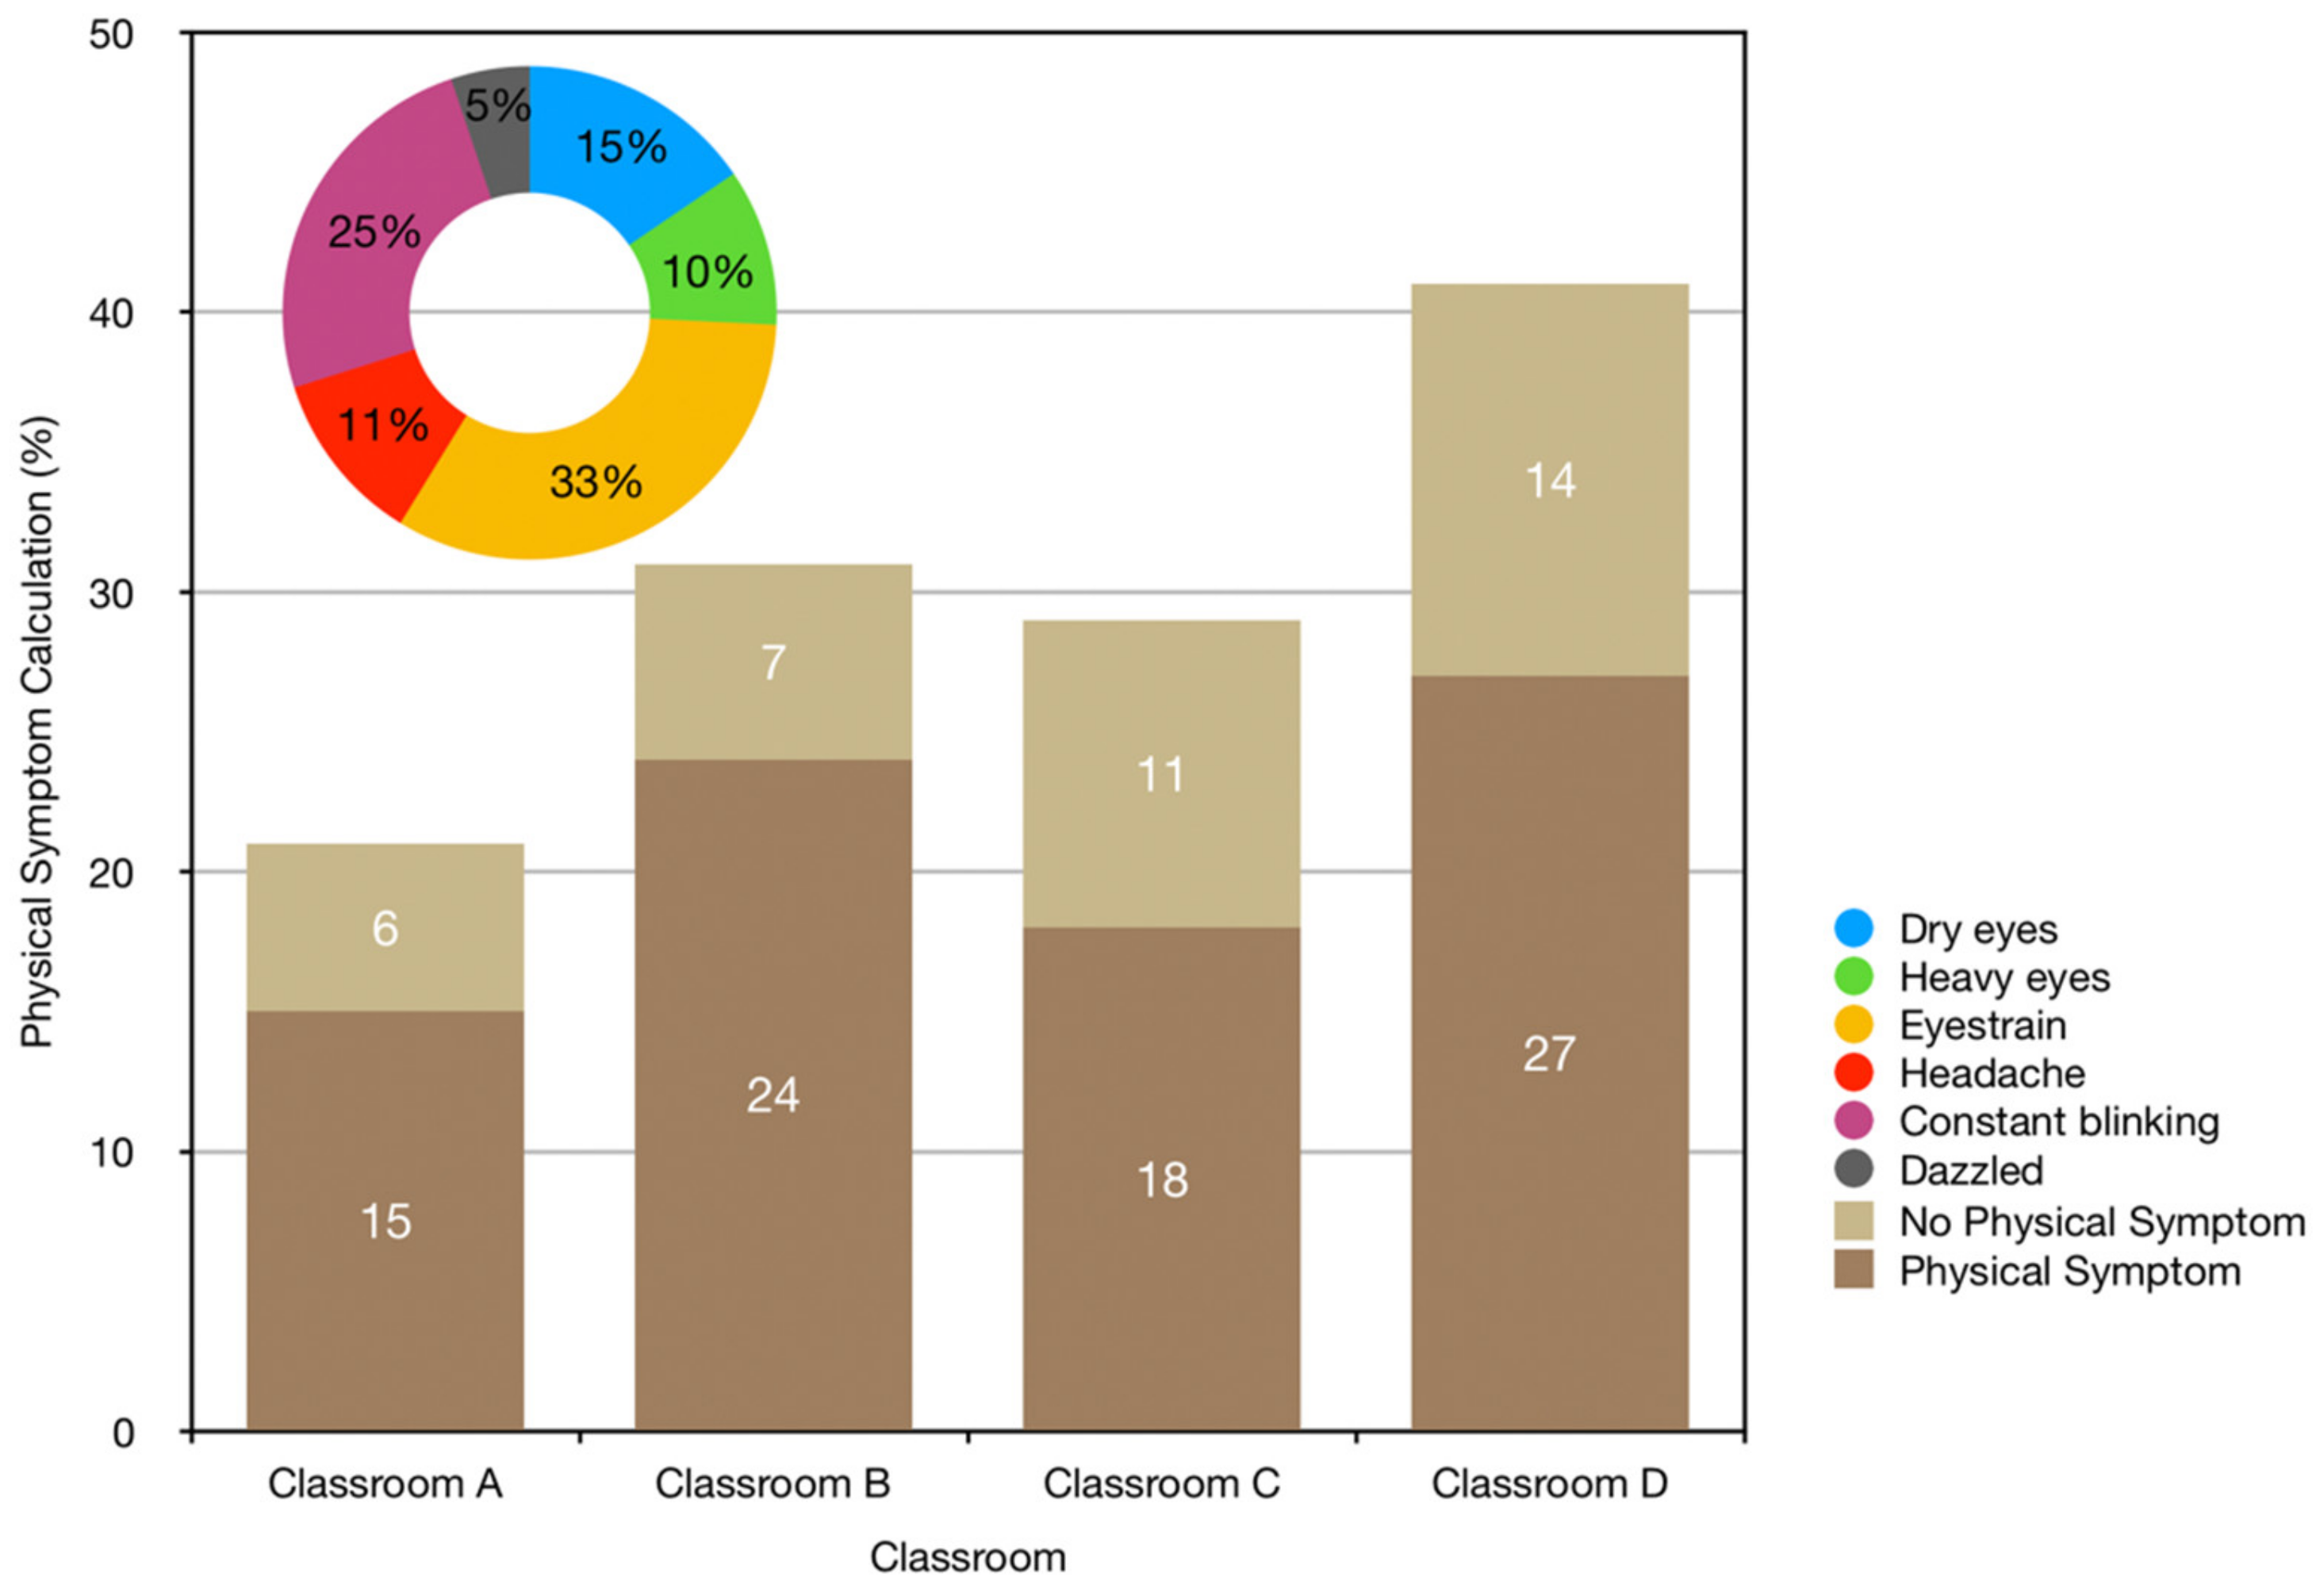
3.1.1. Physical Symptoms (Part A)
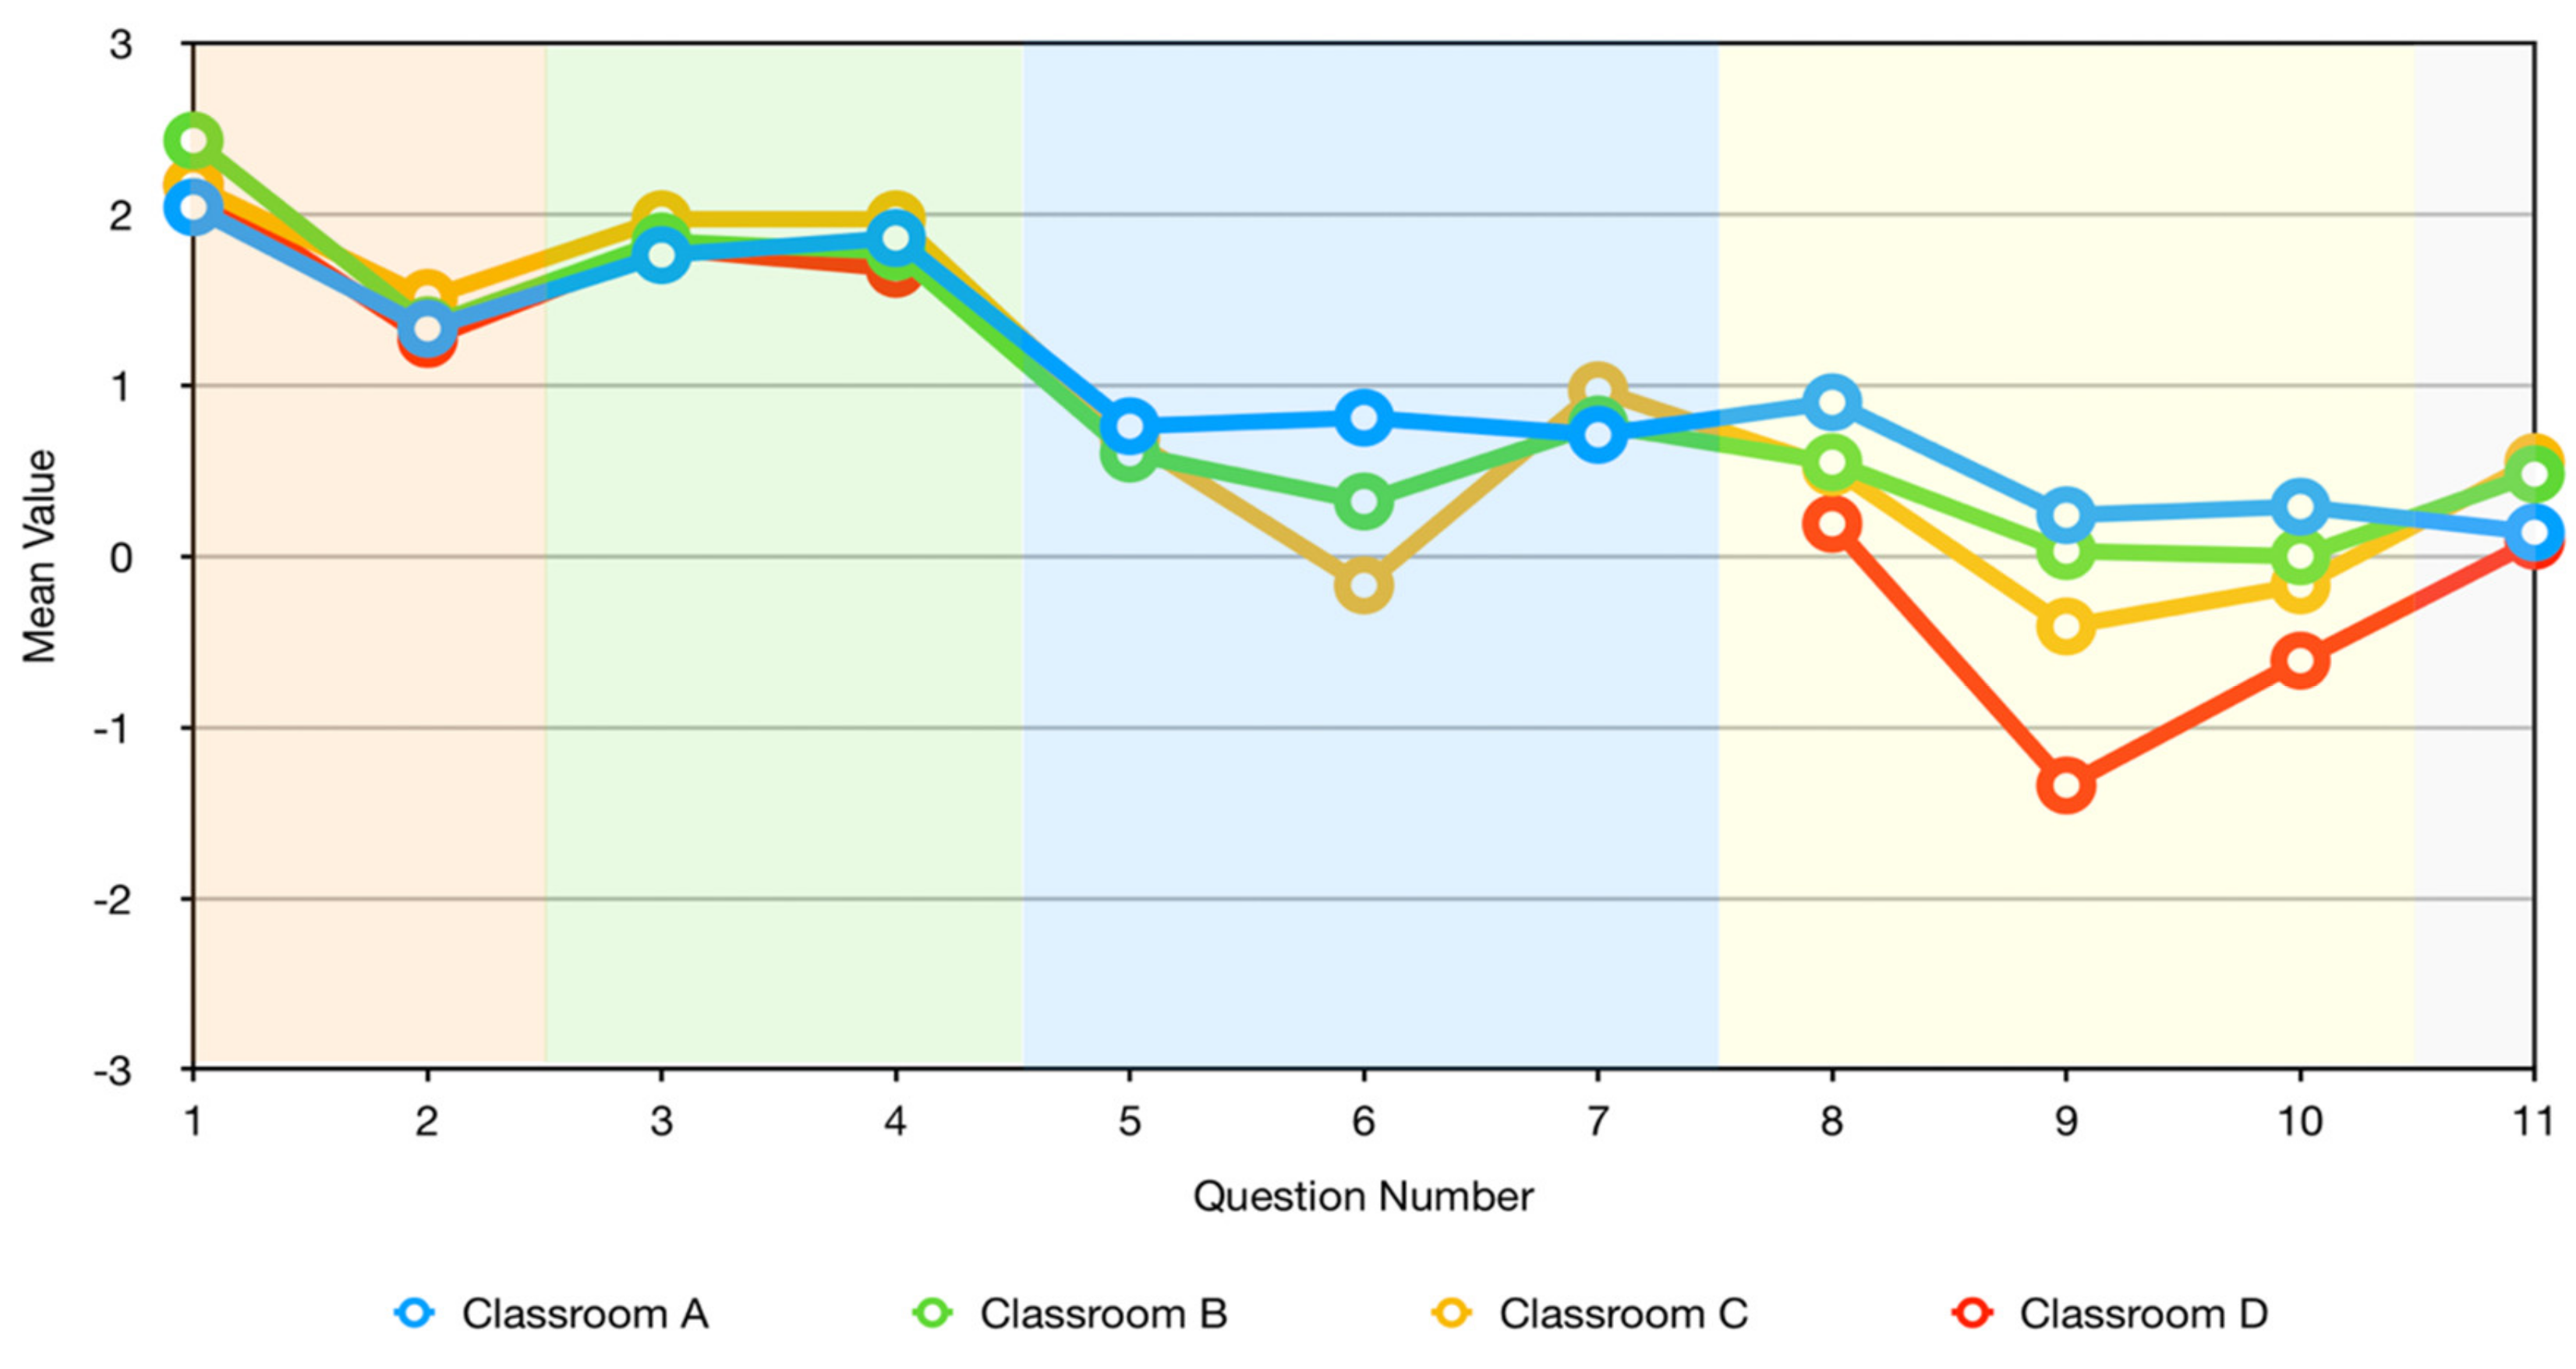
3.1.2. Task Performance and Visual Annoyance (Part B)
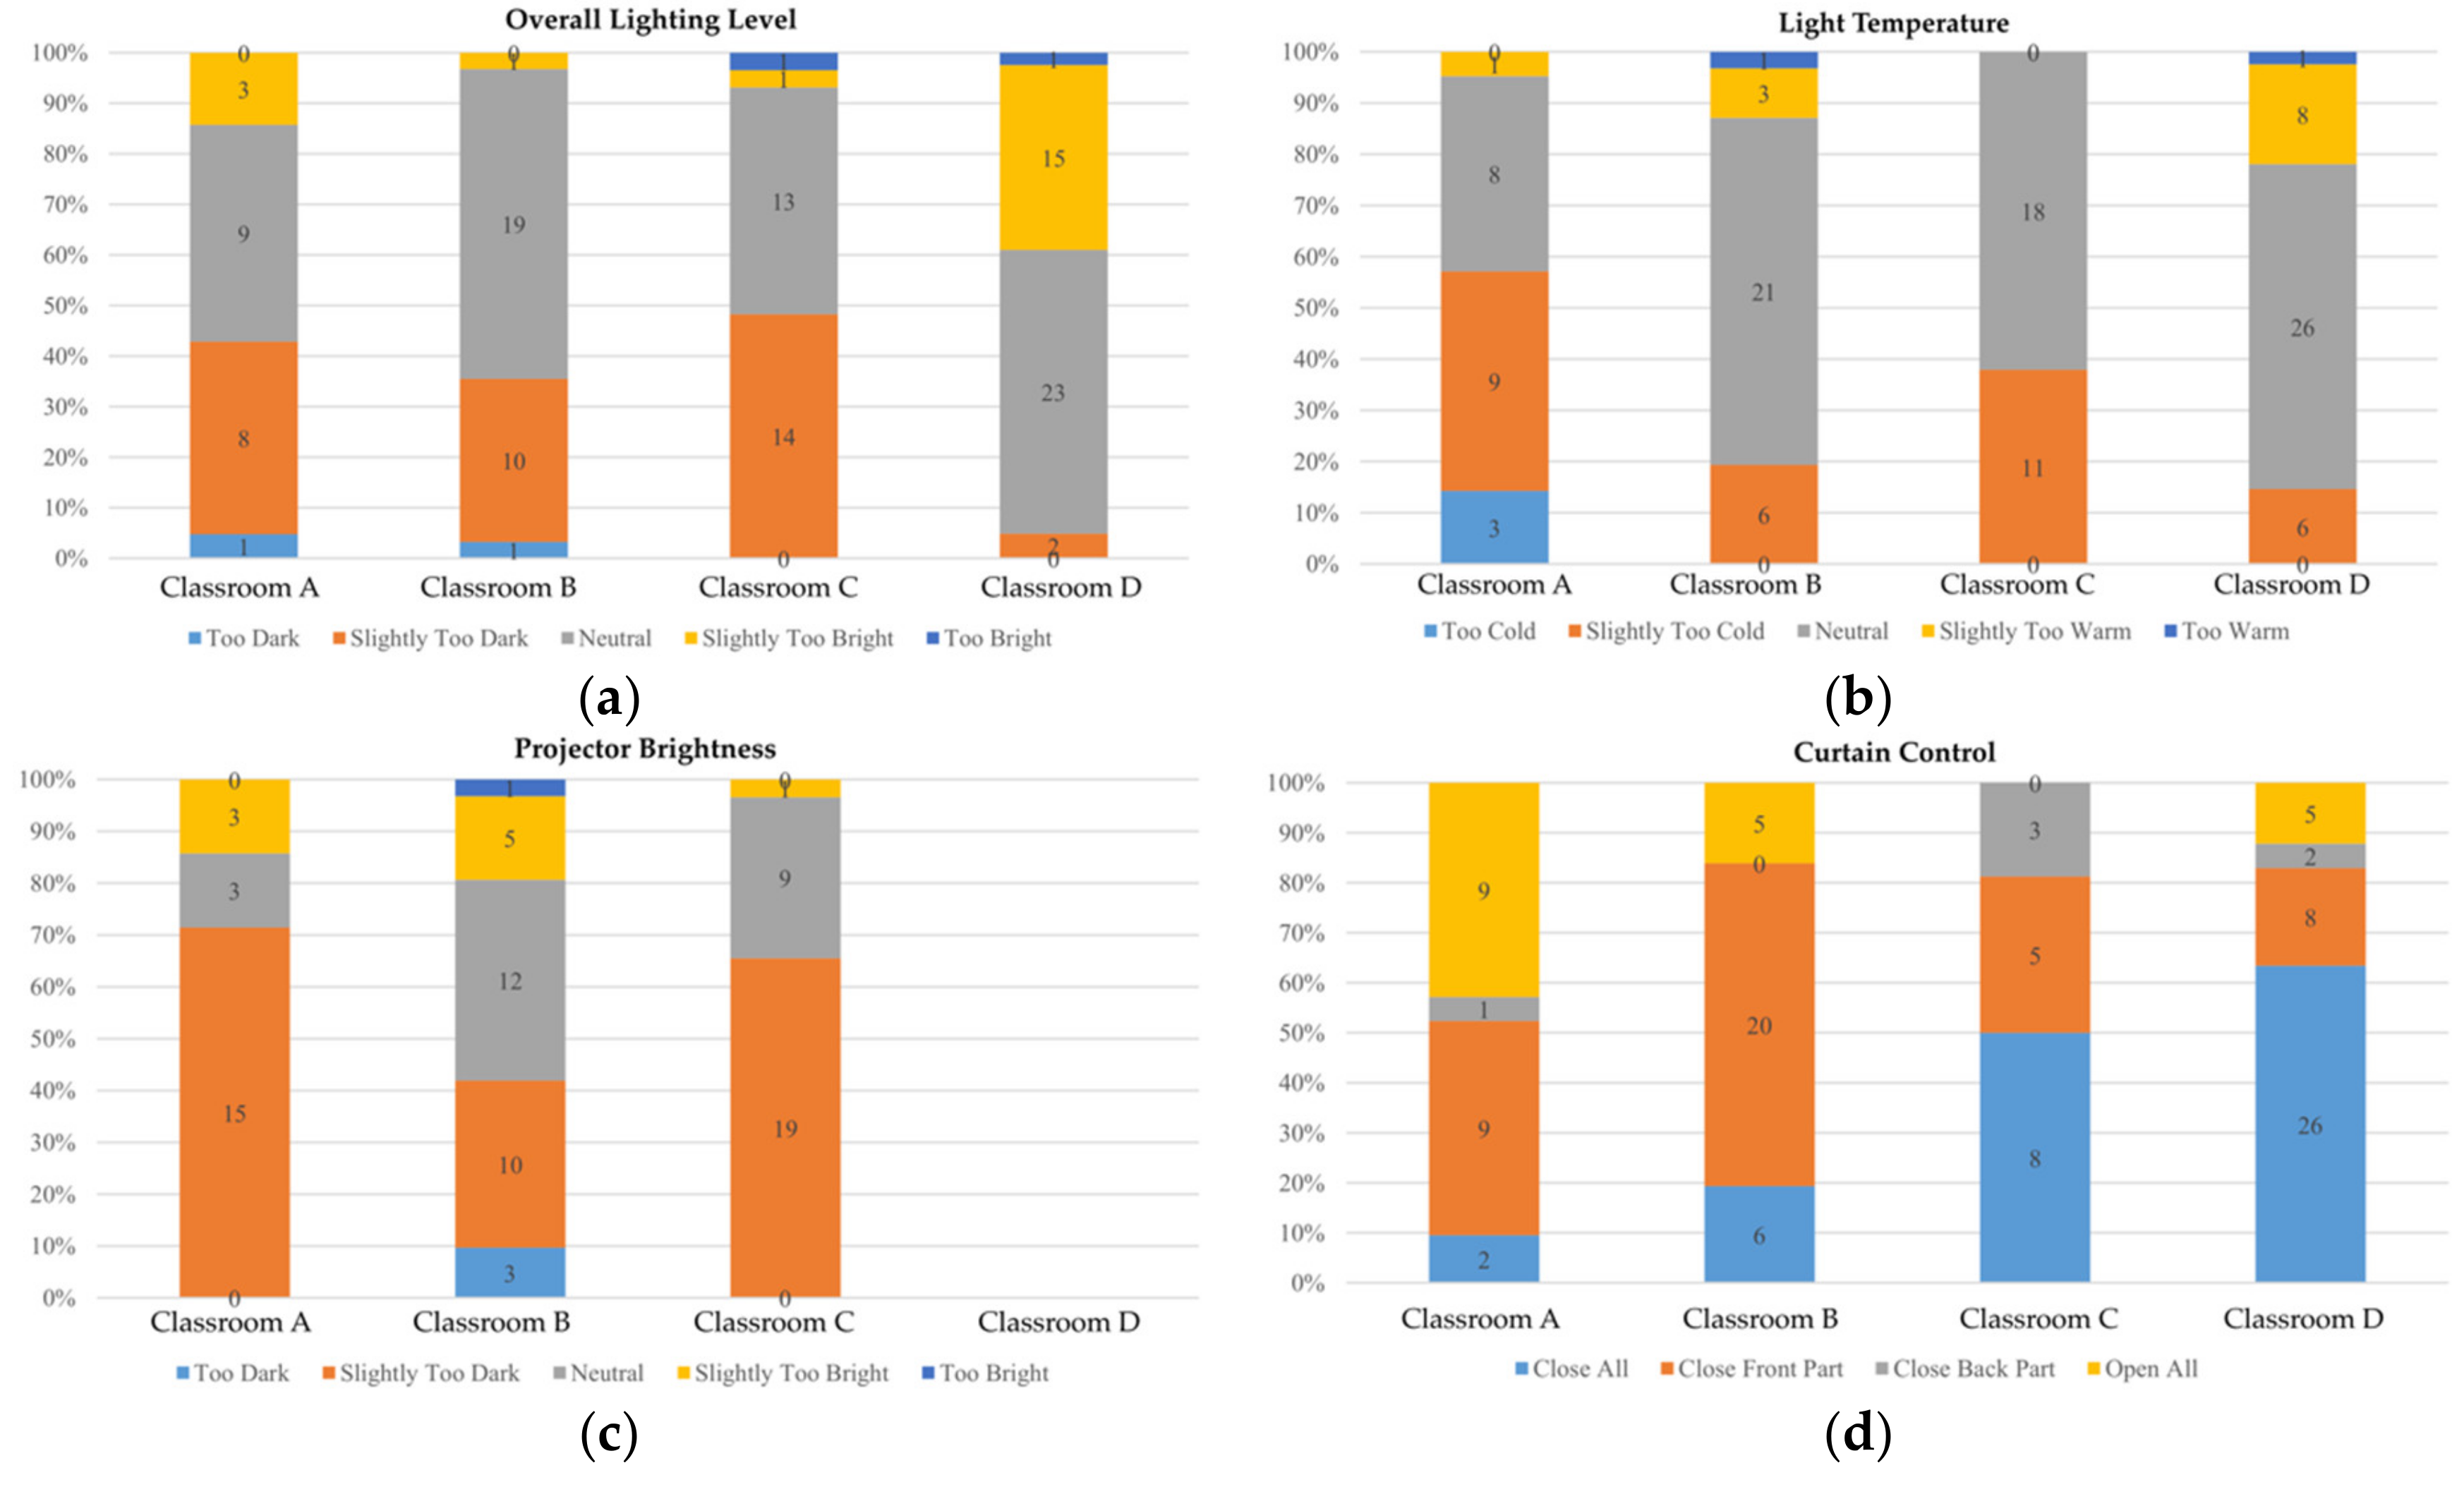
3.1.3. Preferences and Opinions (Part C)
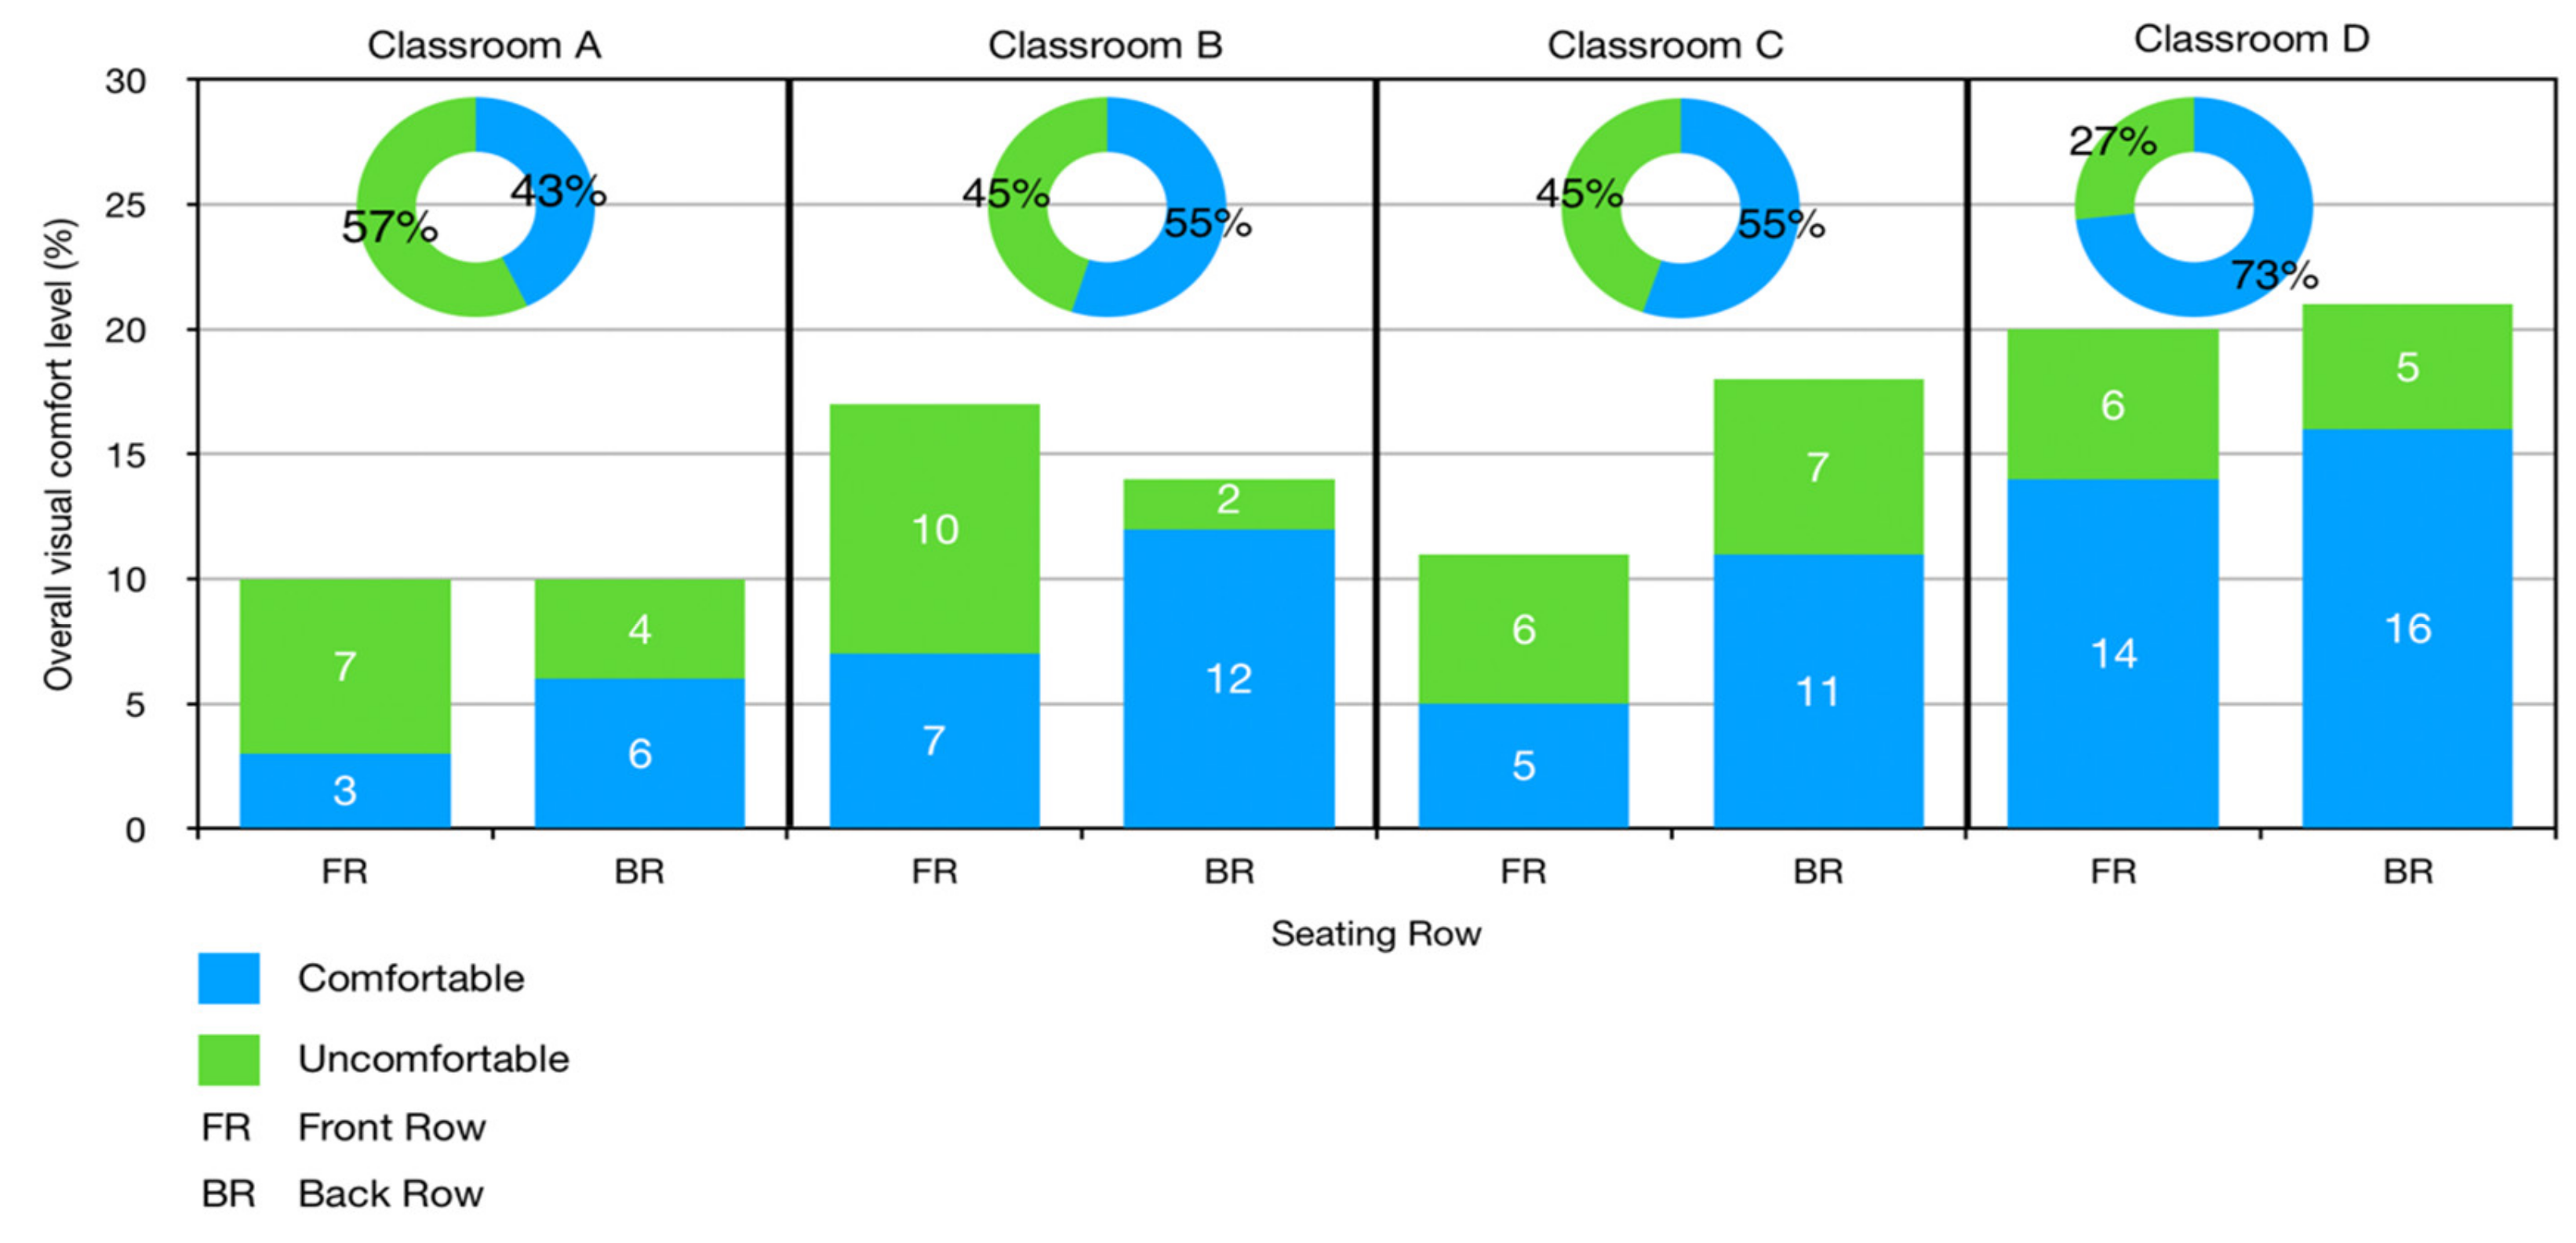
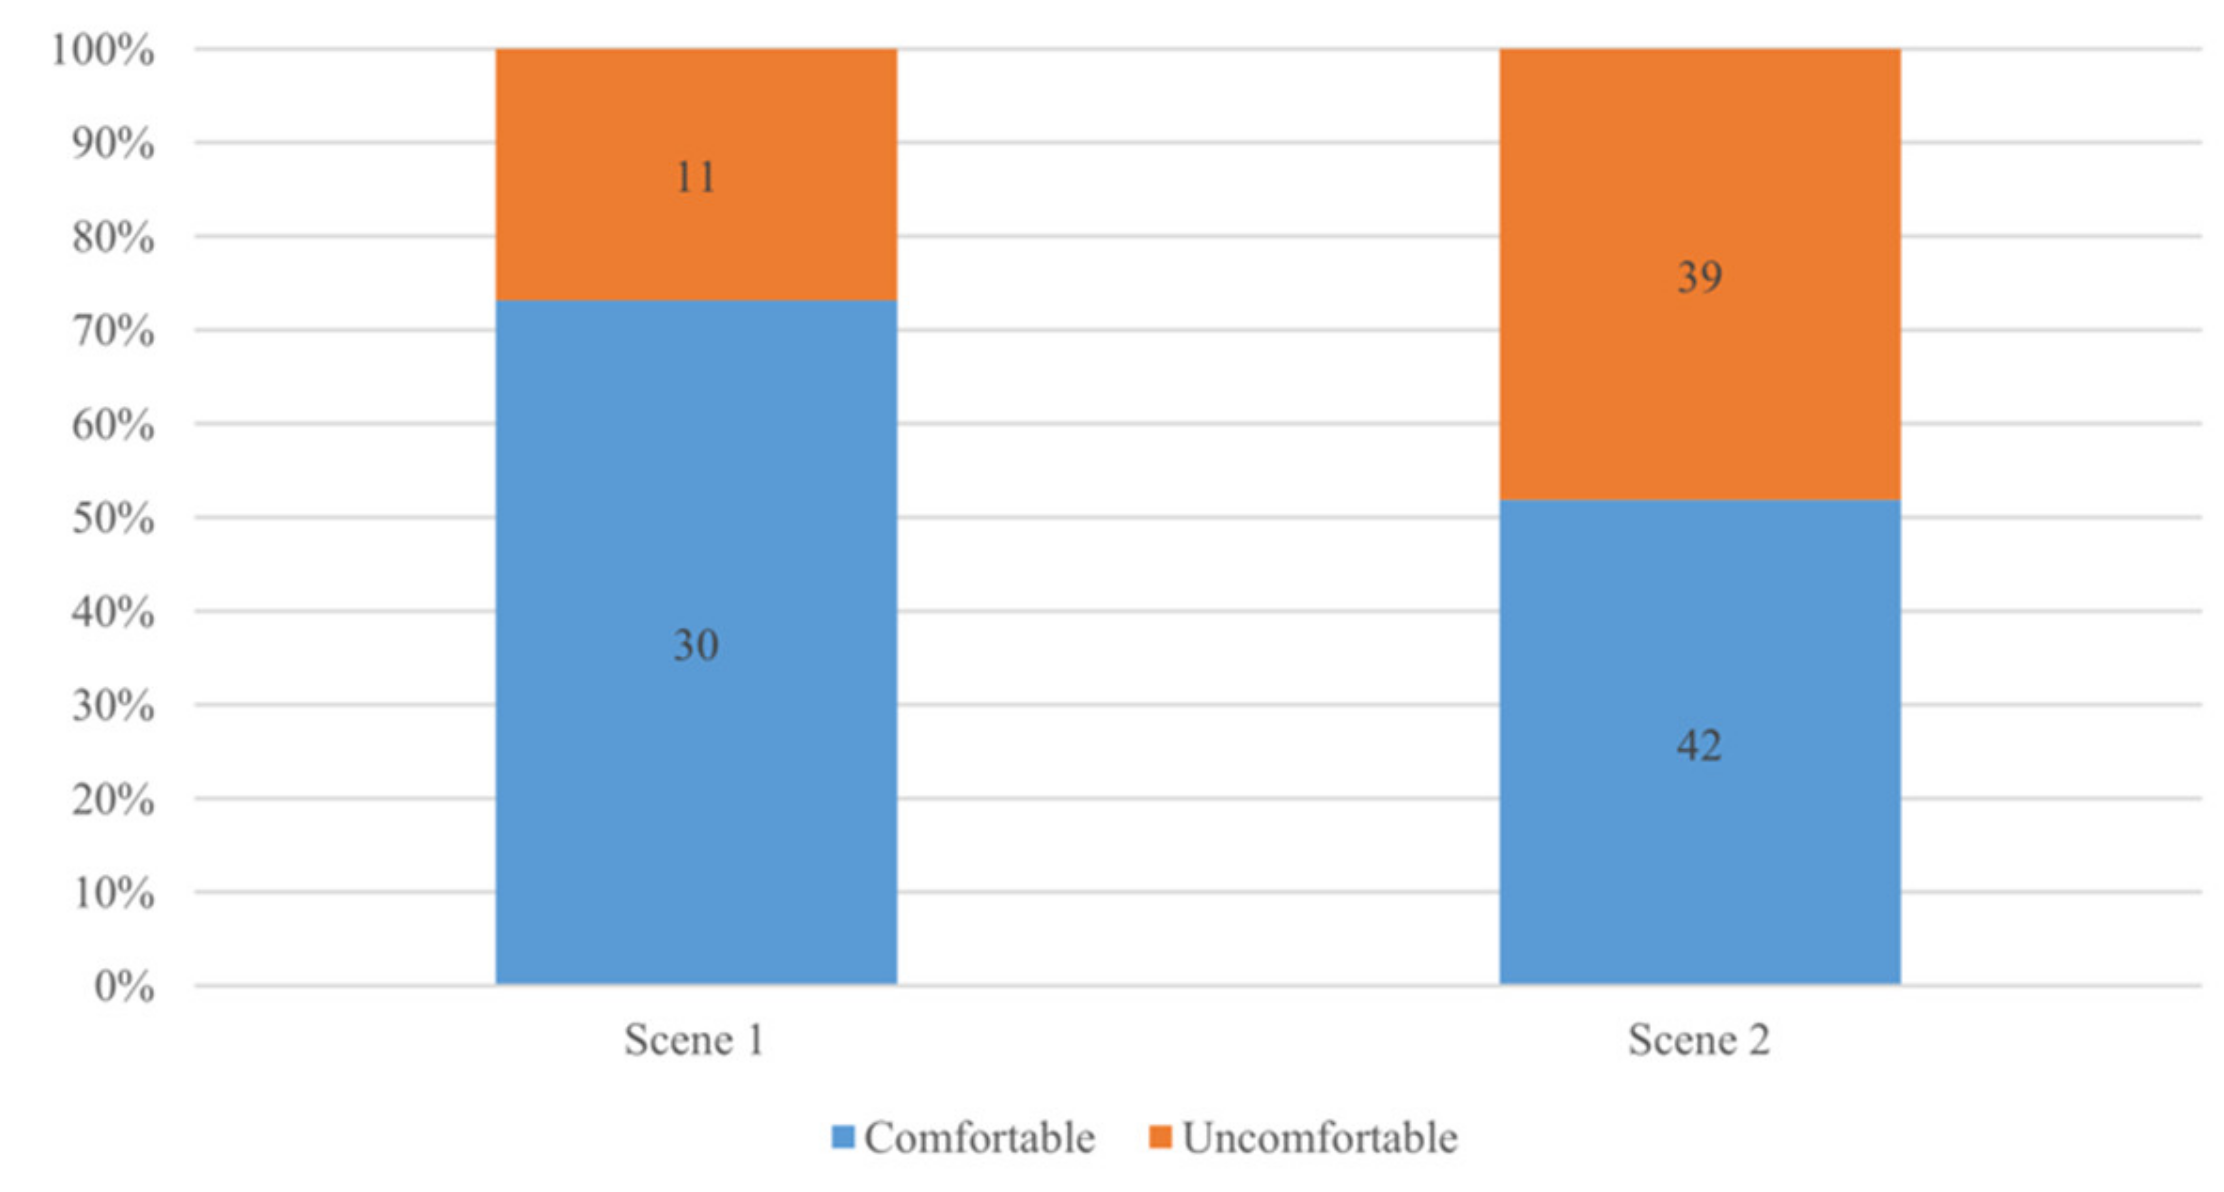
3.1.4. Overall Comfort Level (Part D)
3.2. Field Measurement Result
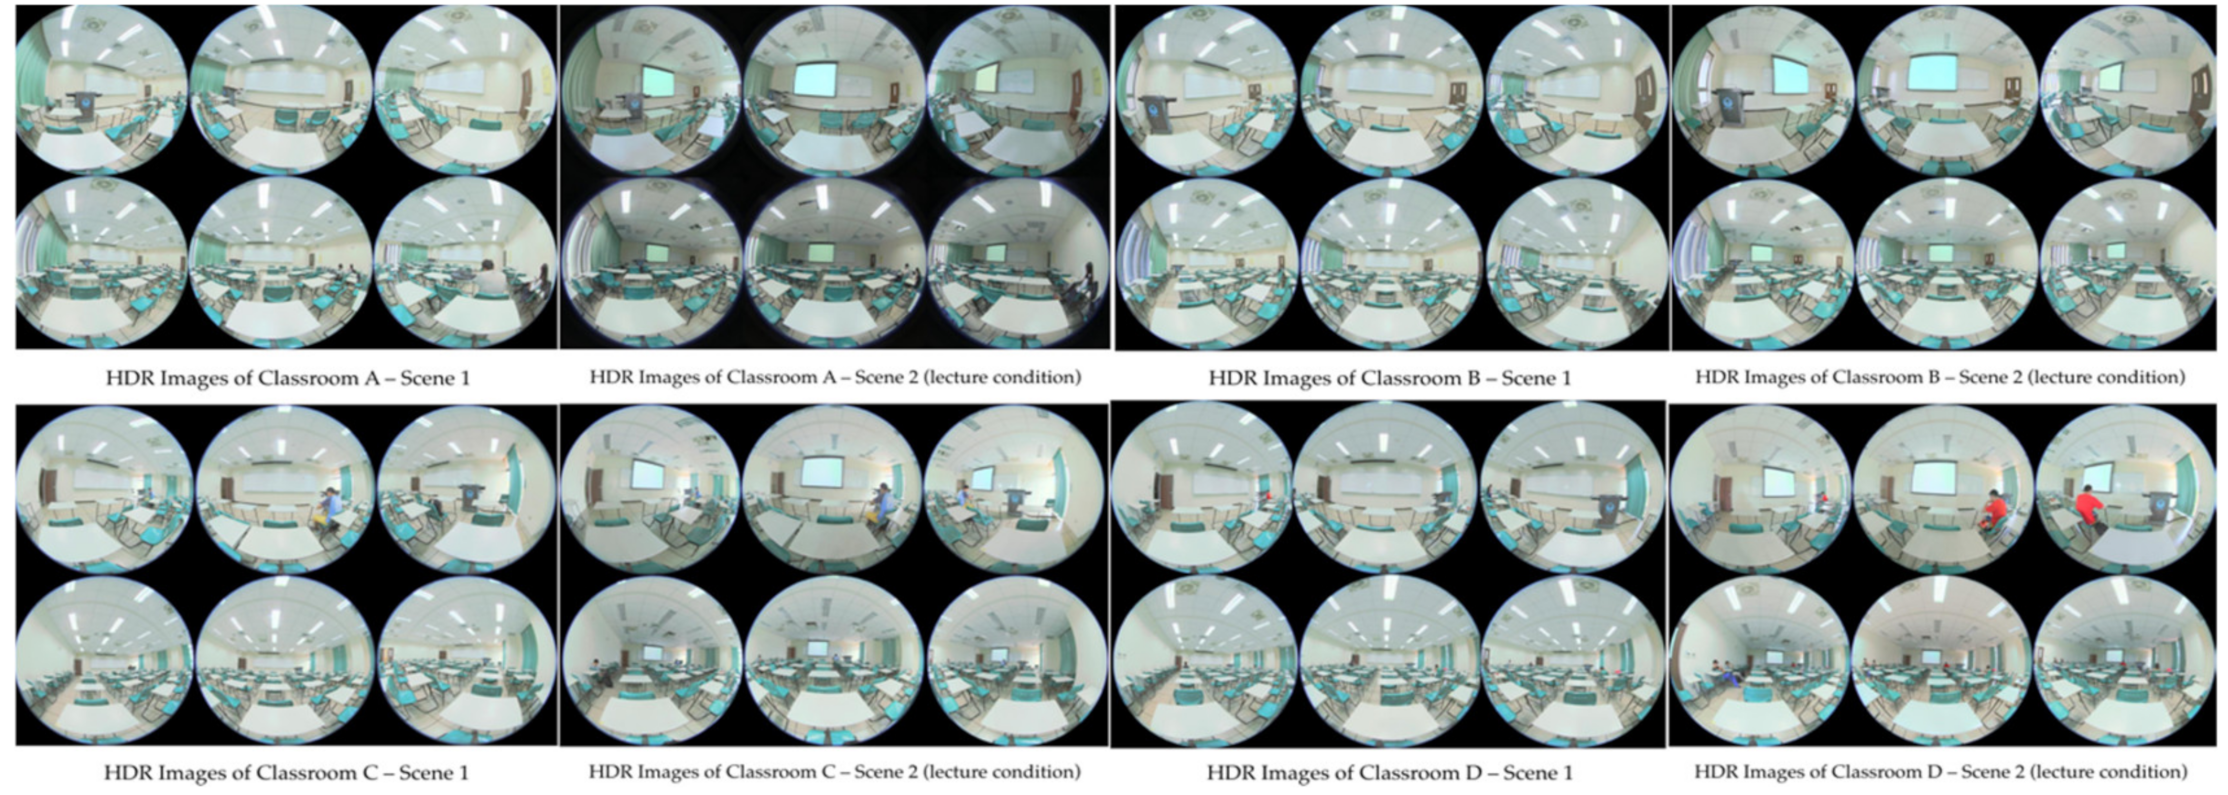
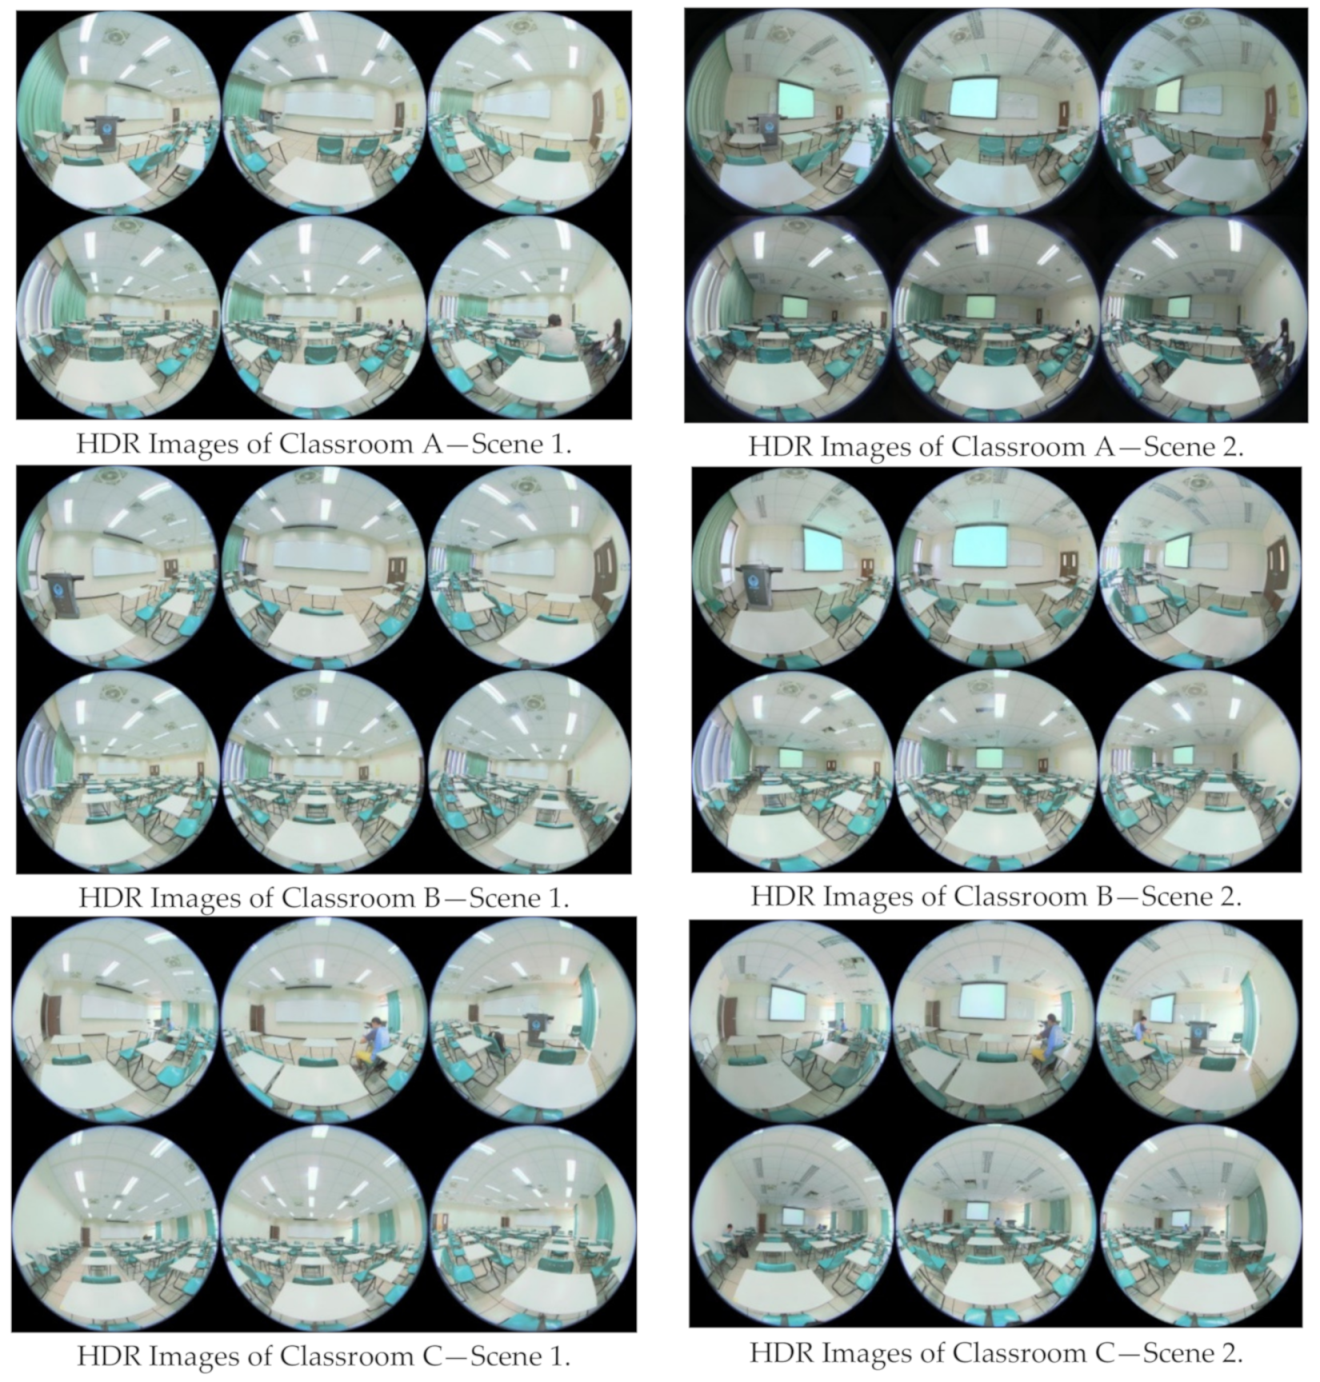
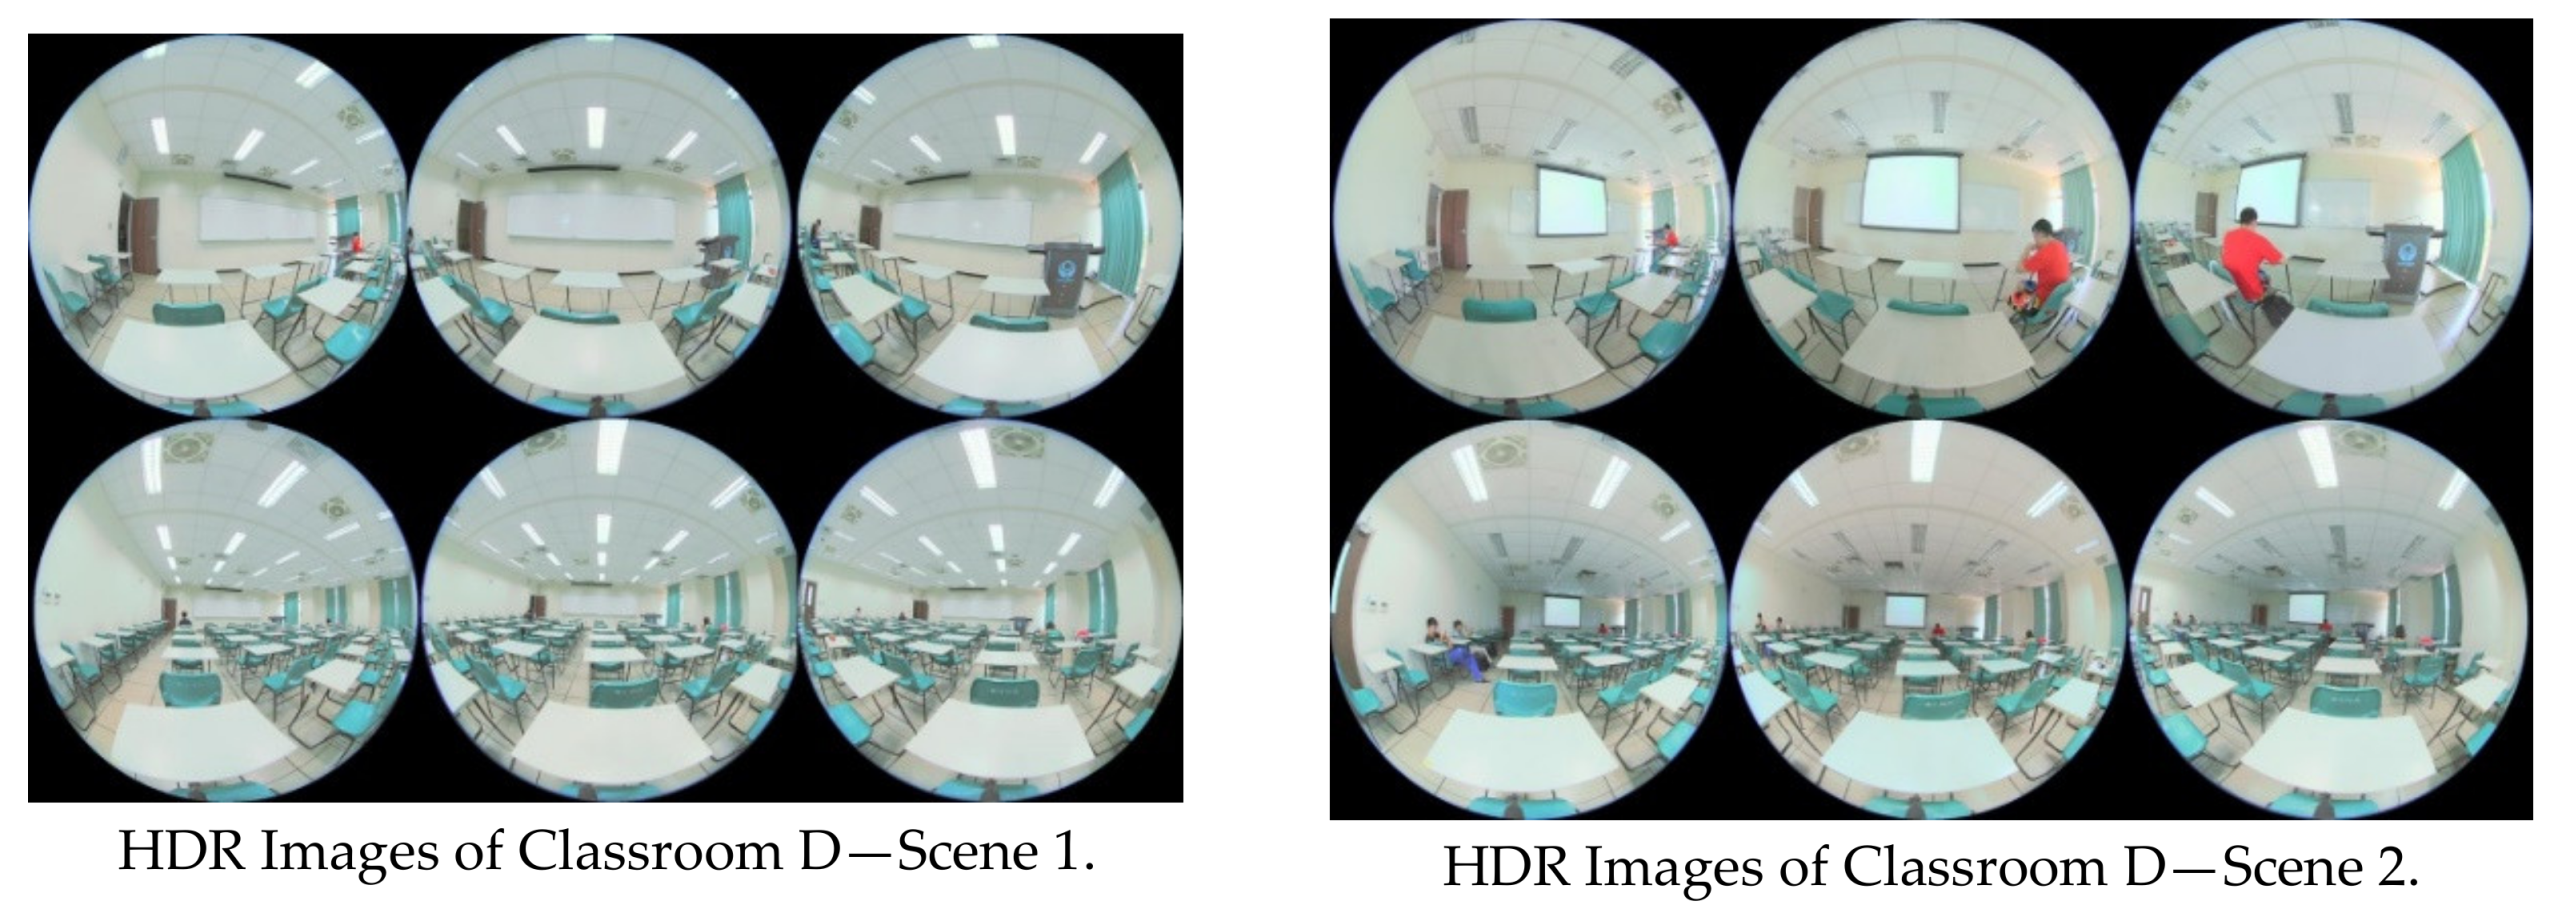
3.2.1. HDR Photo Results
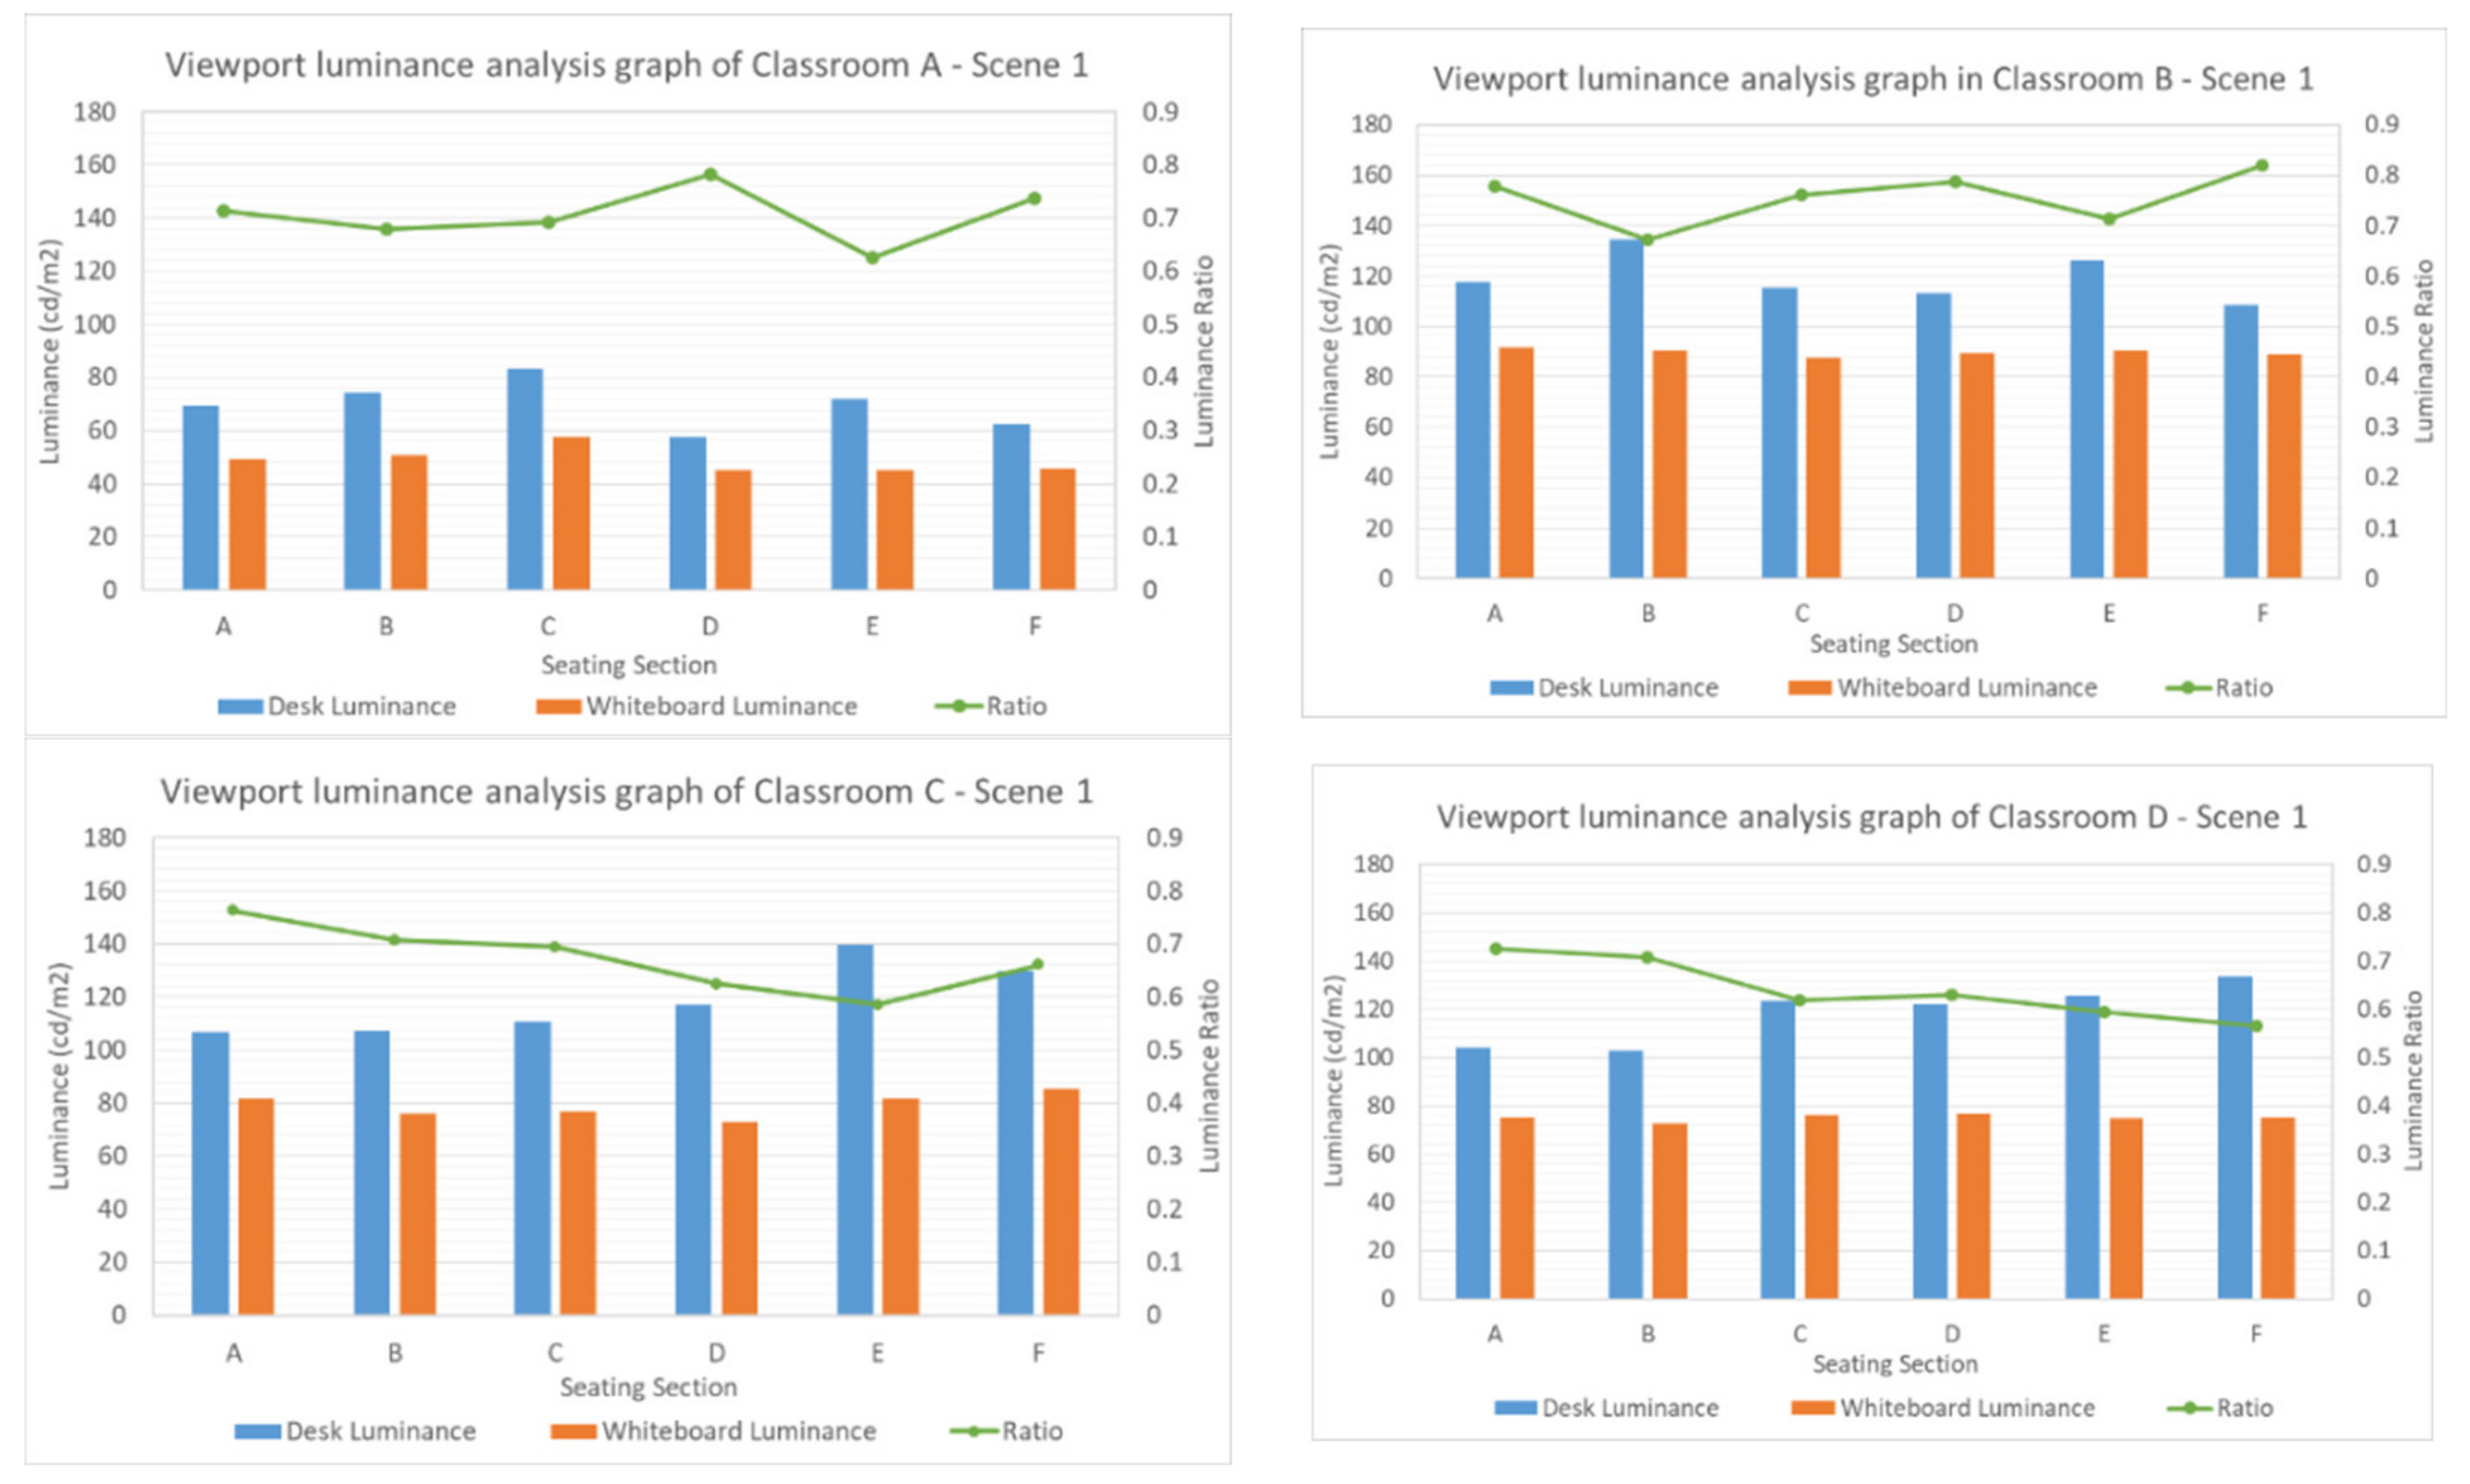
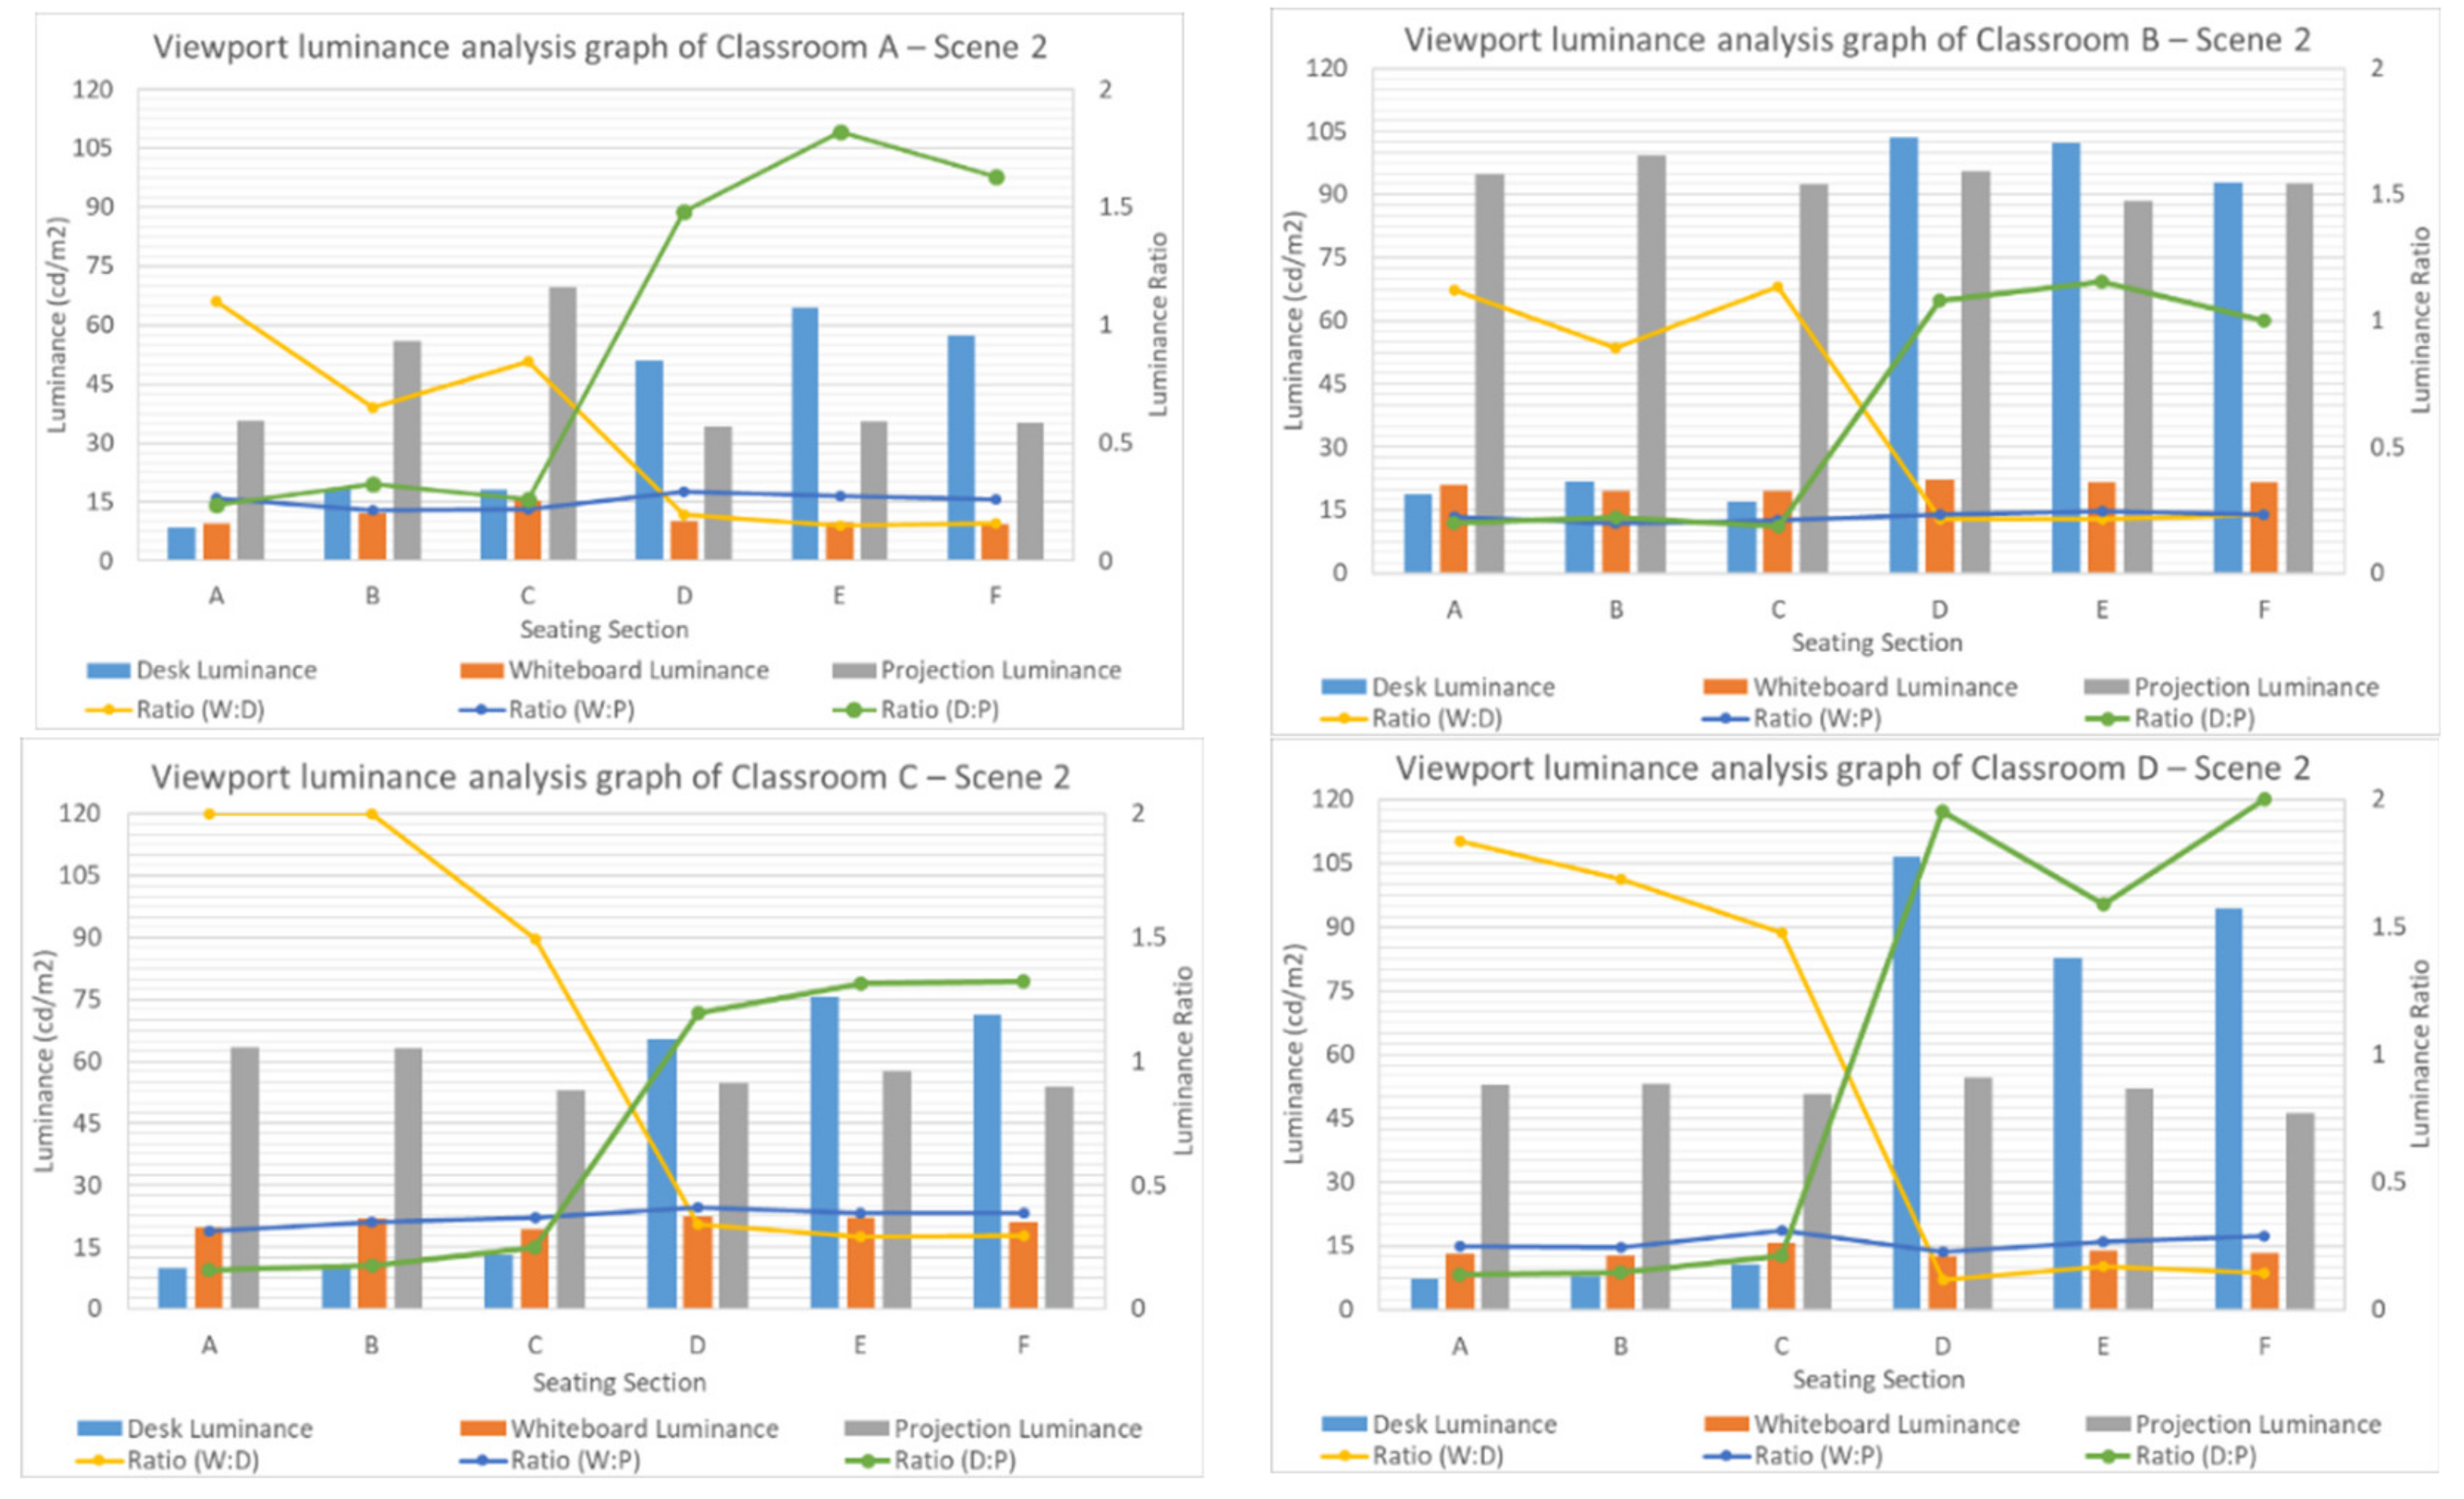
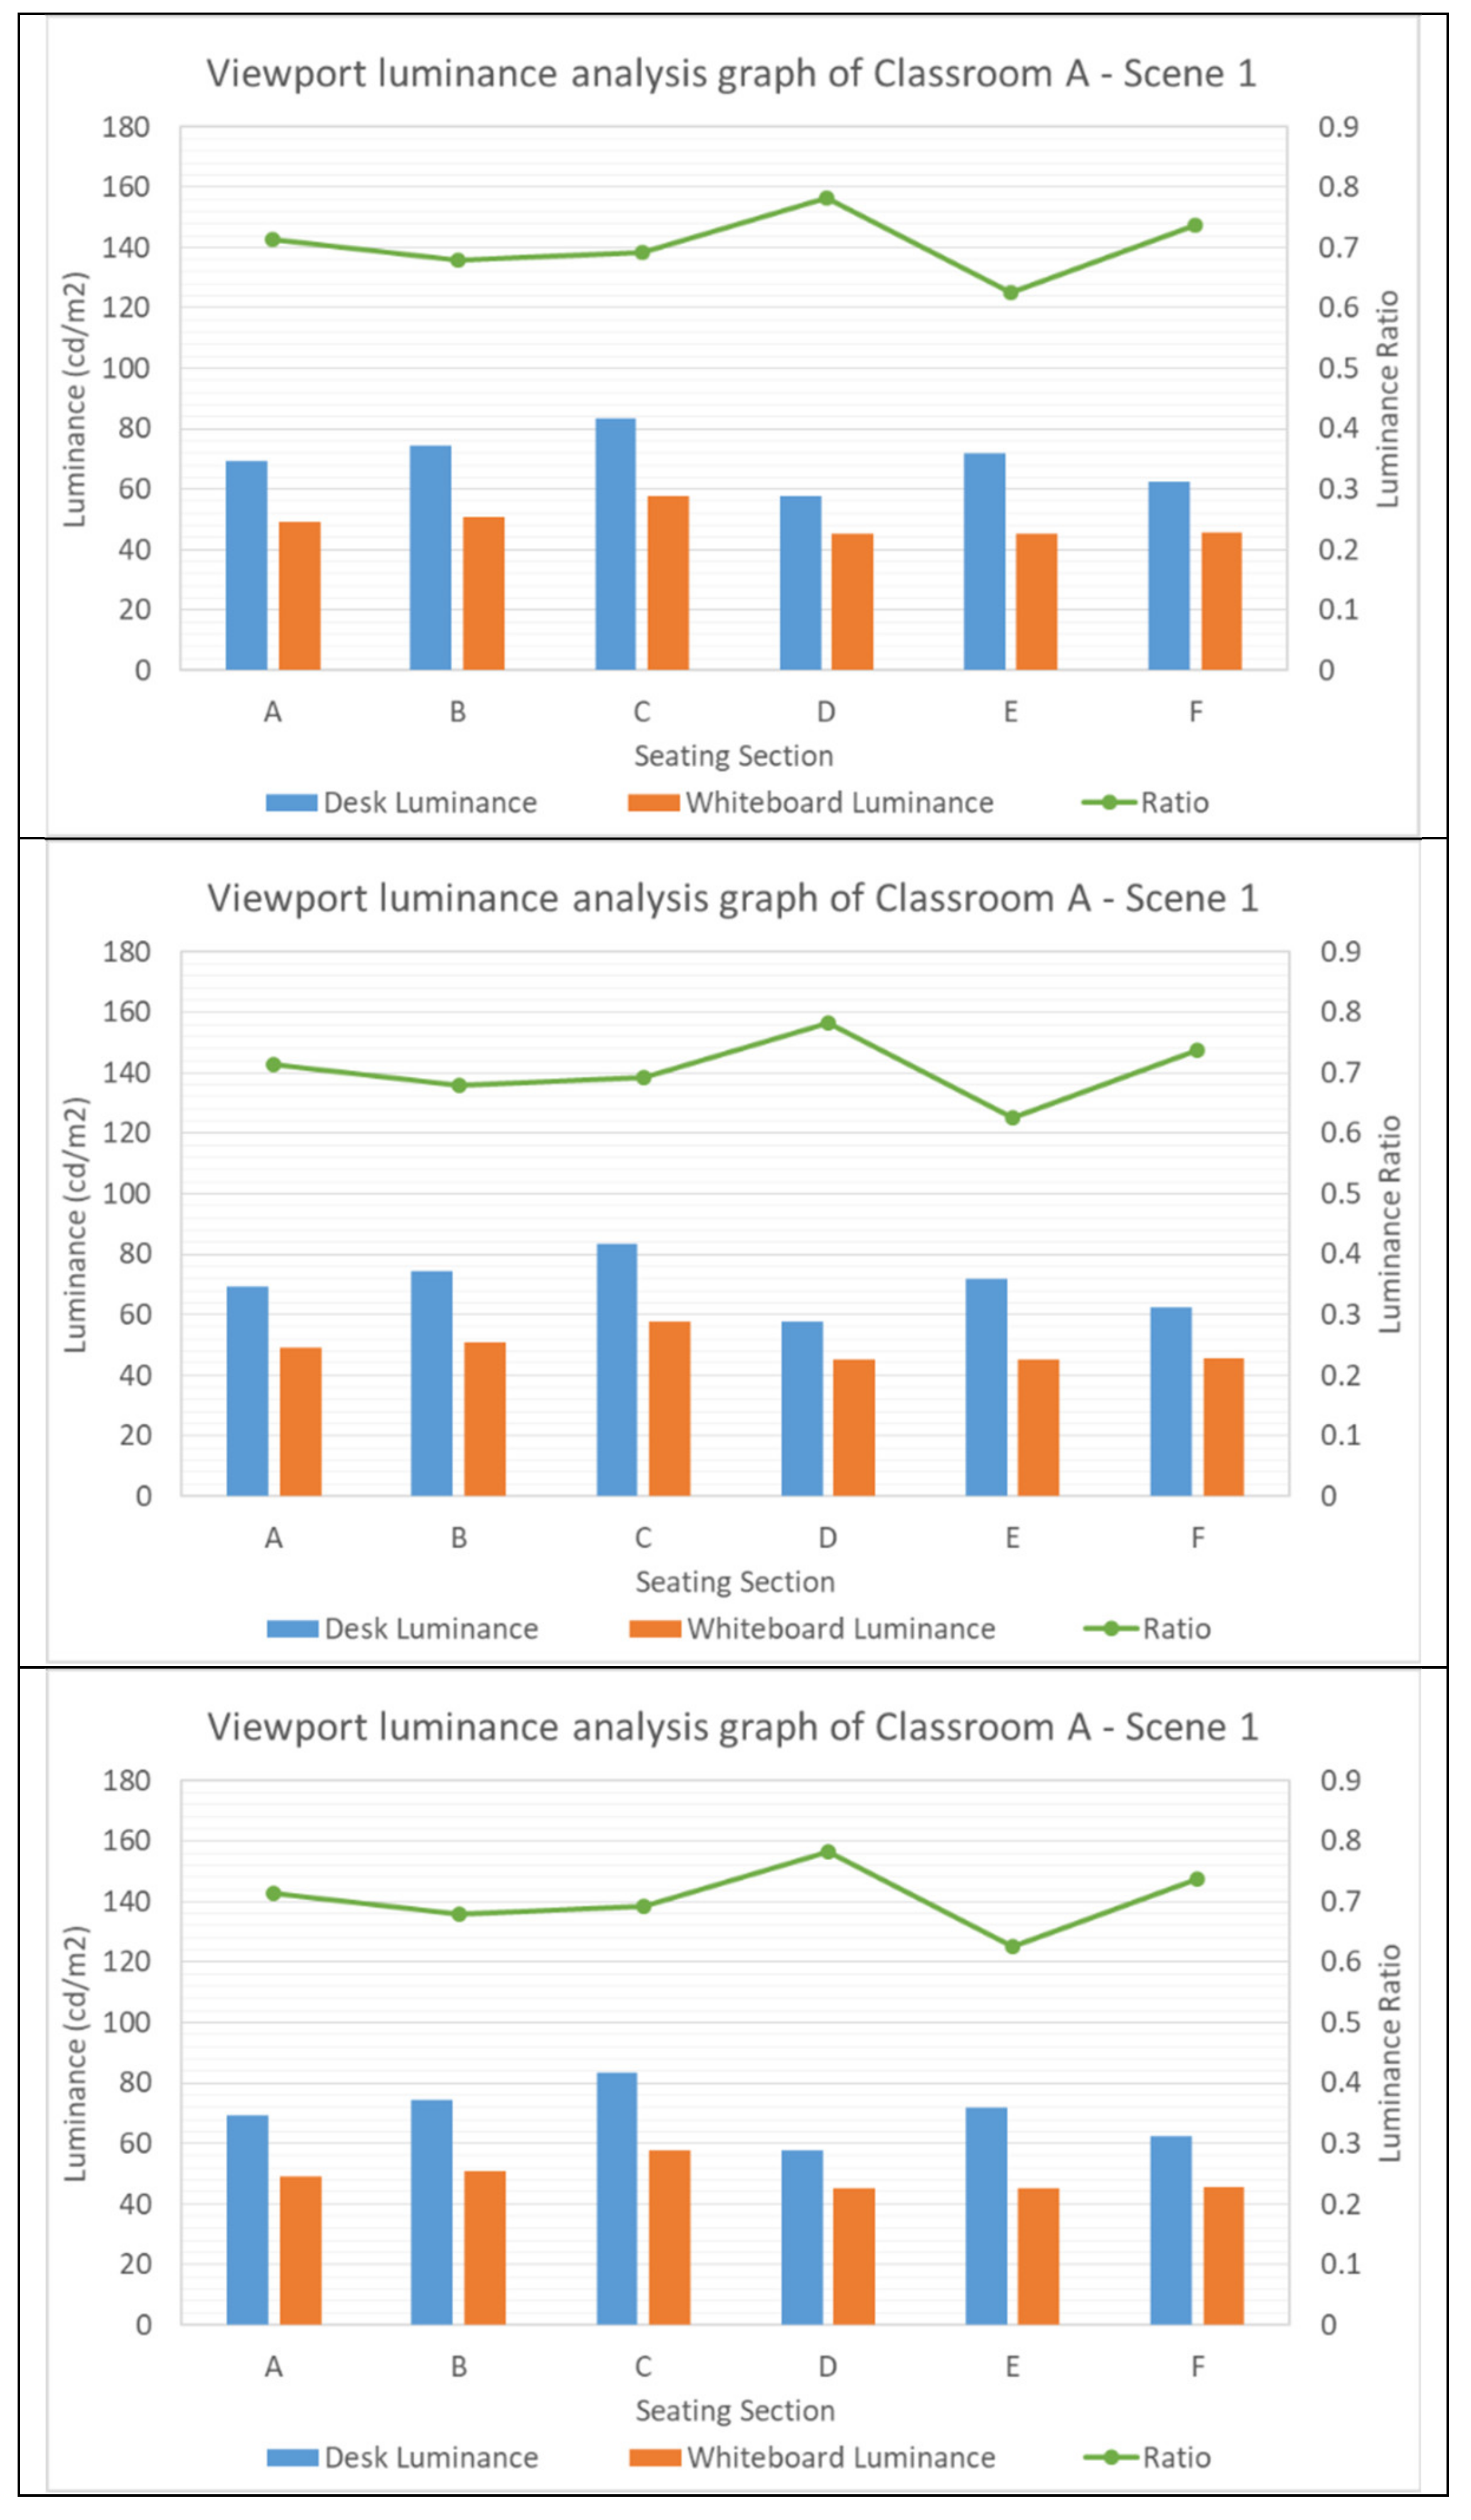
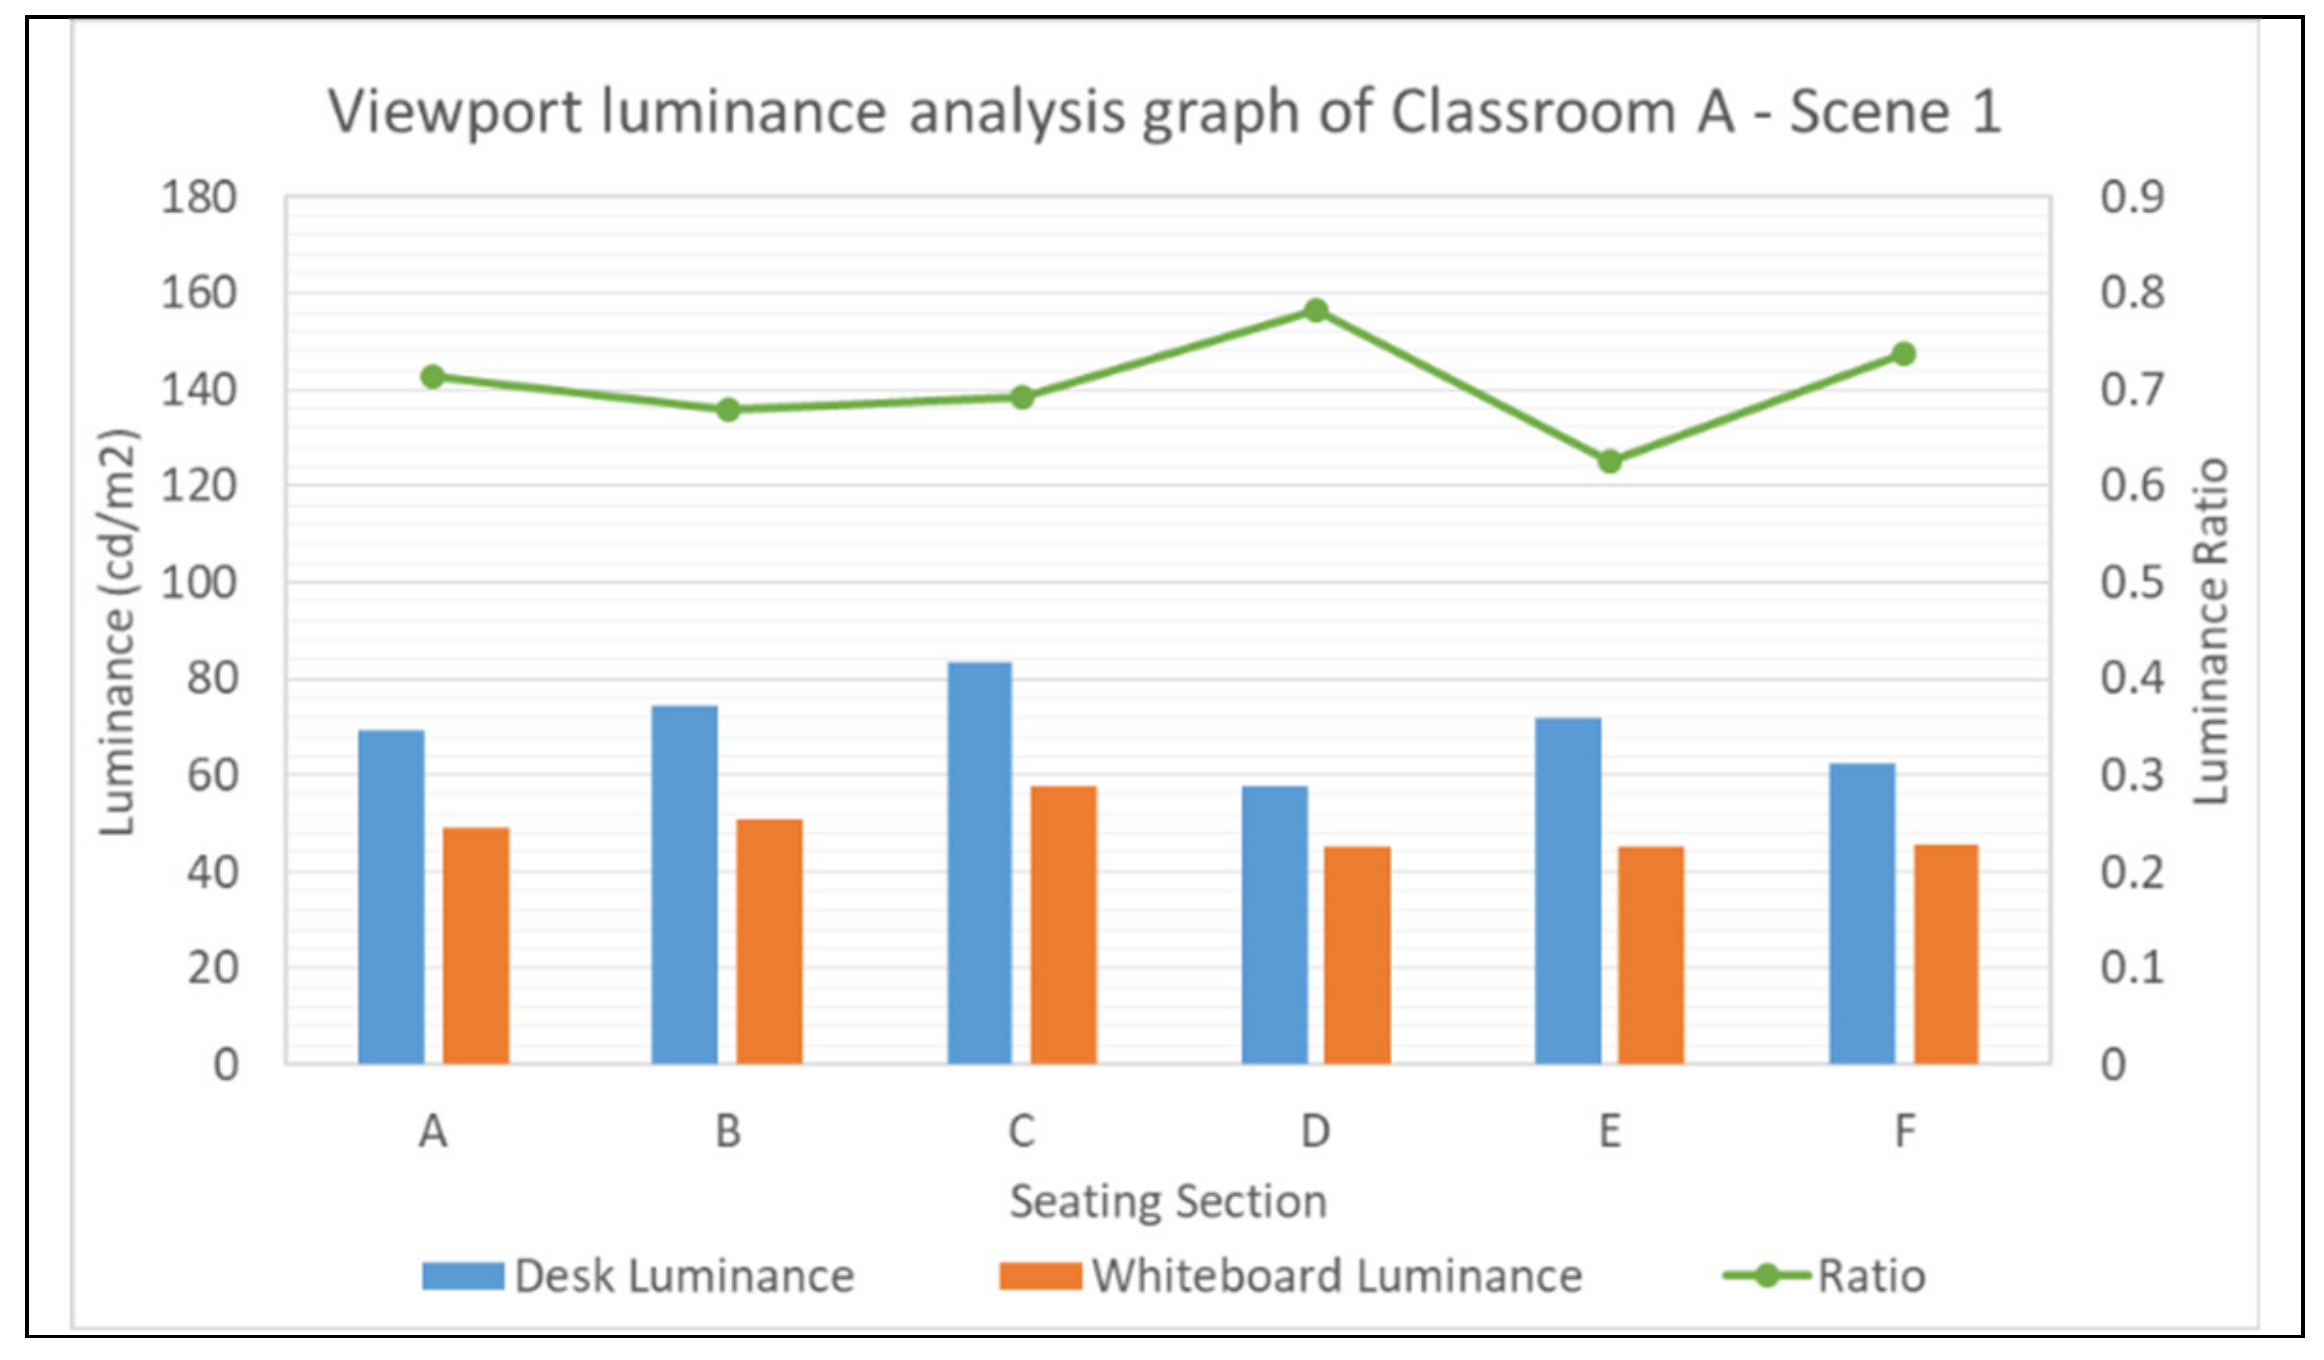
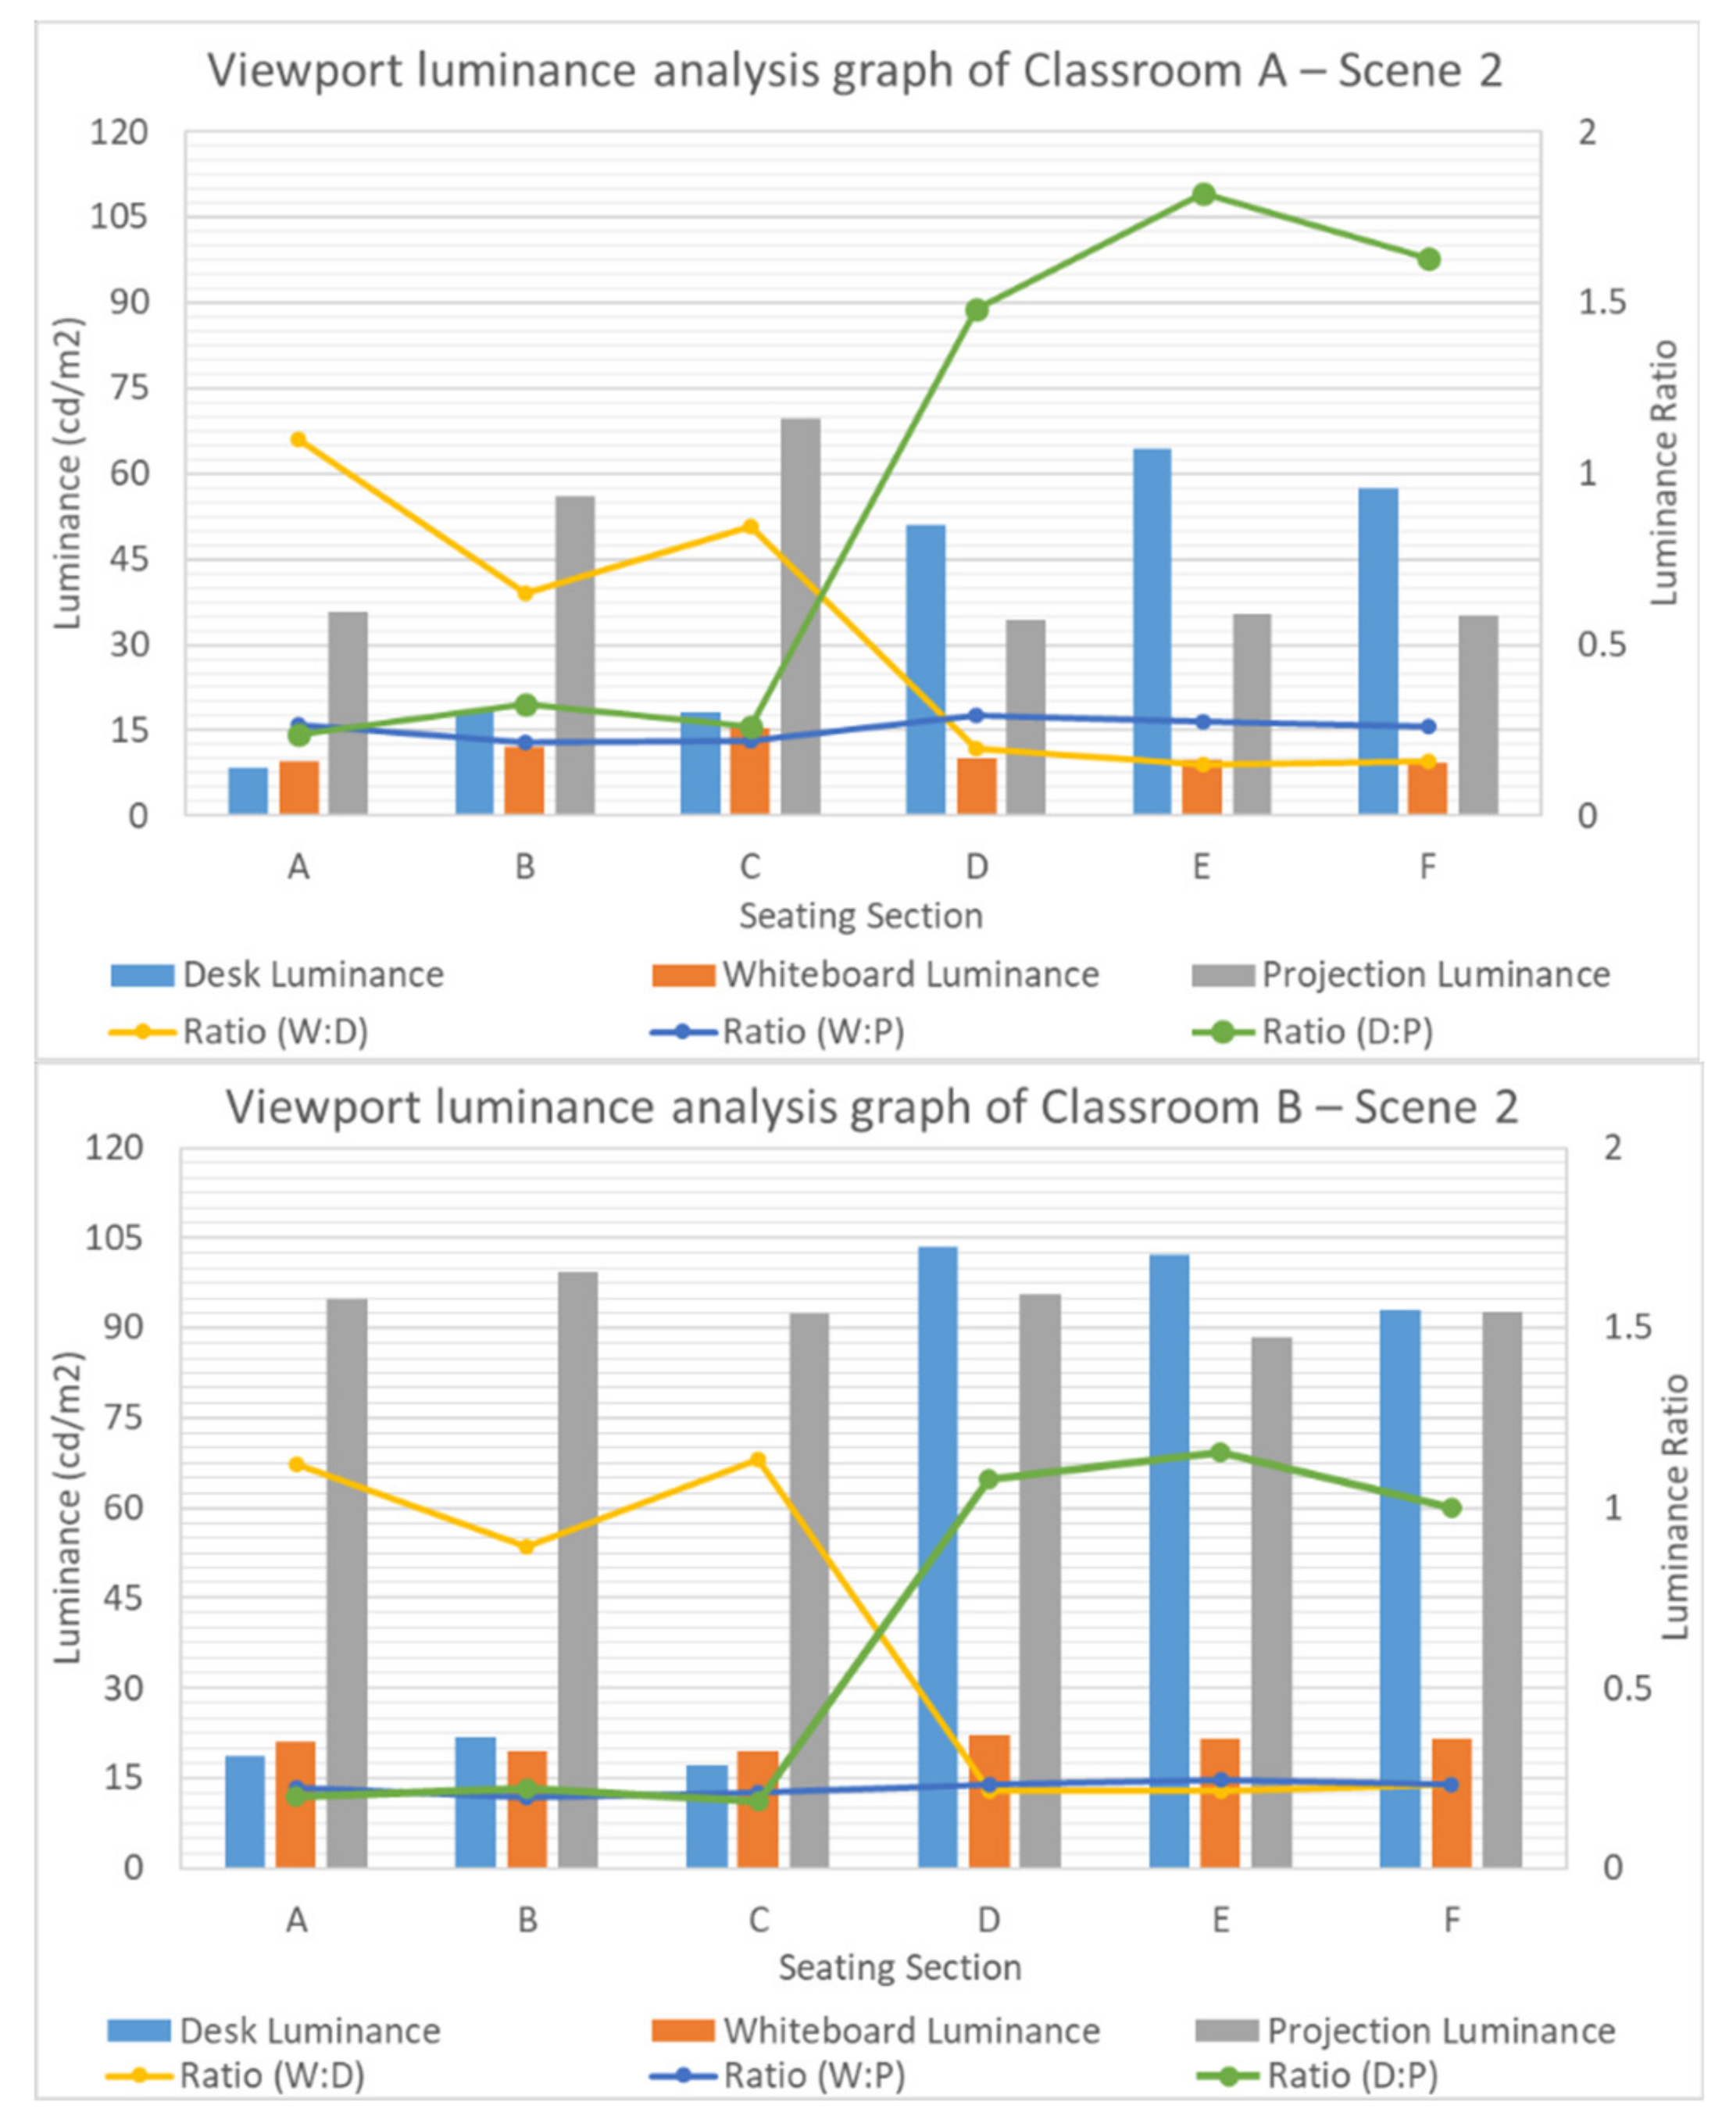
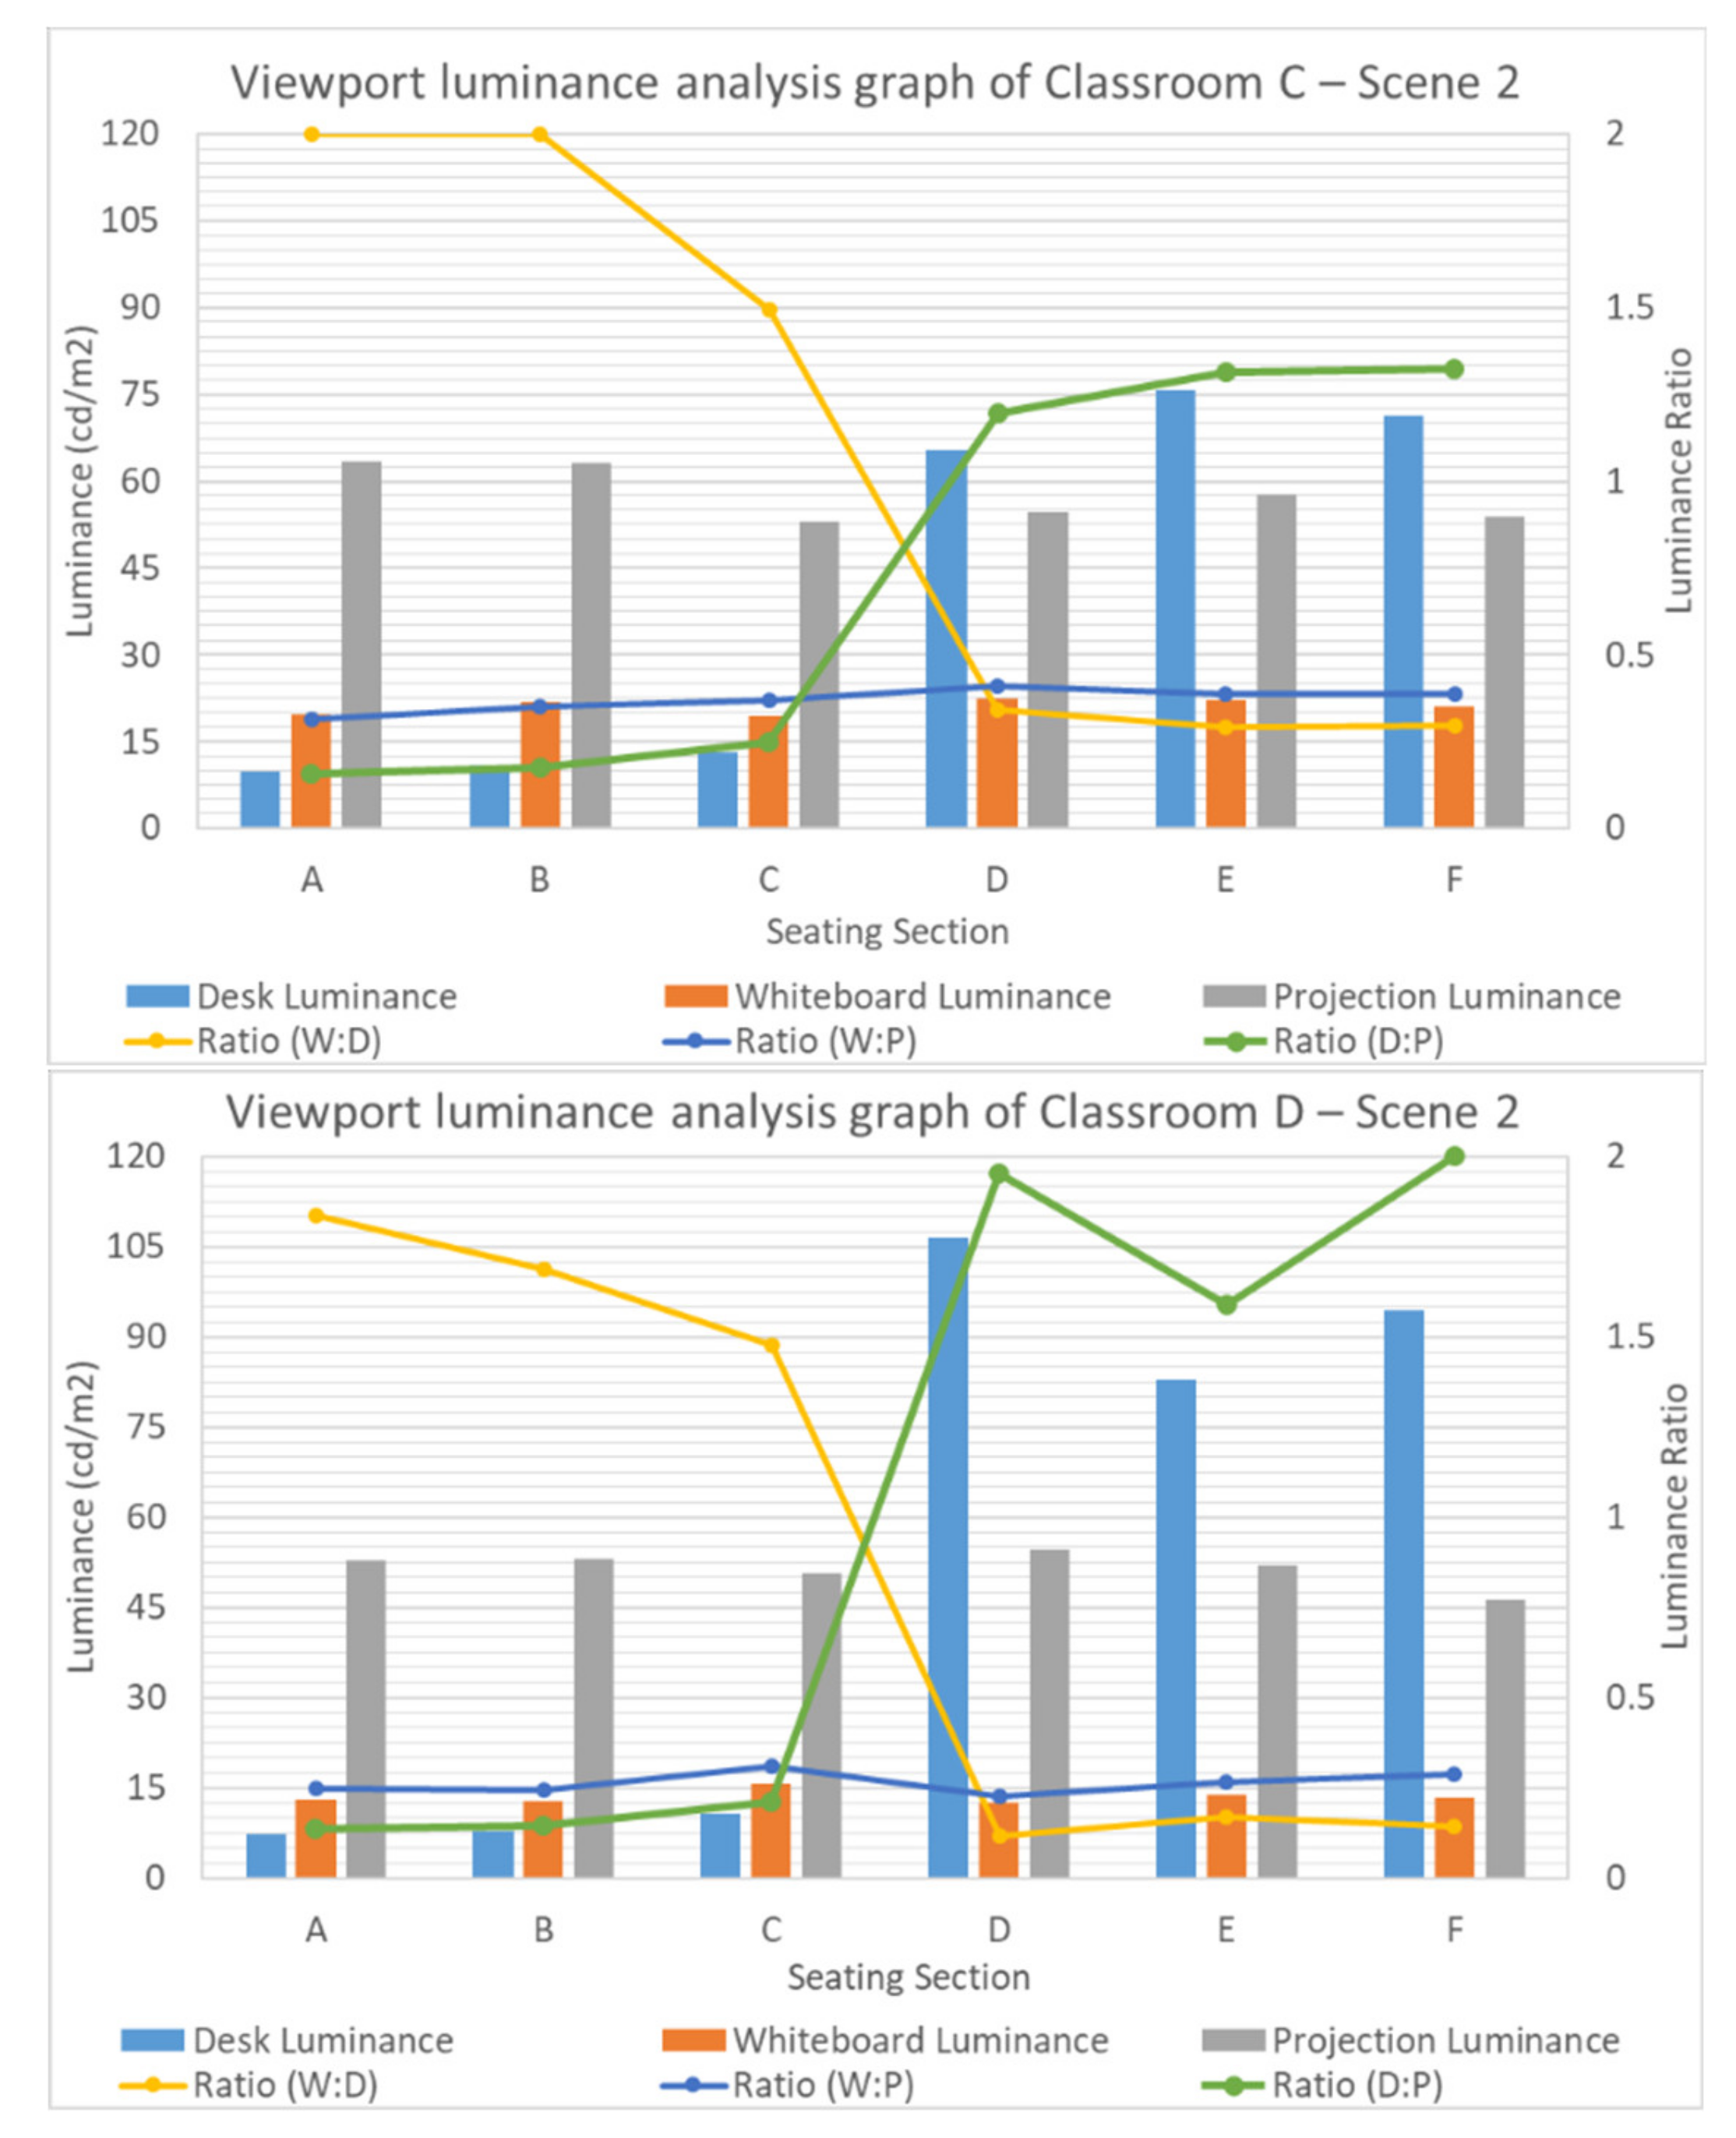
3.2.2. Viewport Luminance Analysis
Viewport Luminance Analysis for Scene 1
Viewport Luminance Analysis for Scene 2
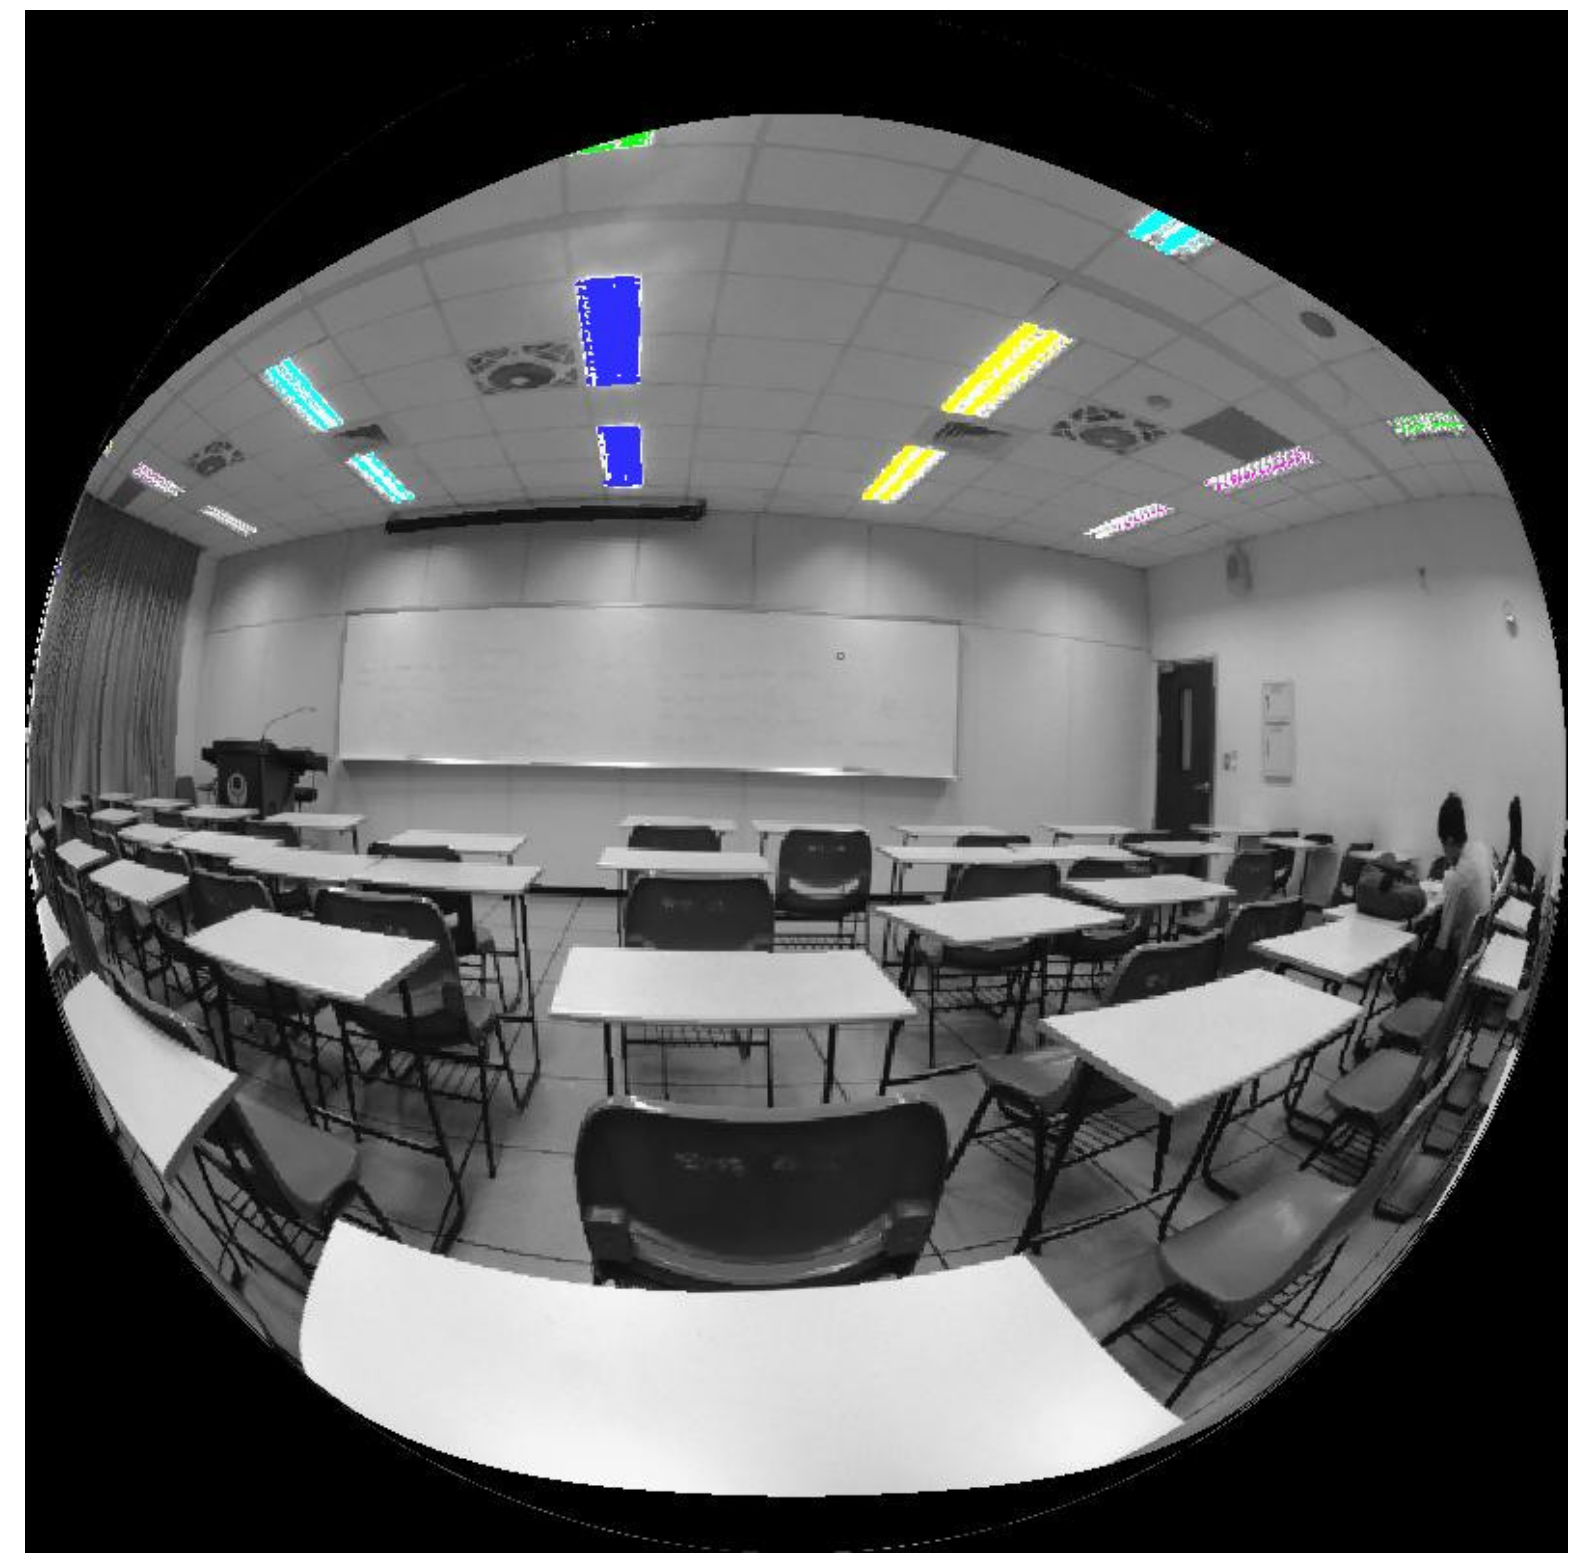
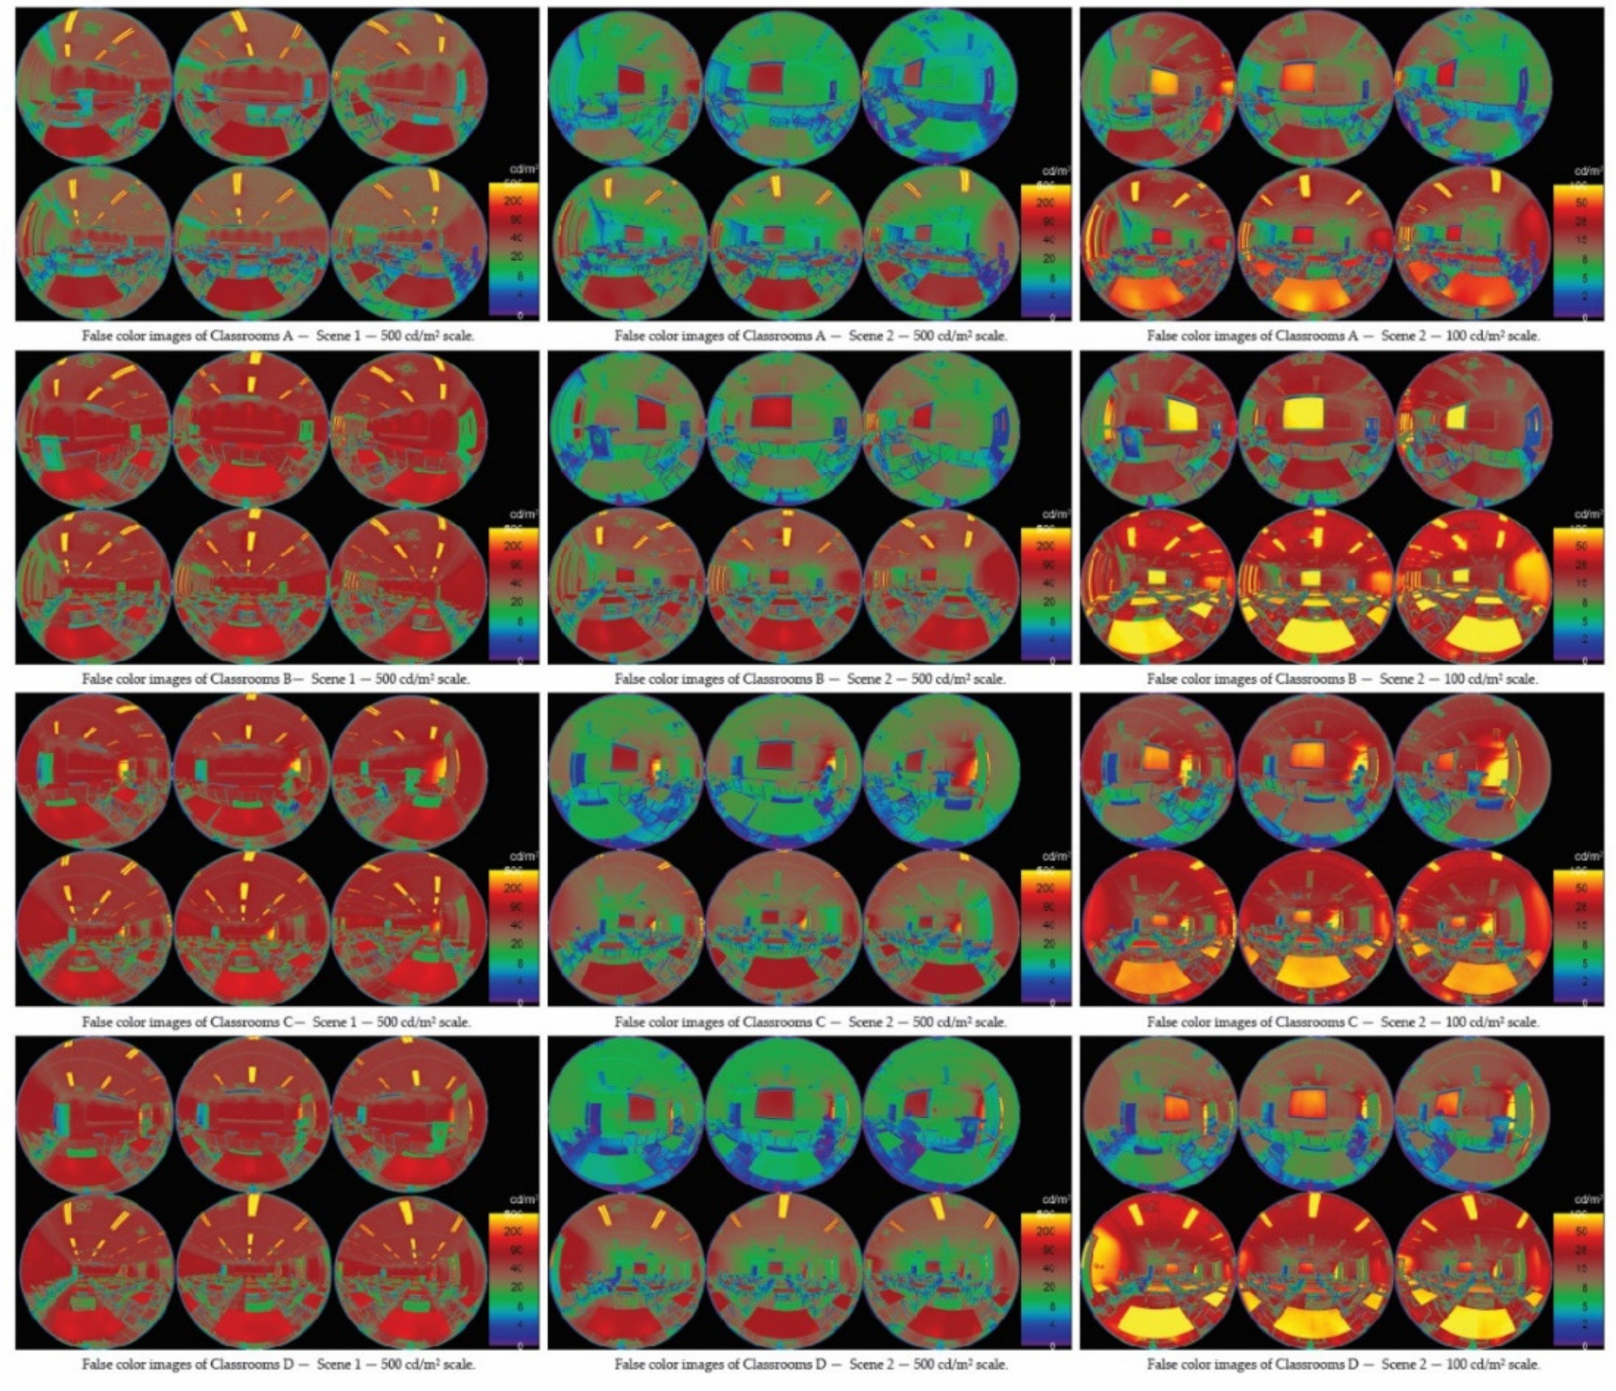
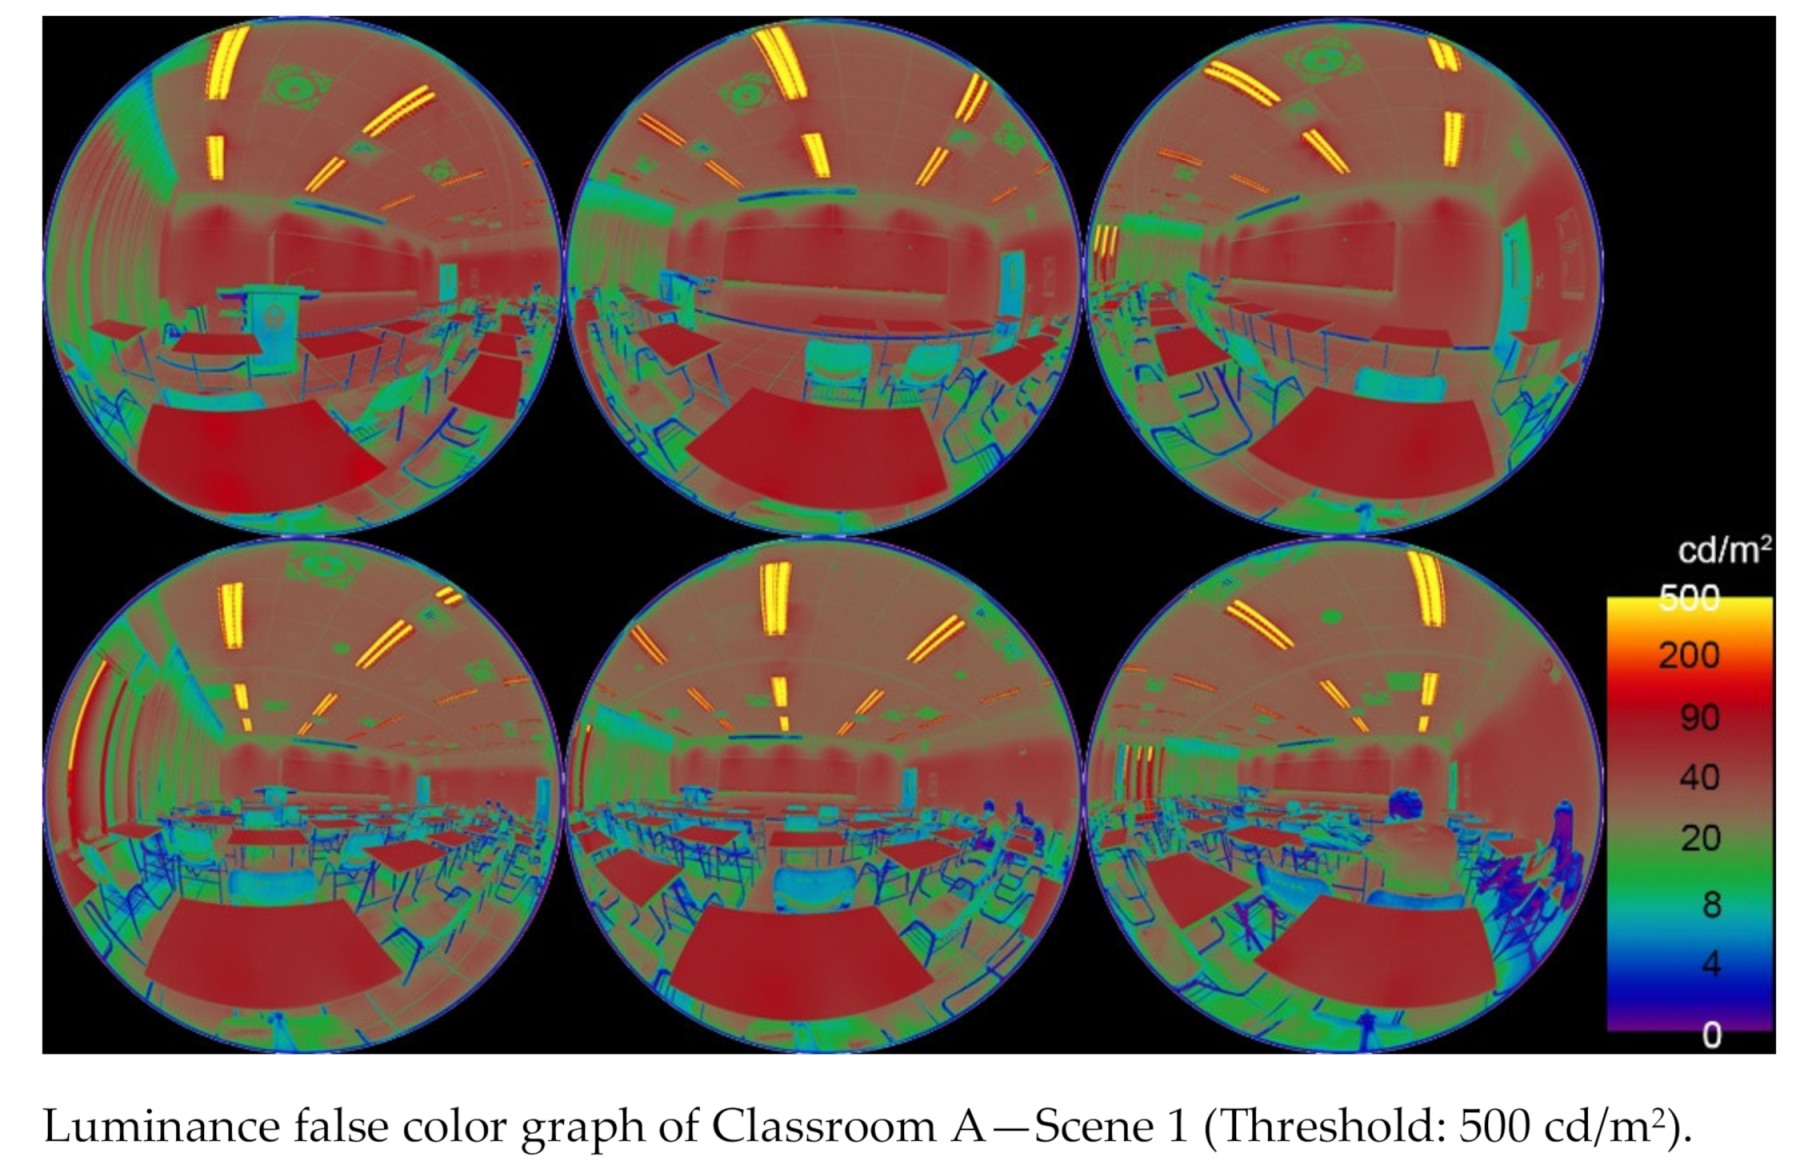
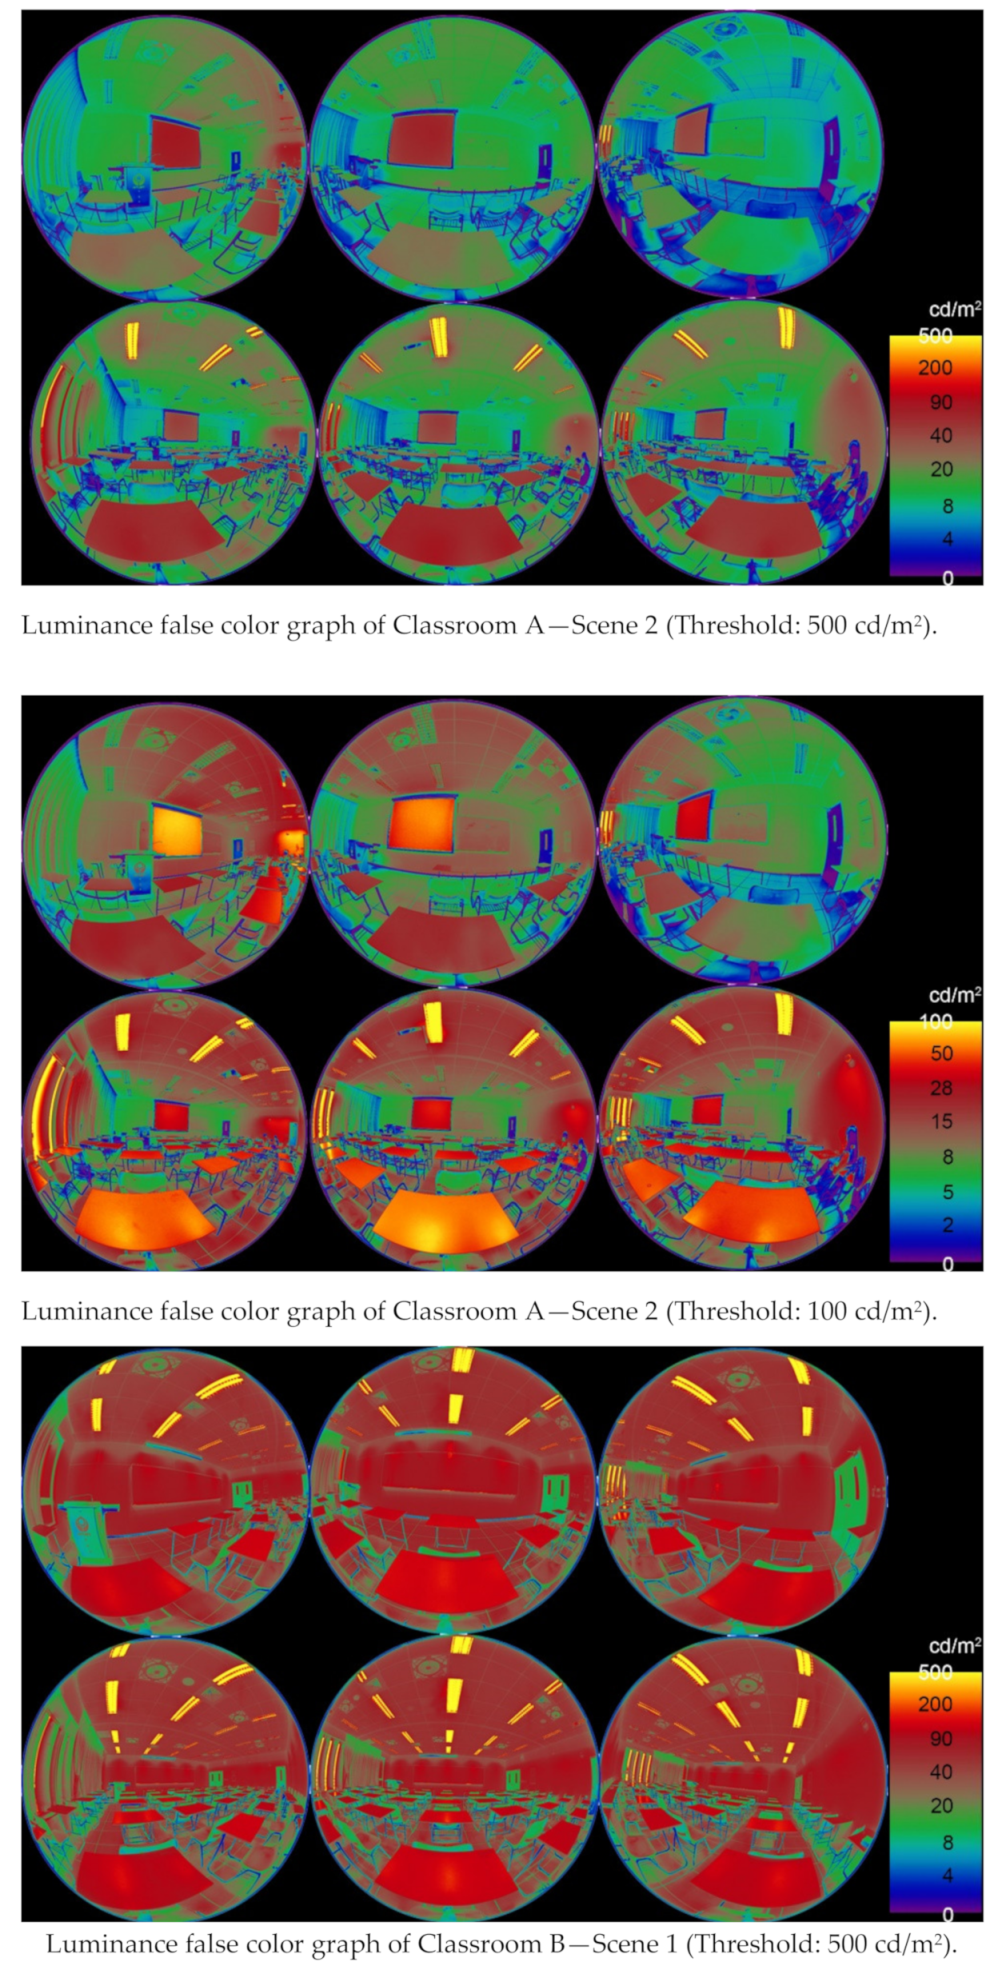
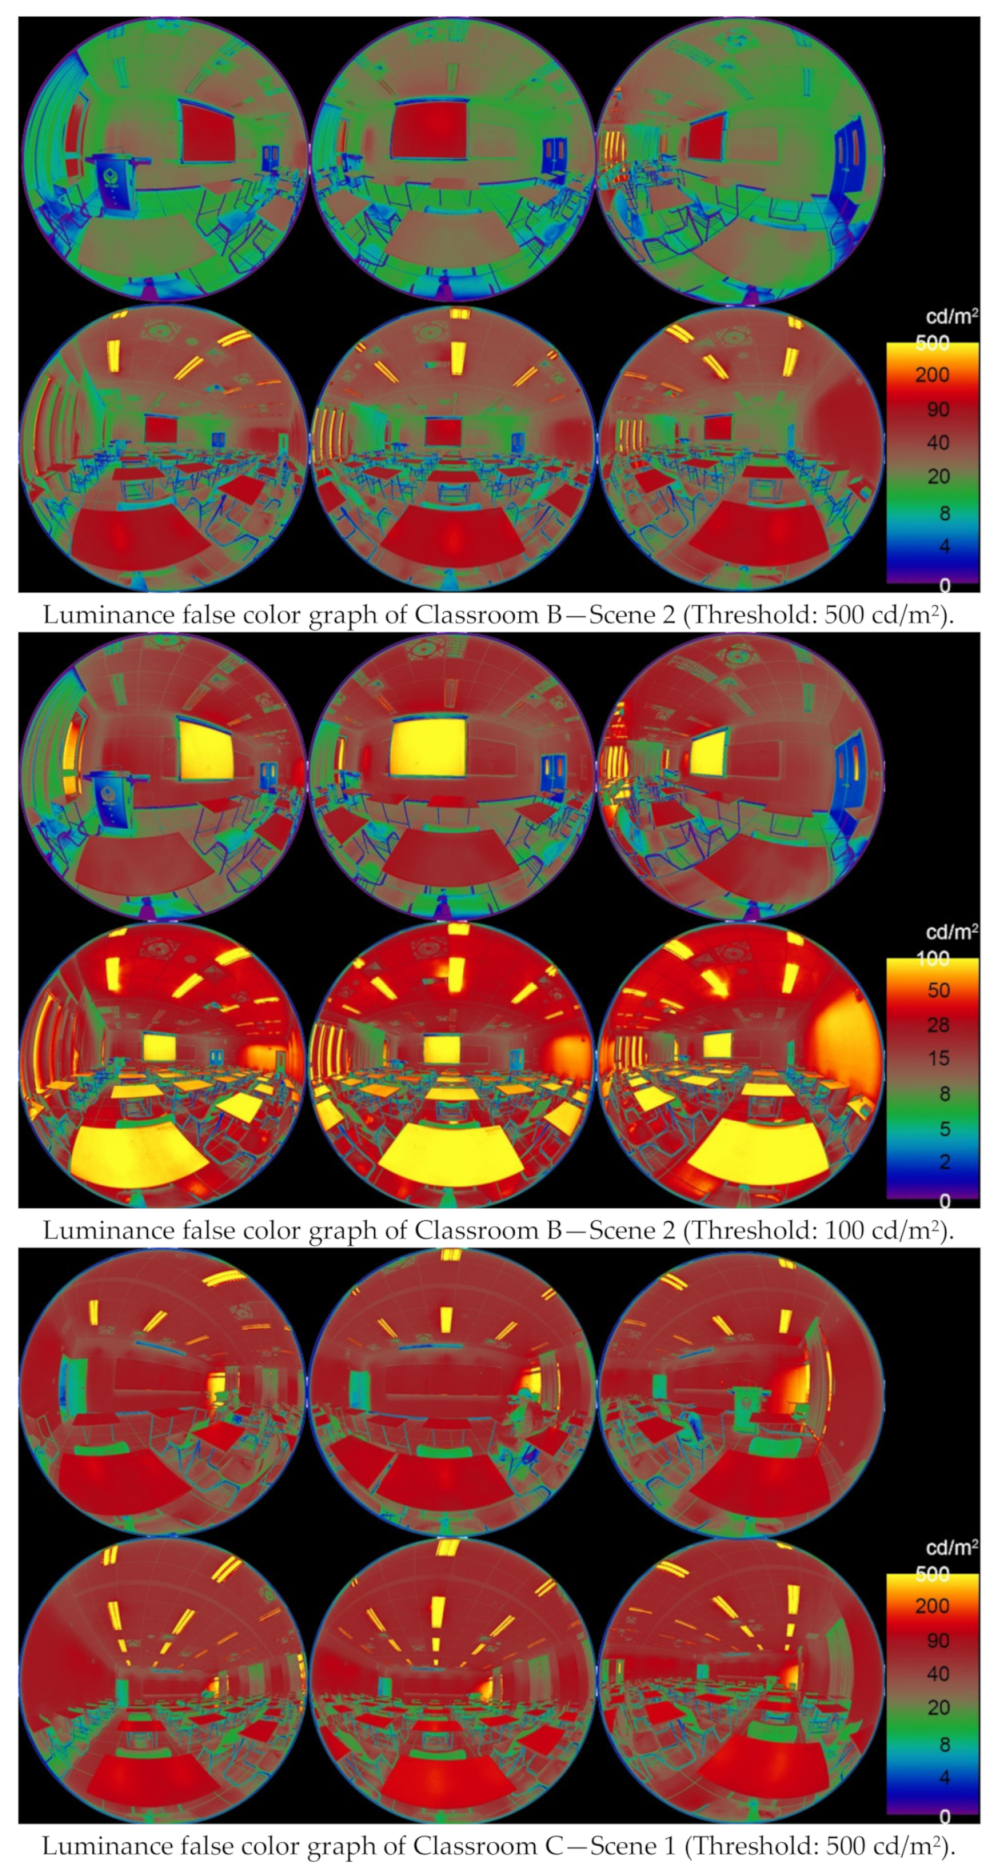
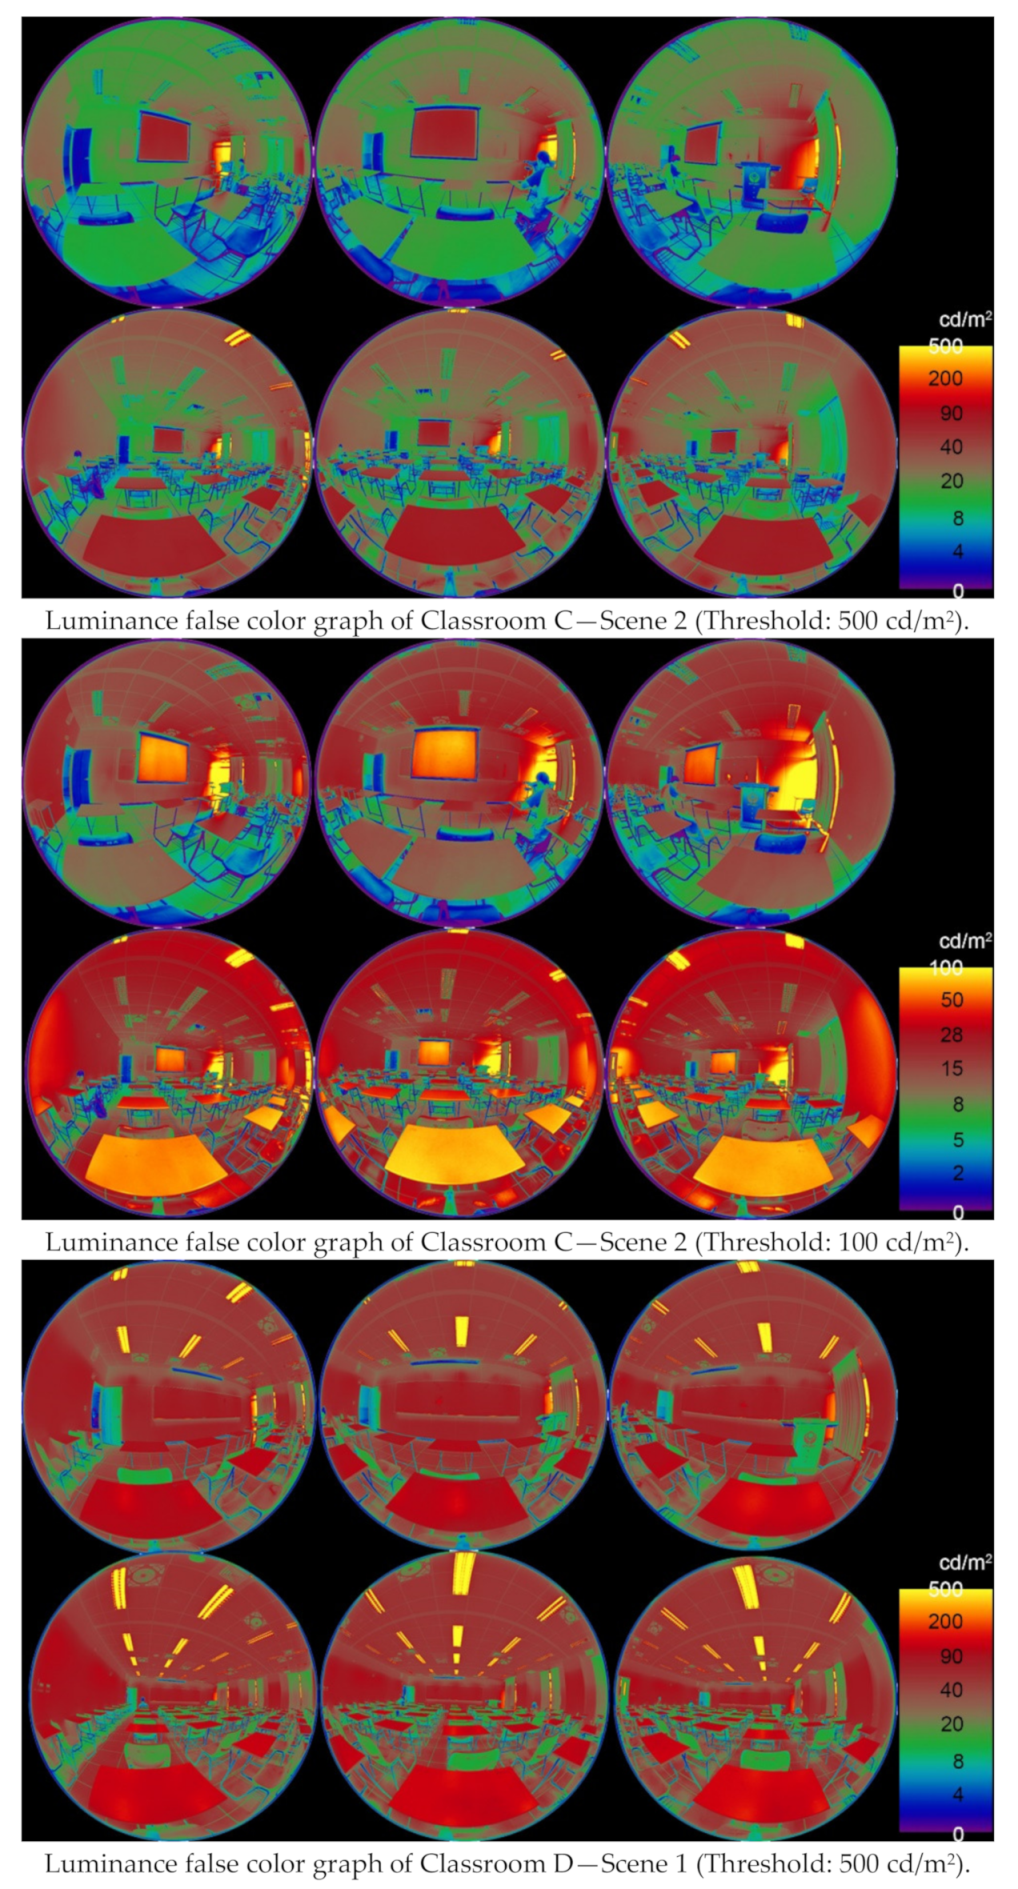
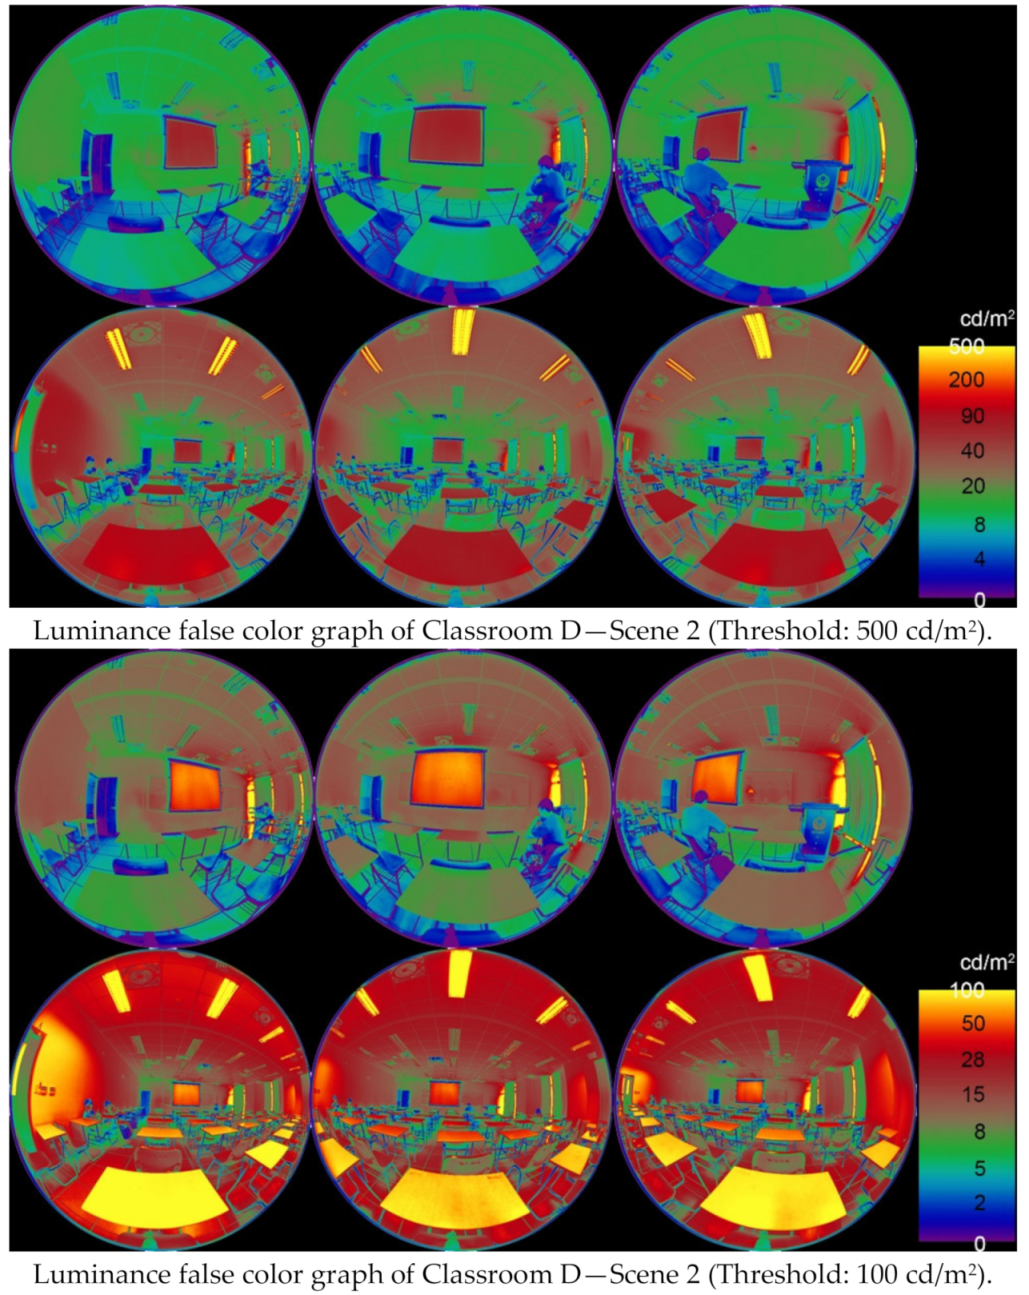
3.2.3. False Color Image Analysis
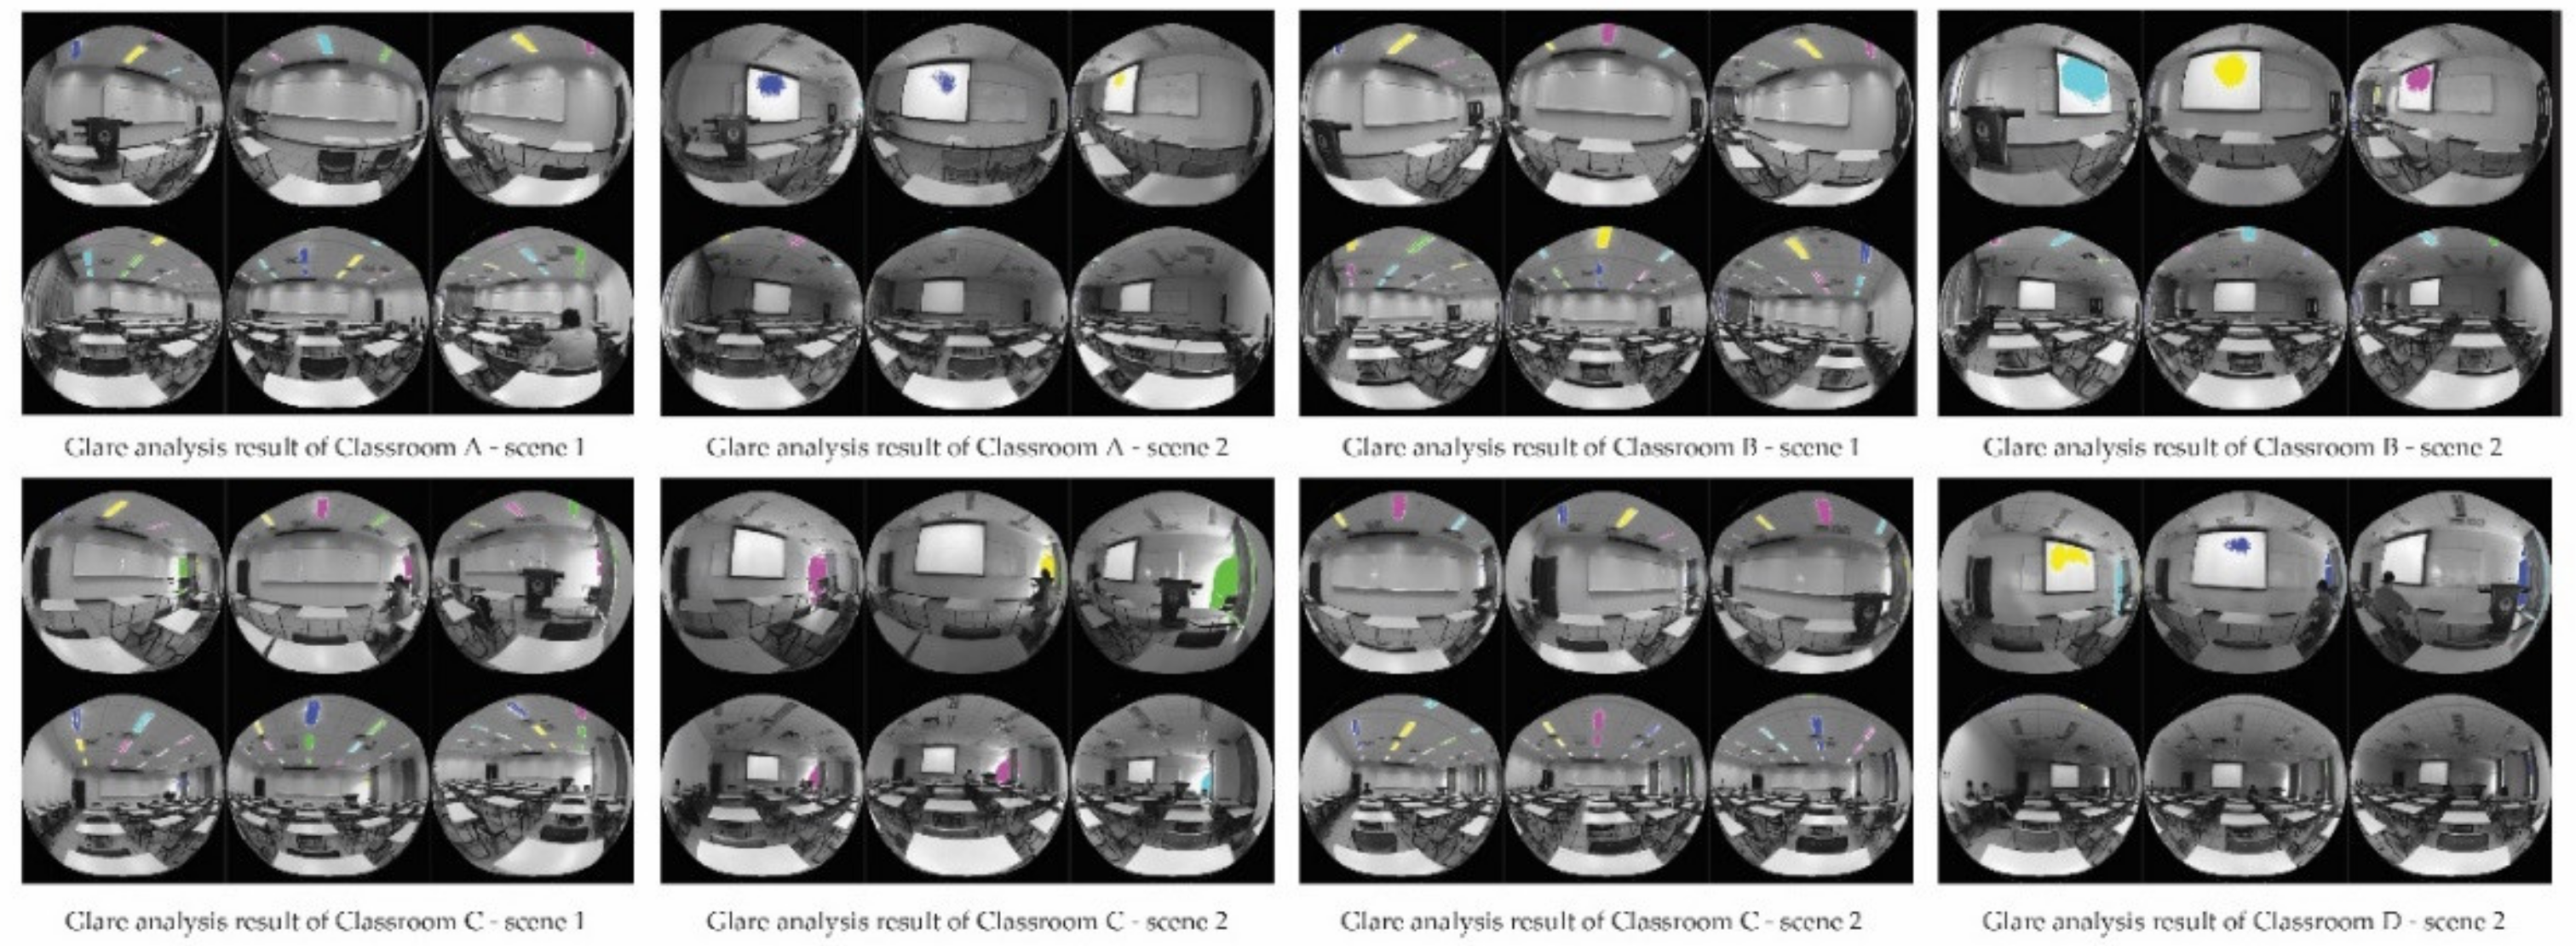
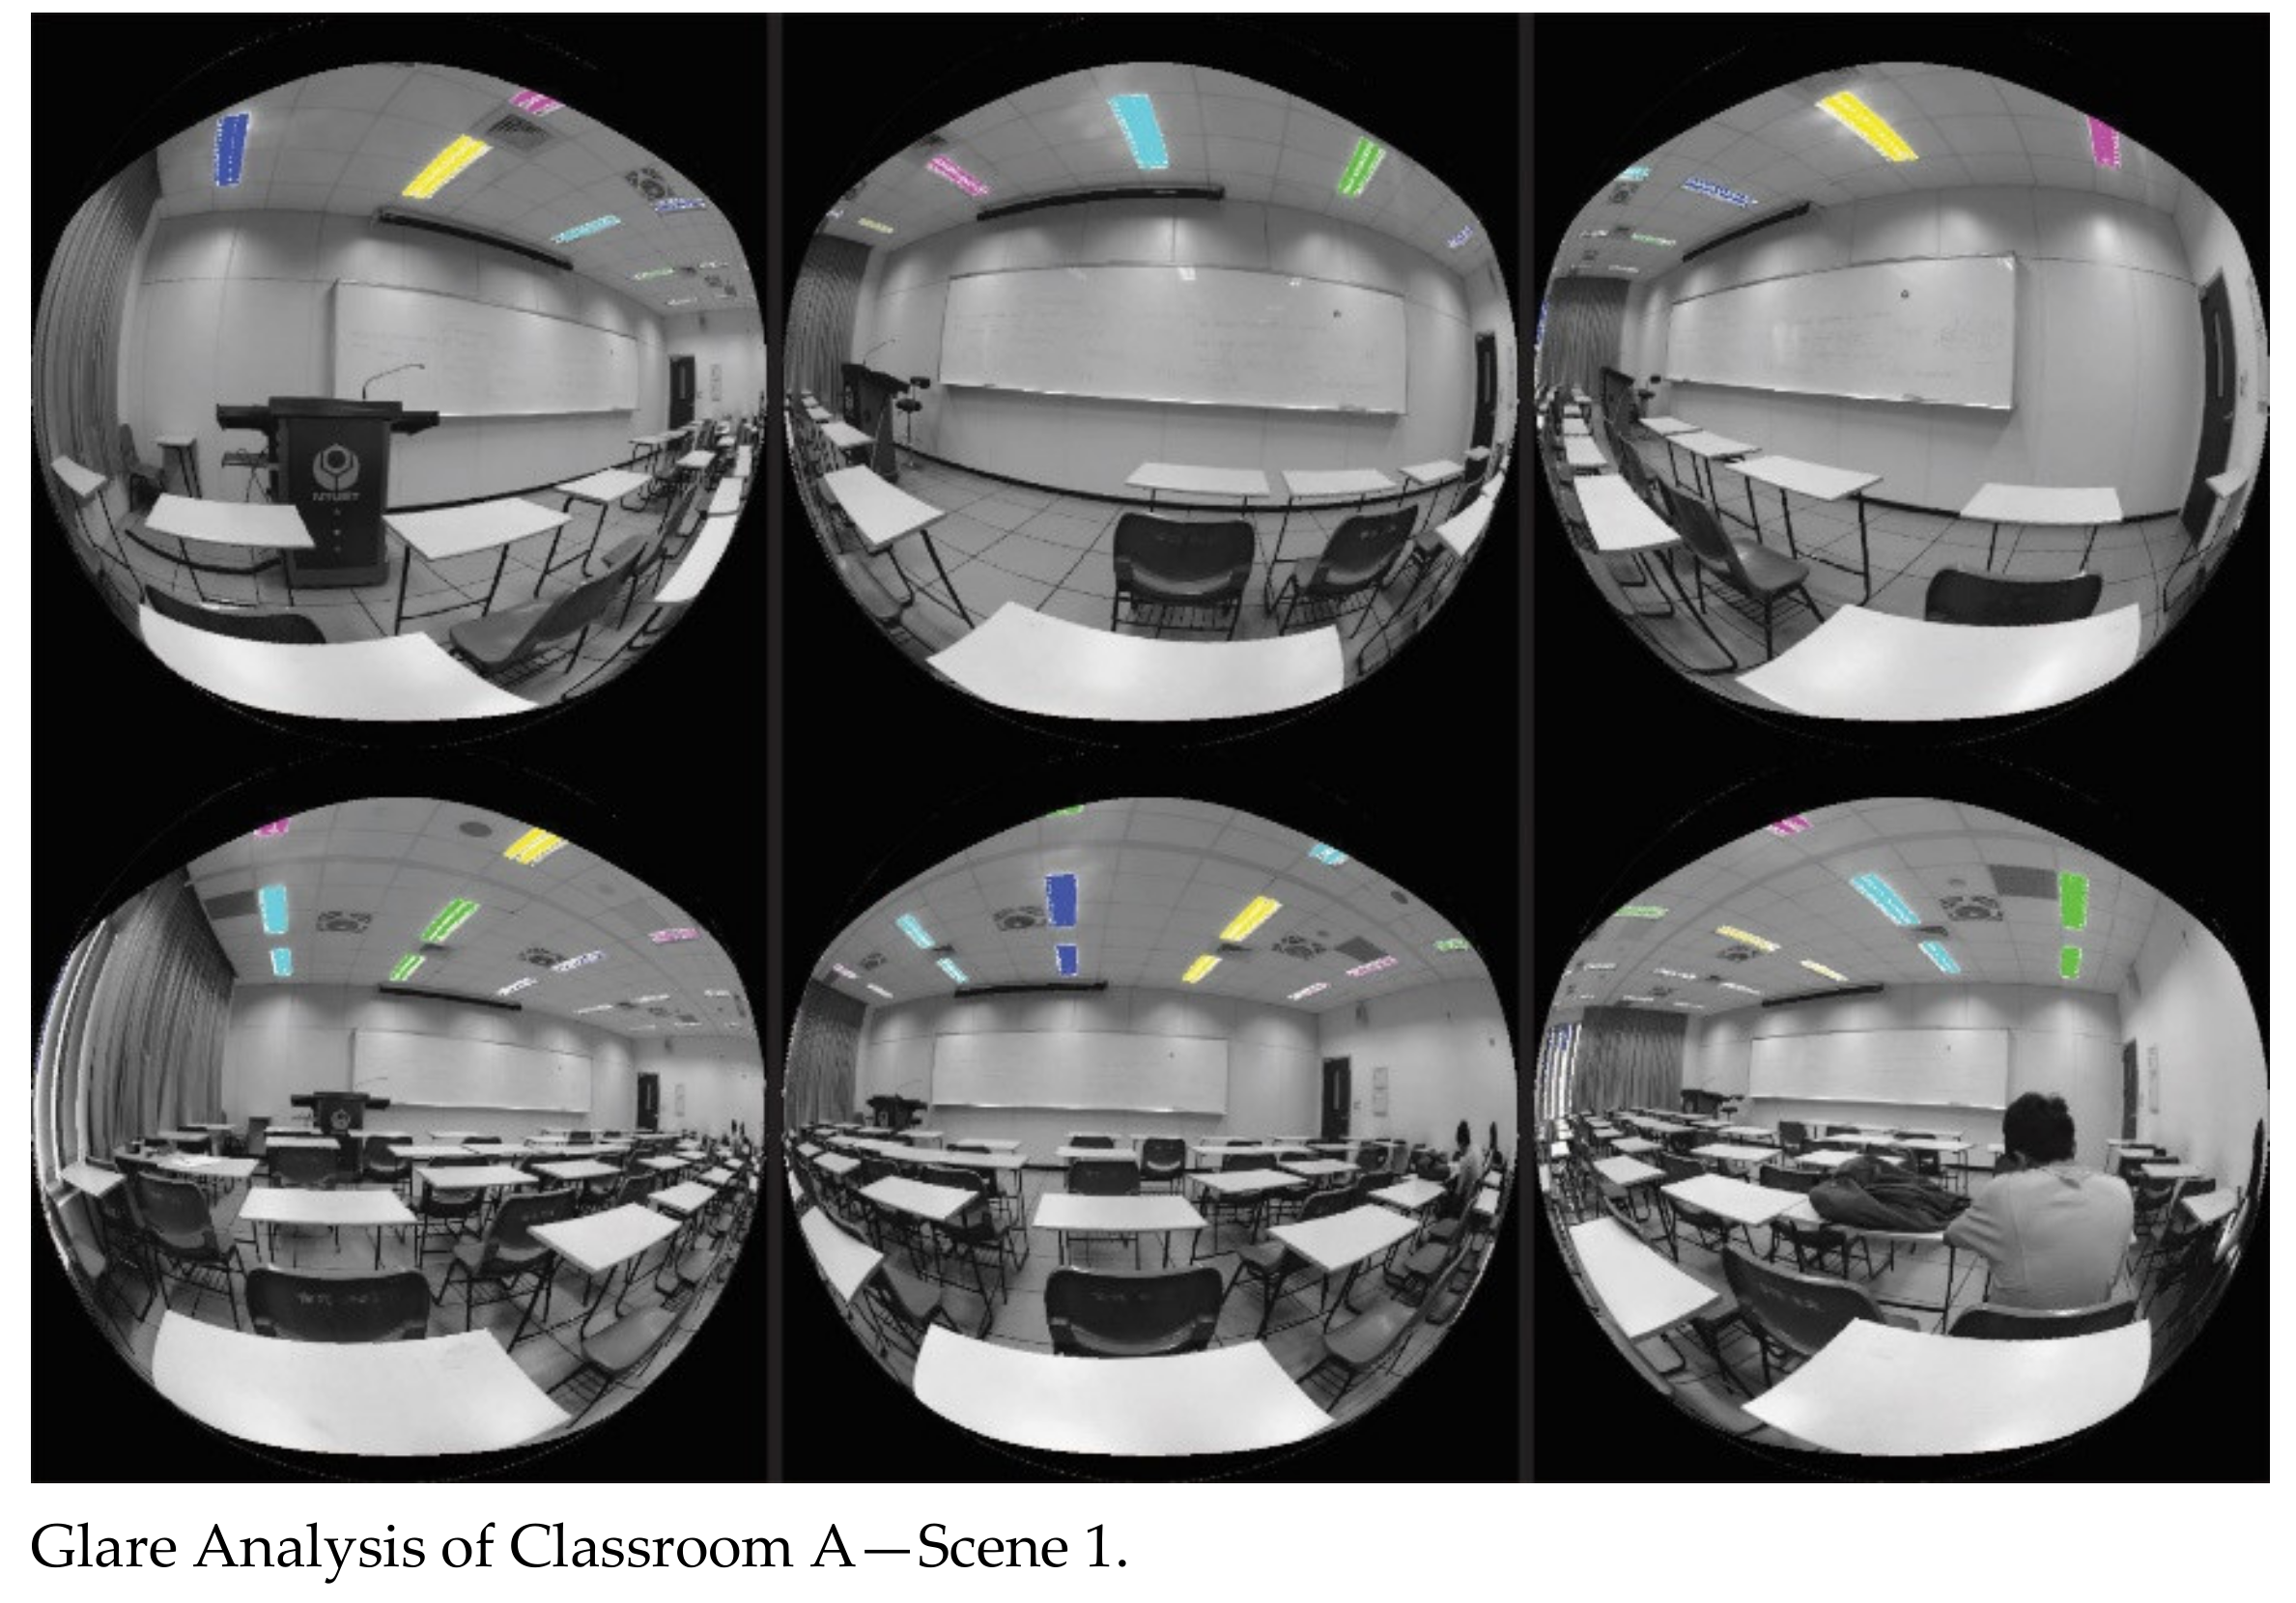
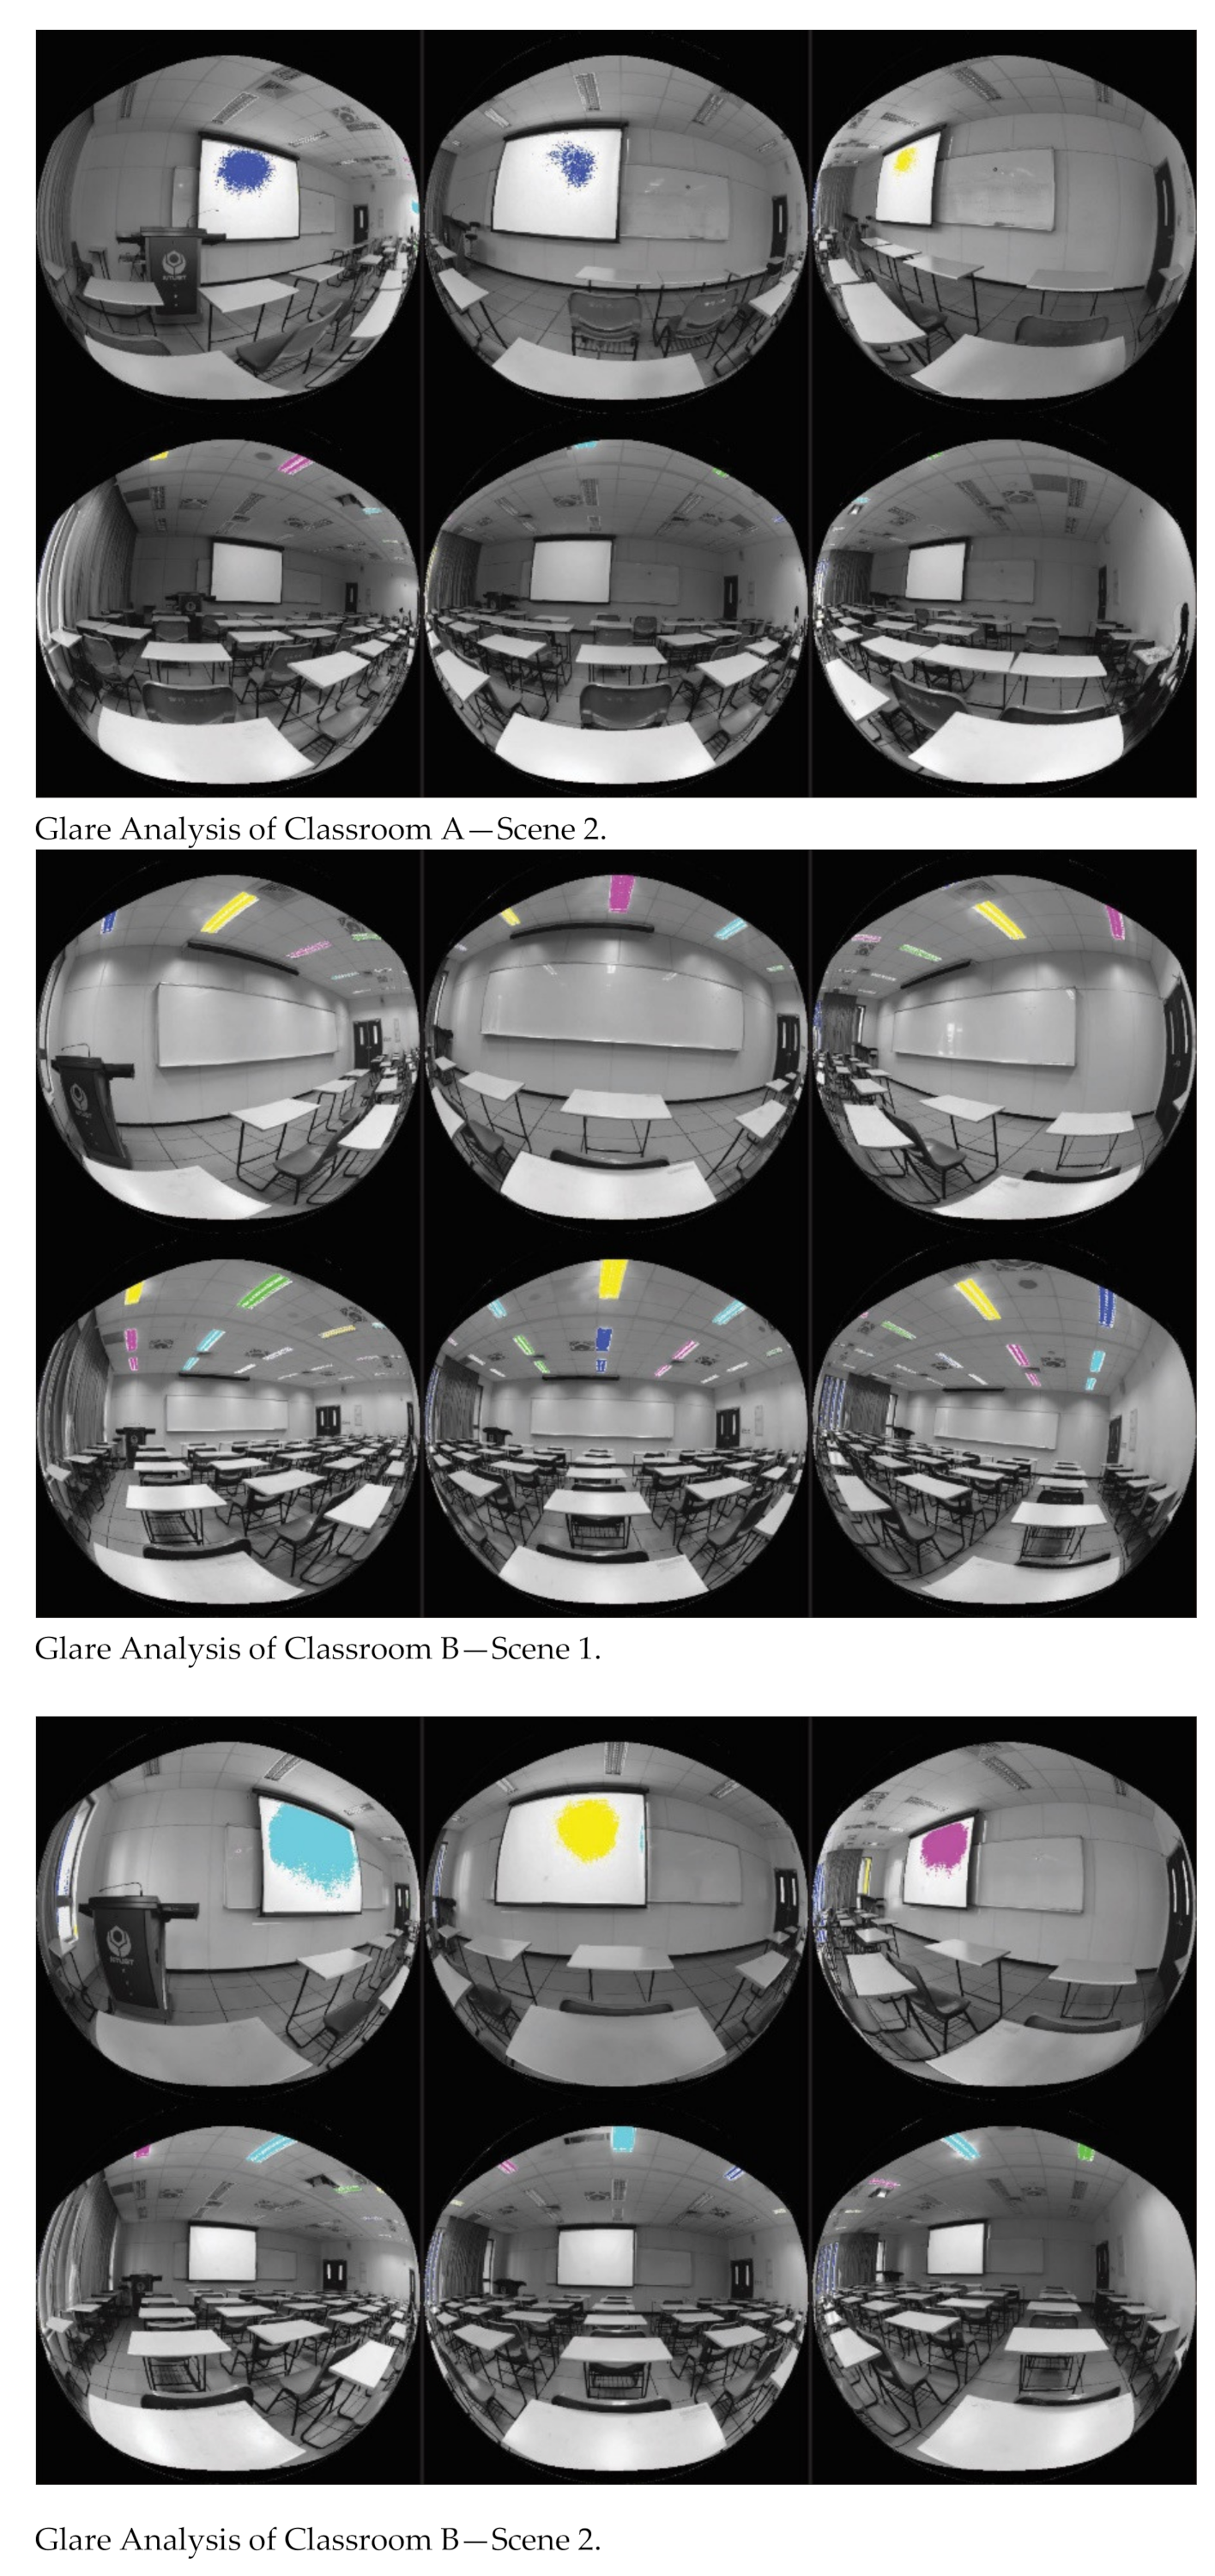
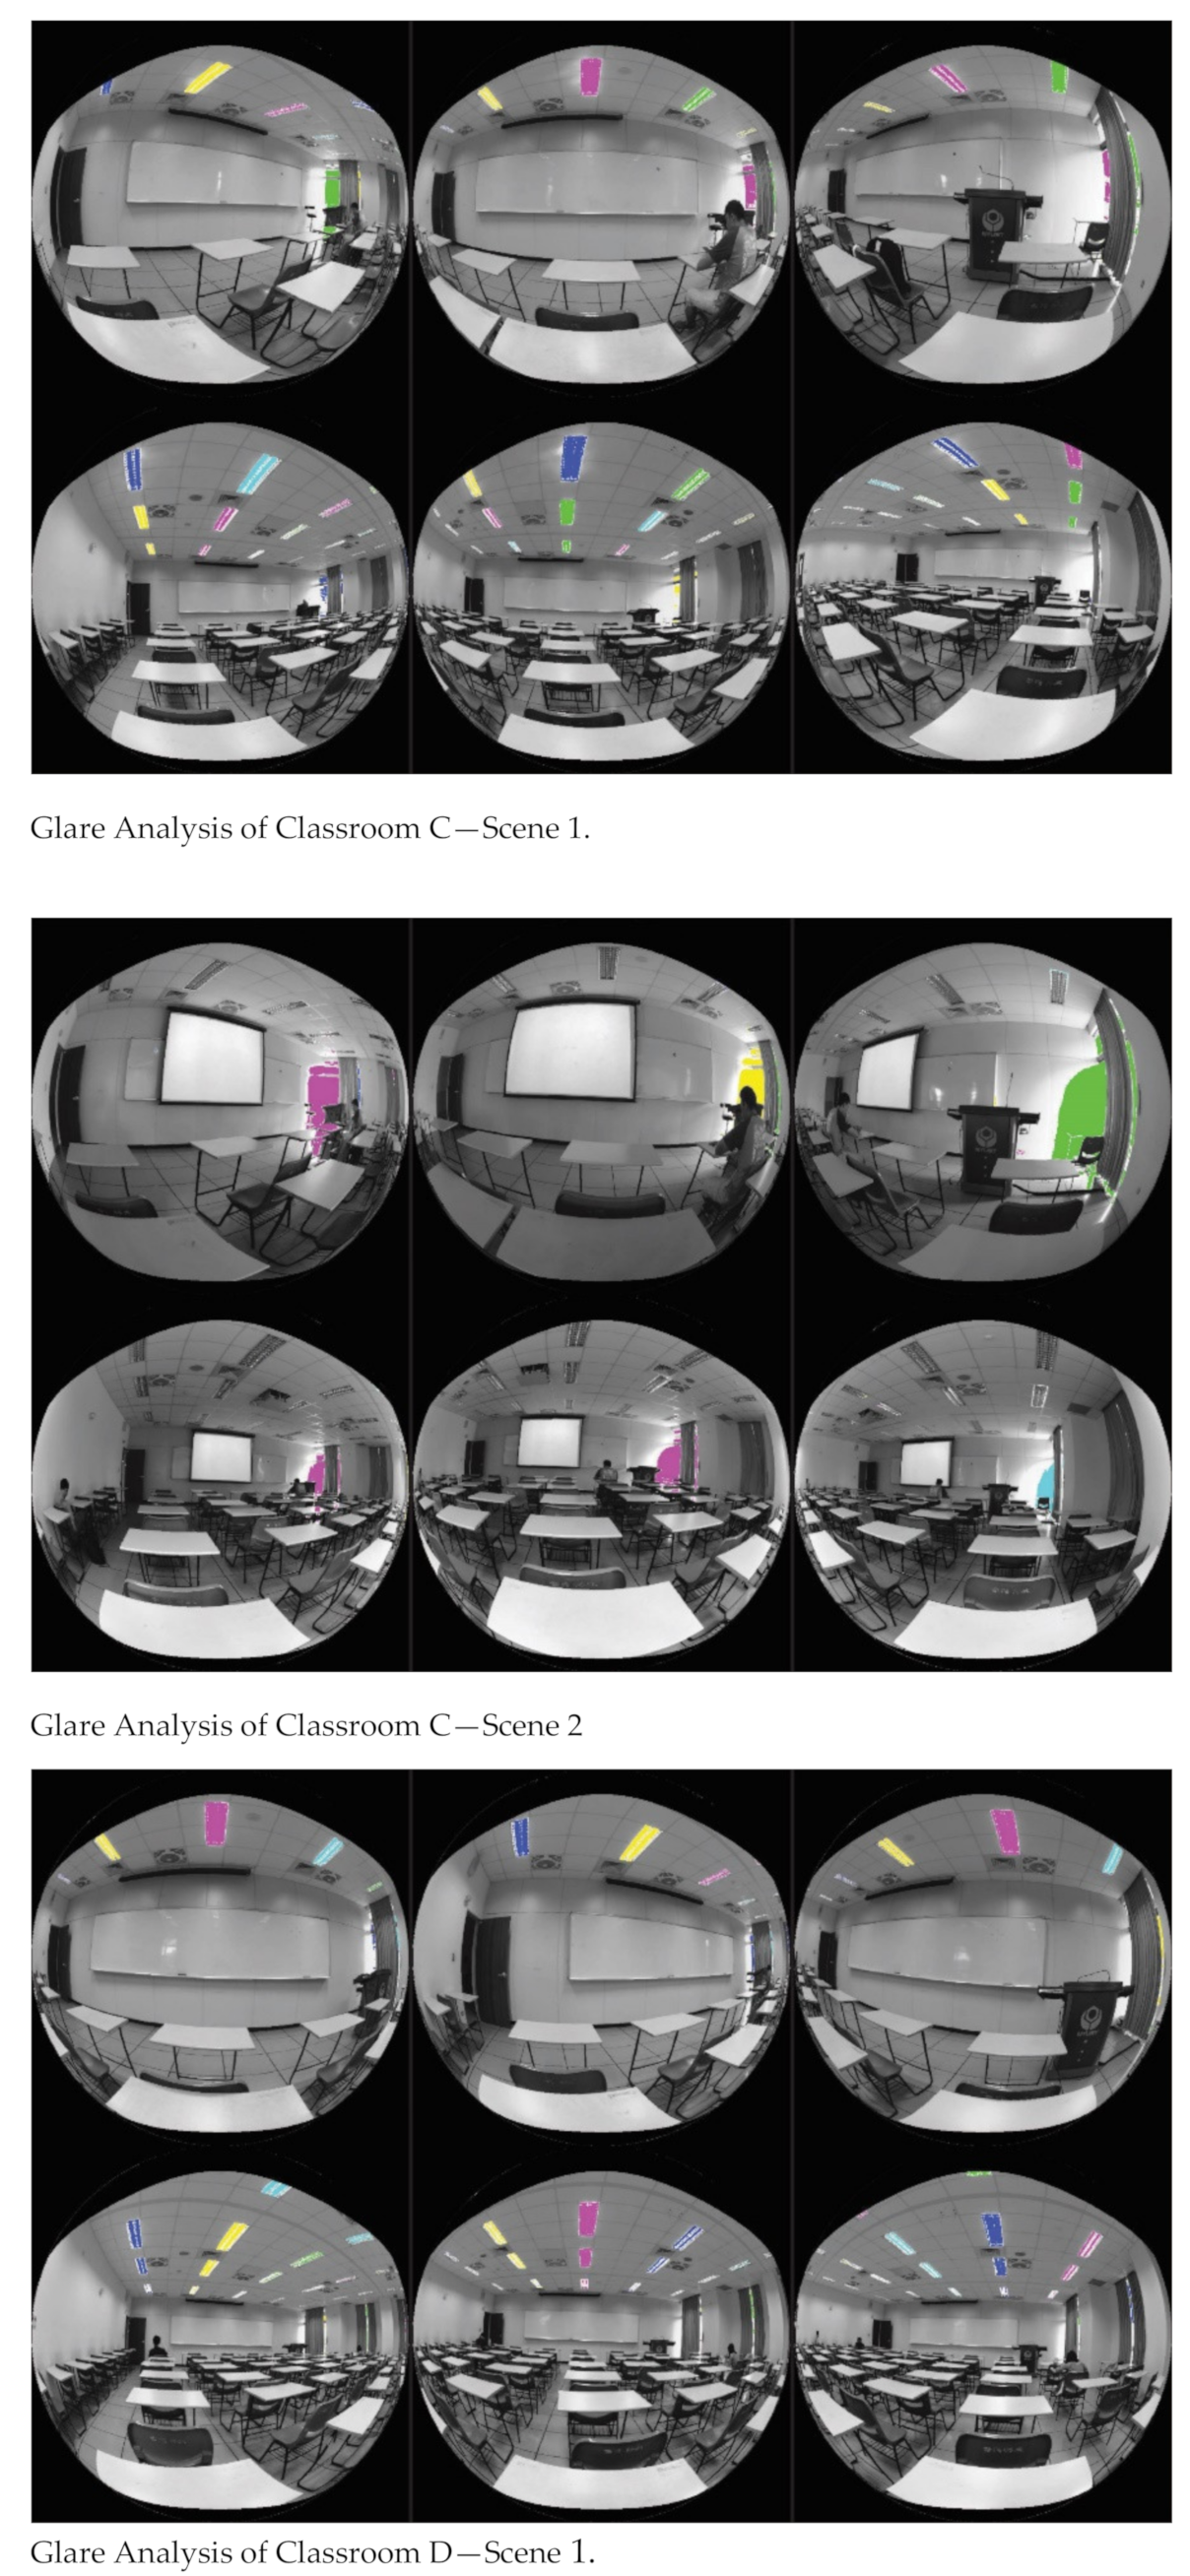
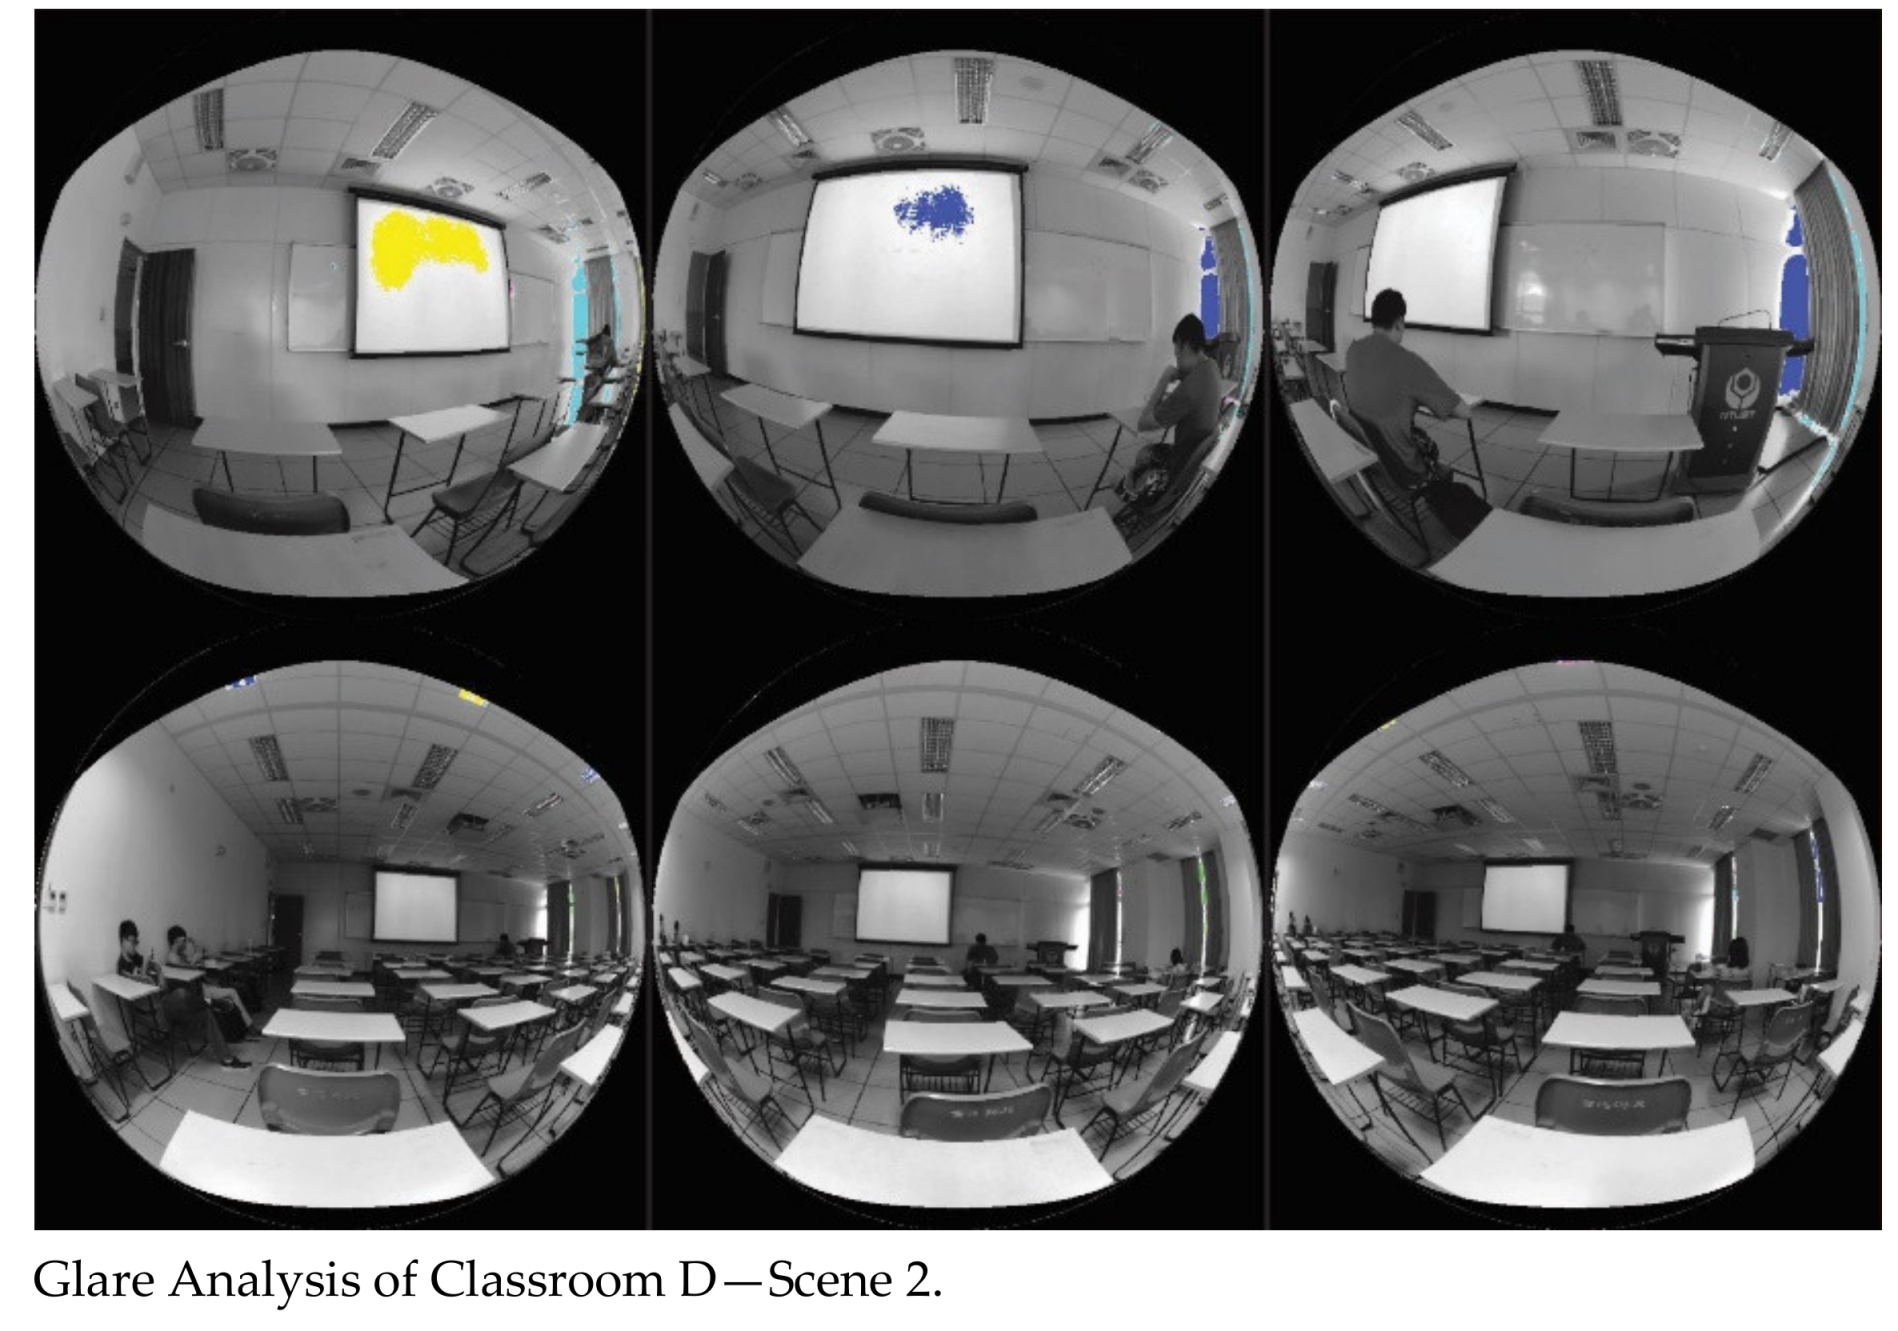
3.2.4. Glare Analysis
4. Comparisons of Teaching Context and Lighting Senses
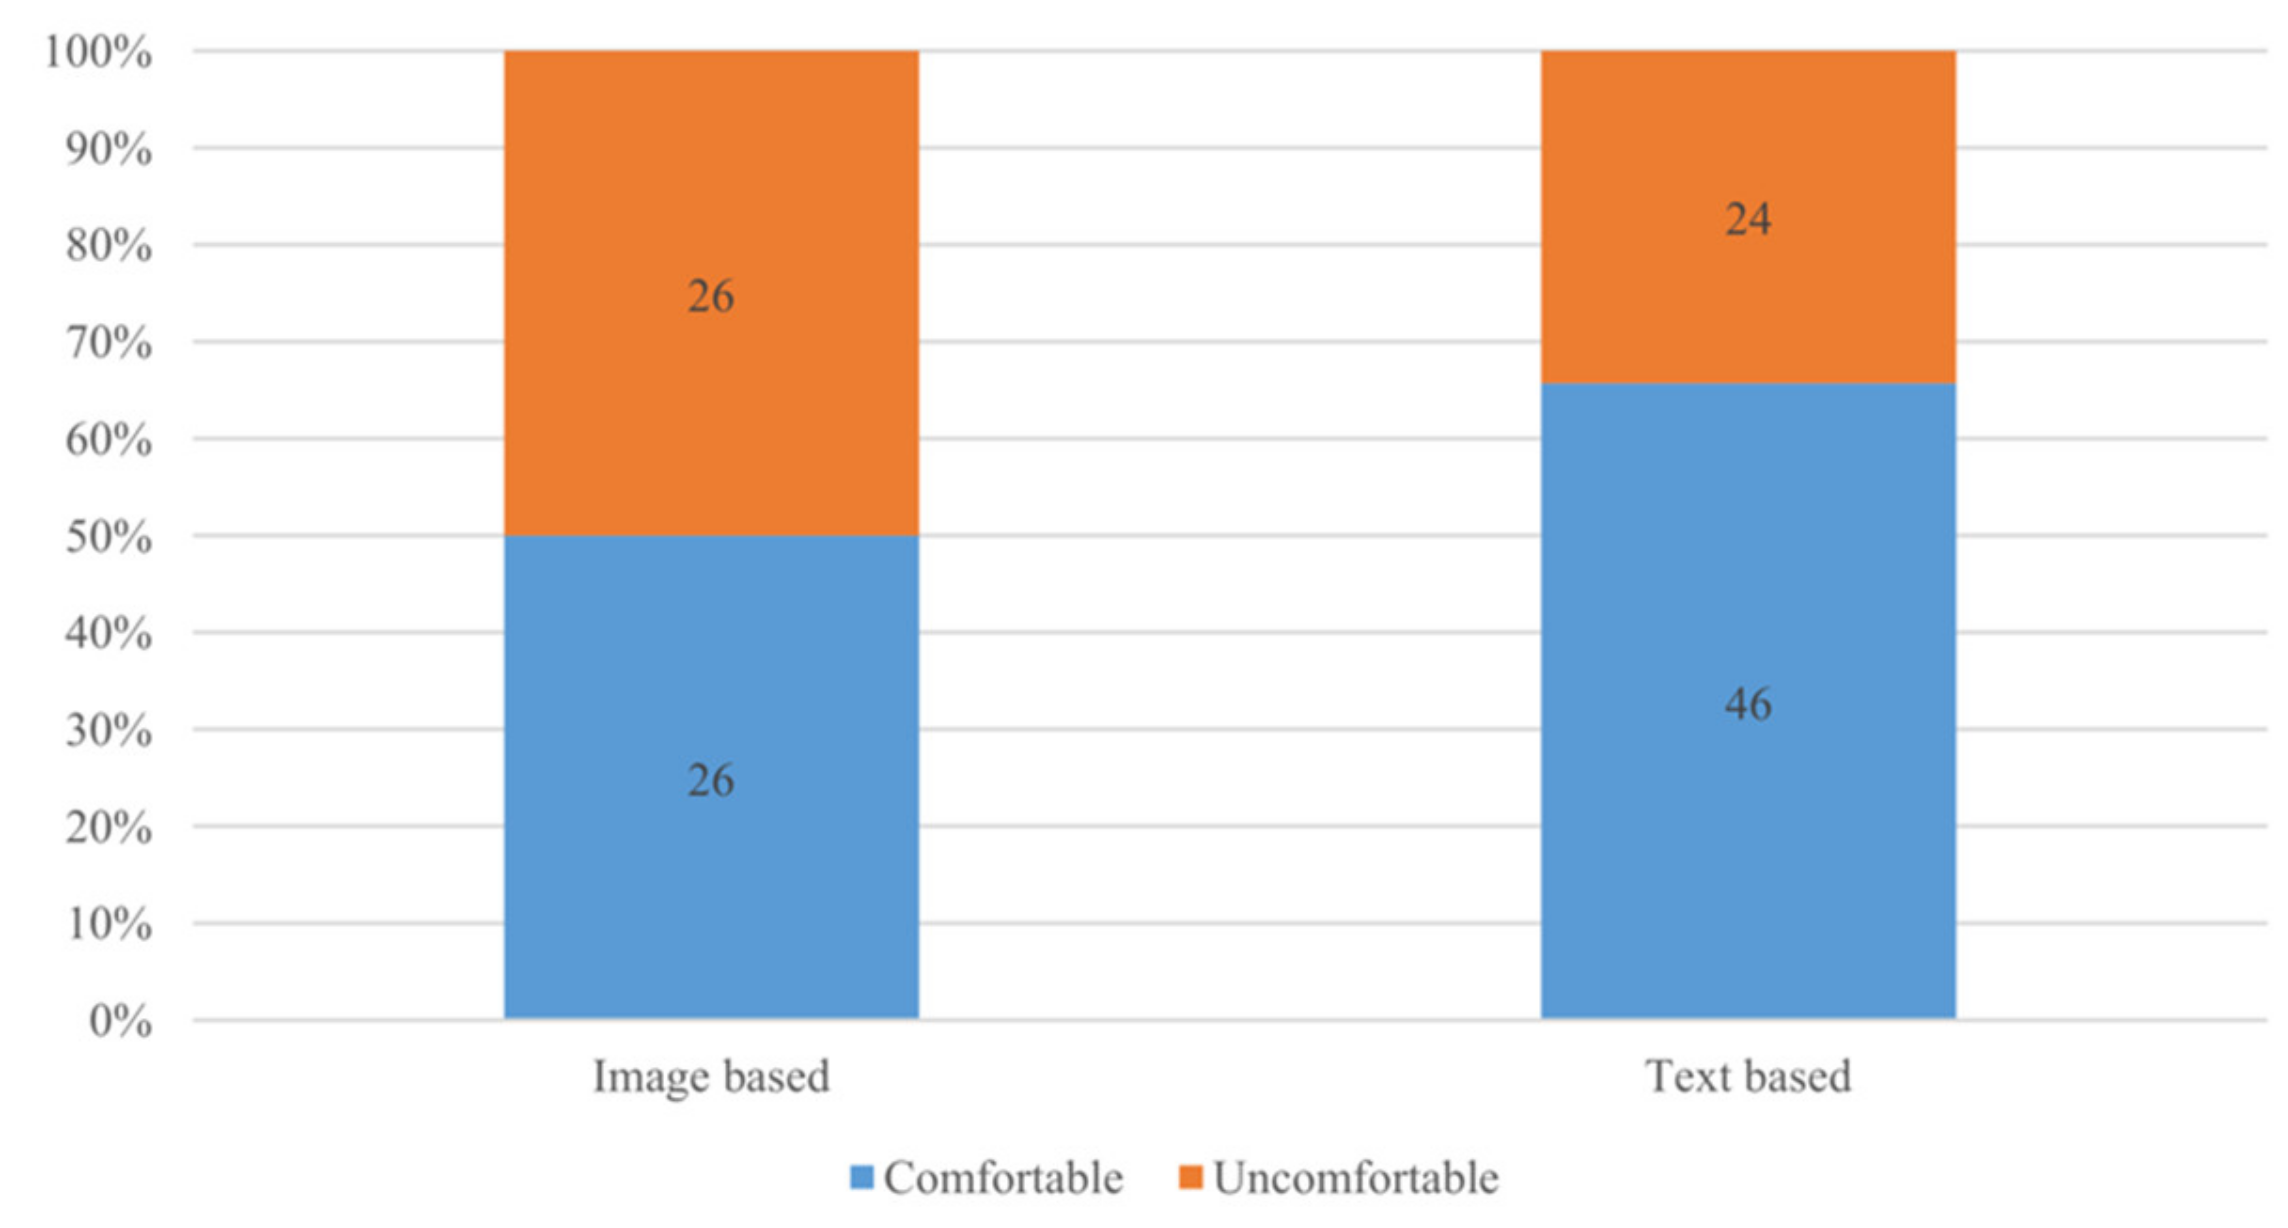
4.1. Comparison of Visual Comfort between Text- and Image-Based Contents
4.2. Comparison of Overall Comfort Level between Scene 1 and Scene 2
5. Summary and Conclusions
- The DI of the subject classroom is more than adequate when all lights are on (Scene 1). The average illuminance of 776 lux is larger than the required 500 lux [25,26]. Coincidentally, 39% of students in Classroom D who experienced Scene 1 find that the overall lighting level in the room was too bright.
- In Scene 2, where the projector is on with the FR lights off and the BR lights on (Classrooms A, B, and C), the DI of the FR section becomes too low, with an average value of 105 lux. In contrast, the DI of the BR section is still above 500 Lux.
- Due to the constant use of curtains to block the daylight in classrooms, daylight has little to no effect on the luminance in the classroom. Daylight even becomes a glare source in Classroom C with Scene 2 lighting arrangements.
- The desk surface is the brightest and has the highest visual comfort among the three surfaces. The average luminance ratio between the desk and whiteboard is approximately 1 to 0.7 in Scene 1 and 1 to 0.2 in Scene 2. Additionally, from the false color image analysis, unintended light scallops and unintended bright light also fall on vertical surfaces, creating distractions.
- The luminance ratio between the projection screen and whiteboard is 3 to 1. Nevertheless, the mean value of the projector task performance number is low compared with that of the desk-based task.
- The projection screen cannot be used simultaneously with the whiteboard. The increase in luminance in one surface results in the loss of clarity in the other surface. In the false color image analysis of Scene 2, the projection screen is easy to distinguish from the surroundings, whereas the whiteboard is almost invisible because it has no clear boundary with the adjacent wall surfaces.
- UGR is better than DGP in identifying glare in this study. It was able to identify both the glare from the excessive lighting in Scene 1 and the daylight glare in Classroom C in Scene 2. In contrast, DGP from all viewports shows only imperceptible glare.
- Physical symptoms are not always associated with discomfort. Some respondents experienced physical symptoms while answering “comfortable” for their overall comfort level.
- Among all the respondents answering “uncomfortable”, the most perceived cause of discomfort is artificial lighting quality (49%), followed by inadequate projector brightness (35%).
- Scene 2 has the tendency to be perceived as “slightly too dark”, while Scene 1 has the tendency to be perceived as “slightly too bright”.
- The text-based class is perceived as more comfortable than the image-based class (66% to 50%). However, in comparison to their task performance mean value, the image-based class has a higher score than those of the text-based class.
- For the current classroom use pattern, a new row of linear floodlights, parallel to the whiteboard, should be added with individual lighting fixture control; they should be close to the whiteboard/front wall vertical surface. In operation, only the new row of lights changes settings according to different teaching scenarios. The lights in the FR section and the lights in the BR will always be on. It will ease the luminance imbalance between the projector screen and whiteboard as well as between the FR and BR seating sections.
- The lumen outputs of each lighting fixture can be reduced by 30%. It saves energy and reduces glare. The DI would still be approximately 500 lux.
- A different daylight control mechanism should be considered for effective daylight utilization.
Author Contributions
Funding
Acknowledgments
Conflicts of Interest
Appendix A. HDR Images Compiled in Figure 19


Appendix B. Viewport Luminance Analysis Graphs Compiled in Figure 20


Appendix C. Viewport Luminance Analysis Graphs Compiled in Figure 21


Appendix D. Luminance False Color Graphs Compiled in Figure 22


Appendix E. Glare Analysis Images Complied in Figure 23


References
- Hinckson, E.; Salmon, J.; Benden, M.; Clemes, S.A.; Sudholz, B.; Barber, S.E.; Aminian, S.; Ridgers, N.D. Standing Classrooms: Research and Lessons Learned from Around the World. Sport Med. 2016, 46, 977–987. [Google Scholar] [CrossRef] [PubMed]
- Ibañez, C.A.; Zafraa, J.C.G.; Sachta, H.M. Natural and Artificial Lighting Analysis in a Classroom of Technical Drawing: Measurements and HDR Images Use. Procedia Eng. 2017, 196, 964–971. [Google Scholar] [CrossRef]
- Winterbottom, M.; Wilkins, A. Lighting and discomfort in the classroom. J. Environ. Psychol. 2009, 29, 63–75. [Google Scholar] [CrossRef]
- Musa, A.R.; Abdullah, N.A.G.; Che-Ani, A.I.; Tawil, N.M.; Tahir, M.M. Indoor Environmental Quality for UKM Architecture Studio: An Analysis on Lighting Performance. Procedia Soc. Behav. Sci. 2012, 60, 318–324. [Google Scholar] [CrossRef] [Green Version]
- Castilla, N.; Llinares, C.; Bisegna, F.; Blanca-Giménez, V. Emotional evaluation of lighting in university classrooms: A preliminary study. Front. Archit. Res. 2018, 7, 600–609. [Google Scholar] [CrossRef]
- Burattini, C.; Piccardi, L.; Curcio, G.; Ferlazzo, F.; Giannini, A.M.; Bisegna, F. Cold LED lighting affects visual but not acoustic vigilance. Build. Environ. 2019, 151, 148–155. [Google Scholar] [CrossRef]
- Nguyen, T.P.L.; Peña-García, A. Users’ awareness, attitudes, and perceptions of health risks associated with excessive lighting in night markets: Policy implications for sustainable development. Sustainability 2019, 11, 6091. [Google Scholar] [CrossRef] [Green Version]
- Balocco, C.; Volante, G. A method for sustainable lighting, preventive conservation, energy design and technology-lighting a historical church converted into a university library. Sustainability 2019, 11, 3145. [Google Scholar] [CrossRef] [Green Version]
- Jin, H.; Li, X.; Kang, J.; Kong, Z. An evaluation of the lighting environment in the publicspace of shopping centres. Build. Environ. 2017, 115, 228–235. [Google Scholar] [CrossRef] [Green Version]
- Cuttle, C. Brightness, lightness, and providing ‘a preconceived appearance to the interior’. Light. Res. Technol. 2004, 36, 201–216. [Google Scholar] [CrossRef]
- Van Den Wymelenberg, K.; Inanici, M. A Critical Investigation of Common Lighting Design Metrics for Predicting Human Visual Comfort in Offices with Daylight. Leikos 2014, 10, 145–164. [Google Scholar] [CrossRef]
- Bellia, L.; Spada, G.; Pedace, A.; Fragliasso, F. Methods to evaluate lighting quality in educational environments. Energy Procedia 2015, 78, 3138–3143. [Google Scholar] [CrossRef] [Green Version]
- Costanzo, V.; Evola, G.; Marletta, L. A review of daylighting strategies in schools: State of the art and expected future trends. Buildings 2017, 7, 41. [Google Scholar] [CrossRef] [Green Version]
- Leccese, F.; Salvadori, G.; Rocca, M.; Buratti, C.; Belloni, E. A method to assess lighting quality in educational rooms using analytic hierarchy process. Build. Environ. 2020, 168, 106501. [Google Scholar] [CrossRef]
- Leccese, F.; Salvadori, G.; Rocca, M. Visual discomfort among university students who use CAD workstations. Work 2016, 55, 171–180. [Google Scholar] [CrossRef] [PubMed]
- Chiou, Y.S.; Huang, P.C. An HDRi-based data acquisition system for the exterior luminous environment in the daylight simulation model. Soil. Energy 2015, 111, 104–117. [Google Scholar]
- Ward, G. Photosphere Software 2005. Available online: http://www.anyhere.com/ (accessed on 20 March 2020).
- Doyle, S.; Reinhart, C.; High Dynamic Range Imaging & Glare Analysis II. HDR Photography suing Photosphere, Lecture Note at Harvard Graduate School of Design. 2010. Available online: http://web.mit.edu/sustainabledesignlab/projects/TeachingResources/HDR_II_Photosphere.pdf (accessed on 20 March 2020).
- Kumaragurubaran, V.; Inanici, M. Hdrscope: High dynamic range image processing toolkit for lighting simulations and analysis. In Proceedings of the the BS2013: 13th Conference of International Building Performance Simulation Association, Chambéry, France, 26–28 August 2013; pp. 3400–3407. [Google Scholar]
- Hdrscope Software. Available online: http://courses.washington.edu/hdrscope/index.html (accessed on 20 March 2020).
- Wienold, J.; Christoffersen, J. Evaluation methods and development of a new glare prediction model for daylight environments with the use of CCD cameras. Energ Build. 2006, 38, 743–757. [Google Scholar] [CrossRef]
- Suk, J.; Schiler, M. Investigation of Evalglare software, daylight glare probability and high dynamic range imaging for daylight glare analysis. Light. Res. Technol. 2013, 45, 450–463. [Google Scholar] [CrossRef]
- Suk, J.Y. Luminance and vertical eye illuminance thresholds for occupants’ visual comfort in daylit office environments. Build. Environ. 2019, 148, 107–115. [Google Scholar] [CrossRef]
- Pierson, C.; Wienold, J.; Bodart, M. Daylight Discomfort Glare Evaluation with Evalglare: Influence of Parameters and Methods on the Accuracy of Discomfort Glare Prediction. Buildings 2018, 8, 94. [Google Scholar] [CrossRef] [Green Version]
- EN12464-1 Lighting of Indoor Workplaces; European Committee for Standardization: Brussels, Belgium, 2011.
- CNS Standards 12112: Lighting for Indoor Work Places; Bureau of Standards, Metrology and Inspection, Taiwan Ministry of Economic Affairs: Taipei City, Taiwan, 2012.
- Manual of Lighting Energy Efficiency Improvement in School; Taiwan Ministry of Education: Taipei City, Taiwan, 2012.


| Information | Classroom A | Classroom B | Classroom C | Classroom D |
|---|---|---|---|---|
| Layout plan |  |  |  |  |
| Condition |  |  |  |  |
| Category | Image-based classroom | Image-based classroom | Text-based classroom | Text-based classroom |
| Date | May 17 | May 26 | May 24 | June 1 |
| Class time | 1:30 pm | 9:30 am | 1:30 pm | 1:30 pm |
| Sky condition | Overcast sky | Overcast sky | Overcast sky | Clear sky |
| Number of students | 21 | 31 | 29 | 41 |
| Media in use | Projector, whiteboard | Projector, whiteboard | Projector, whiteboard | Whiteboard |
| Lighting arrangement | Front row lights turned off, back row light turned on (Scene 2) | Front row lights turned off, back row light turned on (Scene 2) | Front row lights turned off, back row light turned on (Scene 2) | Front row lights turned on, back row light turned on (Scene 1) |
| Surface | Estimated Reflectance | Color and Other Properties |
|---|---|---|
| Whiteboard | 0.75 | White, glossy |
| Projector screen | 0.75 | Light Grey, matt, retractable |
| Student’s desk | 0.60 | White, matt |
| Curtain | 0.50 | Greenish, matt, folded, retractable |
| Wall | 0.75 | Light yellow, matt |
| Ceiling | 0.70 | White, matt, acoustic panel |
| Floor | 0.30 | Dark yellow, slightly glossy |
| ISO | f-Stop | Shutter Speed Range | Red Eye Reduction | White Balance | Focus | Picture Style | Metering |
|---|---|---|---|---|---|---|---|
| 800 | f/6.3 | Under- to over-exposure | off | Auto white balance | One-shot AF | Standard | Evaluate metering |
| Seating Section | n-of Students | |||
|---|---|---|---|---|
| Classroom A | Classroom B | Classroom C | Classroom D | |
| A | 5 | 8 | 4 | 5 |
| B | 3 | 6 | 2 | 8 |
| C | 2 | 3 | 5 | 7 |
| D | 2 | 6 | 9 | 4 |
| E | 5 | 7 | 5 | 9 |
| F | 4 | 1 | 4 | 8 |
| Total each room | 21 | 31 | 29 | 41 |
| Total | 122 | |||
| Classroom A | Experiment Result |
|---|---|
 DI (lux) |  |
| Classroom B | Experiment Result |
 DI (lux) |  |
| Classroom C | Experiment Result |
 DI (lux) |  |
| Classroom D | Experiment Result |
 DI (lux) |  |
| Seating Section | UGR Value | |||||||
|---|---|---|---|---|---|---|---|---|
| Classroom A | Classroom B | Classroom C | Classroom D | |||||
| Scene 1 | Scene 2 | Scene 1 | Scene 2 | Scene 1 | Scene 2 | Scene 1 | Scene 2 | |
| A | 5.6 | 0.0 | 13.5 | 6.9 | 13.7 | 16.5 | 15.9 | 8.5 |
| B | 6.1 | 0.0 | 12.5 | 2.9 | 15.1 | 11.7 | 16.5 | 5.4 |
| C | 7.8 | 1.5 | 12.8 | 4.8 | 13.0 | 14.5 | 17.2 | 11.5 |
| D | 7.8 | 0.0 | 16.5 | 10.1 | 17.6 | 8.9 | 15.7 | 1.2 |
| E | 8.0 | 0.0 | 16.8 | 11.0 | 17.8 | 9.5 | 16.1 | 0.0 |
| F | 11.5 | 4.2 | 15.1 | 10.0 | 13.3 | 5.0 | 16.2 | 0.0 |
© 2020 by the authors. Licensee MDPI, Basel, Switzerland. This article is an open access article distributed under the terms and conditions of the Creative Commons Attribution (CC BY) license (http://creativecommons.org/licenses/by/4.0/).
Share and Cite
Chiou, Y.-S.; Saputro, S.; Sari, D.P. Visual Comfort in Modern University Classrooms. Sustainability 2020, 12, 3930. https://doi.org/10.3390/su12093930
Chiou Y-S, Saputro S, Sari DP. Visual Comfort in Modern University Classrooms. Sustainability. 2020; 12(9):3930. https://doi.org/10.3390/su12093930
Chicago/Turabian StyleChiou, Yun-Shang, Satryo Saputro, and Dany Perwita Sari. 2020. "Visual Comfort in Modern University Classrooms" Sustainability 12, no. 9: 3930. https://doi.org/10.3390/su12093930