Land Use and Land Cover Change Detection and Prediction in the Kathmandu District of Nepal Using Remote Sensing and GIS

 ,
, 
Abstract
:1. Introduction
2. Study Area
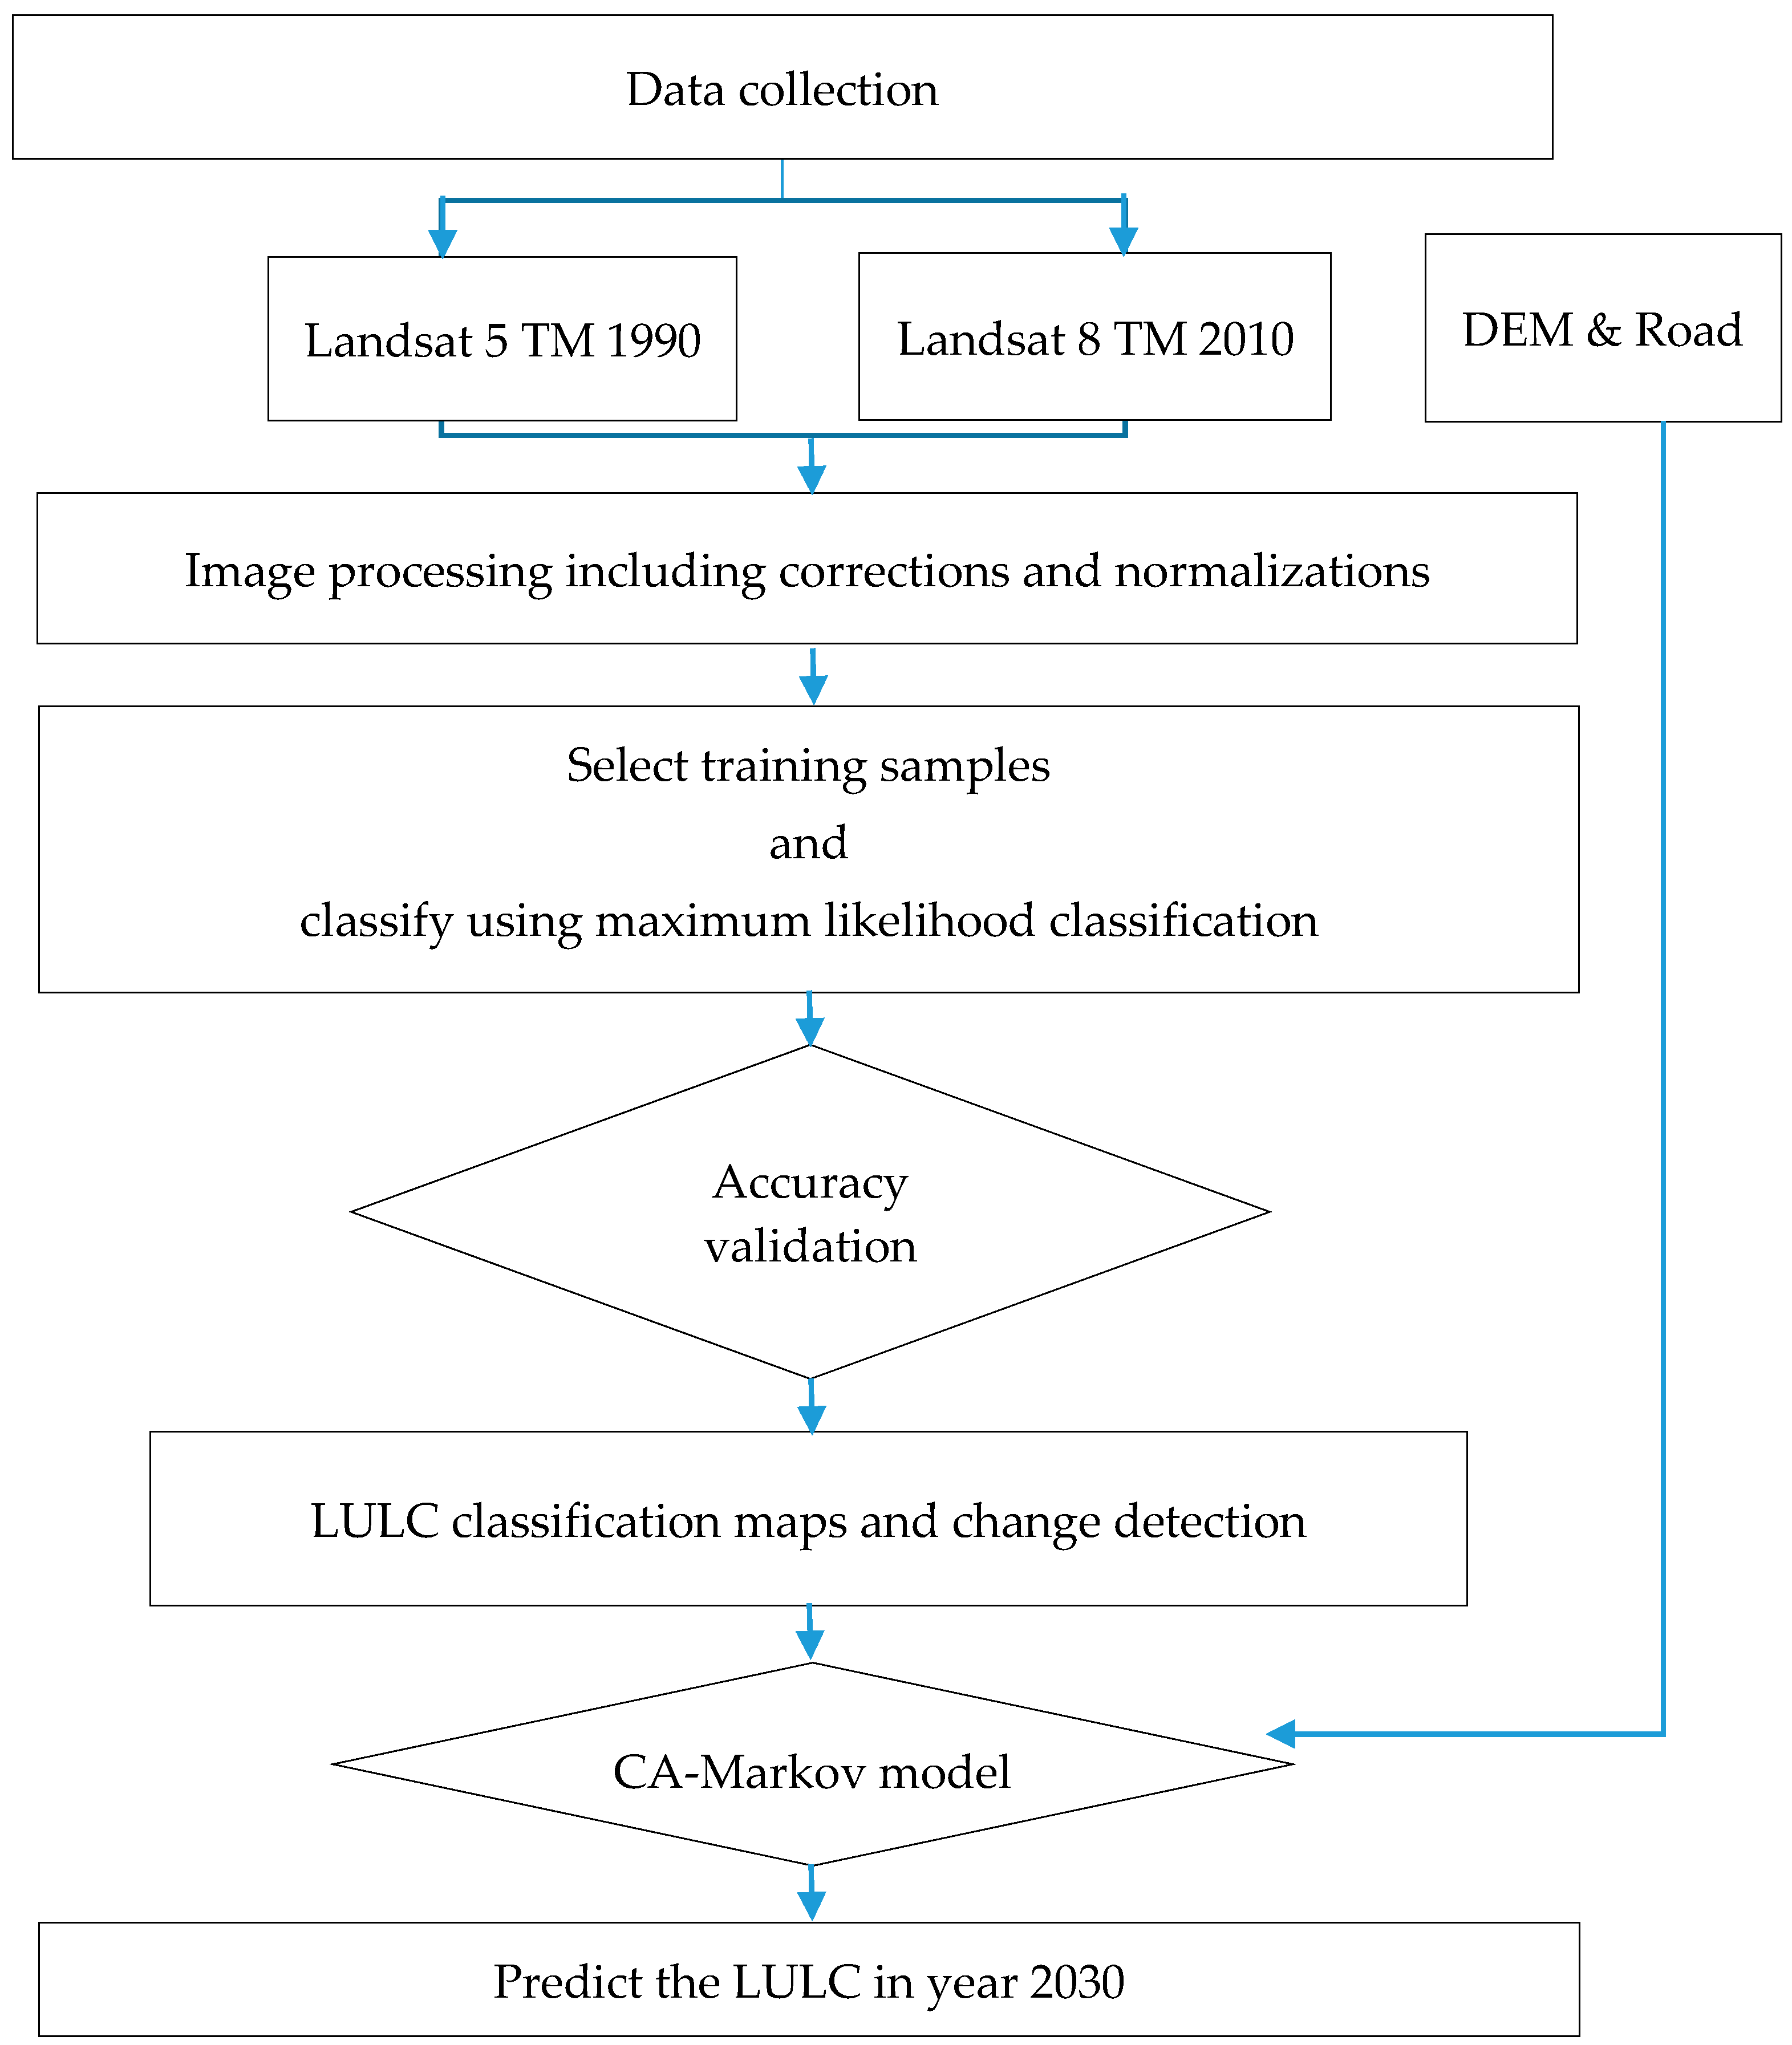
3. Methodology
3.1. Data Acquisitions and Use
3.2. Image Preprocessing
3.3. Land Cover Classification
3.4. Classification Accuracy Assessment
3.5. Land Use Land Cover Change Analysis
3.5.1. Markov Chain Analysis
3.5.2. The CA–Markov Model
4. Results and Discussion
4.1. Classification Accuracy Results
4.2. Analysis of Land Use and Land Cover Types
4.2.1. Analysis of Land Use and Land Cover Classes for 1990
4.2.2. Analysis of Land Use and Land Cover Classes for 2010
4.3. Analysis of Land Use and Land Cover Class Change Trends between 1990 and 2010
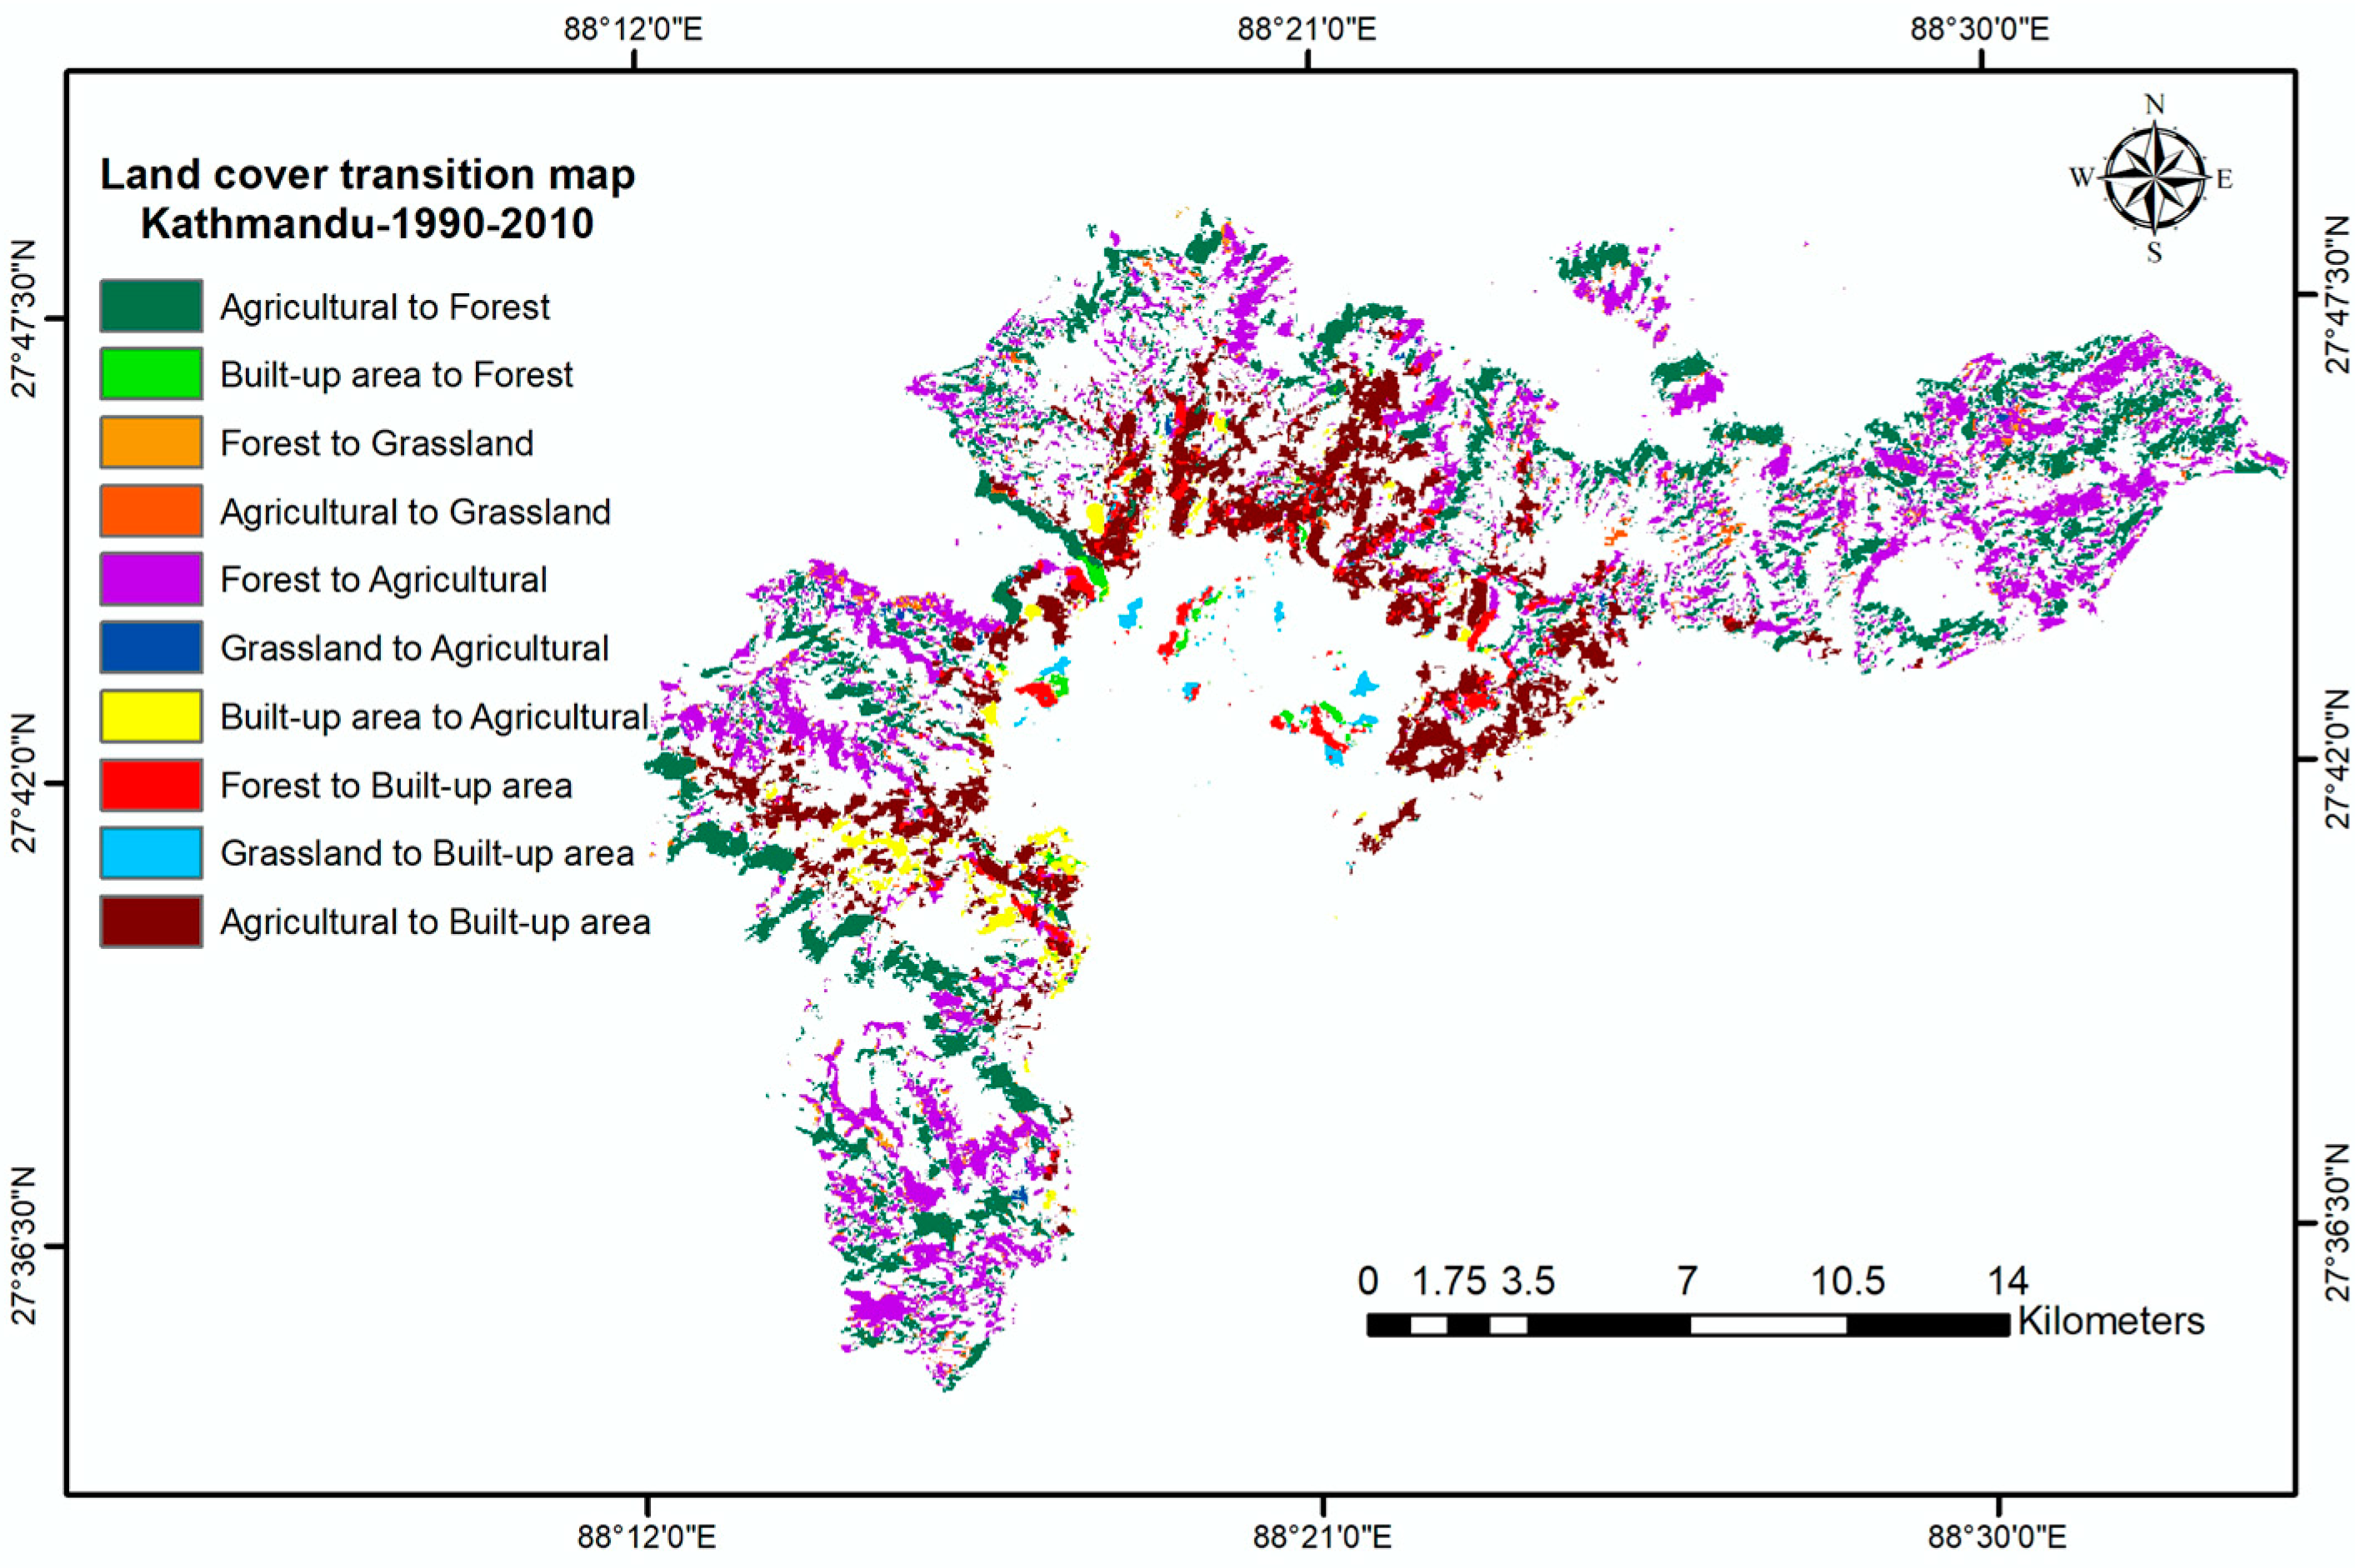
4.4. Land Use and Land Cover Change Transition Matrix from 1990–2010
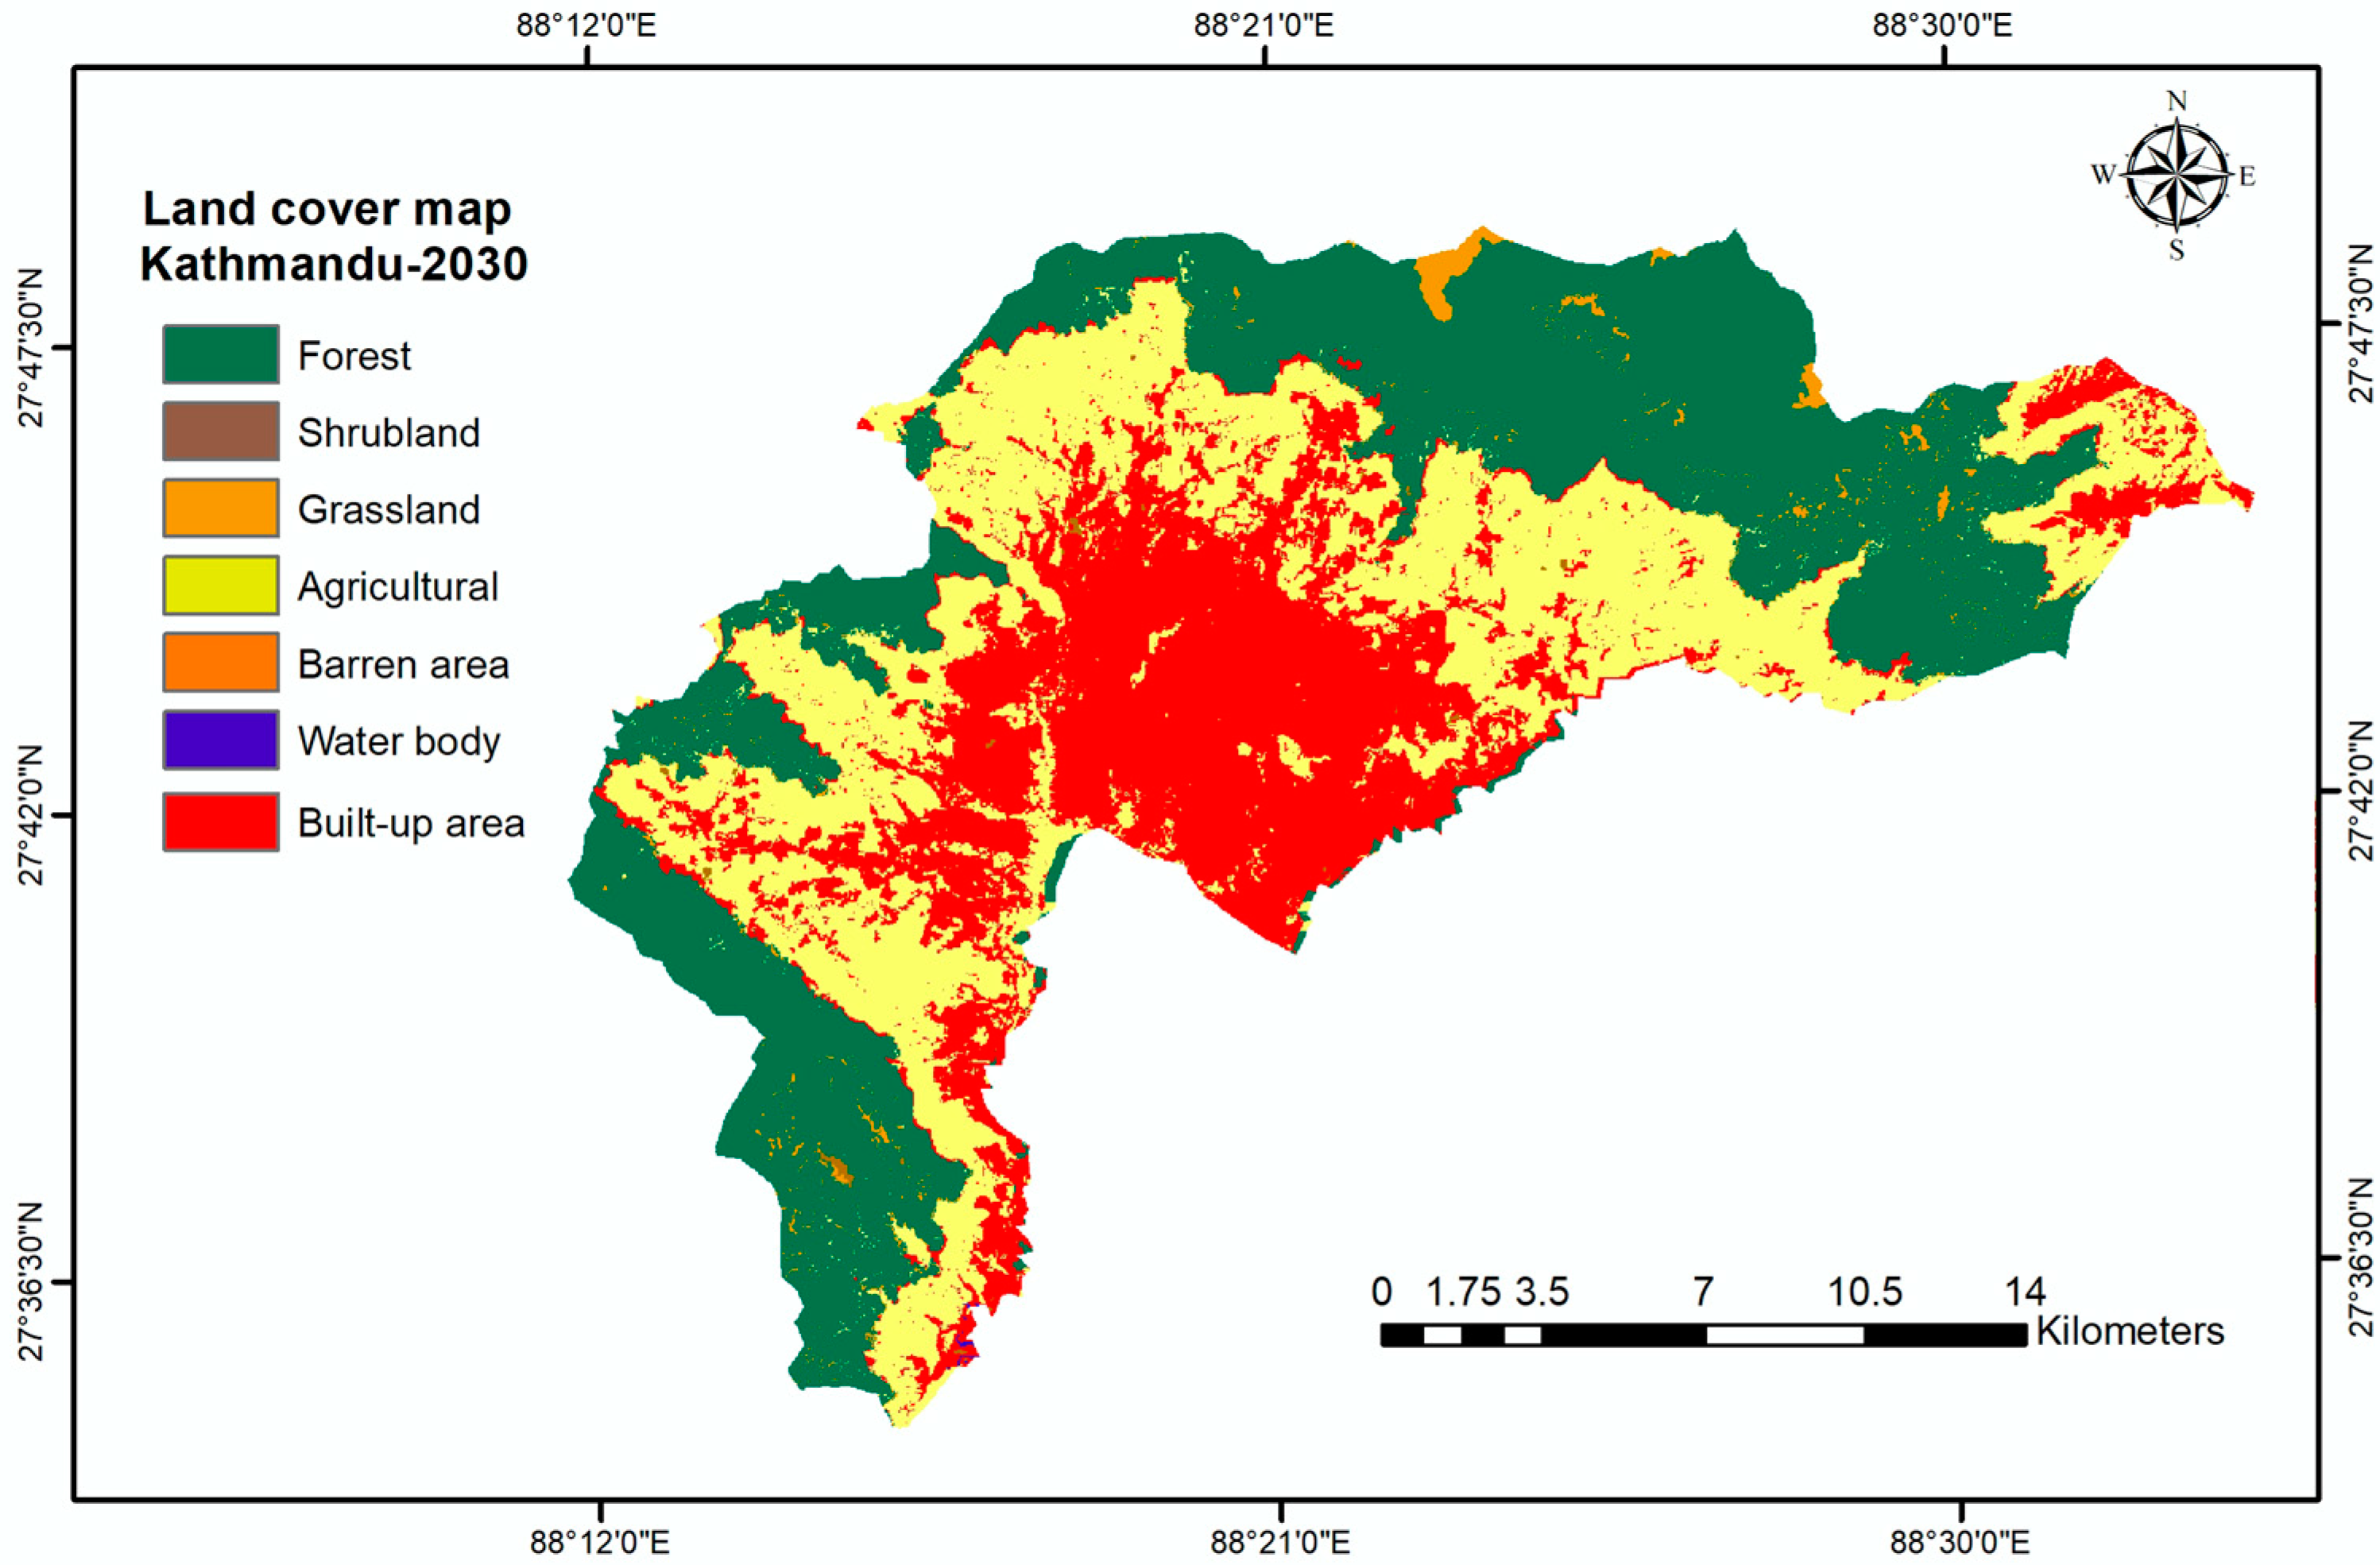
4.5. Land Use Land Cover Change Prediction
5. Conclusions
Author Contributions
Funding
Acknowledgments
Conflicts of Interest
References
- Shiferaw, H.; Bewlet, W.; Alamirew, T.; Zeleke, G.; Teketay, D.; Bekele, K.; Schaffner, U.; Eckert, S. Implications of land use/land cover dynamics and Prosopis invasion on ecosystem service values in Afar Region, Ethiopia. Sci. Total Environ. 2019, 675, 354–366. [Google Scholar] [CrossRef]
- Teketay, D. Deforestation, wood famine, and environmental degradation in Ethiopia’s highland ecosystems: Urgent need for action. Northeast Afr. Stud. 2001, 1, 53–76. [Google Scholar] [CrossRef]
- Lambin, E.F.; Turner, B.L.; Geist, H.J.; Agbola, S.B.; Angelsen, A.; Bruce, J.W.; Coomes, O.T.; Dirzo, R.; Fische, G.; Folke, C.; et al. The cause of land use and land cover change: Moving beyond the myths. Glob. Environ. Chang. 2001, 11, 261–269. [Google Scholar] [CrossRef]
- Lambin, E.F. Modelling and monitoring land-cover change processes in tropical regions. Progr. Phys. Geogr. 1997, 21, 375–393. [Google Scholar] [CrossRef]
- Abbas, I.I.; Muazu, K.M.; Ukoje, J.A. Mapping land use-land cover change detection in Kafur local government, Katsina, Nigeria (1995–2008) using remote sensing and GIS. Res. J. Environ. Earth Sci. 2010, 2, 6–12. [Google Scholar]
- Screenivasulu, V.; Bhaskar, P.U. Change detection in land use and land cover using remote sensing and GIS techniques. Int. J. Eng. Sci. Technol. 2010, 2, 7758–7762. [Google Scholar]
- Hassan, M.M.; Nazem, M.N.I. Examination of land use/land cover changes, urban growth dynamics, and environmental sustainability in Chittagong city, Bangladesh. Environ. Dev. Sustain. 2015, 18, 9672–9678. [Google Scholar] [CrossRef]
- Torbick, N.M.; Qi, J.; Roloff, G.J.; Stevenson, R.J. Investigating impacts of land-use land cover change on wetlands in the Muskegon river watershed, Michigan, USA. Wetlands 2006, 26, 1103–1113. [Google Scholar] [CrossRef]
- Sala, O.E.; Chapin, F.S.; Armesto, J.J.; Berlow, E.; Bloomfield, J.; Dirzo, R.; Huber-Sanwald, E.; Huenneke, L.F.; Jackson, R.B.; Kinzig, A.; et al. Global biodiversity scenarios for the year 2100. Science 2000, 287, 1770–1774. [Google Scholar] [CrossRef]
- Batisani, N.; Yarnal, B. Urban expansion in Centre County, Pennsylvania: Spatial dynamics and landscape transformations. Appl.Geogr. 2009, 29, 235–249. [Google Scholar] [CrossRef]
- Liping, C.; Yujun, S.; Saeed, S. Monitoring and predicting land use and land cover changes using remote sensing and GIS techniques—A case study of a hilly area, Jiangle, China. PLoS ONE 2018, 13, e0200493. [Google Scholar] [CrossRef] [PubMed]
- Rojas, C.; Pino, J.; Basnou, C.; Vivanco, M. Assessing land-use and cover changes in relation to geographic factors and urban planning in the metropolitan area of concepcion’ (Chile). Implications for biodiversity conservation. Appl. Geogr. 2013, 39, 93–103. [Google Scholar] [CrossRef]
- Jianchu, X.; Fox, J.; Vogler, J.B.; Yongshou, Z.P.F.; Lixin, Y.; Jie, Q.; Leisz, S. Land use and land cover change and farmer vulnerability in Xishuangbanna Prefecture in Southwestern China. Environ. Manag. 2005, 36, 404–413. [Google Scholar] [CrossRef] [PubMed]
- Li, L.; Lu, L.; Kuang, D. Examining urban impervious surface distribution and its dynamic change in Hangzhou Metropolis. Remote Sens. 2016, 8, 265. [Google Scholar] [CrossRef] [Green Version]
- Basommi, L.P.; Guan, Q.-F.; Cheng, D.-D.; Singh, S.K. Dynamics of land use change in a mining area: As case study of Nadowli District, Ghana. J. Mt. Sci. 2016, 13, 633–642. [Google Scholar] [CrossRef]
- McCarthy, M.P.; Best, M.J.; Betts, R.A. Climate change in cities due to global warming and urban effects. Geophys. Res. Lett. 2010, 37, L09705. [Google Scholar] [CrossRef] [Green Version]
- Kaufmann, R.K.; Seto, K.C.; Schneider, A.; Liu, Z.; Zhou, L.; Wang, W. Climate response to rapid urban growth: Evidence of a human-induced precipitation deficit. J. Clim. 2007, 20, 2299–2306. [Google Scholar] [CrossRef]
- Carlson, T.N.; Arthur, S.T. The impact of land cover changes due to urbanization on surface microclimate and hydrology: A satellite perspective. Glob. Planet. Chang. 2000, 25, 49–65. [Google Scholar] [CrossRef]
- Lu, D.; Mausel, P.; Brondizio, E.; Moran, E. Change detection techniques. Int. J. Remote Sens. 2003, 25, 2365–2401. [Google Scholar] [CrossRef]
- Loveland, T.; Sohl, T.; Stehman, S.; Gallant, A.; Sayler, K.; Napton, D. A strategy for estimating the rates of recent United States land cover changes. Photogramm. Eng. Remote Sens. 2002, 68, 1091–1099. [Google Scholar]
- Addo, K.A. Urban and peri-urban agriculture in developing countries studied using remote sensing and in situ methods. Remote Sens. 2010, 2, 497–513. [Google Scholar] [CrossRef] [Green Version]
- Rojan, J.; Chen, D. Remote sensing technology for mapping and monitoring land-cover and land-use change. Prog. Plan. 2004, 61, 301–325. [Google Scholar] [CrossRef]
- Weng, Q. A remote sensing-GIS evaluation of urban expansion and its impact on surface temperature in the Zhujiang delta, China. Int. J. Remote Sens. 2001, 22, 1999–2014. [Google Scholar]
- Coppin, P.; Jonckheere, K.; Nackaerts, K.; Muys, B. Digital change detection methods in ecosystem monitoring: A review. Int. J. Remote Sens. 2004, 25, 1565–1596. [Google Scholar] [CrossRef]
- Veldkamp, A.; Lambin, E.F. Predicting land-use change. Agric. Ecosyst. Environ. 2001, 85, 1–6. [Google Scholar] [CrossRef]
- Eastman, J.R. IDRISI Guide to GIS and Image Processing. Accessed in IDRISI Selva 1; Clark University: Worcester, MA, USA, 2009; pp. 182–185. [Google Scholar]
- Kumar, P.; Jain, S.; Gurjar, B.R.; Sharma, P.; Khare, M.; Morawska, L.; Britter, R. New directions: Can a “blue sky” return to Indian megacities? Atmos. Environ. 2013, 71, 198–201. [Google Scholar] [CrossRef] [Green Version]
- Theobald, D.M.; Hobbs, N.T. Forecasting rural land-use change: A comparison of regression- and spatial transition-based models. Geograph. Environ. Model. 1998, 2, 65–82. [Google Scholar]
- Lamchin, M.; Lee, W.K.; Jeon, S.W.; Wang, S.W.; Lim, C.H.; Song, C.; Sung, M. Long-term trend and correlation between vegetation greenness a climate variable in Asia based on satellite data. Sci. Total Environ. 2018, 618, 1089–1095. [Google Scholar] [CrossRef]
- Overmars, K.P.; de Koning, G.H.J.; Veldkamp, A. Spatial autocorrelation in multi-scale land use models. Ecol. Model. 2003, 164, 257–270. [Google Scholar] [CrossRef]
- Hyandye, C. GIS and logit regression model applications in land use and land cover chnge and distribution in Usangu catchment. Am. J. Remoste Sens. 2015, 3, 6–16. [Google Scholar] [CrossRef] [Green Version]
- Aitkenhead, M.L.; Alders, H.H. Predicting land cover using GIS, Bayesian and evolutionary algorithm methods. J. Environ. Manag. 2009, 90, 236–250. [Google Scholar] [CrossRef] [PubMed]
- Singh, S.K.; Mustak, S.; Srivastava, P.K.; Szabo, S.; Islam, T. Predicting spatial and decadal LULC changes through cellular automata Markov chain models using earth observation datasets and geo-information. Environ. Proces. 2015, 2, 61–78. [Google Scholar] [CrossRef] [Green Version]
- Yang, X.; Zheng, X.-Q.; Lv, L.-N. Spatiotemporal model of land use change based on ant colony optimization, Markov chain and cellular automata. Ecol. Model. 2012, 233, 11–19. [Google Scholar] [CrossRef]
- Subedi, P.; Subedi, K.; Thapa, B. Application of a hybrid cellular automation-Markov (CA-Markov) model in land change prediction: A case study of saddle creek drainage basin, Florida. Sci. Educ. 2013, 1, 126–132. [Google Scholar]
- Stefanov, W.L.; Ramsey, M.S.; Christensen, P.R. Monitoring urban land cover change: An expert system approach to land cover classification of semiarid to arid urban centers. Remote Sens. Environ. 2001, 77, 173–185. [Google Scholar] [CrossRef]
- Ralha, C.G.; Abreu, C.G.; Coelho, C.G.C.; Zaghetto, A.; Macchiavello, B.; Machado, R.B. A multi-agent model system for land use change simulation. Remotes Sens. Environ. 2013, 42, 30–46. [Google Scholar] [CrossRef]
- Sohl, T.L.; Claggett, P.R. Clarity versus complexity: Landuse modeling as a practical tool for decision makers. J. Environ. Manag. 2013, 129, 235–243. [Google Scholar] [CrossRef]
- Zhao, L.; Peng, Z.-R. Lansys: An agent-based cellular automata model of land use change developed for transportation analysis. J. Transp. Geogr. 2012, 25, 35–49. [Google Scholar] [CrossRef]
- Baker, W.L. A review of models of landscape change. Landsc. Ecol. 1989, 2, 111–133. [Google Scholar] [CrossRef]
- Bell, E.J.; Hinojosa, R.C. Markov analysis of land use change: Continuous time and stationary processes. Socio Econ. Plan. Sci. 1977, 11, 13–17. [Google Scholar] [CrossRef]
- Muller, M.R.; Middleton, J. A Markov model of land-use change dynamics in the Niagara Region. Ontario, Canada. Landsc. Ecol. 1994, 9, 151–157. [Google Scholar]
- Sinha, P.; Kumar, L. Markov land cover change modeling using pairs of time series satellite images. Photogramm. Eng. Remote Sens. 2013, 79, 1037–1051. [Google Scholar] [CrossRef]
- Sklar, F.H.; Costanza, R. The development of dynamic spatial models for landscape ecology: A review and prognosis. In Ecological Studies, Quantatitive Methods in Landscape Ecology; Turner, M.G., Gardner, R.H., Eds.; Springer: Berlin/Heilderberg, Germany, 1991; Volume 82, pp. 239–288. [Google Scholar]
- Appiah, D.O.; Schroder, D.; Forkuo, E.K.; Bugri, J.T. Application of geo-information techniques in land use and land cover change analysis in a peri-urban district of Ghana. Int. J. Geo Inf. 2015, 4, 1265–1289. [Google Scholar] [CrossRef] [Green Version]
- Halmy, M.W.; Gessler, P.E.; Hicke, J.A.; Salem, B.B. Land use/land cover change detection and prediction in the north-western coastal desert of Egypt using Markov-CA. Appl. Geogr. 2015, 63, 101–112. [Google Scholar] [CrossRef]
- Taubenbock, H.; Wiesner, M.; Felbier, A.; Marconcini, M.; Dech, T.E. New dimensions of urban landscapes: The spatio-temporal evolution from a polynuclei area to a mega-region based on remote sensing data. Appl. Geogr. 2014, 47, 137–153. [Google Scholar] [CrossRef]
- Hadi, S.J.; Shafri, H.Z.M.; Mahir, M.D. Modelling LULC for the period of 2010–2030 using GIS and remote sensing: A case study of Tikrit, Iraq. IOP Conf. Ser. Earth Environ. Sci. 2014, 20, 1–11. [Google Scholar] [CrossRef] [Green Version]
- Islam, M.S.; Ahmed, R. Land use change prediction in Dhaka city using GIS aided Markov chain modeling. J. Life Earth Sci. 2011, 6, 81–89. [Google Scholar] [CrossRef] [Green Version]
- Huang, W.; Luan, Q.; Jiang, Q.; Liu, J.; Liu, H. Detection and prediction of land use change in Beijing based on remote sensing and GIS. The international archives of the photogrammetry. Remote Sens. Spat. Inf. Sci. 2008, 37, 6b. [Google Scholar]
- Turner, B.L.; Lambinm, E.F.; Reenberg, A. The emergence of land change science for global environmental change and sustainability. Proc. Natl. Acad. Sci. USA 2007, 104, 20666–20671. [Google Scholar] [CrossRef] [Green Version]
- Kalnay, E.; Cai, M. Impact of urbanization and land-use change on climate. Nature 2003, 423, 528–531. [Google Scholar] [CrossRef]
- Gao, J. Land Cover Change and Its Relationship with Climate Change in Koshi River Basin of Central Himalaya; Institute of Geographic Sciences and Natural Resources; Graduate University of Chinese Academy of Sciences: Beijing, China, 2012; p. 160. [Google Scholar]
- Gautam, A.P.; Webb, E.L.; Shivakoti, G.P.; Zoebisch, M.A. Land use dynamics and landscape change pattern in a mountain watershed in Nepal. Agric. Ecosyst. Environ. 2003, 99, 83–96. [Google Scholar] [CrossRef]
- Khanal, N. Land Use and Land Cover Dynamics in the Himalaya: A Case Study of the Madi Watershed, Western Development Region, Nepal; Tribhuvan University: Kirtipur, Nepal, 2002; p. 297. [Google Scholar]
- Shrestha, D.P.; Zinck, J.A. Land use classification in mountainous areas: Integration of image processing, digital elevation data and field knowledge (application to Nepal). Int. J. Appl. Earth Observ. Geoinf. 2001, 3, 78–85. [Google Scholar] [CrossRef]
- Thapa, G.B. Land use, land management and environment in a subsistence mountain economy in Nepal. Agric. Ecosyst. Environ. 1996, 57, 57–71. [Google Scholar] [CrossRef]
- Virgo, K.; Subba, K. Land-Use Change between 1978 and 1990 in Dhankuta District, Koshi Hills, Eastern Nepal. Mt. Res. Dev. 1994, 14, 159–170. [Google Scholar] [CrossRef]
- FAO. Statistical Year Book 2014, Asia and the Pacific Food and Agriculture; Food and Agriculture Organization of the United Nations Regional Office for Asia and the Pacific: Bangkok, Thailand, 2014; p. 176. [Google Scholar]
- Sharma, B. The Role of Pasture and Fodder Development Program for Landless Farmer in Degraded Forest Land of Agri-Environment and Biodiversity Section; Ministry of Agriculture and Cooperatives: Kathmandu, Nepal, 2006; pp. 89–99. [Google Scholar]
- Khanal, N.; Uddin, K.; Matin, M.A.; Tenneson, K. 2019 Automatic detection of spatiotemporal urban expansion patterns by fusing OSM and landsat data in Kathmandu. Remote Sens. 2019, 11, 2296. [Google Scholar] [CrossRef] [Green Version]
- Ishtiaque, A.; Shrestha, M.; Chhetri, N. Rapid urban growth in the Kathmandu valley, Nepal: Monitoring land use land cover dynamics of a Himalayan city with landsat imageries. Environments 2017, 4, 72. [Google Scholar] [CrossRef]
- Paudel, B.; Zhang, Y.-L.; Li, S.-C.; Liu, L.-S.; Wu, Z.; Khanal, N.R. Review of studies on land use and land cover change in Nepal. J. Mt. Sci. 2016, 13, 643–660. [Google Scholar] [CrossRef]
- Rimal, G. Urban growth and land use/land cover change of Pokhara sub-metropolitain city, Nepal. J. Theor. Appl. Inf. Technol. 2011, 26, 1–9. [Google Scholar]
- Thapa, R.B.; Murayama, Y. Examing spatiotemporal urbanization patterns in Kathmandu valley, Nepal: Remote sensing and spatial metrics approaches. Remote Sens. 2009, 1, 534–556. [Google Scholar] [CrossRef] [Green Version]
- Haack, B.N.; Rafter, A. Urban growth analysis and modeling in the Kathmandu valley, Nepal. Habitat Int. 2006, 30, 1056–1065. [Google Scholar] [CrossRef]
- UN Department of Economics and Social Affairs. World Urbanization Prospects: The 2014 Revision; UNDESA: New York, NY, USA, 2014. [Google Scholar]
- World Population Review. Kathmandu City, Nepal. 2020. Available online: https://worldpopulationreview.com/countries/nepal-population/cities/ (accessed on 28 February 2020).
- Nepal, U. Population Situation Analysis of Nepal; Technical Report; UNFPA Nepal: Lalitpur, Nepal, 2017. [Google Scholar]
- International Institute for Environment and Development. Climate Change and the Urban Poor: Risk and Resilience in the 15 of the World’s Most Vulnerable Cities; IIED: London, UK, 2009. [Google Scholar]
- Dutta, V. Land use dynamics and peri-urban growth characteristics reflections on master plan and urban suitability from a sprawling north Indian city. Environ. Urban. Asia 2012, 3, 277–301. [Google Scholar] [CrossRef]
- Suresh, Y.; Balachandar, D.; Murthy, K.R.; Muruganandam, R.; Kumaraswamy, K. Land use/land cover change detection through using remote sensing and GIS technology-a case study of St. Thomas Mount Block, Kancheepuram district, Tamil Nadu. Int. J. Curr. Res. 2011, 3, 501–504. [Google Scholar]
- Barnekow Lillesø, J.-P.; Shrestha, T.B.; Dhakal, L.P.; Nayaju, R.P.; Shrestha, R. The Map of Potential Vegetation of Nepal—A forestry/agroecological/biodiversity classification system. In Forest Landscape Development Environment; Prinfo: Aalborg, Denmark, 2005; ISBN 87-7903-210-9. [Google Scholar]
- Richter, R.; Schlapfer, D. Atmospheric/Topographic Correction for Satellite Imagery ATCOR-2/3 User Guid; ReSe Applications Schläpfer: Langeggweg, Switzerland, 2014. [Google Scholar]
- Wondrade, N.; Dick, O.B.; Tveite, H. GIS based mapping of land cover changes utilizing multitemporal remotely sensed image data in lake Hawassa watershed, Ethiopia. Environ. Monit. Asses. 2014, 186, 1765–1780. [Google Scholar] [CrossRef] [PubMed]
- Bui, T.D.; Maier, S.T.; Austin, C.M. Land cover and land use change related to shrimp farming in coastal areas of Quang Ninh, Vietnam using remotely sensed data. Environ. Earth Sci. 2013. [Google Scholar] [CrossRef]
- Pabi, O. Understanding land-use/cover change process for land and environmental resources use management policy in Ghana. Geo J. 2007, 68, 369–383. [Google Scholar] [CrossRef]
- Lillesand, T.M.; Kiefer, R.W. Remote Sensing and Image Interpretation; Wiley: New York, NY, USA, 1999. [Google Scholar]
- Thom, B. Special Issue on the October 1993 Conference on Land-Use and Land-Cover in Australia-Living with Global Change-Preface; John Wiley & Sons Ltd.: Hoboken, NJ, USA, 1994. [Google Scholar]
- Pielke, R.A.; Marland, G.; Betts, R.A.; Chase, T.N.; Eastman, J.L.; Niles, J.O.; Niyogi, D.D.S.; Running, S.W. The influence of land-use changes and landscape dynamics on the climate system: Relevance to climate-change policy beyond the radiative effect of greenhouse gases. Philosophical Transactions of the Royal Society of London. Series A Math. Phys. Eng. Sci. 2002, 360, 1705–1719. [Google Scholar] [CrossRef]
- Hailemariam, S.N.; Soromessa, T.; Teketay, D. Land use and land cover change in the Bale Mountain eco-region of Ethiopia during 1985 to 2015. Land 2016, 5, 41. [Google Scholar] [CrossRef] [Green Version]
- Molla, M.B.; Ikporukpo, C.; Olatubara, C. The spatio-temporal pattern of urban green spaces in southern Ethiopia. Am. J. Geogr. Inf. Syst. 2018, 7, 1–14. [Google Scholar]
- Congralton, R.G. A review of assessing the accuracy of classifications of remotely sensed data. Remote Sens. Environ. 1991, 37, 35–46. [Google Scholar] [CrossRef]
- Keshtkar, H.; Voigt, W.; Alizadeh, E. Land-cover classification and analysis of change using machine-learning classifiers and multi-temporal remote sensing imagery. Arab. J. Geosci. 2017, 10. [Google Scholar] [CrossRef]
- Congalton, R.G.; Green, K. Assessing the Accuracy of Remotely Sensed Data: Principles and Practices, 2nd ed.; Taylor and Francis Group, LLC: Abingdon, UK, 2009. [Google Scholar]
- IDRISI. Andes Guide to GIS and Image Processing. Clark Labs; Clark University: Worcester, MA, USA, 2006. [Google Scholar]
- Samat, N.; Hasni, R.; Abdalla, Y.; Elhadary, E. Modelling land use changes at the peri-urban areas using geographic information systems and cellular automata model. J. Sustain. Dev. 2011, 4, 72–84. [Google Scholar] [CrossRef]
- Hua, A.K. Land use land cover changes in detection of water quality: A study based on remote sensing and multivariate statistics. J. Environ. Public Health 2017. [Google Scholar] [CrossRef] [PubMed] [Green Version]
- Maingi, J.K.; Marsh, S.E. An Accuracy Assessment of 1992 Landsat-MSS Derived Land Cover for the Upper San Pedro Watershed (U.S./Mexico); United States Environmental Protection Agency: Washington, DC, USA, 2002; p. 29. [Google Scholar]
- Manonmani, R.; Suganya, G.M.D. Remote sensing and GIS application in change detection study in urban zone using multi temporal satellite. Int. J. Geomat. Geosci. 2010, 1, 60–65. [Google Scholar]
- Zhang, Y.; Qi, W.; Zhou, C.; Ding, M.; Liu, L.; Gao, J.; Bai, W.; Wang, Z.; Zheng, D. Spatial and temporal variability in the net primary production of alpine grassland on the Tibetan Plateau since 1982. J. Geogr. Sci. 2014, 24, 269–287. [Google Scholar] [CrossRef]
- Malla, Y.B. Impact of community forestry policy on rural livelihoods and food security in Nepal. Unasylva 2000, 51, 37–45. [Google Scholar]
- Sun, C.L.; Wu, Z.F.; Lv, Z.Q.; Yao, N.; Wei, J.B. Quantifying different types of urban growth and the change dynamic in Guangzhou using multi-temporal remote sensing data. Int. J. Appl. Earth Observ. Geoinf. 2013, 21, 409–417. [Google Scholar] [CrossRef]
- Pandey, B.; Seto, K.C. Urbanization and agricultural land loss in India: Comparing satellite estimates with census data. J. Environ. Manag. 2015, 148, 53–66. [Google Scholar] [CrossRef]
- Hegazy, I.R.; Kaloop, M.R. Monitoring urban growth and land use change detection with GIS and remote sensing techniques in Dhqahlia governorate Egypt. Int. J. Sustain. Built Environ. 2015, 4, 117–124. [Google Scholar] [CrossRef] [Green Version]


| Land Cover Types | 1990 | 2010 | Overall Change 1 | % Change 2 | ||
|---|---|---|---|---|---|---|
| Area (km2) | % | Area (km2) | % | Area (km2) | ||
| Forest | 186.21 | 42.44 | 168.93 | 38.49 | −17.27 | −9.28 |
| Shrub land | 0.15 | 0.03 | 0.0027 | 0.00 | −0.15 | −98.20 |
| Grass land | 2.96 | 0.67 | 4.806 | 1.10 | 1.85 | +62.36 |
| Agricultural | 183.11 | 41.73 | 165.16 | 37.63 | −17.95 | −9.80 |
| Barren area | 0.80 | 0.18 | 0.6084 | 0.14 | −0.19 | −23.95 |
| Water body | 0.47 | 0.11 | 0.108 | 0.02 | −0.37 | −77.02 |
| Built-up area | 65.09 | 14.83 | 99.24 | 22.61 | 34.15 | +52.47 |
| Total | 438.79 | 100.00 | 438.86 | 100.00 | 0.07 |
| Forest | Shrub Land | Grass Land | Agricultural Land | Barren Area | Water Body | Built-up Area | |
|---|---|---|---|---|---|---|---|
| Forest | 113.68 | 0.00 | 1.92 | 43.62 | 0.24 | 0.02 | 4.67 |
| Shrub land | 0.04 | 0.00 | 0.00 | 0.06 | 0.00 | 0.00 | 0.03 |
| Grass land | 0.68 | 0.00 | 0.05 | 0.94 | 0.01 | 0.00 | 1.21 |
| Agricultural | 40.29 | 0.00 | 2.44 | 103.10 | 0.29 | 0.05 | 27.90 |
| Barren area | 0.01 | 0.00 | 0.00 | 0.16 | 0.00 | 0.00 | 0.62 |
| Water body | 0.02 | 0.00 | 0.00 | 0.18 | 0.01 | 0.01 | 0.05 |
| Built-up area | 0.98 | 0.00 | 0.06 | 3.31 | 0.03 | 0.00 | 58.92 |
| LULC Classes | Area (km2) | % |
|---|---|---|
| Forest | 144.55 | −14.43 |
| Scrub land | 0.00 | −33.33 |
| Grass land | 5.09 | +5.84 |
| Agricultural | 137.65 | −16.67 |
| Barren area | 0.58 | −4.88 |
| Water bodies | 0.08 | −25.83 |
| Built-up area | 117.65 | +18.55 |
© 2020 by the authors. Licensee MDPI, Basel, Switzerland. This article is an open access article distributed under the terms and conditions of the Creative Commons Attribution (CC BY) license (http://creativecommons.org/licenses/by/4.0/).
Share and Cite
Wang, S.W.; Gebru, B.M.; Lamchin, M.; Kayastha, R.B.; Lee, W.-K. Land Use and Land Cover Change Detection and Prediction in the Kathmandu District of Nepal Using Remote Sensing and GIS. Sustainability 2020, 12, 3925. https://doi.org/10.3390/su12093925
Wang SW, Gebru BM, Lamchin M, Kayastha RB, Lee W-K. Land Use and Land Cover Change Detection and Prediction in the Kathmandu District of Nepal Using Remote Sensing and GIS. Sustainability. 2020; 12(9):3925. https://doi.org/10.3390/su12093925
Chicago/Turabian StyleWang, Sonam Wangyel, Belay Manjur Gebru, Munkhnasan Lamchin, Rijan Bhakta Kayastha, and Woo-Kyun Lee. 2020. "Land Use and Land Cover Change Detection and Prediction in the Kathmandu District of Nepal Using Remote Sensing and GIS" Sustainability 12, no. 9: 3925. https://doi.org/10.3390/su12093925