Article

Long-Term Monitoring of Soil Carbon Sequestration in Woody and Herbaceous Bioenergy Crop Production Systems on Marginal Lands in Southern Ontario, Canada

1
School of Environmental Sciences, University of Guelph, Guelph, ON N1G 2W1, Canada
2
Department of Agricultural Sciences, Kashmar Branch, Islamic Azad University, Kashmar, Iran
3
Southern Biodiversity & Monitoring Unit, Ontario Ministry of Natural Resources and Forestry, Peterborough, ON K9J3C7 Canada
*
Author to whom correspondence should be addressed.
Sustainability 2020, 12(9), 3901; https://doi.org/10.3390/su12093901
Submission received: 29 April 2020 / Revised: 5 May 2020 / Accepted: 8 May 2020 / Published: 10 May 2020
(This article belongs to the Special Issue Agroforestry and Ecosystem Regeneration)

Abstract

:
Enhancement of terrestrial carbon (C) sequestration on marginal lands in Canada using bioenergy crops has been proposed. However, factors influencing system-level C gain (SLCG) potentials of maturing bioenergy cropping systems, including belowground biomass C and soil organic carbon (SOC) accumulation, are not well documented. This study, therefore, quantified the long-term C sequestration potentials at the system-level in nine-year-old (2009–2018) woody (poplar clone 2293–29 (Populus spp.), hybrid willow clone SX-67 (Salix miyabeana)), and herbaceous (miscanthus (Miscanthus giganteus var. Nagara), switchgrass (Panicum virgatum)) bioenergy crop production systems on marginal lands in Southern Ontario, Canada. Results showed that woody cropping systems had significantly higher aboveground biomass C stock of 10.02 compared to 7.65 Mg C ha−1 in herbaceous cropping systems, although their belowground biomass C was not significantly different. Woody crops and switchgrass were able to increase SOC significantly over the tested period. However, when long term soil organic carbon (∆SOC) gains were compared, woody and herbaceous biomass crops gained 11.0 and 9.8 Mg C ha−1, respectively, which were not statistically different. Results also indicate a significantly higher total C pool [aboveground + belowground + soil organic carbon] in the willow (103 Mg ha−1) biomass system compared to other bioenergy crops. In the nine-year study period, woody crops had only 1.35 Mg C ha−1 more SLCG, suggesting that the influence of woody and herbaceous biomass crops on SLCG and ∆SOC sequestrations were similar. Further, among all tested biomass crops, willow had the highest annual SLCG of 1.66 Mg C ha−1 y−1.

1. Introduction

Under the Paris Agreement of 2015, Canada became one of 195 countries committed to limiting global average temperature increases to below 2 °C above pre-industrial levels, while working to limit the increase to 1.5 °C [1]. In an effort to formally work towards the targets set out in the Paris Agreement, the Canadian Government established a Pan-Canadian Framework on Clean Growth and Climate Change as a comprehensive program to reduce emissions across all Canadian economic sectors [2]. More recently, in 2019, greenhouse gas (GHG) emissions projections were updated, and two scenarios were introduced, including the Additional Measures scenario, which covers GHGs reduction potentials from land use, land use change, and forestry (LULUCF) [3]. Under this scenario, emissions are projected to be 592 Mt CO2 eq, or 19% below 2005 levels.
In the above context, carbon (C) sequestration through bioenergy cropping systems on non-agricultural lands in Canada is considered as one of the promising techniques to achieve Canada’s climate change mitigation goals, while simultaneously providing valuable feedstock to bioenergy industries [4]. Similar projections for biomass crops have also been put forward by other authors to move away from fossil fuels and bring about a partial solution for the global energy crises [5,6,7]. These systems sequester atmospheric CO2 in their fibre, as well as in the soil through the decomposition of litterfall, coarse root and fine-root turnover [8] in addition to other soil processes that can contribute to soil organic carbon (SOC) sequestration. Many countries have developed aspiring biofuel goals, which require large land areas under biomass crop production. In Canada, current estimated non-agricultural (marginal) land area that can be brought under biomass crop production is 9.5 million ha [9]. Meanwhile, a significant increase in bioenergy production has also been predicted based on global future energy scenarios [10,11,12,13]. Marginal land is generally considered as lands that are unsuited for sustained agriculture production due to various geophysical and climatic limitations [14,15]. Therefore, marginal land is proposed for advanced biofuel production and meeting biofuel demands without food-feed-fuel conflicts [16,17]. Furthermore, the cultivation of marginal lands or less productive agricultural lands with bioenergy crops could potentially improve soil health of the land due to their additions to soil organic matter [18].
Recent studies have shown short-term possibilities of C sequestration through aboveground biomass and SOC stocks in young bioenergy cropping systems [19,20,21]. However, SOC accumulation is a slow process, and the amount of carbon sequestered can vary over time, thus requiring long-term analysis [22,23]. Understanding the system-level C storage (long term SOC sequestration, belowground biomass C, annual litter input and fine root turnover associated C) potentials in bioenergy cropping systems, and how system-level C dynamics will change as system matures would help to understand the suitability of a bioenergy cropping system as a long-term C sink. An improved understanding of C dynamics within bioenergy systems will also help to project sequestration estimates towards meeting Canada’s net GHG emissions reduction targets. Additionally, this knowledge could support environmental management strategies associated with biofuel production, while also informing policy development and financial incentives available to landowners (e.g., C offsets), which can encourage farmers to convert degraded agricultural lands into more sustainable and environmentally benign biomass production systems [24,25].
In this study, we quantified the long-term C sequestration potentials at the system-level in woody (poplar and willow), and herbaceous (miscanthus and switchgrass) bioenergy crop production systems on marginal lands in Canada and their future contribution to climate change mitigation efforts.

2. Materials and Methods

2.1. Site Description and Experimental Design

To execute long-term monitoring of soil C sequestration and quantify system-level C gain in woody and herbaceous bioenergy crop production systems established in 2009, a two-year experiment was set-up in 2017 at the University of Guelph Agroforestry Research Station (GARS), Guelph, Ontario, Canada (latitude 43°32′28″ N, longitude 80°12′32″ W) (Figure 1). The climatic data for GARS are: average annual precipitation is 904 mm of which 338 mm is received during the growing season (May to September) and 144 frost-free days. The field site was established in 2009 at GARS for the purpose of biomass research due to low crop yields after more than 35 years of agricultural use specifically for growing corn (Zea mays L.), beans (Glycine max L. Merr), and winter wheat (Triticum avestivum L.). For this research, two woody (poplar clone 2293–29 (Populus spp.), hybrid willow clone SX 67 (Salix miyabeana)), and two herbaceous (miscanthus (Miscanthus giganteus var. Nagara), switchgrass (Panicum virgatum)) bioenergy crops were cultivated in test plots and all SOC values were assessed in 2009 [26]. These values were used as the baseline data to quantify long term SOC and system-level C gains in this study. The soil at GARS is a gray-brown luvisol with a fine sandy loam texture (56% sand, 34% silt, and 10% clay), and due to past soil erosion and presence of stones, the site has been classified as Class 3 to 4 marginal land based on Canadian Land Inventory (CLI) classification. Class 3 lands have moderate limitations that reduce the choice of crops or require special conservation practices, and Class 4 lands have severe limitations that restrict the choice of crops or require special conservation practices and very careful management, or both [14]. Since 2009, the switchgrass and miscanthus crops have been harvested on an annual basis, while the willow and poplar plots were also manually harvested in 2012, 2015, and 2018. For this study, woody biomass crops sub-plots were harvested in the fall of 2017 and 2018.
The experimental design was an unbalanced randomized complete block design with biomass crop as a factor and species or type (poplar, willow, switchgrass, and in the second year of this study miscanthus was added) at four levels. Herbaceous biomass crops (switchgrass and miscanthus) and the woody biomass crops (willow and poplar) were replicated four and six times, respectively. The experimental plots had an area of 100 m2 for switchgrass and miscanthus, and 200 m2 for poplar and willow. All treatments were tested for statistical parameters using SAS software, Version 9.4 (SAS Institute Inc. Cary, NC). General Linear Procedures in SAS (PROC GLM) were used to perform statistical analyses. The treatment sum of square was portioned using an orthogonal contrast approach to evaluate preplanned comparison between woody and herbaceous systems and to compare two woody, and two herbaceous crops within each other. A paired “t-test” was conducted to statistically assess the SOC gain between 2009 and 2018 influenced by individual biomass crop type/system. To compare all bioenergy cropping systems against each other, the least square means were computed and compared pairwise. The Shapiro–Wilk test (α = 0.05) was used to test whether residuals followed a normal distribution and, where necessary, log transformations were used to normalize residuals.

2.2. Abbreviations

To enhance readability and make figures more meaningful, abbreviations are used throughout this paper. These abbreviations are summarized in Table 1.

2.3. Above- and Belowground Biomass Carbon

C sequestration in woody (poplar and willow) and herbaceous (switchgrass and miscanthus [2018]) systems were quantitatively assessed at the end of the 2017 and 2018 growing seasons (late fall) by destructive sampling technique. Herbaceous above- and belowground biomass was sampled randomly from two sub-plot area of 0.5 × 0.5 m within the 10 × 10 m treatment plots as was in 2009, and an average value (from two sub-plots) was calculated for a 0.25 m2 area [27]. Two sub-samples per plot were taken in order to obtain a good representative sample of the above- and belowground biomass samples. Each treatment was replicated four times, 4 × 2 (sub-samples per plot) × 0.25 m2 sub-areas were sampled to obtain above- and belowground biomass samples. For woody biomass crops, the replications were equal to 6, and the area of sampling per experimental plot was 2.60 m2.
Aboveground biomass was manually harvested using hand-clippers. For woody biomass, leaves, twigs, branches, and trunk were separated, and wet weights were collected in the field using a portable commercial flatbed scale. Similarly, herbaceous aboveground biomass was also manually harvested, and wet weights were recorded in the field. All woody aboveground biomass was cut manually at 5 cm above the soil surface (the average wet weight was 8.85 kg (main stem and branches only)). As the sampling was done in late fall, most of the leaves had fallen off, but any leaves that remained on the stems were hand-removed. For all woody biomass components, sub-samples (wet-weights of sub-samples were equal to 15% to 20% of the total wet-weight of main stem and branches) from each sampling area (2.60 m2) were collected and placed in ziplock bags and were kept in a cooler with ice to weigh the sub-samples in the lab to determine the moisture content at time of harvest to calculate dry weights. The sub-samples had both the branches and the main stem in order to represent the actual harvested aboveground woody biomass. The average moisture content of the aboveground biomass was 47% ± 1.46%. Leaf litter within the delineated area (2.60 m2) was also collected and weighed to determine the wet weight, and sub-samples were collected to calculate moisture content in the lab.
Belowground biomass was quantified only in 2018 because the third year of three-year cycle for woody crops ended in 2018. For this sampling, in November 2018, samples (roots) were collected from each woody, and herbaceous cropping system replicates using destructive sampling techniques. To derive the belowground biomass samples in herbaceous crops, all soil in the 2 × 0.25 m2 area was dug up to 30 cm depth and the dug soil along with the roots were placed in small quantities on a 4 mm mesh tray and water was passed through the mesh into a collecting container. This step was done in order to remove the soil and small stones and big roots. Then the liquid in the collecting container was passed through a 1 mm mesh, and the coarse roots were picked out and weighed for wet weight. The wet weight of these coarse roots from a 0.25 m2 area and to a depth of 30 cm of soil averaged 1.28 kg. The whole coarse root samples from the sampled area (0.25 m2) were then dried in an oven at 60 °C for almost a week until a constant dry weight was derived, which averaged 0.4 kg. For herbaceous biomass crops, all sampled wet above- and belowground biomass was used to obtain the dry weight, and no sub-samples were taken. Fine roots were not quantified but were estimated as a percentage of the aboveground biomass. In woody plots, an excavating machine (Bobcat Backhoe) was used for collecting roots on an area basis (2.60 m2) so that data could be extended to a hectare of land. Once roots were excavated, remaining soil was manually washed from the roots. The fresh root biomass weights of each sample were obtained using a digital flatbed field scale and recorded. For the woody samples, subsamples of the root were also collected and weighed immediately to determine their wet weight.
After the above- and belowground sub-samples were weighed, they were sent to the lab for the determination of moisture content. In the lab, sub-samples were oven-dried at 65 °C for a minimum of 14 days until a constant weight was derived. Moisture content was then calculated by subtracting the dry sub-sample weight from that of the wet sub-sample weight, and it was divided by the wet sub-sample weight to obtain the wet moisture fraction (WF). To derive the dry weight fraction (DF), the following Equation (1) was used:
DF = [1 − WF],
The dry weight fraction was then used to convert the whole wet biomass weights to dry biomass weights for both above- and belowground biomass samples.
Total C concentration for each tree components was previously determined by high-temperature combustion techniques using Leco Carbon CR412 analyzer (LECO Corporation, MI, USA) and was compared to values reported in the literature, which indicated that the values were comparable. The C concentration of each biomass sample was determined by multiplying its total dry weight with the associated C concentration value. Carbon concentration values that were used in this study are listed in Table 2 (for switchgrass 47% was used).

2.4. Soil Organic Carbon

Soil samples within the treatment blocks were randomly collected in 2009, 2017, and 2018 from all test plots using a soil auger. To obtain a good representation and capture any variations, 10 soil samples were collected randomly from each experimental plot (same experimental plots as in 2009), at a depth of 0–15 and 15–30 cm having four replications (in total: 10 samples per plot × 2 depths × 4 replications = 80 soil samples) for herbaceous crops (switchgrass and miscanthus), and six replications (in total: 10 samples × 2 depths × 6 replications = 120 soil samples) for woody crops (poplar and willow). Samples were placed in polyethylene bags and were kept in a cooler with ice for transport to the lab. In the lab, soil samples were air-dried under ambient conditions and were mechanically crushed and sieved through a 2 mm sieve to obtain a uniform sub-sample, then further ground with a mortar and pestle to pass through 0.125 mm sieve.
To remove the organic C from sieved samples, two soil sub-samples were taken from each soil sample. One soil sub-sample was subjected to muffle furnace treatment (burned at 575 °C for 24 h) and the other in LECO CR-412 Carbon Analyzer. Sub-samples were analyzed as a pair for total C (not subjected to muffle furnace treatment) and inorganic C (subjected to muffle furnace treatment) using the combustion method in a LECO CR-412 Carbon Analyzer. SOC was then calculated for each treatment by subtracting the inorganic C from the total C values associated with paired sub-samples. SOC data obtained from 2017 and 2018 were then compared with the baseline 2009 SOC values to determine SOC gain or loss over the nine years since the establishment of the biomass cropping systems test plots.

2.5. Bulk Density Determination

Three bulk density samples were obtained for each cropping system (willow, poplar, switchgrass, and miscanthus) at 0–15 cm and 15–30 cm depths in 2009 and 2018 to allow carbon stocks to be calculated for each depth. Bulk density samples were collected by digging a 1 × 1 × 1 m pit in each cropping system, and three samples were taken from each depth (in total: 4 crops × 2 depths × 3 bulk density samples = 24 samples). Samples were first oven-dried for 48 h at 105 °C and weighed to determine their oven-dried mass (MOD). Bulk density was then corrected for root debris and rocks to obtain only the bulk density of the soil material. For this purpose, oven-dried soil samples were passed through a 2 mm sieve. The mass (MD) and volume (VD) of the root and rock material that were retained on the 2 mm sieve were recorded, and bulk density was calculated using Equation (2). VD was obtained through the water displacement method [30]. Since the volume of the soil sampling ring used was 250 cm3, this value was fixed for the total soil volume (Vtotal). SOC stock (Mg ha−1) in each cropping system for both depths was calculated using Equation (3).
Bulk density (Mg m−3) = (MOD − MD)/(Vtotal − VD),
SOC (Mg C ha−1) = [10,000 (m2) × Depth (m)] × [Bulk density (Mg m−3)] × [SOC (%)],
The average bulk density values for 0–30 cm depth were 1.32 (±0.01) and 1.34 (±0.06) g cm−3 for 2009 and 2018, respectively. Therefore, these values were used to calculate SOC stocks for their respective years, as shown in Equation (3).

2.6. System-Level Carbon Gain

System-level carbon gain (SLCG) was calculated using Equation (4):
SLCG = ∆SOC + (BGB * DCr) + (ALL * DCl) + (AFR * DCfr),
where ∆SOC represents long-term soil organic carbon (∆SOC) stock (2009 to 2018), BGB represents belowground biomass carbon (BGB) stock, DCr represents decomposition coefficient for belowground biomass (DCr) equal to 0.26 [31,32], ALL represents annual leaf litter carbon (ALL) stock, DCl represents decomposition coefficient for leaf litter (DCI) equal to 0.29 [33,34], AFR represents annual fine roots carbon (AFR) stock, and DCfr represents decomposition coefficient for fine root (DCfr) equal to 0.20 [35]. Root biomass C is a critical component of total SLCG and soil C dynamics. The belowground biomass C is usually represented by fine roots, mostly in herbaceous cropping systems [23]. Fine roots turnover (FRT) in this study was estimated at 50% of the annual litterfall C input in woody crops [8,36,37].
For example, the value for DCr was derived as (1 − 0.74 [decomposition rate]) = 0.26 (gain, after loss factor (microbial decomposition) that we used to multiply the belowground C stock of the roots), similarly, DCl (1 − 0.71) = 0.29, and DCfr (1 − 0.8) = 0.20.
As the aboveground biomass C will be utilized for energy and be removed from the site, belowground C stored in the root systems associated with the respective bioenergy crops were quantified and included in the calculation of system-level carbon gain. Although there is a temporary C gain over the rotation period (three years) for woody biomass, as it will be lost via the usage of aboveground biomass, we did not take this temporary gain in carbon into the calculation of system-level carbon gain. However, we have included and accounted for the aboveground biomass carbon as the aboveground carbon pool, which is a part of “Total C pools” of the system (Section 3.2). There will also be an additional positive impact on GHG emissions reduction to the atmosphere caused by avoided carbon gain, fossil fuel avoided as a result of energy derived from biomass sources. Accounting for this gain is beyond the scope of this study as it will depend on energy conversion efficiencies. This study, therefore, took into account both SOC and belowground root C, leaf litter, and fine root turnover to determine system-level C sequestration potentials by the tested bioenergy crops in Ontario grown on marginal lands.

3. Results

3.1. Carbon Stock Allocation in Plant Components

Results of the analysis of variance (ANOVA) for stem and leaf, aboveground and belowground (roots) C stock of biomass in 2017 and 2018 for different bioenergy cropping systems in southern Ontario, Canada are presented in Table 3. Quantified aboveground biomass C stock ranged from 4.01 Mg C ha−1 in poplar to 7.41 Mg C ha−1 in willow (Cycle 3, Year 2), and in switchgrass, it was 4.44 Mg C ha−1 in 2017 (Table 4). In 2018, aboveground biomass C stock ranged from 4.38 Mg C ha−1 in switchgrass to 12.39 Mg C ha−1 in willow (Cycle 3, Year 3) (Table 4). Belowground biomass C stock also ranged from 4.11 Mg C ha−1 in poplar to 10.06 Mg C ha−1 in willow (Cycle 3, Year 3) (Table 4).
C stock allocation in different plant components among all four biomass crops is presented in Figure 2. Results indicate that for poplar, 60.15% of total tree C was stored in stems and branches, and 4.88% in leaves, while 34.97% was stored in the roots. In poplar, leaves, stems, and branches together stored in total 65.03% of the plant C, which is the highest proportion of C within aboveground biomass quantified among all tested woody and herbaceous biomass crops in this study. For willow, 48.25% of the total tree C was stored in stems and branches, and 6.95% in leaves, while 44.80% of C was allocated to belowground roots. In this context, switchgrass and miscanthus C allocations to belowground components were 65.86% and 40.6% C, respectively, while 34.2% and 59.4% of the total C was stored in the aboveground components.

3.2. Soil and Total Carbon Pools in Woody and Herbaceous Bioenergy Cropping Systems

Results indicate that woody biomass systems (willow and poplar) and switchgrass significantly increased SOC between 2009 (baseline) to 2018 (Table 5), while miscanthus failed to reach significance. In this context, the 2018 SOC sequestration values were not significantly different across all biomass cropping systems (Table 6). The average SOC in 2018 in woody and herbaceous cropping systems were 80.1 and 73.8 Mg ha−1, respectively (Table 7). SOC sequestration gains (∆SOC) for switchgrass, willow, poplar, and miscanthus were 11.8, 11.7, 10.3, and 7.7, Mg ha−1, respectively (Table 7).
In this study, the total C pool, at the system-level, was calculated by combining all C pools for woody and herbaceous crop (SOC + above- and belowground C stock) in year of 2018. Summing all these C pools, yielded a total C pool of 91.4, 103.1, 88.7, and 90.2 Mg ha−1 for poplar, willow, switchgrass, and miscanthus, respectively (Table 7). The total C pool was significantly different between woody and herbaceous systems (Table 6). The average of the total C pools was 97.2 and 89.4 Mg ha−1 in woody and herbaceous cropping systems, respectively (Table 7).

3.3. System-Level Carbon Gain in Woody and Herbaceous Bioenergy Cropping Systems

Quantified SLCGs from 2009 to 2018 were compared among all four bioenergy cropping systems (Table 6, Figure 3) and ranged from 9.7 Mg ha−1 for miscanthus to 14.9 Mg ha−1 for willow. The average SLCG in woody and herbaceous cropping systems from 2009 to 2018 was 13.3 and 11.8 Mg ha−1, respectively (Figure 3), which were not significantly different (Table 6). In the same period, when we consider biomass crop types, switchgrass and willow gained 4.4 and 3.3 Mg ha−1 more system-level carbon in their respective systems compared to miscanthus and poplar, respectively (Figure 3).

4. Discussion

4.1. Carbon Stock Allocation in Plant Components

Data from this study show that among the woody species, willow aboveground biomass C stock was significantly (p < 0.05) higher than poplar, and among the herbaceous species, miscanthus aboveground biomass C was significantly (p < 0.05) higher than switchgrass (mean difference 4.7 Mg C ha−1 between willow and poplar and 6.5 Mg C ha−1 between miscanthus and switchgrass). However, belowground biomass C stock was not significantly different between woody and herbaceous crops (Table 3 and Table 4). The annual C accumulation found in our woody cropping systems (3.34 and 0.79 Mg C ha−1 yr−1 biomass C accumulation for above- and belowground biomass, respectively) were consistent with previously reported values by Oliveira et al. [38] that demonstrated accumulation of carbon in the belowground fraction of the biomass in poplar short rotation plantations under Mediterranean conditions ranged from 0.86 to 0.91 Mg C ha−1 yr−1, whereas the aboveground carbon accumulation ranged from 3.89 to 6.48 Mg C ha−1 yr−1. It should be explained that, in our study, the woody biomass was harvested every three years (three-year cycle) and therefore, the total aboveground biomass carbon was divided by three to calculate annual accumulation and the belowground biomass carbon was divided by nine (total age of the stand, between 2009 and 2018, Table 4). However, the stand maturity in Oliveira et al. [38] study was only three to four years. Another study by Verlinden et al. [39] recorded aboveground C accumulation as 2.5 Mg C ha−1 yr−1 under low productivity conditions. Other studies have also reported similar values (e.g., 3.1–5.75 Mg C ha−1 yr−1 [40]).
In the literature, for short rotation willow and poplar plantations, belowground biomass accumulation has been reported as 1.8–3.5 Mg ha−1 y−1 for first rotation (e.g., [33]) and 2.4 Mg ha−1 y−1 for a five-year-old (second cycle) short rotation [41]. Similar to the results derived from this study (Table 4), Coleman et al. [8] have also reported that the mean belowground biomass for willow and poplar clones were 16.51 and 8.79 Mg ha−1 (7.88 and 4.19 Mg C ha−1 y−1), respectively. Zan et al. [21] have reported an annual belowground C in the root biomass for switchgrass and willow in southwestern Quebec, Canada, over a three-year period to be 1.06 and 1.25 Mg C ha−1 y−1, respectively. These numbers are comparable to the numbers derived in this study (0.94 and 1.12 Mg C ha−1 y−1 for switchgrass and willow, respectively, Table 4). However, their numbers may be slightly higher than those reported in our study because they measured belowground biomass up to 60 cm soil depth compared to the 30 cm soil depth in our study. Therefore, results from perennial biomass studies suggest that if unproductive agricultural lands in Canada are converted to perennial biomass crops, irrespective of the type of biomass crop (herbaceous or woody), considerable amounts of atmospheric C can be stored in belowground components of the crop.
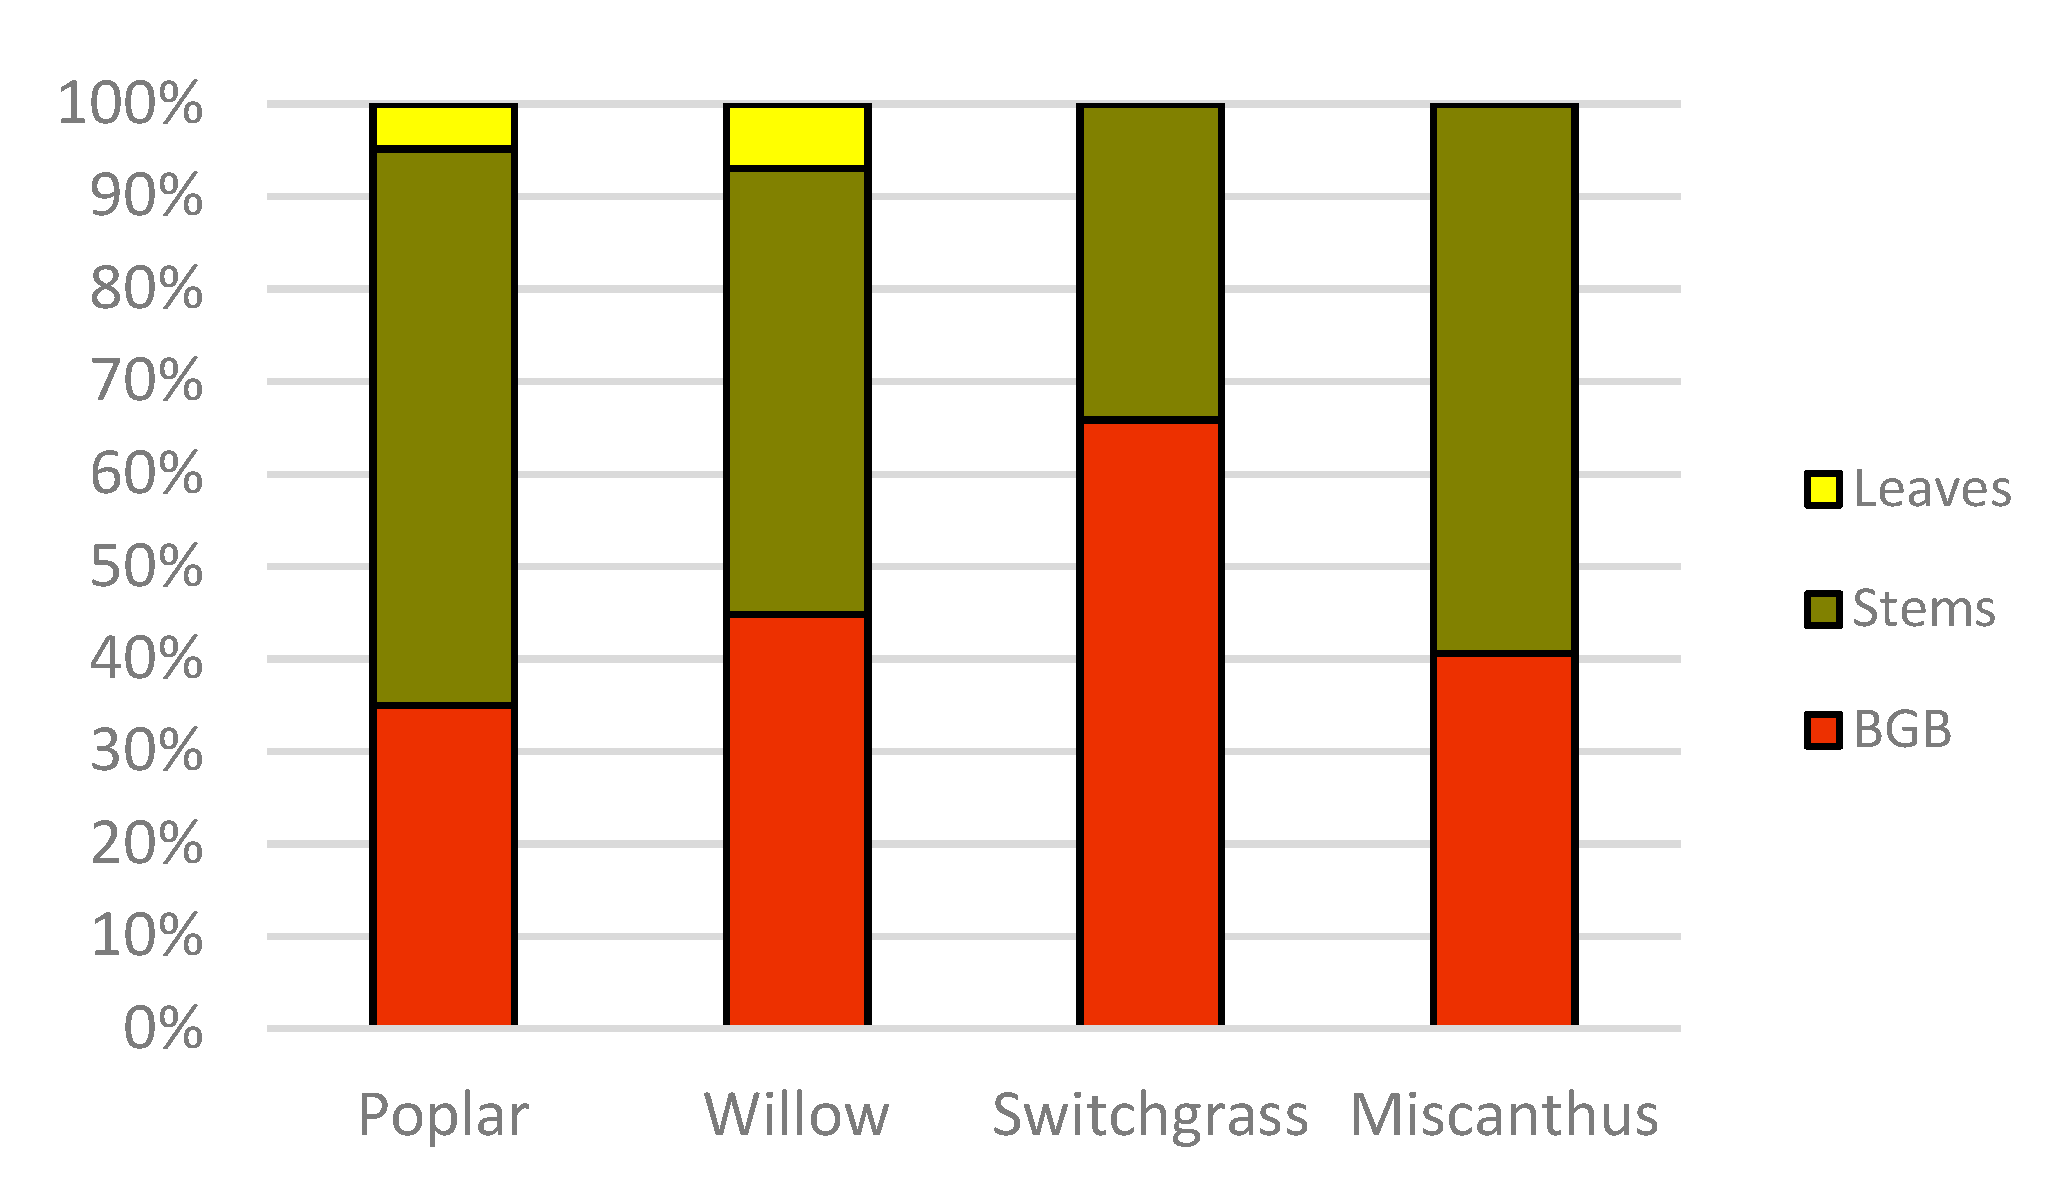
Results from this study suggest that the higher allocation of C in leaves in willow provides a potential for increased C inputs to soil via litterfall contributing to soil organic carbon (SOC) sequestration. Our findings also indicate that herbaceous biomass crops can contribute to SOC sequestration enhancement. Collectively, belowground biomass C allocations quantified in all biomass crops tested in this study suggest that they can contribute significantly to enhance SOC sequestration over the years, as they are perennial in nature. Agostini et al. [42] have reported that annual C inputs from miscanthus roots were about half that of switchgrass, given similar turnover time. However, in our study (Table 4), belowground biomass C was not significantly different between miscanthus and switchgrass, with values of 8.45 and 7.45 Mg C ha−1 for switchgrass and miscanthus, respectively. It is also worth noting that roots of herbaceous crops contributed, on an average, more than half of the total plant C (53.2%) compared to woody crop roots (39.9% of total tree C). This is particularly important as the C stock of roots have been neglected and not been estimated in most studies ([43,44] from [36]).

4.2. Soil and Total Carbon Pools in Woody and Herbaceous Bioenergy Cropping Systems

Both woody biomass cropping systems and the switchgrass system were able to increase SOC significantly (p < 0.05) in the nine-year period, while miscanthus failed to reach significance. However, when 2018 SOC sequestration values were tested across all biomass cropping systems, results indicate that SOC values were not significantly different from each other (Table 6), while willow sequestrated numerically the highest amount of SOC at 80.6 Mg ha−1 (Table 7).
It is interesting to note that the difference in SOC sequestration (∆SOC) between the woody and the herbaceous systems was only 1.2 Mg ha−1 between 2009 and 2018, which was not significant. Therefore, results from this study suggest that ∆SOC in perennial biomass systems may not be influenced by the biomass type.
In Coleman et al. [8], the conventional agricultural field having corn-bean-wheat crop rotation in GARS, Guelph, Ontario, Canada, recorded a SOC stock of 63.80 ± 7.04 Mg ha−1 at 0 to 30 cm soil depth. This agricultural field is adjacent to the biomass research plots of our study having the same soil type, (Figure 1). Comparing the 2009 baseline SOC stock value for the bioenergy cropping systems to that of the adjacent agricultural field SOC stock value (Coleman et al. [8]) implies that in the agricultural field, SOC stock recorded in 2016 is close to our baseline SOC stock value measured in 2009. Therefore, any SOC stock gain between 2009 and 2018 in our biomass study is likely to be attributed to the presence of perennial bioenergy cropping system. Based on the above SOC numbers (Coleman et al. [8]) it is assumed that SOC in the previous management system will not have changed unless a sustainable management strategy such as biomass crops are implemented.
Root C input from belowground biomass and fine-root turnover can significantly contribute to increases in SOC under woody and switchgrass cropping systems [21,45]. Liebig et al. [46] monitored switchgrass bioenergy production in central and northern Great Plains, USA for a five-year period and reported that the cropping system significantly affected change in SOC and increased it at a depth of 0–30 cm at a rate of 1.1 Mg C ha−1 year−1 (4.0 Mg CO2 ha−1 year−1). In contrast to switchgrass [21], miscanthus has root crowns, resulting in a reduction in the proportion of fine roots compared to switchgrass, which could contribute to reduced SOC gains over the years. This could have been the reason as to why SOC gain was low for miscanthus compared to switchgrass in this study (Table 7).
Based on total C pool values, it is obvious that the willow system has the largest C pool compared to all tested biomass systems (Table 7). The total C pool in woody crop systems was also significantly higher (97.2 Mg ha−1) than herbaceous cropping systems (89.4 Mg ha−1). This finding is supported by other studies which report that the annual net SOC storage change exceeds the minimum mitigation requirement under perennial energy crops by far [42]. Similarly, Carvalho et al. [32] have suggested that if the current bioethanol sector (such as corn and sugarcane) is changed to bioenergy feedstocks with more allocation to belowground C it could increase soil C stocks at a much faster rate. Other reports have also shown that the proportion of the total system C (biomass + root + SOC) in a willow bioenergy system was 14.4% and 15.6% more than in switchgrass and corn systems, respectively [23].
It is interesting to note that in Table 7, total C pool was significantly (p < 0.05) higher in the willow system compared to all other tested biomass crops in this study. This is mainly due to significantly (p < 0.05) higher aboveground biomass C (Table 4) and numerically higher belowground biomass C (Table 4) compared to other tested biomass crops. Willow has the ability to coppice more vigorously after each harvest than poplar and also adapts itself better than other biomass crops on low-productive or marginal lands [37]. The total C pool values reported in this study are within the previously reported range of values, 12–175 Mg C ha−1 [36,47,48].

4.3. System-Level Carbon Gain in Woody and Herbaceous Bioenergy Cropping Systems

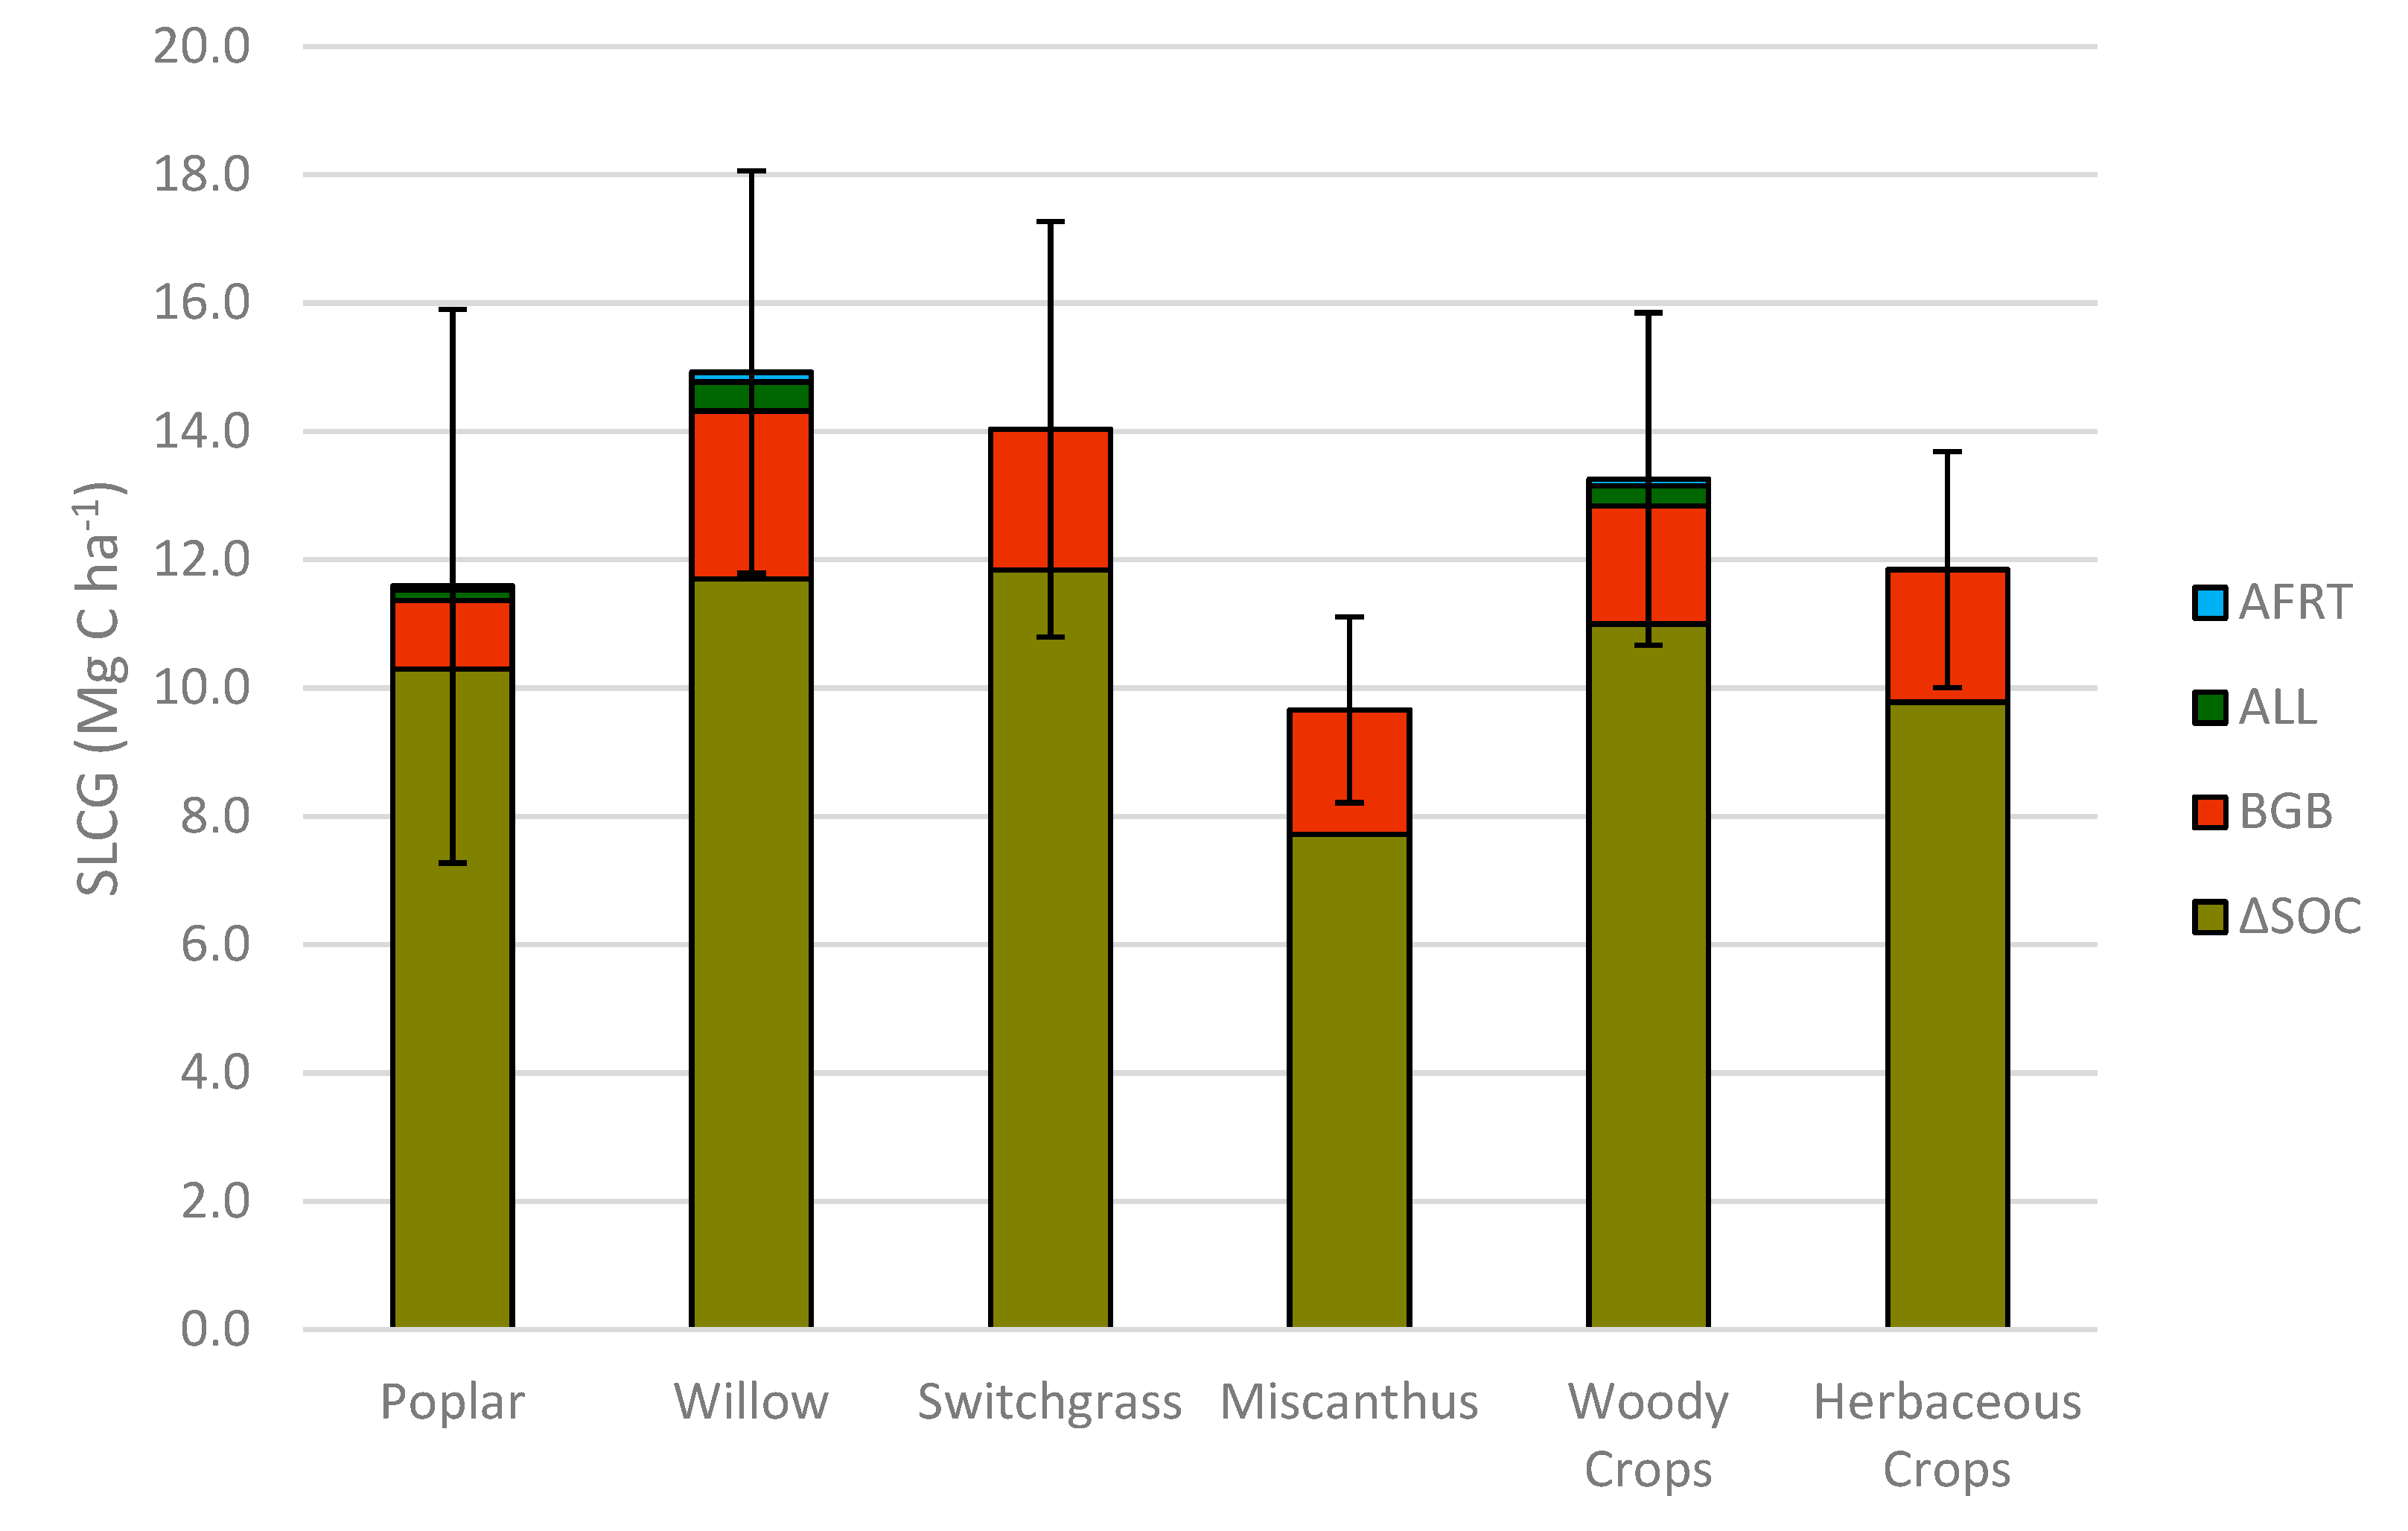
Differences in SLCGs were not significantly affected by bioenergy crops (Table 6). However, considering the numerical values, results suggest that when we compare SOC pools of all tested woody and herbaceous biomass systems, willow and switchgrass are sequestering C in the soil in measurable quantities (Table 7, Figure 3).
These results indicate that willow cropping systems are able to gain 1.66 Mg ha−1 carbon annually at the system-level, which is the highest C gain among all other bioenergy crops in this study on marginal lands in southern Ontario, Canada. This can be attributed to the higher contribution of coarse and fine root C, as well as annual leaf litter in willow system. However, slowly decomposable rhizomes are incorporated into soil organic matter in herbaceous cropping systems. Carvalho et al. [32] concluded that the belowground biomass C pool plays a critical role in building and maintaining SOC, especially due to rhizodeposition inputs and the higher potential of C retention rates. Chemical composition of belowground biomass can also explain the higher C retention rate as roots have a higher concentration of phenolic and lignaceous compounds [49], and enhance soil aggregation, which increases the physical protection of organic C added into the soil [50].
Coleman et al. [8] reported an increase of 1.16 Mg C ha−1 y−1 for SOC stocks in concentrated short-rotation woody production systems (willow and poplar), which is supporting the results derived in this study. Several studies [21,42,51] show that deciduous woody cropping systems contribute greater levels of SOC than herbaceous systems due to leaf litter inputs and higher rate of root turnover. The fine roots in willow cropping systems are often a focal point of belowground C sequestration because they represent a vital biomass C of the total willow root C [52]. Soil depth and texture should be considered when comparing soil C inputs from belowground biomass in woody and herbaceous bioenergy crops. This study was conducted in a marginal sandy-loam textured soil with a depth of only 0 to 30 cm. However, soil C sequestration up to a depth of 1 m will provide more value, especially when dealing with perennial biomass cropping systems [53]. Therefore, SOC data from this study are likely underestimating the total soil C pool. In a 30-year simulation study the belowground inputs to soil C from miscanthus were 34% of the total inputs, and it could be as high as 60% when considering a rooting depth of 1 m [32].
Empirical and modeled studies also suggest that increases in soil clay content can reduce root contributions to soil C and in such cases, it is more likely that aboveground C inputs dominate the top 30 cm of soil C over time [32,53,54]. The 30-year simulation study in a soil with 29% clay showed a net increase in the soil C pool of 5.7 Mg ha−1, where root systems were responsible for 46% of the total inputs. However, in a very clayey soil, root systems had a lower total contribution to the soil C pool (18%) and the main portion of this input resulted from mortality and incorporation of roots and rhizomes during soil preparation at replanting [32].

5. Conclusions

Overall, results from this study suggest that both woody biomass cropping systems (poplar and willow) and switchgrass are able to increase SOC significantly in the nine-year period of this study (2009–2018). However, carbon gains at the system-level (SOC + Root C + Leaf litter C + Fine Root C), did not significantly differ between woody and herbaceous systems during the study period (Figure 3). The findings show that the woody systems may have an advantage over herbaceous biomass systems based on the numerical SLCG values. It will be interesting to monitor as to how these systems will differ in their C sequestration numbers into the future as both, woody and herbaceous systems, are considered to be productive for up to 22 years [37].
In terms of aboveground biomass carbon, the assessed woody systems are producing significantly higher aboveground biomass carbon than herbaceous crops. However, we did not include this in the system-level carbon sequestration calculation as the aboveground biomass will be utilized for bioenergy production, bio-products, or for other purposes such as animal bedding, garden mulch, etc. In contrast, this study has demonstrated that the amount of belowground biomass C (roots) in herbaceous or in woody biomass crops was similar in both systems, with a difference of only 0.9 Mg ha−1. However, at the ‘system-level’, we have taken into account carbon gains associated with above- and belowground biomass such as, leaf-litter inputs, fine-root turnover, and belowground biomass carbon additions in roots. If carbon credits are calculated for biomass crops, biomass removal from the system and taking it out of the ‘farm gate’ for energy production will not be considered as system-level gain. However, any other carbon additions to the system that are related to aboveground biomass (for example leaf-litter), as indicated above, should be accounted for and we have done so in this study.
Above- and belowground biomass C and SOC contributed to the total C pool, which was significantly higher in woody bioenergy cropping systems and highest overall in the willow system. Therefore, these findings demonstrate that the willow bioenergy cropping system sequestered significantly more atmospheric CO2 than all other tested systems, suggesting it has the potential for producing bioenergy with the lowest net CO2 emissions.
Across Canada, it is estimated that there are approximately 9.5 million ha of potentially useable marginal lands, and there are close to 1 million ha in Ontario alone [9]. Given the willow cropping systems’ C gain per year (1.66 Mg C ha−1 y−1), if this system is established on all 9.5 million ha of marginal non-agricultural lands in Canada, the maximum per year gain will be more than 15,770 Gg C y−1 or 57,876 Gg CO2 y−1, which is 8% of the total annual Canadian GHGs emissions (716,000 Gg CO2 y−1) [3]. Therefore, based on our results, there is considerable potential for terrestrial C sequestration in Canada and Ontario by converting low quality agricultural lands to biomass production.

Author Contributions

Conceptualization, N.T.; data curation, A.B.B., A.N., and M.W.A.; formal analysis, A.B.B., and A.N.; funding acquisition, N.T.; investigation, A.B.B., A.N., B.C., M.W.A., A.G., and N.T.; methodology, A.B.B., M.W.A., and N.T.; project administration, N.T.; resources, A.B.B. and N.T.; supervision, A.B.B. and N.T.; validation, A.B.B., A.N., and N.T.; visualization, A.B.B. and N.T.; writing —original draft, A.B.B., A.N., and N.T.; writing—review & editing, A.B.B., A.N., B.C., M.W.A., A.G., and N.T. All authors have read and agreed to the published version of the manuscript.

Funding

This research was funded by Ontario Ministry of Environment and Climate Change (Ministry of the Environment, Conservation and Parks), under the “Best in Science” program; grant number ESSD-BIS201617–13. Funding received from Ontario Ministry of Agriculture, Food and Rural Affairs (OMAFRA) towards the establishment of the 2009 field site is also acknowledged.

Acknowledgments

The authors would like to thank Derek Sidders from the Canadian Wood Fibre Centre, Natural Resources Canada, Edmonton, Alberta, Canada for his support and cooperation towards woody biomass cropping systems establishment, and John David Mann for his support and contribution towards the establishment of the herbaceous biomass cropping systems research plots and for collecting the baseline data. The authors also wish to thank the Ontario Biomass Producer Cooperative (OBPC) members, and the Ontario Ministry of Agriculture, Food and Rural Affairs (OMAFRA) for their continued support towards biomass research in the province of Ontario, Canada.

Conflicts of Interest

The authors declare no conflict of interest

References

  1. Paris Climate Change Conference—November 2015|UNFCCC. Available online: https://unfccc.int/process-and-meetings/conferences/past-conferences/paris-climate-change-conference-november-2015/paris-climate-change-conference-november-2015 (accessed on 10 February 2020).
  2. ECCC (Environment Canada and Climate; Change) National Inventory Report 1990–2017: Greenhouse Gas Sources and Sinks in Canada; Environment and Climage Change Canada: Gatineau, QC, Canada, 2019.
  3. Environment and Climate Change Canada. Canadian Environmental Sustainability Indicators: Progress towards Canada’s Greenhouse Gas Emissions Reduction Target. 2020. Available online: https://www.canada.ca/en/environment-climate-change/services/environmental-indicators/progress-towards-canada-greenhouse-gas-emissions-reduction-target.html (accessed on 9 May 2020).
  4. Littlejohns, J.; Rehmann, L.; Murdy, R.; Oo, A.; Neill, S. Current state and future prospects for liquid biofuels in Canada. Biofuel Res. J. 2018, 5, 759–779. [Google Scholar] [CrossRef] [Green Version]
  5. Bandaru, V.; Izaurralde, R.C.; Manowitz, D.; Link, R.; Zhang, X.; Post, W.M. Soil carbon change and net energy associated with biofuel production on marginal lands: A regional modeling perspective. J. Environ. Qual. 2013, 42, 1802–1814. [Google Scholar] [CrossRef] [PubMed]
  6. Feng, Q.; Chaubey, I.; Her, Y.G.; Cibin, R.; Engel, B.; Volenec, J.; Wang, X. Hydrologic and water quality impacts and biomass production potential on marginal land. Environ. Model. Softw. 2015, 72, 230–238. [Google Scholar] [CrossRef] [Green Version]
  7. Ruf, T.; Makselon, J.; Udelhoven, T.; Emmerling, C. Soil quality indicator response to land-use change from annual to perennial bioenergy cropping systems in Germany. GCB Bioenergy 2018, 10, 444–459. [Google Scholar] [CrossRef]
  8. Coleman, B.; Bruce, K.; Chang, Q.; Frey, L.; Guo, S.; Tarannum, M.S.; Bazrgar, A.; Sidders, D.; Keddy, T.; Gordon, A.; et al. Quantifying C stocks in high-yield, short-rotation woody crop production systems for forest and bioenergy values and CO2 emission reduction. For. Chron. 2018, 94, 260–268. [Google Scholar]
  9. Liu, T.; Huffman, T.; Kulshreshtha, S.; McConkey, B.; Du, Y.; Green, M.; Liu, J.; Shang, J.; Geng, X. Bioenergy production on marginal land in Canada: Potential, economic feasibility, and greenhouse gas emissions impacts. Appl. Energy 2017, 205, 477–485. [Google Scholar] [CrossRef]
  10. Daioglou, V.; Doelman, J.C.; Wicke, B.; Faaij, A.; van Vuuren, D.P. Integrated assessment of biomass supply and demand in climate change mitigation scenarios. Glob. Environ. Chang. 2019, 54, 88–101. [Google Scholar] [CrossRef] [Green Version]
  11. Kalt, G.; Mayer, A.; Theurl, M.C.; Lauk, C.; Erb, K.H.; Haberl, H. Natural climate solutions versus bioenergy: Can carbon benefits of natural succession compete with bioenergy from short rotation coppice? GCB Bioenergy 2019, 11, 1283–1297. [Google Scholar] [CrossRef]
  12. Kitous, A.; Keramidas, K.; Vandyck, T.; Saveyn, B.; Van Dingenen, R.; Spadaro, J.; Holland, M. Global Energy and Climate Outlook 2017: How Climate Policies Improve Air Quality - Global Energy Trends and Ancillary Benefits of the Paris Agreement; EUR 28798 EN; Publications Office of the European Union: Luxembourg, 2017; ISBN 978-92-79-73864-7. JRC107944. [CrossRef]
  13. OECD; IEA; IRENA. Perspectives for the Energy Transition: Investment Needs for a Low-Carbon Energy System; IEA: Paris, France; IRENA Publications: Abu Dhabi, UAE, 2017. [Google Scholar]
  14. Ashiq, M.W.; Bazrgar, A.B.; Fei, H.; Coleman, B.; Vessey, K.; Gordon, A.; Sidders, D.; Keddy, T.; Thevathasan, N. A nutrient-based sustainability assessment of purpose-grown poplar and switchgrass biomass production systems established on marginal lands in Canada. Can. J. Plant Sci. 2017, 98, 255–266. [Google Scholar] [CrossRef] [Green Version]
  15. Aylott, M.J.; Casella, E.; Farrall, K.; Taylor, G. Estimating the supply of biomass from short-rotation coppice in England, given social, economic and environmental constraints to land availability. Biofuels 2010, 1, 719–727. [Google Scholar] [CrossRef]
  16. Bonin, C.L.; Lal, R. Aboveground productivity and soil carbon storage of biofuel crops in Ohio. GCB Bioenergy 2014, 6, 67–75. [Google Scholar] [CrossRef] [Green Version]
  17. Gelfand, I.; Sahajpal, R.; Zhang, X.; Izaurralde, R.C.; Gross, K.L.; Robertson, G.P. Sustainable bioenergy production from marginal lands in the US Midwest. Nature 2013, 493, 514–517. [Google Scholar] [CrossRef] [PubMed]
  18. Kantola, I.B.; Masters, M.D.; Beerling, D.J.; Long, S.P.; DeLucia, E.H. Potential of global croplands and bioenergy crops for climate change mitigation through deployment for enhanced weathering. Biol. Lett. 2017, 13, 20160714. [Google Scholar] [CrossRef] [PubMed] [Green Version]
  19. Chimento, C.; Almagro, M.; Amaducci, S. Carbon sequestration potential in perennial bioenergy crops: The importance of organic matter inputs and its physical protection. GCB Bioenergy 2016, 8, 111–121. [Google Scholar] [CrossRef]
  20. Tolbert, V.R.; Todd, D.E.; Mann, L.K.; Jawdy, C.M.; Mays, D.A.; Malik, R.; Bandaranayake, W.; Houston, A.; Tyler, D.; Pettry, D.E. Changes in soil quality and below-ground carbon storage with conversion of traditional agricultural crop lands to bioenergy crop production. Environ. Pollut. 2002, 116, S97–S106. [Google Scholar] [CrossRef]
  21. Zan, C.S.; Fyles, J.W.; Girouard, P.; Samson, R.A. Carbon sequestration in perennial bioenergy, annual corn and uncultivated systems in southern Quebec. Agric. Ecosyst. Environ. 2001, 86, 135–144. [Google Scholar] [CrossRef]
  22. Eichelmann, E.; Wagner-Riddle, C.; Warland, J.; Deen, B.; Voroney, P. Comparison of carbon budget, evapotranspiration, and albedo effect between the biofuel crops switchgrass and corn. Agric. Ecosyst. Environ. 2016, 231, 271–282. [Google Scholar] [CrossRef]
  23. Lemus, R.; Lal, R. Bioenergy crops and carbon sequestration. CRC. Crit. Rev. Plant Sci. 2005, 24, 1–21. [Google Scholar] [CrossRef]
  24. Montagnini, F.; Nair, P.K.R. Carbon sequestration: An underexploited environmental benefit of agroforestry systems. Agrofor. Syst. 2004, 61–62, 281–295. [Google Scholar]
  25. Thevathasan, N.V.; Gordon, A.M.; Bradley, R.; Cogliastro, A.; Folkard, P.; Grant, R.; Kort, J.; Liggins, L.; Njenga, F.; Olivier, A.; et al. Agroforestry Research and Development in Canada: The Way Forward. In Agroforestry—The Future of Global Land Use, Advances in Agroforestry; Nair and Garrity, Ed.; Springer Nature: Heidelberg, Germany, 2012; Volume 9, pp. 248–283. ISBN 978-94-007-4675-6. [Google Scholar]
  26. Mann, J.D. Comparison of Yield, Calorific Value and Ash Content in Woody and Herbaceous Biomass Used for Bioenergy Production in Southern Ontario, Canada. Ph.D. Thesis, University of Guelph, Guelph, ON, Canada, 2012. [Google Scholar]
  27. Cardinael, R.; Thevathasan, N.; Gordon, A.; Clinch, R.; Mohammed, I.; Sidders, D. Growing woody biomass for bioenergy in a tree-based intercropping system in southern Ontario, Canada. Agrofor. Syst. 2012, 86, 279–286. [Google Scholar] [CrossRef]
  28. Thomas, S.C.; Martin, A.R. Carbon content of tree tissues: A synthesis. Forests 2012, 3, 332–352. [Google Scholar] [CrossRef] [Green Version]
  29. McKendry, P. Energy production from biomass (part 1): Overview of biomass. Bioresour. Technol. 2002, 83, 37–46. [Google Scholar] [CrossRef]
  30. Graham, J.; Voroney, P.; Coleman, B.; Deen, B.; Gordon, A.; Thimmanagari, M.; Thevathasan, N. Quantifying soil organic carbon stocks in herbaceous biomass crops grown in Ontario, Canada. Agrofor. Syst. 2019, 93, 1627–1635. [Google Scholar] [CrossRef]
  31. Amougou, N.; Bertrand, I.; Machet, J.M.; Recous, S. Quality and decomposition in soil of rhizome, root and senescent leaf from Miscanthus x giganteus, as affected by harvest date and N fertilization. Plant Soil 2011, 338, 83–97. [Google Scholar] [CrossRef]
  32. Carvalho, J.L.N.; Hudiburg, T.W.; Franco, H.C.J.; DeLucia, E.H. Contribution of above-and belowground bioenergy crop residues to soil carbon. GCB Bioenergy 2017, 9, 1333–1343. [Google Scholar] [CrossRef]
  33. Hangs, R.D.; Schoenau, J.J.; Van Rees, K.C.J.; Bélanger, N.; Volk, T. Leaf Litter Decomposition and Nutrient-Release Characteristics of Several Willow Varieties Within Short-Rotation Coppice Plantations in Saskatchewan, Canada. Bioenergy Res. 2014, 7, 1074–1090. [Google Scholar] [CrossRef] [Green Version]
  34. Wotherspoon, A.; Thevathasan, N.V.; Gordon, A.M.; Voroney, R.P. Carbon sequestration potential of five tree species in a 25-year-old temperate tree-based intercropping system in southern Ontario, Canada. Agrofor. Syst. 2014, 88, 631–643. [Google Scholar] [CrossRef]
  35. Püttsepp, Ü.; Lõhmus, K.; Koppel, A. Decomposition of fine roots and α-cellulose in a short rotation willow (Salix spp.) plantation on abandoned agricultural land. Silva Fenn. 2007, 41, 247–258. [Google Scholar] [CrossRef] [Green Version]
  36. Peichl, M.; Thevathasan, N.V.; Gordon, A.M.; Huss, J.; Abohassan, R.A. Carbon sequestration potentials in temperate tree-based intercropping systems, southern Ontario, Canada. Agrofor. Syst. 2006, 66, 243–257. [Google Scholar] [CrossRef]
  37. Marsal, F.; Thevathasan, N.V.; Guillot, S.; Mann, J.; Gordon, A.M.; Thimmanagari, M.; Deen, W.; Silim, S.; Soolanayakanahally, R.; Sidders, D. Biomass yield assessment of five potential energy crops grown in southern Ontario, Canada. Agrofor. Syst. 2016, 90, 773–783. [Google Scholar] [CrossRef]
  38. Oliveira, N.; Rodríguez-Soalleiro, R.; Pérez-Cruzado, C.; Cañellas, I.; Sixto, H.; Ceulemans, R. Above-and below-ground carbon accumulation and biomass allocation in poplar short rotation plantations under Mediterranean conditions. For. Ecol. Manag. 2018, 428, 57–65. [Google Scholar] [CrossRef]
  39. Verlinden, M.S.; Broeckx, L.S.; Zona, D.; Berhongaray, G.; De Groote, T.; Camino Serrano, M.; Janssens, I.A.; Ceulemans, R. Net ecosystem production and carbon balance of an SRC poplar plantation during its first rotation. Biomass Bioenergy 2013, 56, 412–422. [Google Scholar] [CrossRef] [Green Version]
  40. Fang, S.; Xue, J.; Tang, L. Biomass production and carbon sequestration potential in poplar plantations with different management patterns. J. Environ. Manag. 2007, 85, 672–679. [Google Scholar] [CrossRef] [PubMed]
  41. Pacaldo, R.S.; Volk, T.A.; Briggs, R.D. Greenhouse Gas Potentials of Shrub Willow Biomass Crops Based on Below- and Aboveground Biomass Inventory Along a 19-Year Chronosequence. Bioenergy Res. 2013, 6, 252–262. [Google Scholar] [CrossRef]
  42. Agostini, F.; Gregory, A.S.; Richter, G.M. Carbon Sequestration by Perennial Energy Crops: Is the Jury Still Out? Bioenergy Res. 2015, 8, 1057–1080. [Google Scholar] [CrossRef] [Green Version]
  43. Swisher, J.N. Cost and performance of CO2 storage in forestry projects. Biomass Bioenergy 1991, 1, 317–328. [Google Scholar] [CrossRef]
  44. Unruh, J.D.; Houghton, R.A.; Lefebvre, P.A. Carbon storage in agroforestry: An estimate for sub-Saharan Africa. Clim. Res. 1993, 3, 39–52. [Google Scholar] [CrossRef]
  45. Frank, A.B.; Berdahl, J.D.; Hanson, J.D.; Liebig, M.A.; Johnson, H.A. Biomass and carbon partitioning in switchgrass. Crop. Sci. 2004, 44, 1391–1396. [Google Scholar] [CrossRef] [Green Version]
  46. Liebig, M.A.; Schmer, M.R.; Vogel, K.P.; Mitchell, R.B. Soil Carbon Storage by Switchgrass Grown for Bioenergy. BioEnergy Res. 2008, 1, 215–222. [Google Scholar] [CrossRef] [Green Version]
  47. Dixon, R.K. Agroforestry systems: Sources of sinks of greenhouse gases? Agrofor. Syst. 1995, 31, 99–116. [Google Scholar] [CrossRef]
  48. Schroeder, P. Carbon storage benefits of agroforestry systems. Agrofor. Syst. 1994, 27, 89–97. [Google Scholar] [CrossRef]
  49. Bolinder, M.A.; Angers, D.A.; Giroux, M.; Laverdière, M.R. Estimating C inputs retained as soil organic matter from corn (Zea Mays L.). Plant Soil 1999, 215, 85–91. [Google Scholar] [CrossRef]
  50. Oades, J.M. An overview of processes affecting the cycling of organic carbon in soils. In The Role of Non-Living Organic Matter in the Earth’s Carbon Cycle; Zepp, R.G., Sonntag, C.H., Eds.; Wiley: New York, NY, USA, 1995; pp. 293–303. [Google Scholar]
  51. Bransby, D.I.; McLaughlin, S.B.; Parrish, D.J. A review of carbon and nitrogen balances in switchgrass grown for energy. Biomass Bioenergy 1998, 14, 379–384. [Google Scholar] [CrossRef]
  52. Amichev, B.Y.; Hangs, R.D.; Konecsni, S.M.; Stadnyk, C.N.; Volk, T.A.; Bélanger, N.; Vujanovic, V.; Schoenau, J.J.; Moukoumi, J.; Van Rees, K.C.J. Willow short-rotation production systems in Canada and Northern United States: A review. Soil Sci. Soc. Am. J. 2014, 78, S168–S182. [Google Scholar] [CrossRef] [Green Version]
  53. Anderson-Teixeira, K.J.; Masters, M.D.; Black, C.K.; Zeri, M.; Hussain, M.Z.; Bernacchi, C.J.; DeLucia, E.H. Altered Belowground Carbon Cycling Following Land-Use Change to Perennial Bioenergy Crops. Ecosystems 2013, 16, 508–520. [Google Scholar] [CrossRef]
  54. Osaki, M.; Shinano, T.; Matsumoto, M.; Ushiki, J.; Shinano, M.M.; Urayama, M.; Tadano, T. Productivity of high-yielding crops: V. Root growth and specific absorption rate of nitrogen. Soil Sci. Plant Nutr. 1995, 41, 635–647. [Google Scholar] [CrossRef]
Figure 1. Guelph Agroforestry Research Site, University of Guelph, Guelph, Ontario, Canada, in 2006 (top), 2009 (center) and 2018 (bottom). HBCS and WBCS: Herbaceous and woody bioenergy cropping systems, respectively. AgF: Conventional agricultural field (Google Earth Pro, 2019).
Sustainability 12 03901 g001
Figure 2. Carbon stock allocation to plant components (leaves litter in three-year-old woody crops, stems and leaves in herbaceous, stems and branches in woody crops and belowground biomass) in nine-year-old (2018) bioenergy cropping systems in southern Ontario, Canada. In herbaceous crops “stems” included both leaves and stem carbon stock.
Sustainability 12 03901 g002
Figure 3. System-level carbon gain in bioenergy crops in southern Ontario, Canada, during 2009 to 2018, as well as averages for woody and herbaceous cropping systems. System-level carbon gain delineated by long-term soil organic carbon from 2009 to 2018 (∆SOC), belowground biomass carbon (BGB), annual leaf litter (ALL) input carbon, and annual fine root turn-over (AFRT) carbon.
Sustainability 12 03901 g003
Table 1. The abbreviations with proper definitions used in the study.
AbbreviationDefinition
AFR Annual fine roots C
AgFConventional agricultural field
AGBAboveground biomass carbon content
ALL Annual leaf litter C
ANOVAAnalysis of variance
BGBBelowground biomass carbon content
CCarbon
CLICanadian Land Inventory
CPoolTotal carbon pool at the system-level, delineated by soil organic carbon (SOC) in 2018, Aboveground biomass carbon (AGB) in 2018, and belowground biomass (BGB) in 2018.
DCiDecomposition coefficient, shows the fraction of sequestration potential from associated plant component (i) in the soil after microbial respiration (1-released C back into the atmosphere through microbial decomposition)
DFDry weight fraction
GARSUniversity of Guelph Agroforestry Research Station
GHGGreenhouse gas emission
GgGiga gram (In SI base units: 1 Gg = 1000 Mg)
HBCSHerbaceous bioenergy cropping systems
MgMega gram (In SI base units: 1 Mg = 1000 kg)
PROC GLMGeneral Linear Procedures procedure
SLCGSystem-level carbon gain, delineated by long-term soil organic carbon (∆SOC), belowground biomass carbon (BGB), annual leaf litter (ALL) input carbon and annual fine root turn-over (AFRT) carbon (See Equation (4)).
SOCSoil organic carbon
WBCSWoody bioenergy cropping systems
WFWet moisture fraction
∆SOCLong-term soil organic carbon change, SOC2018 - SOC2009
Table 2. Overview of results from carbon concentration studies carried out on bioenergy crops.
PlantCarbon Concentration (Weight %)References
Poplar47.7 [8,28]
Willow47.7[8,28]
Miscanthus48.1[29]
Switchgrass47.5[22]
Table 3. Significance level (p-value) for the analysis of variance (ANOVA). Source of variations include plant and block as main effects on stem and leaf carbon stock (stem, leaf), aboveground (AGB) and belowground (BGB) carbon stock in biomass in 2017 and 2018 in biomass cropping systems, southern Ontario, Canada.
Source of VariationdfStem 2017 2Leaf 2017 2AGB 2017 2Stem 2018 3Leaf 2018AGB 2018BGB 2018
Plant 130.01030.00680.00790.0038<0.00010.00210.0013
Woody vs. Herbaceous10.4114<0.00010.11470.1835<0.00010.04620.5174
Woody (W. vs. P.)10.01570.03800.01760.0195<0.00010.00800.0002
Herbaceous (M. vs. S.)1NANANA0.00251.00000.00370.4674
Block CV (%) R-Square50.14000.37760.14990.35330.58410.34850.2521
23.2753.3025.0028.2040.8327.8424.65
0.810.810.820.730.920.760.79
1 The partitioning of treatment (plant) sum of square was done using an orthogonal contrast approach (W. = willow, P. = poplar, M. = miscanthus, and S. = switchgrass), 2 Data for Miscanthus were not available in 2017. Partitioning for 2017 data was done using t-test with two-sample, unequal variances. 3 Stem considered as (stem + leaf) and so it is equaled to total aboveground biomass for herbaceous crops.
Table 4. Aboveground (2017 and 2018) and belowground (2018) biomass carbon stock in bioenergy crops and averages for woody and herbaceous cropping systems on marginal lands in southern Ontario, Canada. Standard errors are in brackets.
Cropping SystemAboveground Biomass (Mg C ha−1) 2017 1 Aboveground Biomass (Mg C ha−1) 2018 2 Belowground Biomass (Roots) (Mg C ha−1) 2018
Stems 3LeavesTotalStems 3LeavesTotal
Poplar3.62 (0.43) b0.45 (0.04) b4.01 (0.42) b7.01 (0.98) b0.57 (0.11) b7.65 (1.08) bc4.11 (0.45) b
Willow6.37 (0.79) a1.10 (0.21) a7.41 (1.00) a10.83 (0.79) a1.54 (0.14) a12.39 (0.91) a10.06 (0.81) a
Switchgrass4.44 (0.27) b0.00 (0.00) b4.44 (0.27) b4.38 (0.60) b0.00 (0.00) c4.38 (0.60) c8.45 (1.34) a
Miscanthusn/an/an/a10.91 (1.94) a0.00 (0.00) c10.91 (1.94) ab7.45 (1.16) a
Woody 5.00 (0.60) x0.77 (0.14) x5.74 (0.72) x8.92 (0.82) x1.06 (0.18) x10.02 (0.98) x7.09 (1.00) x
Herbaceous4.44 (0.27) x0.00 (0.00) y4.44 (0.27) x7.65 (1.55) x0.00 (0.00) y7.65 (1.55) y7.95 (0.84) x
Within each column, similar superscripts (a–c) indicate non-significant differences between bioenergy crops as determined by the Tukey HSD test (p < 0.05). Additionally, similar superscripts (x,y) indicate non-significant differences between woody and herbaceous cropping systems using the orthogonal contrast approach. 1 Cycle 3, Year 2 in woody crops, 2 Cycle 3, Year 3 in woody crops, 3 Stems and leaves in herbaceous, stems and branches in woody crops.
Table 5. Significance level (p-value) from the t-test (α = 0.05) on soil total organic carbon sequestration or accumulation since 2009 (baseline) to 2018 in different biomass cropping systems on marginal lands in southern Ontario, Canada.
Cropping SystemP (T <= t) Two-Tail
Poplar0.040
Willow0.050
Switchgrass0.034
Miscanthus0.143
Table 6. Significance level (p-value) for the analysis of variance (ANOVA). Source of variations include plant and block as main effects on total organic carbon sequestration (SOC) in 2009 and 2018 and long-term soil carbon sequestration between 2009–2018 (∆SOC), total carbon pool at the system-level in 2018 (CPool) and system-level carbon gain (SLCG) in biomass cropping systems, southern Ontario, Canada.
Source of VariationdfSOC 2009SOC 2018∆SOCCPoolSLCG
Plant 130.76230.21650.66820.01300.5062
Woody vs. Herbaceous10.30460.06190.38310.02000.3341
Woody (W. vs. P.)10.91660.79390.74010.00980.4273
Herbaceous (M. vs. S.)11.00000.38180.43310.76280.3959
Block 50.54400.04970.19210.04470.1758
CV (%)-9.248.2067.746.9255.13
R-Square-0.400.660.470.750.50
1 The partitioning of treatment (plant) sum of square was done using an orthogonal contrasts approach (W. = willow, P. = poplar, M. = miscanthus, and S. = switchgrass).
Table 7. Soil organic carbon (SOC) measurements (2009 and 2018) in 0–30 cm depth, long-term soil organic carbon sequestration between 2009–2018 (∆SOC), total carbon pool at the system-level in 2018 (CPool) in bioenergy crops and averages for woody and herbaceous cropping systems on marginal lands in southern Ontario, Canada. Standard errors are in brackets.
Cropping SystemSOC (2009) (Mg C ha−1)SOC (2018) (Mg C ha−1)∆SOC (Mg C ha−1)CPool 1 (Mg C ha−1)
Poplar69.3 (2.08) a79.6 (3.66) a10.3 (4.30) a91.4 (4.11) b
Willow68.9 (2.69) a80.6 (4.32) a11.7 (3.11) a103.1 (3.49) a
Switchgrass64.0 (3.17) a75.9 (0.39) a11.8 (3.46) a88.7 (1.00) b
Miscanthus64.0 (3.17) a71.8 (3.32) a7.7 (1.59) a90.2 (4.91) b
Woody Crops69.1 (1.62) x80.1 (2.70) x11.0 (2.54) x97.2 (3.12) x
Herbaceous Crops64.0 (2.07) x73.8 (1.73) x9.8 (1.92) x89.4 (2.33) y
Within each column, similar superscripts (a–c) indicate non-significant differences between bioenergy crops as determined by the Tukey HSD test (p < 0.05). Additionally, similar superscripts (x,y) indicate non-significant differences between woody and herbaceous cropping systems using the orthogonal contrast approach. 1 Total carbon pool at the system-level delineated by SOC in 2018, above- and belowground biomass carbon stock.

