Article

Green Wall Design Approach Towards Energy Performance and Indoor Comfort Improvement: A Case Study in Athens

by
Margarita-Niki Assimakopoulos
1,
Rosa Francesca De Masi
2,
Filippo de Rossi
2,
Dimitra Papadaki
1 and
Silvia Ruggiero
2,*
1
Department of Physics, Section of Applied Physics, National & Kapodistrian University of Athens, 157 84 Athens, Greece
2
Department of Engineering - DING, University of Sannio, 82100 Benevento, Italy
*
Author to whom correspondence should be addressed.
Sustainability 2020, 12(9), 3772; https://doi.org/10.3390/su12093772
Submission received: 31 March 2020 / Revised: 26 April 2020 / Accepted: 2 May 2020 / Published: 6 May 2020
(This article belongs to the Special Issue Toward Smart Cities: Zero Energy Buildings)

Abstract

:
In the 21st century, sustainable development is high on the international agenda, with the implementation of green walls contributing significantly to achieving environmental and social benefits, mainly in the frame of sustainable improvement of the building sector. The installation of a greening system can provide engineered solutions for stormwater management and climate change mitigation at both the urban and building level. This facilitates improving indoor comfort conditions and reducing energy needs. In order to improve the features of products and to facilitate the implementation of a proper technical standard, this paper proposes a critical bibliographic analysis of more recent scientific works. Moreover, by means of a numerical model of an existing single-family apartment, placed in the Mediterranean climate zone, a building envelope refurbishment with a living wall is carried out. A parametric analysis provides evidence for the application of different plants’ types and insulation materials. The results are analyzed considering the energy needs, the thermo-hygrometric comfort, and the outdoor surface temperature variation of the building envelope, emphasizing that a multi-criteria design approach is needed for green vertical systems. The paper provides data and an approach useful for designers and researchers in the evaluation and optimization of the performance of greening systems.

1. Introduction

The United Nations General Assembly, in 2015, formally adopted the universal, integrated and transformative Agenda for Sustainable Development forward 2030 that proposes 17 main objectives of which one of these is: “Make cities and human settlements inclusive, safe, resilient and sustainable” [1]. In order to reach this goal, one action is the promotion of green and resilient cities. Among the most innovative and environmentally friendly solutions, green walls can be intended as a key strategy to meet the challenge of sustainable development [2].
The common term “green wall” refers to all types of vertical solutions of building elements characterized by the presence of vegetation and all elements for supporting its growth. Several authors have introduced different nomenclature according to the objective of their study (e.g. vertical greenery system, vertical garden, etc.), but Green Façade (GF) and Living Wall (LW) are the two main common classification categories [3,4,5], used also in this study.
Exterior vertical vegetation has been used for centuries, in the form of various climbing plants with or without support, but only with an aesthetic function [6]. However, in recent decades several studies have shown that this system carries out benefits falling into three categories relating to sustainable development: environmental, economic, and social advantages [7]. They occur at two different scales: the urban scale (mitigation of the heat island effect [8], absorption of pollutants [9], improvement of water management [10]) and the building scale (reduction of energy demand [11], improvement of thermal comfort [12], noise reduction [13]).
The presence of plants on building surfaces relates to urban heat island (UHI) mitigation due to: i) the spectral properties of leaves that cause differing absorption and reflection of the solar radiation with respect to traditionally finished building materials [8], ii) the cooling effect of urban ambient given by the evapo-transpiration of the water content of the soil into the atmosphere, through the stomata of the plant [5,14]. Their potential has been experimentally investigated in the paper [15] which regards eight different vertical greenery systems installed in a tropical climate. It shows that an LW influences the outdoor environment as far as 0.60 m away, with a maximum reduction value of 3.3 °C at a distance of 0.15 m, while no variation has been observed for GF. However, in order to actually prove a reduction of UHI intensity, it is necessary that these solutions are widespread across the urban environment.
The beneficial mechanisms of a green wall are the shading effect from the plants, the cooling due to the evapo-transpiration mechanism from the vegetation and the substrate, the insulation achieved by plants and substrate, and lastly the effect of variation of the wind [16,17]. At the building scale, they can contribute to modify the heat exchanges involving the building envelope. For example, in humid mild climates He et al. [18] states that the evapo-transpiration in summer is about 50% of the heat release, while in winter it is very low and convection dissipates most of the heat gain. They found that under all combined effects (shading, evapotranspiration, heat insulation, and storage) the absolute value in summer of the average heat flux through an LW wall is 3.9 W/m2 less than the average heat flux transferred through a common wall, and 3.5 W/m2 less in winter. This results in a reduction of energy demand in summer and occasionally in winter, depending on the climate context. For instance, in a warm-summer humid continental climate, Feng and Hewage [19] found a reduction of the energy demand of 7.3% during the cooling period and no variation during the heating period, by the application of LW on all façades of a building. Considering an LW applied to one façade of a flat, Dahanayake and Chow [20], in a dry-winter humid subtropical climate, showed a cooling energy saving of about 3%, but an increase of heating demand of 2.0%. Moreover, in an experimental test-cell placed in a hot-summer Mediterranean climate, Coma et al. [11] found a cooling energy saving of 33.8% (GF) and 58.9% (LW) and a heating energy saving of 1.9% (GF) and 4.2% (LW).
Nevertheless, the green wall solution is not yet widespread in the building market. The main criticalities have been discussed by Riley [21], including high costs, both on investment and maintenance, and also regarding the final performance and the economic profitability which are greatly dependent on designing choices, climatic zone, and the surrounding environment. Other constraints are the absence of a unique construction standard, availability of non-uniform experimental data, and the lack of certified simulation models. Therefore, modern scientific research on establishing the optimized design in several operational modes and climates is essential in order to encourage the building sector in adopting green walls.
The vertical green systems could be considered a suitable answer to the trade-off between the heating and cooling needs of a building, which is almost balanced in a climate such as the Mediterranean one. This study wants to investigate how designing a green wall for a real case study in a Mediterranean climate, considering, not only the potential reduction of energy needs but also the effect on the outdoor building surfaces and indoor microclimate. For the proposed goal by this paper, only the studies developed under Mediterranean climatic conditions, are analyzed.
Mazzali et al. [22] have carried out in-field measurements on three different LWs, showing that the external surface temperature difference between the bare wall and the covered wall changes from 12 °C to 20 °C, during sunny days. Similarly [23], three vertical walls made with perforated bricks, were tested in Bari (South Italy). Authors have concluded that green vertical systems are sustainable solutions in the investigated climate since the daylight temperatures, on their southern orientation, were lower of around 9.0 °C. The façades also act as a thermal screen during the cold days, the nighttime temperatures for the vegetated walls proved to be higher by around 3.5 °C.
The paper [11] compares the behavior of LW and GF in the same conditions: the reference wall is composed of gypsum, alveolar brick, and cement mortar. During summer the LW assures, for each exposure, the highest reduction of temperature with a better result on the southern side. Considering another study the LWs reach their highest values of about 30 °C of temperature reduction, in warm summer Mediterranean climate [24].
Regarding GFs in the Mediterranean climate, a research study [25] showed a limited potential from the point of view of electricity reduction, during summer. For the analyzed GF, a south-facing alveolar brick wall without insulation, with maximum outside temperatures between 37 °C and 39 °C, the energy saving is 5.5% for one week in July. For the same experimental setup [26] but during another summer season, considering the application on three exposures of Boston Ivy species, with a leaf area index (LAI) of about 3.5–4.0, the energy-saving observed during one week of August is 36%. This result is comparable with experimental monitoring carried out [11] during July 2015: over 12 days the energy saving is 34%.
Kontoleon and Eumorfopoulou [27] analyzed the behavior of a GF for one day of a cooling period in a typical Greek region. The case study is a single thermal zone (10 x10 m2) with insulated masonry walls and horizontal reinforced concrete slabs. A parametric evaluation has been made by varying the insulation position in the wall and the exposure for GF. Results show that northern exposure is not convenient since the savings vary from 4.18% (external insulation) to 4.98% (internal insulation). The best solution is always the west exposure with its highest value of 21.15% when the insulation is applied on the inner side of the wall. These data are not comparable with experimental data for the same climatic condition nor with other numerical studies.
Pulselli et al. [28], by means of EnergyPlus, have studied the energy-saving potential of a 98 m2 south-oriented façade for a 1000 m3 building, by varying the type of external envelope (insulated with extruded polystyrene or a massive stone bearing wall) and the type of air cavity (ventilated or closed). Results show that the LW seems to be more effective (energy saving ≈ 15.2%) for a massive envelope with a ventilated air cavity. In the same climate [29], a system made of a mat planted with different plant species (e.g., climbing plants, shrubs, evergreens) has been examined. It consists of panels (mats) composed of two layers of special geotextile. In this case, energy-saving vary from 17.1% in August to 40.3% in June.
The work of Manso and Castro-Gomes [30] deals with a period with a mild climate, and a temperature not higher than 25 °C. The vegetation applied are the Sedum species and Thymus. The maximum interior surface temperature does not exceed 20.6 °C while it can be more than 28 °C in the reference wall. Instead, the minimum value is increased, for instance, in October it is 12.8 °C for LW and 9.9 °C in the reference wall. They have shown that the greening system increases the wall thermal mass and the average daily interior thermal amplitude is reduced up to 11.3 °C.
In a warm-summer Mediterranean climate [31], Razzaghmanesh and Razzaghmanesh [32] with Australian natives plants (Cut-leaf Goodenia, Variable Daisy, Tussock Grass, Black Heads, Running Postman, Berry Saltbush, Stalked Ixiolaena, Yellow Tails, Native Lilac) it is observed that during winter months the indoor air temperature resulted in a 0.75 °C lowering compared to the bare wall.
Olivieri et al. [33] have studied a façade with sedum vegetation, the difference between peak surface temperatures of reference and vegetated wall varies between 4.5 °C and 8.2 °C in relation to the exterior surface. The maximum values in the module without vegetation are around 29 °C whereas with vegetation the temperature oscillates between 22 °C and 23.5 °C. For the same system, considering a dataset comprising 3 years, they have evidenced [34] that the benefits of LW increases when the external temperature exceeds 25 °C and relative humidifies drops below 40%. Under these typical summer conditions, a mean drop of temperature of 8.6 °C in the interior surface and about 5.5 °C in the air are observed.
Data collected for GFs [25] in a first experiment (July in 2011), indicate that with a set-point of 24 °C the inside surface temperature of reference and vegetated walls are equal while the external temperature is reduced up to 10 °C. In the results from September 2011, under a free-floating regime, the internal surface temperature is reduced between 0.5 °C and 2 °C. In the same experiment, during the summer of 2015 with a full covered wall, the surface temperature [26] can be reduced by 2.0 °C on each exposure with external surface temperatures below 23 °C throughout the day. This reduction is about 0.75 °C during cold days in wintertime.

2. Discussion about Green Walls Performance in Mediterranean Climate

The main results of the studies analyzed in the previous section which were carried out in a Mediterranean climate are displayed in Table 1. In it “Exp.” and “Num.” refers to experimental and numerical studies respectively, “Tset point” indicates the indoor air temperature set-point when the HVAC is turned on, “N”, “E”, “S”, and “W” are North, East, South and West exposure respectively.
Under the outdoor environment modification point of view, considering the available studies, the most measured parameter is the reduction of surface temperature between the bare wall and the vegetable coverage. This has been demonstrated in seven out of the eight papers discussed but is also valid for other climatic conditions [35]. There is only one paper [11] that compares the LWs and GFs in the same boundary conditions, showing that LWs achieve the best performance, in all exposures.
Regarding which can be the most effective type of plant for reducing the outdoor surface temperature, considering the available studies, there is not a general consensus. In the study [26] it has been observed the maximum temperature reductions occur when foliage is thicker and closer to the ground, thus where the evaporative cooling is dominant. Detailed thermal characterization of the used vegetation for green walls has not been identified.
Regarding energy saving, for GF [11,27], the exposures that maximize the cooling effect are the West and the East ones. For LW, the paper [11] suggests that the best orientation is the South and very often this is the selected exposure for other studies [9,30,36]. However, this is not always true. Indeed, by means of a constrained multi-objective optimization, the study [37] shows that the best exposure for minimizing both heating and cooling needs is the West one. Moreover, considering the heating period the study [28] has shown that there is no penalty during the winter, in the case of an LW applied on the north side or for all exposure.
Most of the cited works (seven out of thirteen) analyze the incidence of indoor comfort by considering the air and surface indoor temperature reduction. A complete evaluation should also consider other parameters, such as relative humidity, indoor airspeed, radiant temperature, in order to apply the traditional or adaptive comfort models. From the analysis of the papers, it was noticed that the reduction of the inside surface temperature reflects the external surface variation [32], so the study of the climatic solicitations can be used for choosing the best position of a green system. Comparing LW and GF under an indoor microclimate modification point of view, in similar boundary conditions [26,30] GFs seem characterized by the worst performance.
Since there is not a shared standard for evaluating the performance of green vertical systems, each research group has adopted different methods and evaluation criteria meaning the results are often incomparable. However, from what has been shown, some general conclusions can be found:
  • studies are, very often, carried out without considering the inner loads, which influence greatly the whole heat transfer process,
  • The energy-saving evaluation is made, in some cases, for really short periods, while the calculation overall seasons should be done for considering the whole energy balance and take into account not only the benefits during the summer period but also the penalty in winter,
  • The incidences on indoor comfort are often evaluated considering the air and surface indoor temperature reduction, but complete evaluation should also take other parameters into account (e.g. relative humidity, indoor airspeed, radiant temperature),
The main information identified for carrying out the numerical study of the next section are:
  • the LWs have better performance than GFs,
  • the thermal performance of the green walls depends on its orientation and the study of the climatic solicitations can be used for choosing the best position of a green system,
  • information about the most suitable type of plant in the Mediterranean climate and their thermal characterizations have not been found.
Based on those claims, and considering that there are not many numerical studies, a parametric evaluation could be useful for choosing the optimal configuration of a green system. Moreover, periods of analysis covering a whole year could be realized with simulation software, achieving indices in different areas of interest influenced by the green wall.

3. Methodological Approach

The results of the literature analysis are a useful starting point for the ulterior numerical study. It is a parametric analysis used to evaluate the influence of the main designing variables such as type of insulation and plant species regarding the building energy needs. The optimal configuration, both for heating and cooling needs, will be further investigated in the field of:
  • urban context, by considering differences of the outside surface temperature of the wall before and after the application of the green system,
  • traditional and adaptive thermal comfort, by means of the values of Predicted Mean Vote (PMV) and indoor operative temperature before and after the application of the green system.
The data are analyzed with a daily, seasonal, or annual observation period. Four days, each representative of a season, have been chosen. With the same approach, the results are presented both for representative rooms and the whole building.

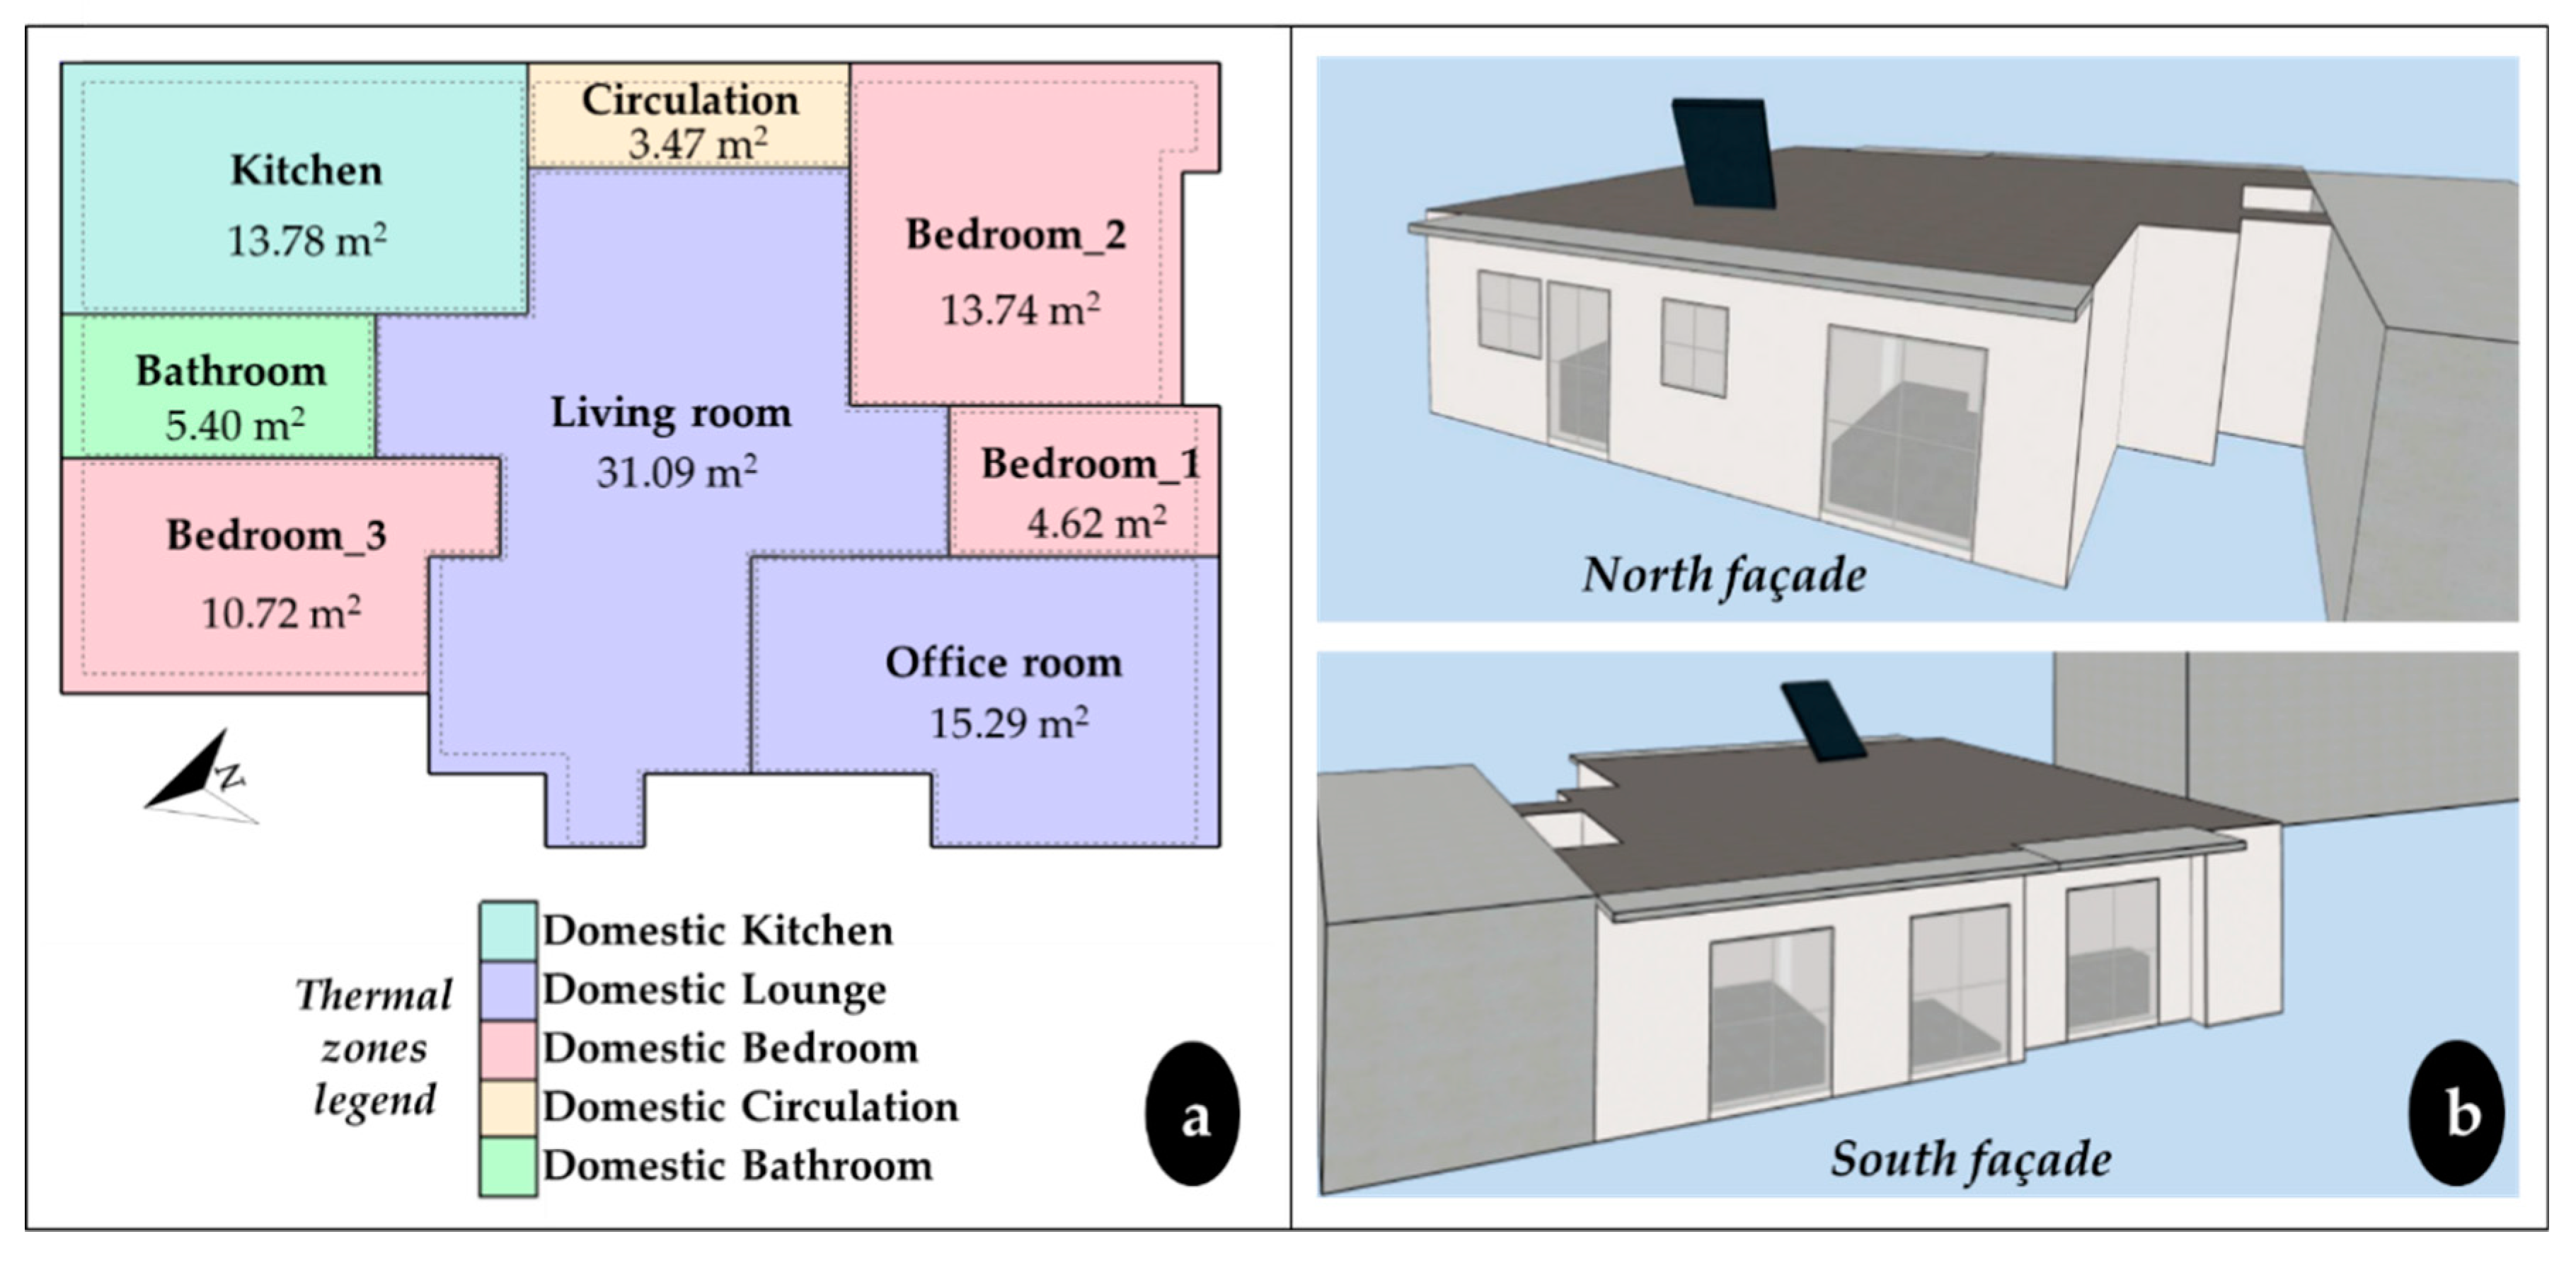
3.1. Case Study Presentation

The case study considered is an apartment of 108.3 m2 placed on the second (top) floor of a residential building built in 1971. It is in the Perissos district of Athens (Lat. 38°01’ Long. 23°44’). Athens has a hot-summer Mediterranean climate (Csa [31]), characterized by alternation between prolonged hot and dry summers and mild to cool winters with moderate rainfall.
The apartment has a rectangular profile, 12.9 m length (West and East sides), and 7.8 m (North and South sides). The total volume is 264.6 m3. The West walls and the floor border a neighboring building. The building shape ratio is equal to 0.68 while the window to wall ratio is 14.9%. The arrangement of the internal areas and their sizes, as well as the orientation, are shown in Figure 1.
Based upon the in-field inspections, the available designs and the technical sheets, the thermos-physic characterization of the main elements involved in the building envelope heat transfer has been carried out. The building has a reinforced concrete structure on two floors. External walls have an overall thickness of 0.25 m consisting of plaster on both sides and double brick without insulation. The U-value is 2.4 W/(m2K) and has a surface mass of 384.0 kg/m2. The flat roof is not insulated and it is composed, from outer to inner sides, by a bitumen cover (thermal emissivity ≈ 0.9, solar reflectance ≈ 0.2), concrete, and plaster, for an overall thickness of 0.28 m, a thermal transmittance of 2.4 W/(m2K). The calculation of U has been done according to the EN ISO 6946 [38] and the material properties are reported in Table 2. For each material th is the thickness, λ is the thermal conductivity, cp is the specific heat, ρ is the density, and μ is the vapor diffusion resistance factor.
The windows and glazed doors, with different sizes, have an aluminum frame, are 5 cm wide, with a thermal transmittance (Uf) of 5.9 W/(m2 K). The transparent elements, made by the double clear glass (6 mm thickness) with an air gap (of 13 mm), are characterized by thermal transmittance (Ug) of 2.67 W/(m2 K) and a solar factor of 0.70. The Ug is calculated according to ISO 15099 [39].
For the heating needs, the building has one boiler, fueled by oil, which provides the thermal vector fluid to 10 in-room radiators. The net heated floor surface is 98 m2. There is a solar collector (≅2 m2) that provides domestic hot water. Moreover, two air-conditioners, one placed in the kitchen and the other in a bedroom (Bedroom_1 in Figure 1) are turned on during the cooling period.
Next three rooms that border on the outside are analyzed, chosen with different exposure and indoor destination: include the Kitchen (Kit), Bedroom_2 (Bed_2), and Bedroom_3 (Bed_3) (Figure 1a). For these rooms, the main geometrical information is reported in Table 3. The punctual, and therefore more detailed, analysis of the thermal conditions in these rooms can be representative of what is happening throughout the apartment.

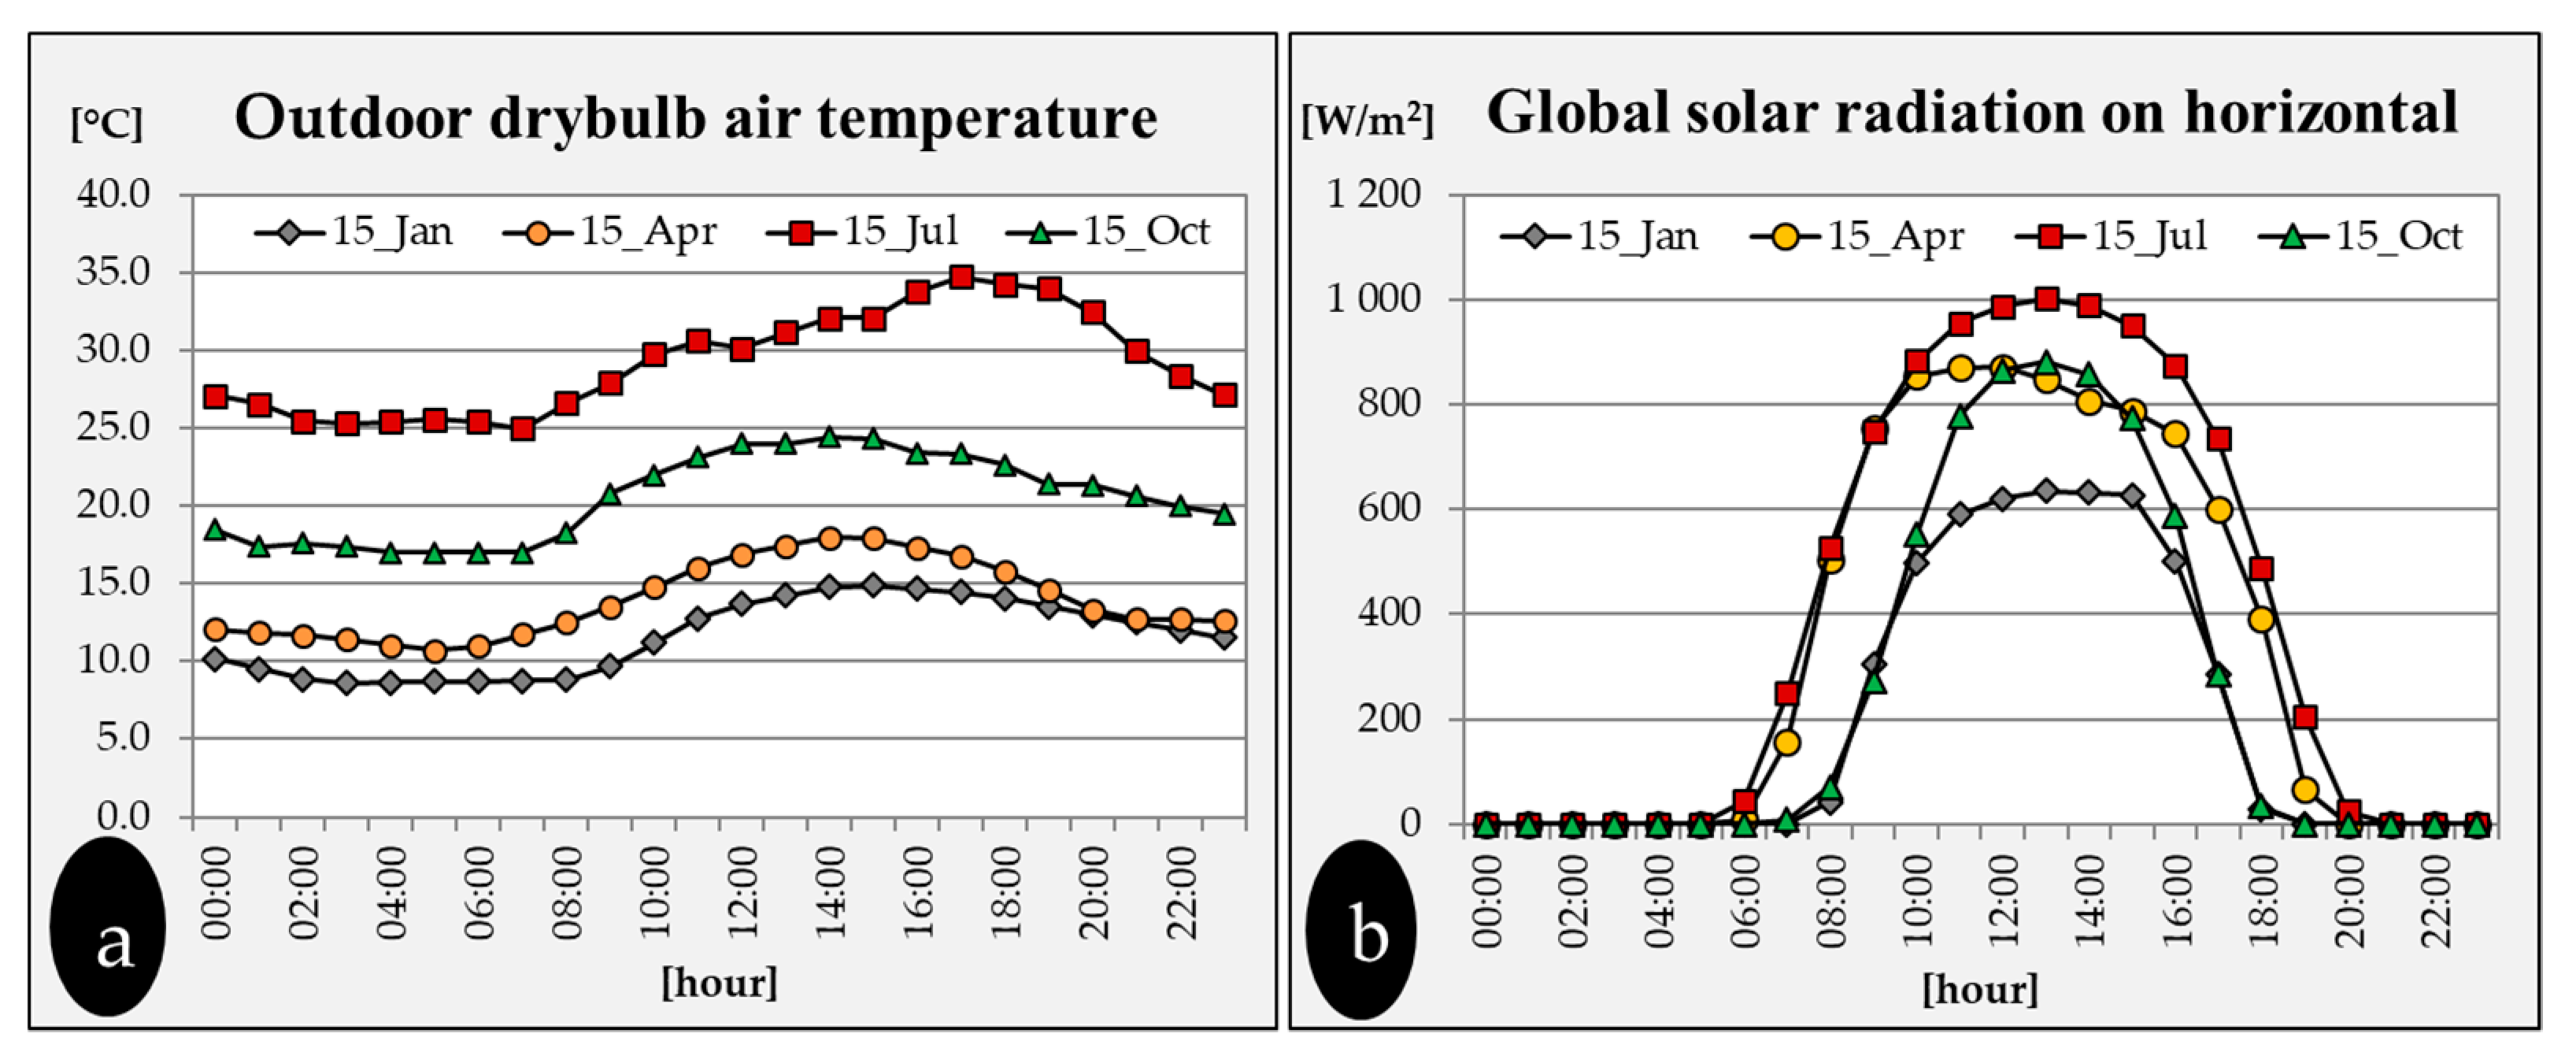
3.2. Numerical Model Definition

The acquired data have been used for the energy modeling of the building, under transient conditions as defined by ISO 52000 [40], the energy rating for calculating the performance of the building could be "Design", "As built", “Actual” or "Tailored", depending on various levels of detail of the input data and the type of application. Surely, in order to investigate potential energy refurbishments, the starting point is a numerical model representative for the real building. The “Tailored Rating” has been applied in this study. The boundary conditions are specified with reference to the building under investigation. Indeed, the outcome is not a standard energy performance, but a reliable building energy behavior.
For this purpose, the use of transient energy simulations compared to methods based on steady-state heat transfer is more precise and suitable. In short, the dynamic approach makes it possible to evaluate the inertial effect of mass, specific heat and insulation, so that attenuation and shift of thermal flux throughout the building envelope, or the start-up of the active energy systems, can be exhaustively contemplated.
The HVAC-envelope system model has been carried out in the EnergyPlus v 8.9 [41] engine, while the graphical definition of the geometry, dimensions, and positions of the thermal envelope has been assigned by using the program interface Design Builder v. 6.0 [42] (Figure 1b).
Regarding the outdoor boundary conditions, the weather file ASHRAE IWEC for Athens [43] (code 167160), available on the EnergyPlus web site, has been used. The file has hourly data for each climatic parameter needed during the calculations (i.e., dry-bulb air temperature, dew-point temperature, relative humidity, barometric pressure, direct normal radiation, diffuse horizontal radiation, wind speed, and direction). It shows a maximum outdoor dry bulb temperature of 37.2 °C (on August 6) and a minimum one of 2.0 °C (on December 26). The relative humidity is greater than 60% for 30% of the hours throughout the year, with an average annual value of 62%. The prevalent direction of the wind is North-East and the maximum values of wind speed, greater than 10 m/s, occur during February and November.
Four days, each representative of a season, have been chosen from which the hourly climatic data used in the simulations are shown in Figure 2: one day of winter (15 January), one day of spring (15 April), one day of summer (15 July) and one day of autumn (15 October). On January 15 the outdoor dry-bulb air temperature has a maximum value of 14.9 °C (at 15:00) and a minimum one of 8.7 °C (at 5:00 and 6:00). On July 15th, a peak of 34.8 °C is reached at 17:00 and a minimum value of 25.0 °C at 7:00. On April 15th, the air temperature is from 10.7 °C (at 5:00) to 18.0 °C (at 14:00), while on October 15, it ranges from 17.0 °C in the early morning to 24.5 at 14:00. The mean value of global solar radiation during the sunny hours of the winter day is 434 W/m2, for the spring day 636 W/m2, for the summer day 644 W/m2 and 498 for the autumn day.
The neighboring buildings have been defined in order to take their shadows into account, as can be seen in Figure 1b. The sky radiance model and the shadow algorithms used in EnergyPlus are described in [44].
Concerning the indoor boundary conditions, five thermal zones have been considered, as shown in Figure 1a. The main input data about occupants, lighting, and indoor electrical equipment have been set in accordance with the information found during the audit procedure. In Table 4 the nominal powers and schedules are shown. The schedules refer to weekdays of the whole year and the reported fraction is the multiplier of the density, used for each specific hour in the simulation. For each schedule, the initial reference hour is midnight, i.e. “Until: 07:00” means “from 24:00 until 7:00”.
For the resolution of the transient heat transfer through the building, the Conduction Transfer Function (CTF) algorithm has been used. The method, proposed for the first time by Mitalas [45], is based on Z-transforms. It relates the heat flux throughout the building envelope element to its previous values and the current and previous temperatures on the inner and outer surfaces. In this way, the thermal field inside the element is not determined and the discretization of the domain not made, making the method fast but powerful. The number of time-steps per hour (used by the software for defining how many times the energy balance is solved) has been set equal to 6. It is a trade-off between the precision of the results and the simulation time.
During the audit phase, the historical consumptions of oil and electricity have been relived. The simulation outputs have been compared to the energy data coming from the bills (Table 5). For instance, the simulated electricity consumption deviates from the real value of 9.4%, while the oil consumption is at about 3.5%. Therefore, the numerical model could be considered a good representative of reality.
For the simulation of the green layer, the validated model introduced by Sailor [46] and developed in a module of EnergyPlus has been used. The heat transfer processes of the model taken into account are radiative exchange within the plant canopy (long wave and short wave), evapotranspiration phenomenon (from the soil and plants), the effect of vegetable and soil layers on the convective and conduction heat transfer, respectively. A simplified balance of moisture in the soil is considered, which takes precipitation and irrigation into account, with a constant diffusion of moisture, considering only the top and the root layer. The final model formulation allows for equations of the soil and foliage surface temperature to be solved simultaneously, in each time step.

4. Results of Numerical Study

4.1. Results of the Base Case

Based on the numerical model, some information about the thermal performance of the building envelope, in the state of fact, has been carried out. Regarding the thermal needs, the monthly trend is reported in Figure 3. The total cooling need, of 47.8 kWh/(m2y), is slightly greater than the total heating need, of 45.0 kWh/(m2y).
Table 6 shows some terms of the energy balance for the three analyzed rooms in the four considered days. In order to give representative but synthetic values, the daily averages have been calculated. The energy gains and losses through the windows and glazed doors are shown, as well as the heating and cooling energy needs of the rooms. Moreover, heat flux on the inner face of different building elements (roof and walls) are presented. The abbreviations E, S, N, W after the name of the rooms are respectively the East, South, North, and West exposure. Negative values mean that the heat flows from the surface to the zone air, while the positive vice versa. Analyzing the heat flux, the maximum incidence in absolute terms is observed on the roof during summertime. In the same period, the maximum values are shown on the east and west walls since the southern exposure is shaded by a horizontal overhang. In winter day (15-Jan) the maximum outgoing flux occurs on the northern walls. Instead, the days representative of intermediate seasons is characterized by lower values of heat flux. The summer thermal loads are more than double compared to winter thermal losses if the heat flux on the roof is analyzed. The same applies to the East facing wall of the Bedroom_2. Finally, the cooling energy need, for all rooms, is two or three times greater than the heating need.
From the literature reviews, it became clear that the reduction of the inside surface temperature of the walls reflects the external surface variation. The study of the climatic solicitations can be used for choosing the best position of a green system. Within the capabilities of the used tool, the visualization of the incident solar radiation and surface temperature on each external surface of building elements has been realized. Figure 4 and Figure 5 report the daily average for the South-East and South-West exposures. The most radiated surfaces are the roof and the East walls with the maximum values being reached on the 15th of July, as can be seen in Figure 4. The south wall is shaded by a horizontal overhang (1 m depth). Moreover, in Figure 5 the mean daily value of the external surface temperature is shown. It is directly connected to the urban heat island phenomenon and reflects what has been said about irradiated surfaces. The hottest surfaces for the analyzed days are both the East walls and the roof. This fact will be considered for the design process of the green system.

4.2. Parametric Analysis of LW

For the selected case study, an LW has been designed since it was found in the bibliographic analysis that it has a better performance than a GF. Among the three available exposures, the East facing one has been chosen due to its greater solar irradiation, hottest temperature, and maximum incoming heat flux in summer, as shown in the previous section.
The LW design will consist of four layers: the anti-root waterproofing sheath, the insulation material, the growing media, and the plant species. In order to choose the best configuration of the new wall, a sensitivity analysis with different materials will be carried out. To prevent possible damages due to the root system, the anti-root waterproofing sheath (2.0 mm) is inserted (λ = 0.23 W/m K, ρ = 1100 kg/m3, cp = 900 J/kg K).
Regarding the insulation, polyurethane panels = 0.032 W/m K, cp = 1600 J/kg K) with different density (ρ = 32/40/50 kg/m3) have been considered. The idea is to consider a material with the same level of insulation but that could bring different behavior in summer. The thickness (t = 0.06 m) is chosen to comply with the thermal transmittance limit values, as stated in the Greek “Regulation on the Energy Performance of Buildings – KENAK” [47]. The total U-value of the existing wall insulation is 0.44 W/ m2K, while the surface mass varies from 385.9 kg/m2 (for ρ = 32 kg/m3) to 386.4 kg/m2 (for ρ = 40 kg/m3) and 387.0 kg/m2 (for ρ = 50 kg/m3).
For the substrate, a commercial product with the following properties has been chosen: λ = 0.20 W/m K, ρ = 400 kg/m3, and cp = 1348 J/kg K, with a thickness of 8.0 cm. It is a mixture of peat, lapillus, pumice, expanded perlite, bark, coconut fibers, special clays, soil improvers, and organic fertilizers. The saturation volumetric moisture content is 0.50 and the residual volumetric moisture content is 0.02. The growing media will be placed in aluminum modular boxes (prism-shaped) with horizontal slits from which plants can grow up. These boxes have a thickness of about 8 cm, a width of 40 cm and they cover the whole height of the wall. They are anchored together to the wall by means of vertical guides. A prototype of this system was realized within the Green INSTRUCT project developed under the European Union’s Horizon 2020 research and innovation program [48]. In the present study, the possible thermal bridge between two successive boxes has not been considered. This approximation could be made since continuous external insulation (on which the boxes are installed) has been considered.
The irrigation system is simulated for all different days and times, with a maximum irrigation rate of 0.78 m/h. Smart control is activated, providing the shutdown of irrigation when the substrate is saturated with water at a level of higher of 30%.
From the literature analysis, limited information about the most suitable type of plant in the Mediterranean climate and its thermal characterizations has been found. In order to have various levels of evapotranspiration, three plant species with differing LAI, stomatal resistance, and vegetation height are considered [37]. Table 7 shows their main characteristics.
The analysis consists of five green systems on three insulated walls, in a total of 18 cases are analyzed.
Considering the cooling and heating energy needs of the whole apartment, the results of the 18 cases simulated are displayed in Figure 6. In the nomenclature of the configurations “INS” stands for “insulation” and the subsequent number is the density value (ρ = 32/40/50 kg/m3). Moreover, the addition of the green system is reported with the name of the relative plants. The heating need decreases with the application of insulation and it remains almost constant, or increases just slightly, by adding the green. On the other hand, the cooling need shows a slight decrease with the application of insulation and a more apparent decrease by adding the green.
The percentage of reduction of each configuration with respect to the current state and to the insulated wall, are reported in Table 8. The density of the insulation does not affect the results. The best performing plant type in summer, being tall grass, also brings the maximum winter penalty (positive values in Table 8). More detailed, the application of an LW on the East side brings a reduction of the building heating need to about 10%, provided mainly by the isolation, and a reduction of the cooling need of around 4%. This result is relatively small but the shape and boundary conditions of the building can be regarded as the causing factor for this. First of all, the East wall contributes only 19% of the entire surface of the heat exchange, the predominant heat exchange is caused by the roof (53%). Moreover, the roof is the most heated surface under a thermal point of view (Figure 4, Figure 5).
Based on these considerations, the same parametric analysis called “Scenario 2” has been conducted considering the hypothesis of the construction of a new inhabited residential floor above the one under investigation. In this way, the shape ratio is reduced and the East wall surface weighs more in the thermal balance (≈40%). The results are shown in Figure 7 (“SoF” states for “state of fact”) and Table 9. The application of the LW brings a reduction in heating need of about 21% to 23% and in cooling need of about 18%, with respect to the base case where the apartment is supposed to be on the middle floor of the building. The winter penalty by using a green system is also more evident if the percentage of reduction compared to the only-isolated wall is analyzed (≈2%).
All considerations about the performance of the insulation and plants made for the first analysis are more evident in Scenario 2. However, considering the actual state of the apartment, only the first case is studied. With a global approach that considers both winter and summer behavior the configuration “INS_50_SEDUM” results in the highest performance.

4.3. Results for the Final LW Configuration

In this section, the results of the application of an LW with polyurethane foam with a density of 50 kg/m3 and sedum species to the East wall of the case study are described. The results are organized into three main categories, the effect on the outdoor building surfaces, the energy-saving, and the improvement of the thermo-hygrometric comfort, which reflects the main areas affected by the application of a green wall: the urban level and the building level.

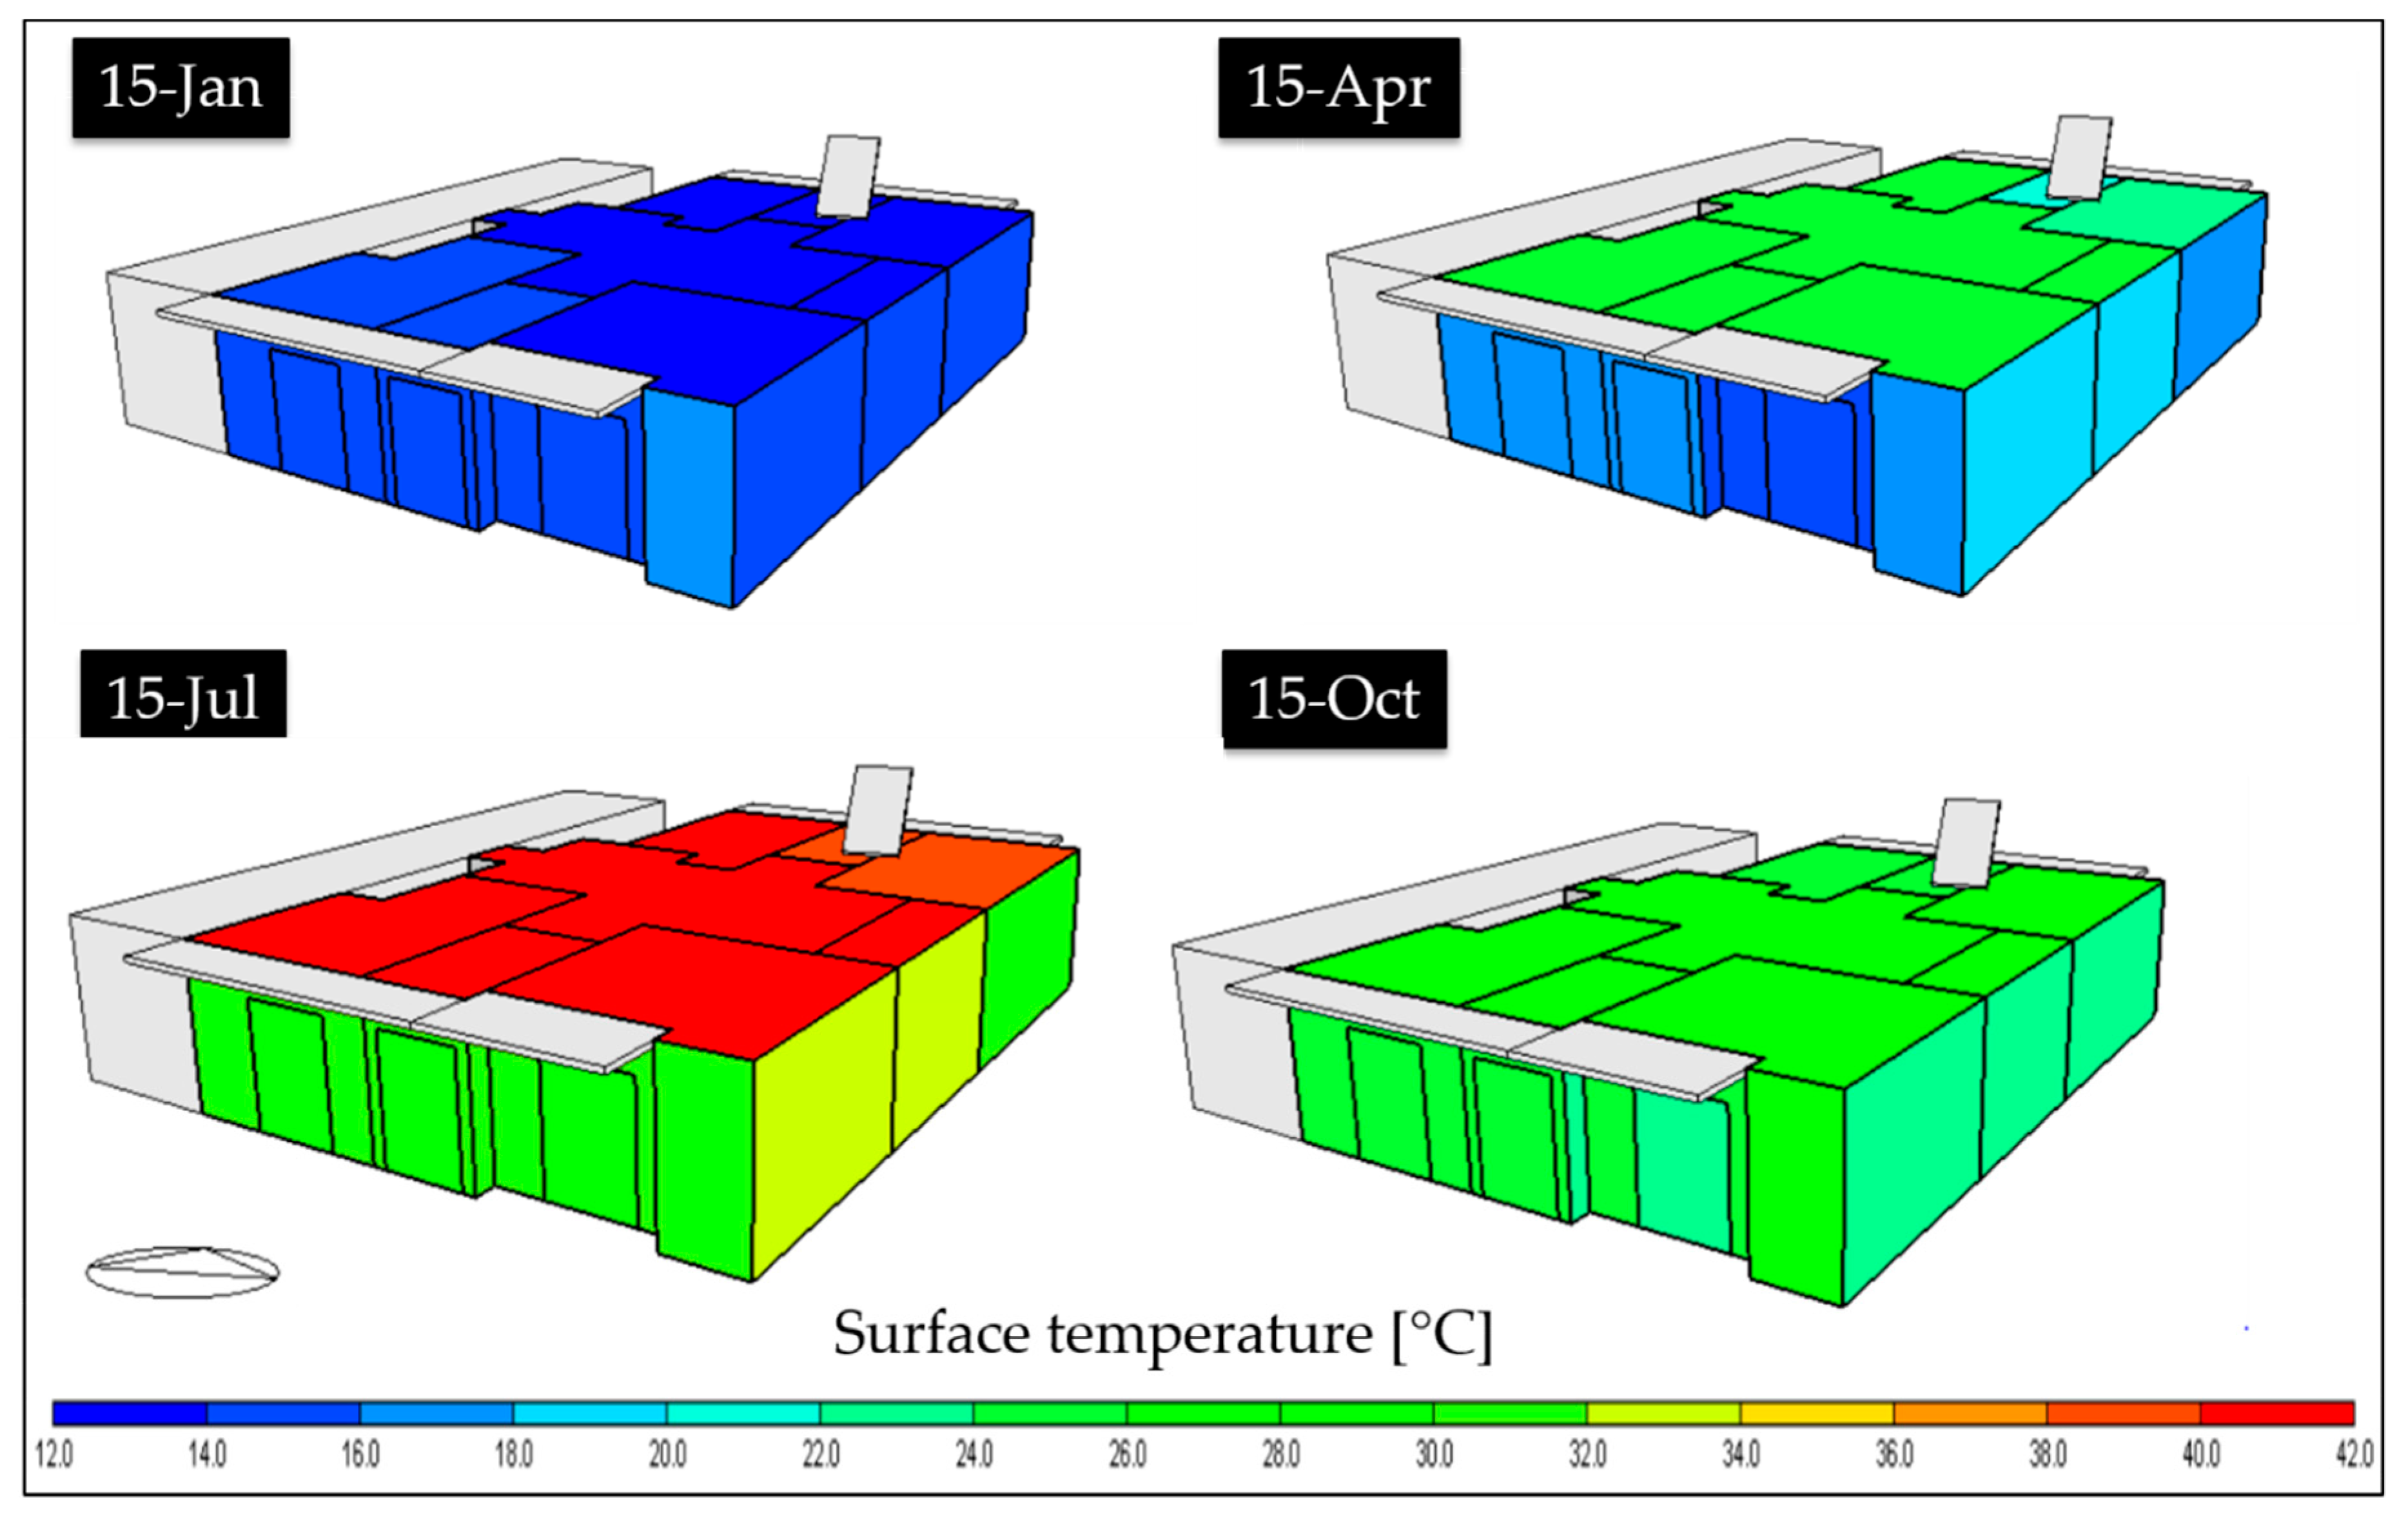
4.3.1. Outdoor Surface Temperature

Regarding the urban level, the main index considered is the difference of the outside surface temperature of the wall, both before and after the application of the green system on the East façade, ΔTs_out_E. The latter is shown for the only two rooms involved in the wall refurbishment, being the Kitchen and Bedroom_2. In Figure 8 the hourly values are reported for the summer day, 15 July. The average decrement of surface temperature is about 10 °C for the kitchen and 11 °C for the bedroom. The great values are reached at 10:00 and 11:00 in the morning and around 8:00 p.m. Decrements ranging from null to 5 °C have occurred during the winter, spring, and autumn reference days. Considering the whole summer period, from 21 June to 21 September, the isograms in Figure 8 show the number of hours in which the ΔTs_out_E index falls within a certain range. It is evident that for almost all hours this value is positive, indicating a reduction in surface temperature. The ΔTs_out_E is inside the range of 6–11 °C for 67% of the time range on the Kitchen wall and 63% on the Bedroom_2 wall. The mean values throughout the season are 8.13 °C and 8.88 °C for Kitchen and Bedroom_2, respectively. These results are comparable to the decrement value that could be calculated from [27] for the east wall (≈11.5 °C), during a similar period with quite the same climate.

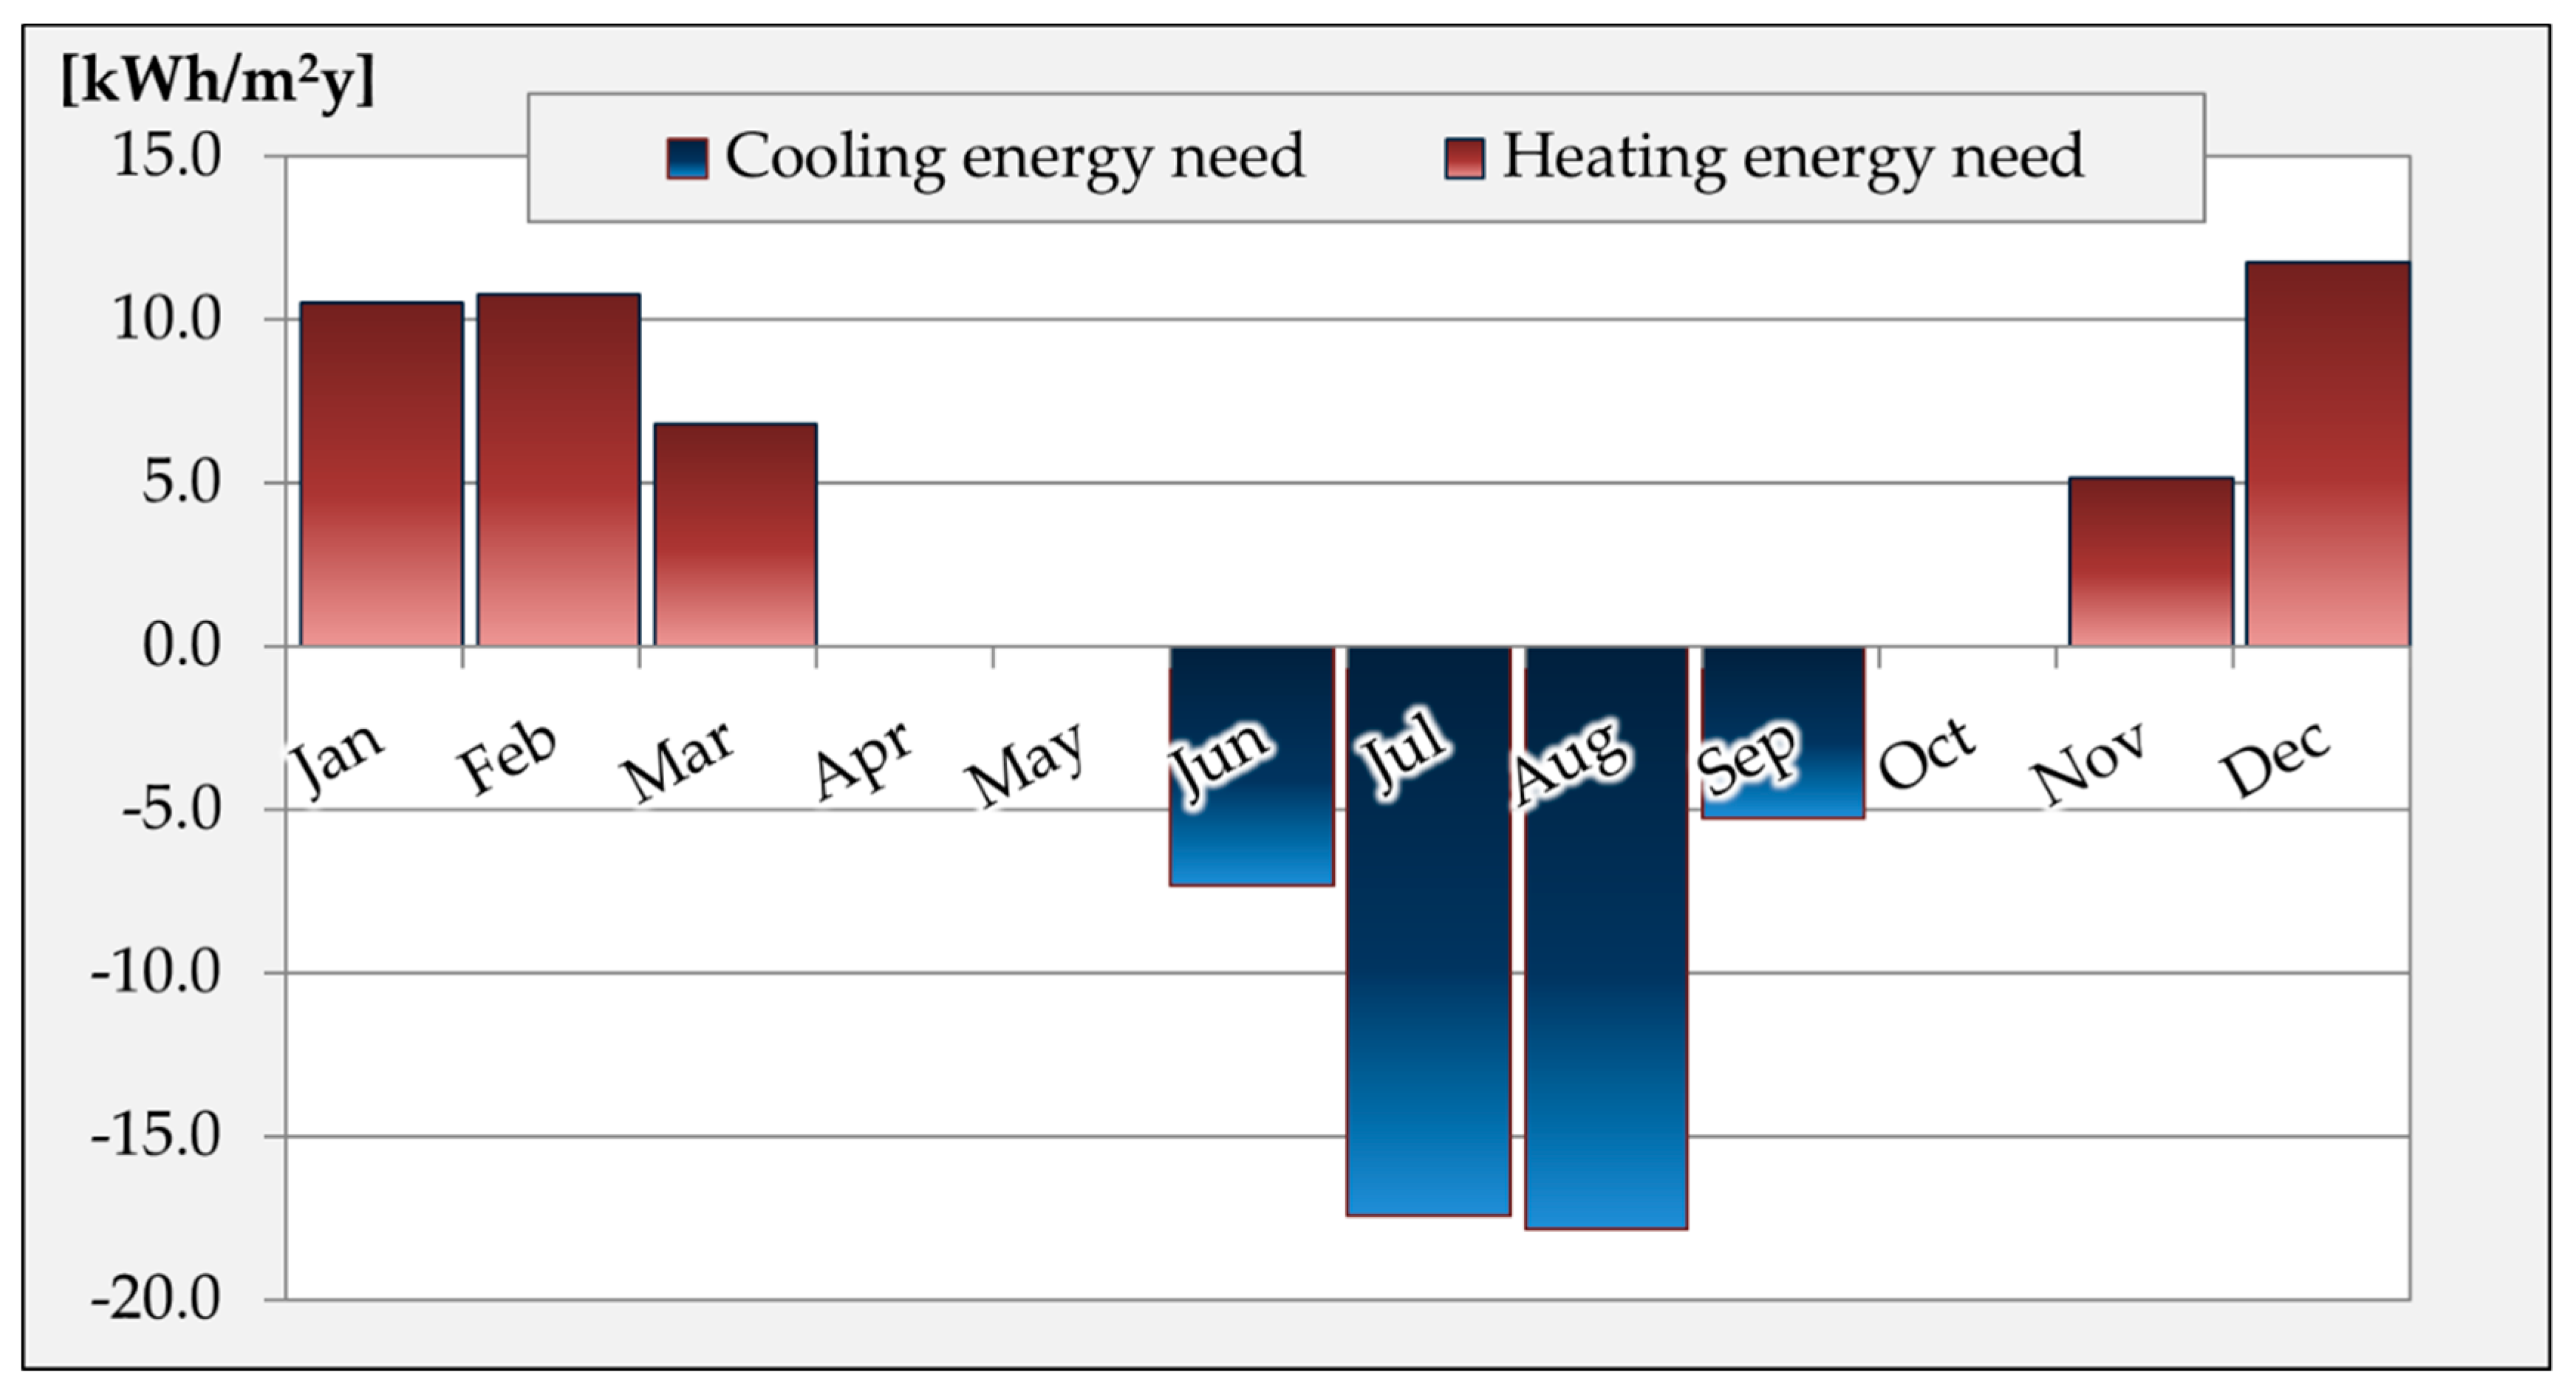
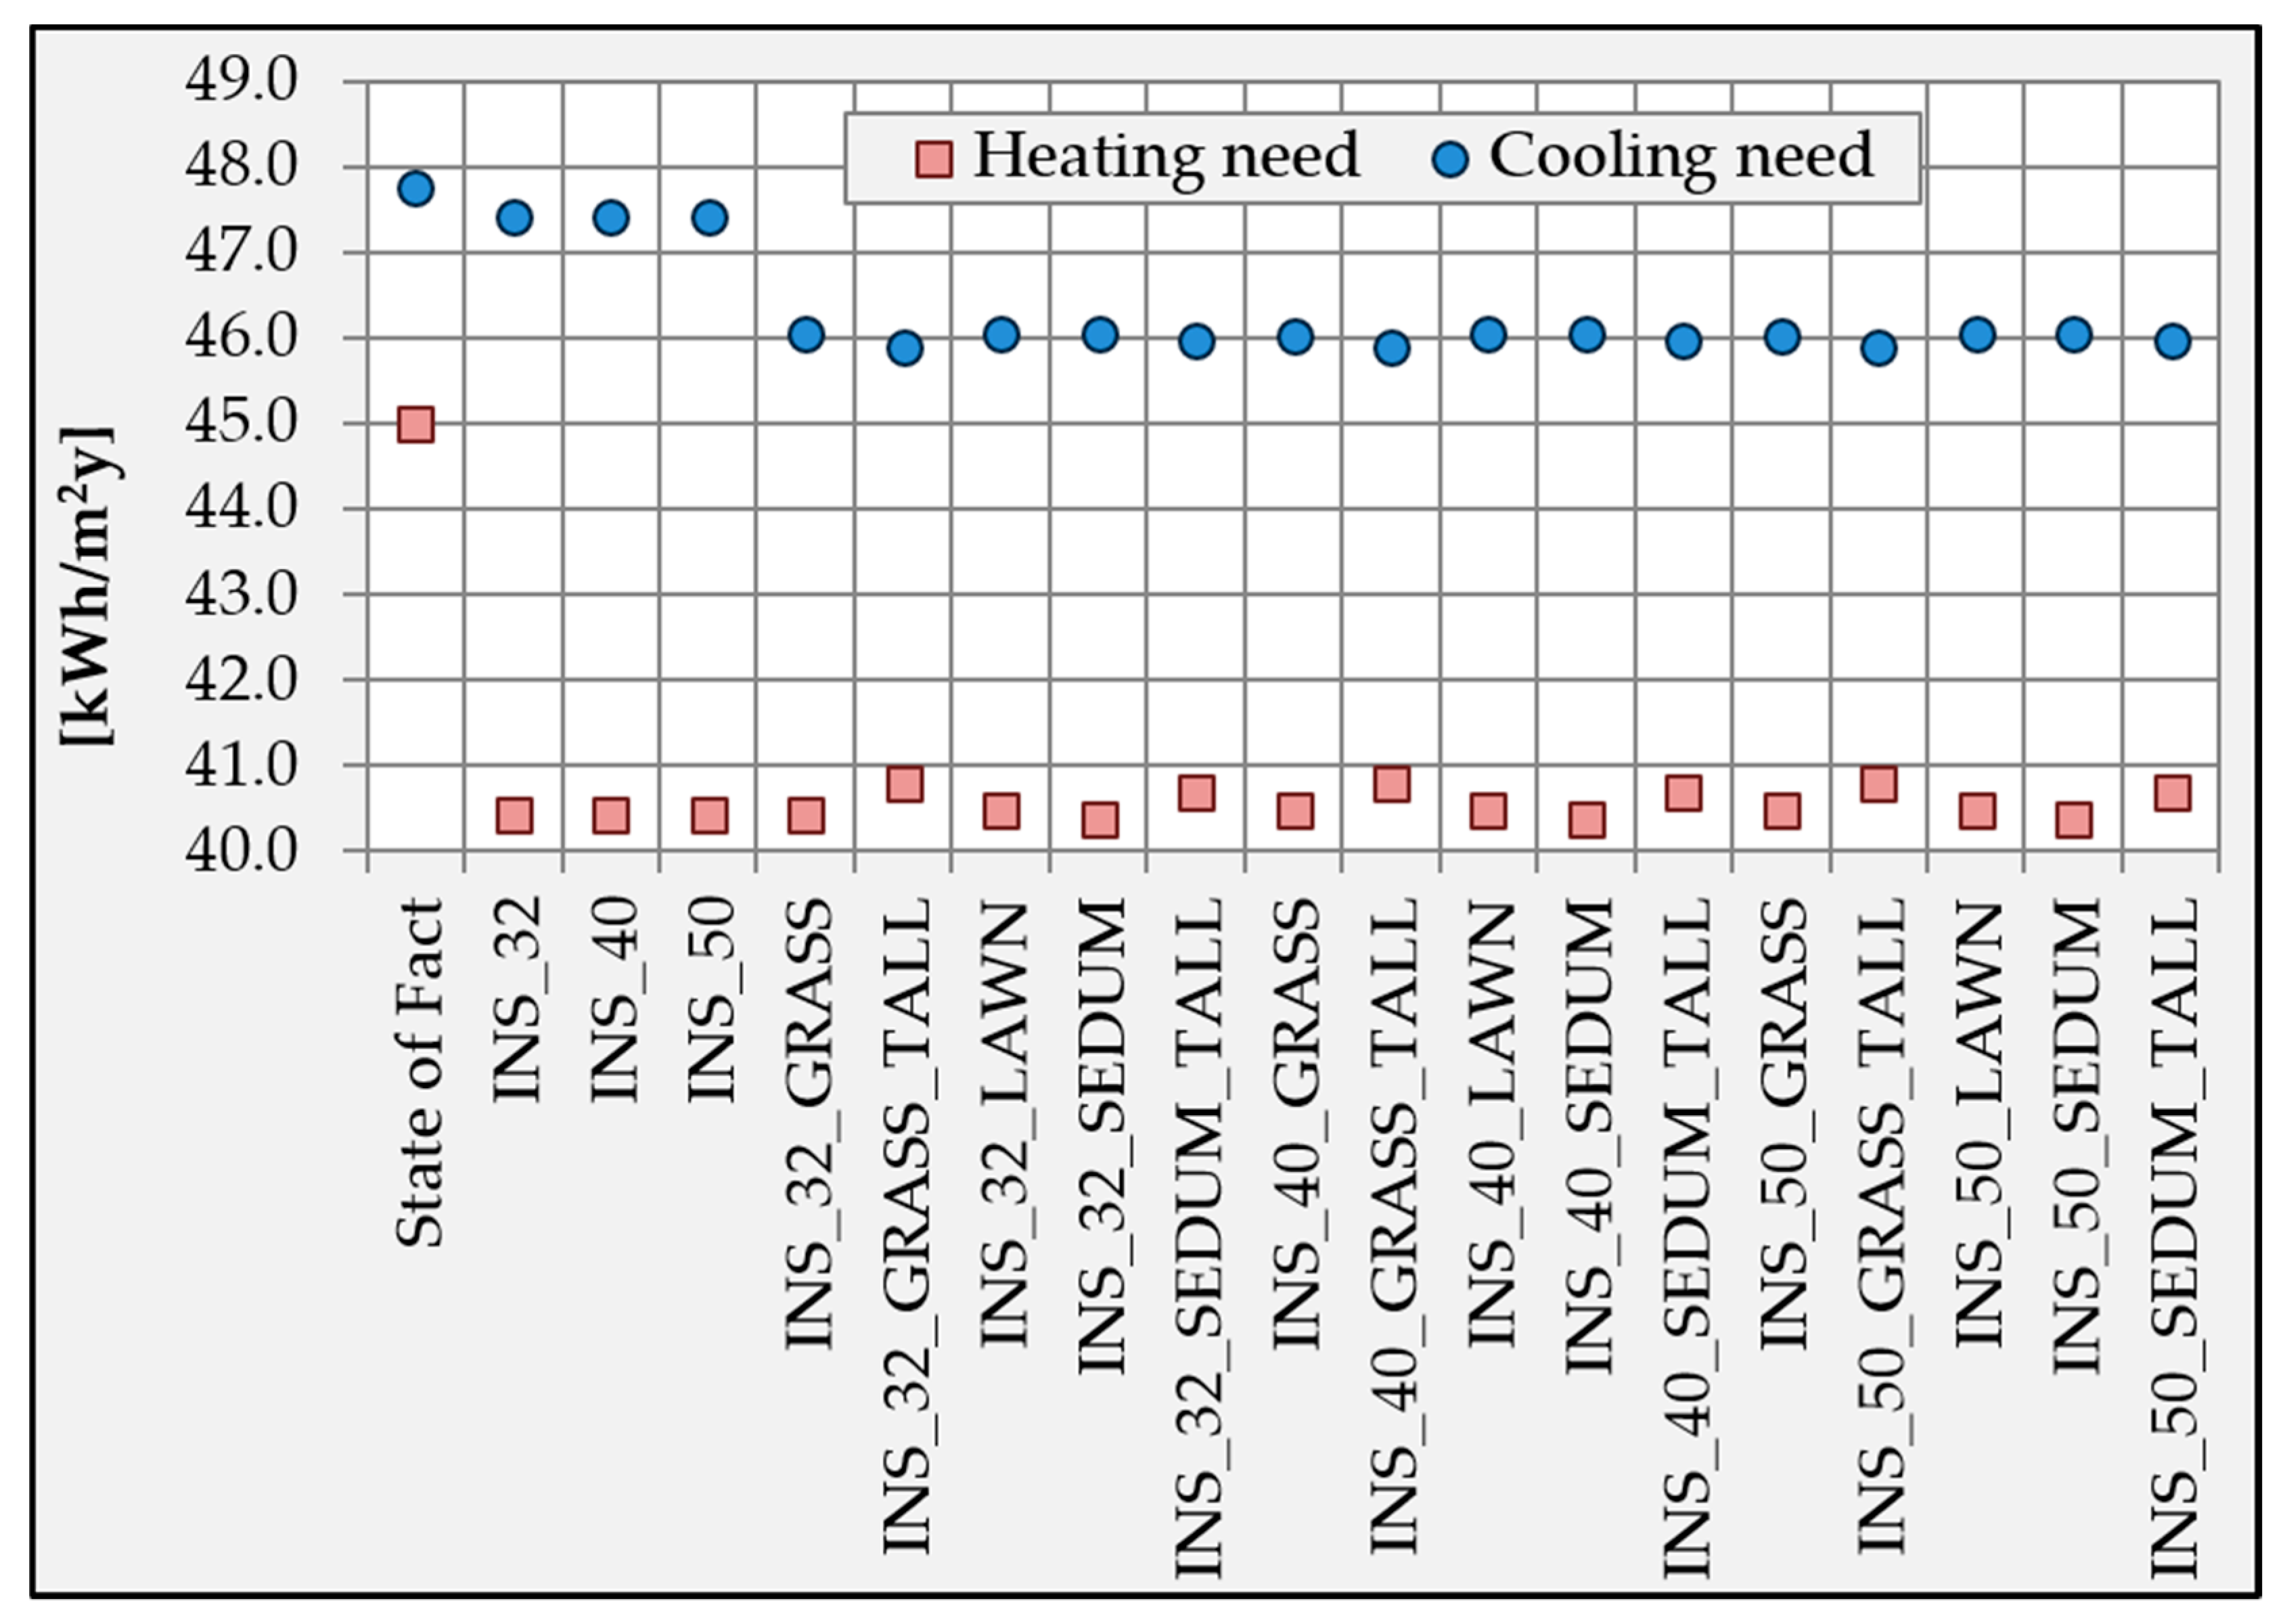
4.3.2. Energy Demand

Concerning the thermal requests of the building envelope, the annual heating need is 40.37 kWh/m2y while the cooling need is 46.08 kWh/m2y, with a percentage decrease with respect to the current state of 10.3% and 3.6 % respectively. A detail of one day and the three rooms is shown in Table 10. Particularly in the zones with the walls involved in the application of the greening system (Kitchen and Bedroom 2) during one day, the heating need decreases by 16% and 19%, while the cooling decreases by 9% and 10%. In similar outdoor boundary conditions, the application of LW in the south exposure brings a cumulative energy saving over one year ranging from 6.7% to 6.2% [28]. Alternatively, the bedroom without a proven need for refurbishment of the façade, Bedroom 3, the heating need decreases about 1% and no difference has been observed for the cooling need. For the heat flux on the inner face, abbreviations E, S, N, W, are respectively East, South, North, and West. Negative values mean that the heat flows from the surface to the zone air. The maximum variation with respect to the current state (in Table 6) are shown for the East walls of Kitchen and Bedroom_2: during the winter day, the percentage of decrease ranges from 78% to more than 100%, while the summer day percentages range from 82% to 97%, and from 27% to 44% for April 15th and from 11% to 23% for October 15th. For these rooms, also the other building elements not directly involved in the application of the green system, show a percentage of reduction of the heat flux. This mainly due to the fact that also indoor air temperature has varied, as will be shown below. Finally, for the Bedroom_3 small variations of about ±1% can be observed for some days.

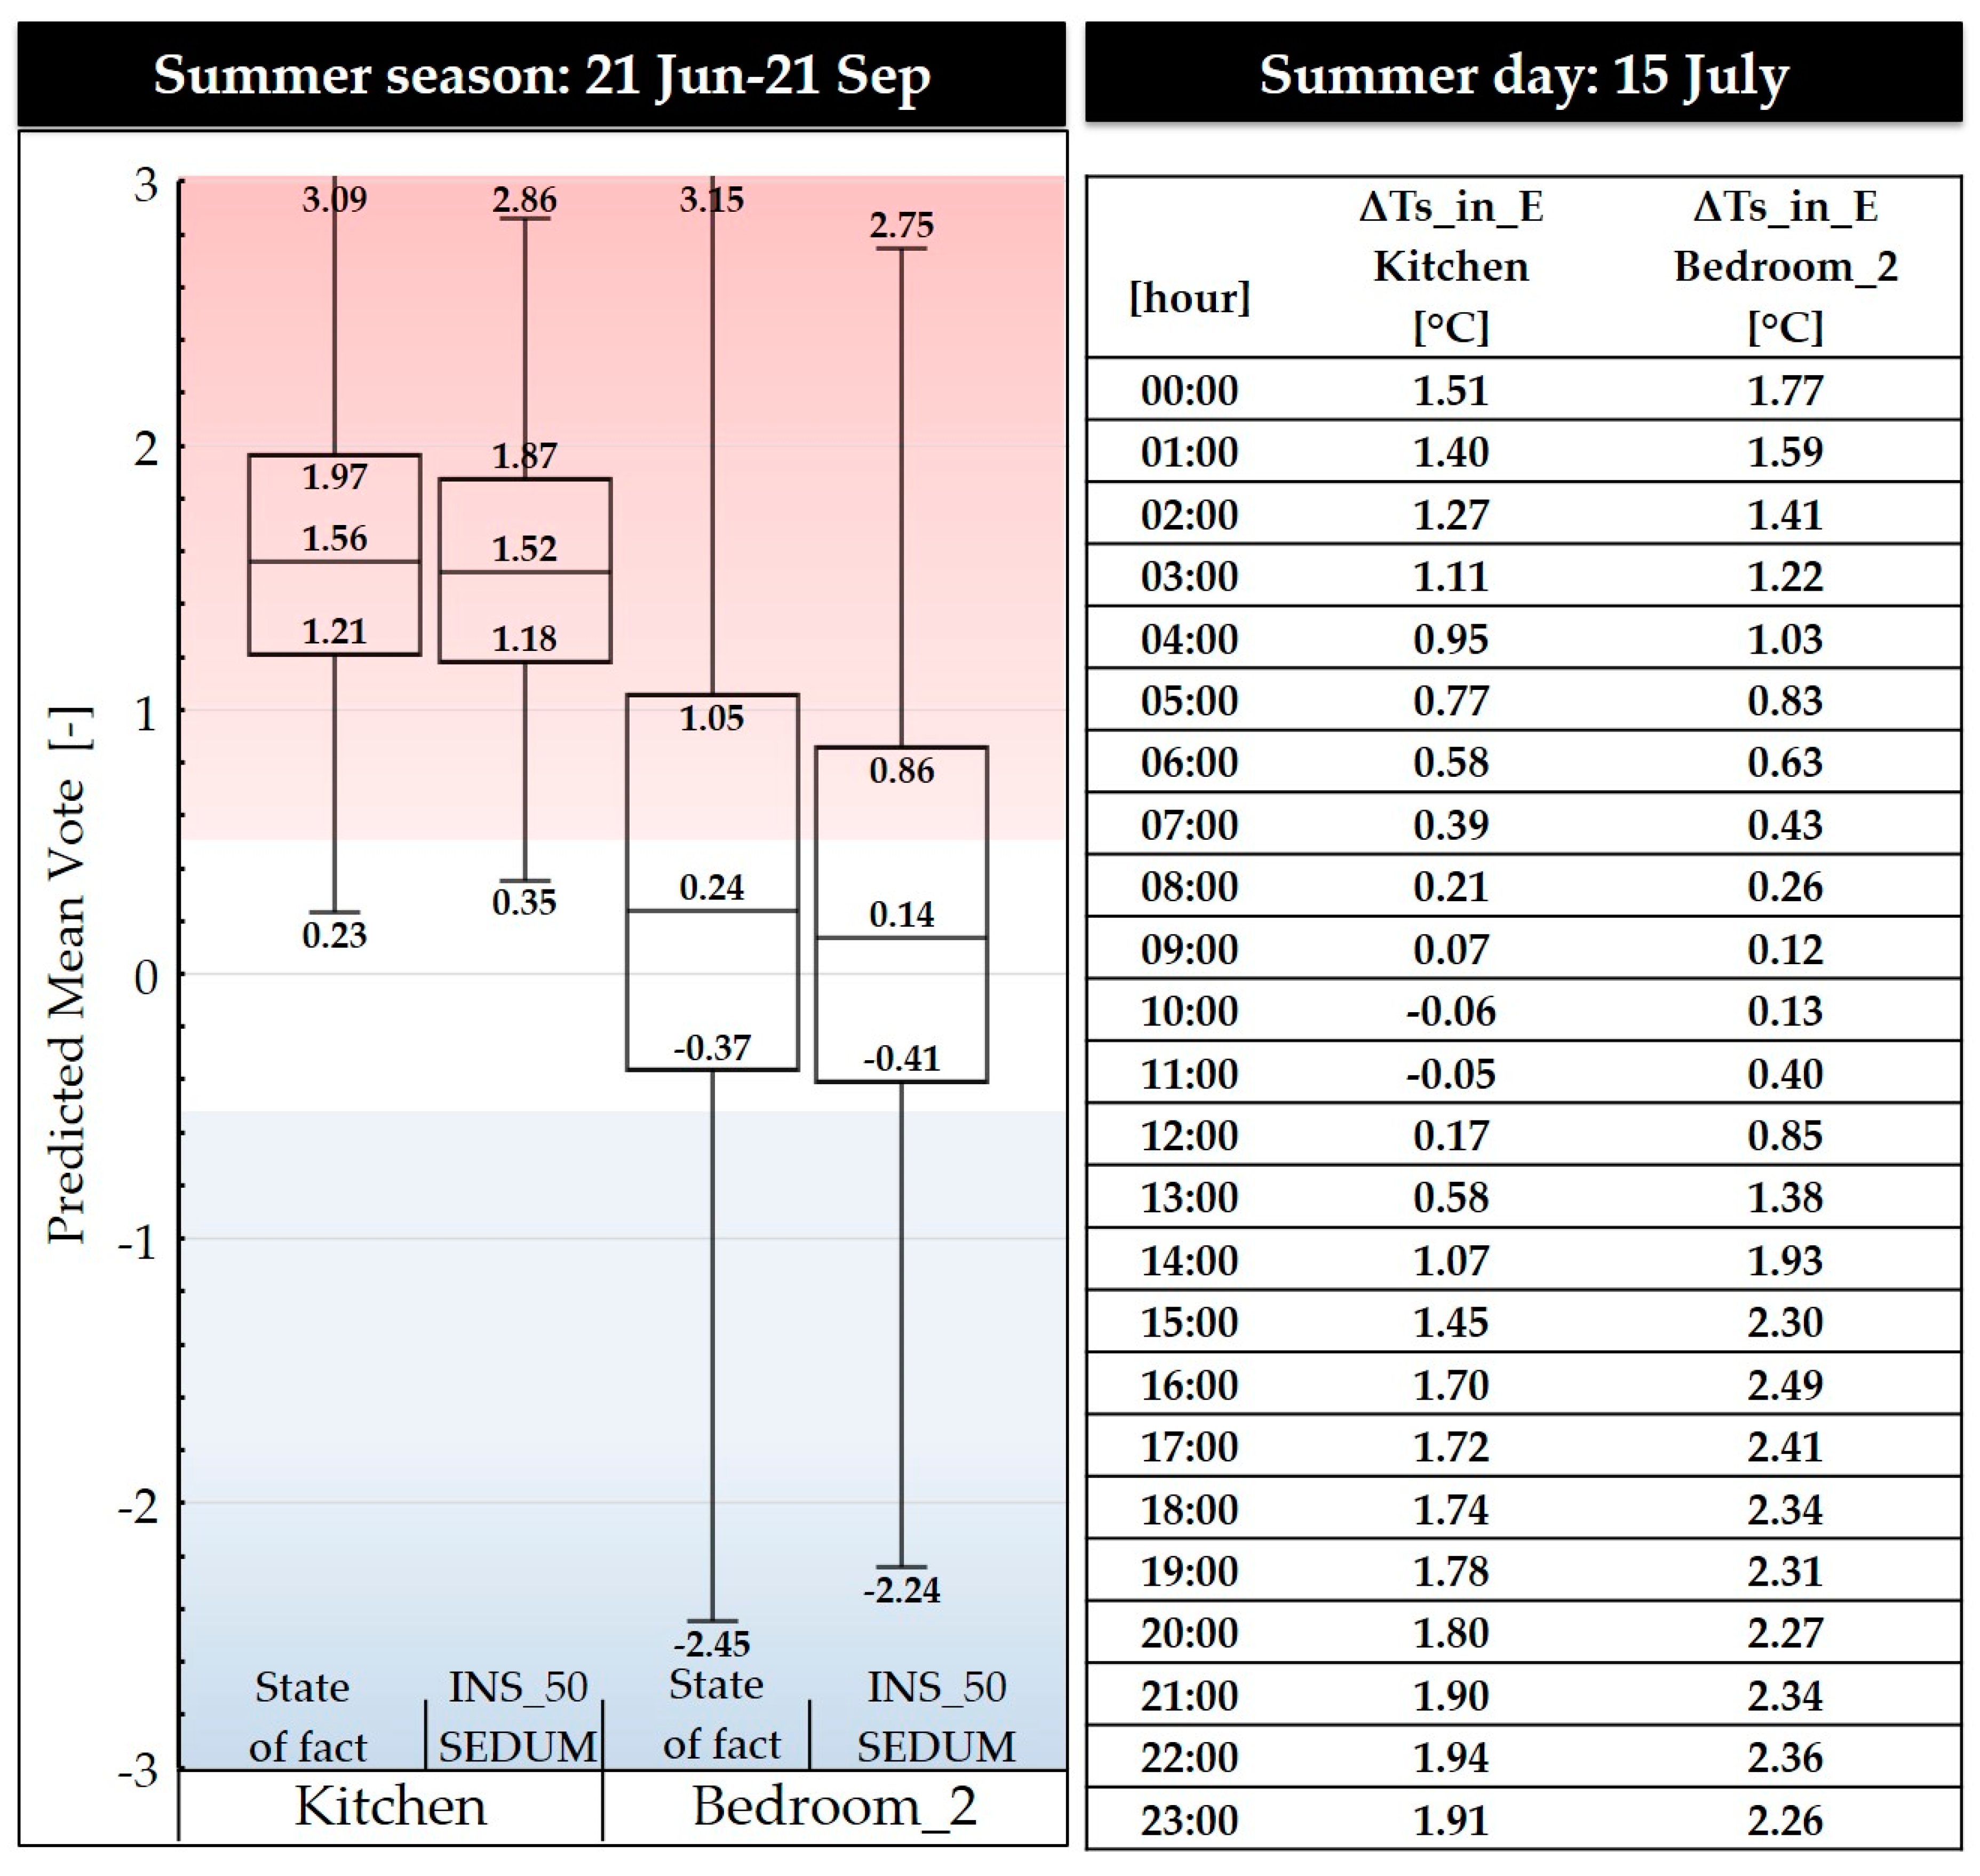
4.3.3. Thermo-hygrometric Comfort

Most studies in the literature analysis specify the incidence of indoor comfort in summer by considering the air and surface indoor temperature reduction. A complete evaluation should also consider other parameters in order to apply traditional or adaptive comfort models. In this paper, initially, a decrease of the inside surface temperature of the Eastern walls, both before and after the application of the green system ΔTs_in_E has been calculated as shown on the right side of Figure 9. The average value of ΔTs_in_E during July 15th is 1.08 °C for the wall in the kitchen and 1.46 °C for Bedroom 2. Moreover, in order to apply comfort standards in the analyzed rooms, the main thermos-hygrometric parameters like relative humidity, indoor airspeed, radiant temperature, and operative temperature have been evaluated.
For all hours of the summer season (from 21 June to 21 September) the Predicted Mean Vote (PMV), according to the [49] standard, has been carried out. The level of clothing insulation has been set equal to 0.5 Clo, while the metabolic rate equals to 90 W/people for the bedroom and 160 W/people for the kitchen. The results are reported in the box-plot in Figure 9, in which the comfort zone has been depicted in white, the zone with PMV greater than 0.5 in red, and the one with PMV lower than −0.5 in blue. The difference between the first and the third quartile (box) is apparent, as well as the difference between the maximum and the minimum data (whiskers), decrease after the application of the LW. Moreover, the medians (vertical bars) decrease, getting closer to the comfort zone. It is also noted that for the kitchen, in both cases, the PMV distribution is far from the optimal thermal zone. This mainly depends on the high internal thermal load (≈155 Wh/m2day) with respect to the bedroom (≈28 Wh/m2day).
Considering the adaptive comfort model according to the EN 15251 standard [50], the optimal comfort temperature based on the running mean outdoor temperature is 28.7 °C on 15 July. For the same day, the operative temperature of the analyzed rooms is reported in Table 11. The application of the LW provides a small reduction of operative temperature making it closer to the optimum temperature.

5. Conclusions

Green walls have great potential for improving the building energy performance and thermos-hygrometric comfort and for positive environmental changes in dense urban areas. However, these are not adequately diffused compared with their potentialities. The proposed paper has tried to underline the main criticalities length to vertical greening systems by evidencing the topics that require a deep research analysis.
The first part of the paper focuses on the literature analysis of green walls in the Mediterranean climate, pointing out some lacks that the present work aims to fill. In general studies, it is often observed that inner loads are not considered. In some cases, the energy-saving evaluation is made for a short period and the incidence of indoor comfort is evaluated often only by considering the air and surface indoor temperature reduction.
Starting from the observation that the LWs have better performance than GFs, the numerical study conducted in this work focuses on the design and performance evaluation of an LW applied to a single-family apartment placed in Athens (Greece). For this case study, representative of a building stock built before 1990, the energy audit has been carried out. The numerical model has been created, by means of EnergyPlus and its interface program DesignBuilder. The annual cooling and heating needs are shown to be almost comparable. From the literature review emerges that the reduction of the inside surface temperature of the walls reflects the external surface variation, therefore a deep study of the climatic solicitations has been carried out for choosing the best position of a green system. For instance, the distribution of surface temperatures, the solar radiation as well as the heat flow that flows through every single building element has been shown. This allows us to immediately identify the critical areas on which to intervene, and the conditions to which the plants are subjected. East exposure has also been identified.
From the literature analysis, limited information about the most suitable type of plant in the Mediterranean climate and their thermal characterizations has been found. Therefore, a parametric analysis with five types of evergreen plants has been carried out. For them, all characteristics have been defined: height, LAI, reflectivity, emissivity, stomatal resistance. Moreover, for the correct design of the LW, polyurethane insulating panels have been considered, with a thickness such as to respect the limits imposed by current legislation. Three different values of density have been considered for insulation. The sensitivity analysis with respect to the cooling and heating energy needs shows:
  • the density of the insulation of the wall does not affect the results,
  • the insulation layer provides the main heating energy saving,
  • the green layer brings a small penalty in winter and a good improvement in summer energy need,
  • the maximum cooling energy savings are reached by the plants (tall grass) with the maximum height and LAI and intermediate values of minimum stomatal resistance and leaf reflectivity compared to all others,
  • the application of an LW brings a reduction of the building heating and cooling need of about 10% and 4% respectively.
If the walls would have contributed more to the heat balance of the building envelope of the apartment, the energy-saving would have been around 20.8%. The results show a strong influence of the building envelope shape and the incidence of the walls on the building’s thermal exchange on the effectiveness of the application of LWs.
Considering the actual shape of the building envelope, with a global approach that considers both winter and summer behavior, the configuration with 50 kg/m3 of density for the insulation and Sedum as plant species, (height = 0.10 m, LAI = 0.80 m2/m2, leaf reflectivity = 0.22, minimum stomatal resistance = 300 s/m) results in the highest performing. It brings a reduction of total energy need of 6.9% with respect to the current state.
A decrease in the external surface temperature of the analyzed façade has been observed. In the entire summer season, for more than 60% of the hours, the difference of outside surface temperature of the wall before and after the application of the green system ranges from 6 to 11 °C. If this solution is widespread across the urban environment a mitigation effect of the urban heat island phenomenon could be seen. In the same season, a slight improvement in thermal comfort has been shown. Considering two rooms with one wall facing east, after the LW application, the maximum excursions of the PMV distributions decrease and the medians become closer to the comfort zone. In the same rooms for a representative summer day, a reduction of around 0.5 °C of operative temperature has occurred. This does not allow for reaching the optimal comfort temperature, but it is an improvement of the actual state.
Finally, by limiting the diurnal fluctuation of wall surface temperatures, the lifespan of the building facades is prolonged, slowing down wear and tear as well as achieving savings in maintenance cost and the replacement of some parts.
The results, organized by field of influence (outdoor temperature variation, energy and environmental aspect, thermo-hygrometric comfort), could be useful for the different stakeholders involved in the process of installation or utilization of a green vertical system.

Author Contributions

Methodology, S.R.; writing–review & editing, S.R., R.F.D.M., and D.P.; supervision, F.d.R. and M.-N.A. the contributes are evaluated as equal. All authors have read and agreed to the published version of the manuscript.

Funding

Horizon 2020 - Green INSTRUCT – Green INtegrated STRUCTural elements for retrofitting and new construction of buildings, grant number 723825.

Acknowledgments

The authors gratefully would like to thank the financial support from the Horizon 2020 - Green INSTRUCT – Green INtegrated STRUCTural elements for retrofitting and new construction of buildings, grant number 723825.

Conflicts of Interest

The authors declare no conflict of interest.

References

  1. United Nations General Assembly. Resolution Adopted by the General Assembly on 25 September 2015, Transforming our World: The 2030 Agenda for Sustainable Development; United Nations General Assembly: New York, NY, USA, 2015. [Google Scholar]
  2. Newton, J.; Gedge, D.; Early, P.; Wilson, S. Building Greener—Guidance on the Use of Green Roofs, Green Walls and Complementary Features on Buildings; CIRIA Press: London, UK, 2007. [Google Scholar]
  3. Manso, M.; Castro-Gomes, J. Green wall systems: A review of their characteristics. Renew. Sustain. Energy Rev. 2015, 41, 863–871. [Google Scholar] [CrossRef]
  4. Rakhshandehroo, M.; Yusof, M.; Johari, M.; Najd, M.D. Green Façade (Vertical Greening): Benefits and Threats. Appl. Mech. Mater. 2015, 747, 12–15. [Google Scholar] [CrossRef]
  5. Susorova, I. Green facades and living walls: Vertical vegetation as a construction material to reduce building cooling loads. In Eco-Efficient Materials for Mitigating Building Cooling Needs: Design, Properties and Applications; Woodhead Publishing: Sawston, UK, 2015; pp. 127–153. [Google Scholar]
  6. Kingsbury, N.; Dunnett, N. Planting Green Roofs and Living Walls; Timber Press: London, UK, 2008. [Google Scholar]
  7. Safikhani, T.; Abdullah, A.M.; Ossen, D.R.; Baharvand, M. A review of energy characteristic of vertical greenery systems. Renew. Sustain. Energy Rev. 2014, 40, 450–462. [Google Scholar] [CrossRef]
  8. Feitosa, R.C.; Wilkinson, S.J. Attenuating heat stress through green roof and green wall retrofit. Build. Environ. 2018, 140, 11–22. [Google Scholar] [CrossRef]
  9. Charoenkit, S.; Yiemwattana, S. Role of specific plant characteristics on thermal and carbon sequestration properties of living walls in tropical climate. Build. Environ. 2017, 115, 67–79. [Google Scholar] [CrossRef]
  10. Prodanovic, V.; Hatt, B.; McCarthy, D.; Zhang, K.; Deletic, A. Green walls for greywater reuse: Understanding the role of media on pollutant removal. Ecol. Eng. 2017, 102, 625–635. [Google Scholar] [CrossRef]
  11. Coma, J.; Perez, G.; de Gracia, A.; Bures, S.; Urrestarazu, M.; Cabeza, L.F. Vertical greenery systems for energy savings in buildings: A comparative study between green walls and green facades. Build. Environ. 2017, 111, 228–237. [Google Scholar] [CrossRef] [Green Version]
  12. Charoenkit, S.; Yiemwattana, S. Living walls and their contribution to improved thermal comfort and carbon emission reduction: A review. Build. Environ. 2016, 105, 82–94. [Google Scholar] [CrossRef]
  13. Jang, H.S.; Kim, H.J.; Jeon, J.Y. Scale-model method for measuring noise reduction in residential buildings by vegetation. Build. Environ. 2015, 86, 81–88. [Google Scholar] [CrossRef]
  14. Herath, H.M.P.I.K.; Halwatura, R.U.; Jayasinghe, G.Y. Modeling a Tropical Urban Context with Green Walls and Green Roofs as an Urban Heat Island Adaptation Strategy. Procedia Eng. 2018, 212, 691–698. [Google Scholar] [CrossRef]
  15. Wong, N.H.; Tan, A.Y.K.; Chen, Y.; Sekar, K.; Tan, P.Y.; Chan, D.; Chiang, K.; Wong, N.C. Thermal evaluation of vertical greenery systems for building walls. Build. Environ. 2010, 45, 663–672. [Google Scholar] [CrossRef]
  16. Pérez, G.; Rincón, L.; Vila, A.; González, J.M.; Cabeza, L.F. Green vertical systems for buildings as passive systems for energy savings. Appl. Energy 2011, 88, 4854–4859. [Google Scholar] [CrossRef]
  17. Pérez-Urrestarazu, L.; Fernández-Canero, R.; Franco, A.; Egea, G. Influence of an active living wall on indoor temperature and humidity conditions. Ecol. Eng. 2016, 90, 120–124. [Google Scholar] [CrossRef]
  18. He, Y.; Yu, H.; Ozaki, A.; Dong, N.; Zheng, S. An investigation on the thermal and energy performance of living wall system in Shanghai area. Energy Build. 2017, 140, 324–335. [Google Scholar] [CrossRef]
  19. Feng, H.; Hewage, K. Energy saving performance of green vegetation on LEED certified buildings. Energy Build. 2014, 75, 281–289. [Google Scholar] [CrossRef]
  20. Kalani, K.W.D.; Dahanayake, C.; Chow, C.L. Studying the potential of energy saving through vertical greenery systems: Using EnergyPlus simulation program. Energy Build. 2017, 138, 47–59. [Google Scholar]
  21. Riley, B. The state of the art of living walls: Lessons learned. Build. Environ. 2017, 114, 219–232. [Google Scholar] [CrossRef]
  22. Mazzali, U.; Peron, F.; Romagnoni, P.; Pulselli, R.M.; Bastianoni, S. Experimental investigation on the energy performance of Living Walls in a temperate climate. Build. Environ. 2013, 64, 57–66. [Google Scholar] [CrossRef]
  23. Vox, G.; Blanco, I.; Schettini, E. Green façades to control wall surface temperature in buildings. Build. Environ. 2018, 129, 154–166. [Google Scholar] [CrossRef]
  24. Victorero, F.; Vera, S.; Bustamante, W.; Tori, F.; Bonilla, C.; Gironás, J.; Rojas, V. Experimental study of the thermal performance of living walls under semiarid climatic conditions. Energy Procedia 2015, 78, 3416–3421. [Google Scholar] [CrossRef] [Green Version]
  25. Coma, J.; Solé, C.; Castell, A.; Cabeza, L.F. New green facades as passive systems for energy savings on buildings. Energy Procedia 2014, 57, 1851–1859. [Google Scholar] [CrossRef] [Green Version]
  26. Pérez, G.; Coma, J.; Sol, S.; Cabeza, L.F. Green facade for energy savings in buildings: The influence of leaf area index and facade orientation on the shadow effect. Appl. Energy 2017, 187, 424–437. [Google Scholar] [CrossRef] [Green Version]
  27. Kontoleon, K.J.; Eumorfopoulou, E.A. The effect of the orientation and proportion of a plant-covered wall layer on the thermal performance of a building zone. Build. Environ. 2010, 45, 1287–1303. [Google Scholar] [CrossRef]
  28. Pulselli, R.M.; Pulselli, F.M.; Mazzali, U.; Peron, F.; Bastianoni, S. Emergy based evaluation of environmental performances of Living Wall and Grass Wall systems. Energy Build. 2014, 73, 200–211. [Google Scholar] [CrossRef]
  29. Perini, K.; Bazzocchi, F.; Croci, L.; Magliocco, A.; Cattaneo, E. The use of vertical greening systems to reduce the energy demand for air conditioning. Field monitoring in Mediterranean climate. Energy Build. 2017, 143, 35–42. [Google Scholar] [CrossRef]
  30. Manso, M.; Castro-Gomes, J.P. Thermal analysis of a new modular system for green walls. J. Build. Eng. 2016, 7, 53–62. [Google Scholar] [CrossRef]
  31. Kottek, M.; Grieser, J.; Beck, C.; Rudolf, B.; Rubel, F. World Map of the Köppen-Geiger Climate Classification Updated; Gebrüder Borntraeger: Berlin/Stuttgart, Germany, 2006. [Google Scholar] [CrossRef]
  32. Razzaghmanesh, M.; Razzaghmanesh, M. Thermal performance investigation of a living wall in a dry climate of Australia. Build. Environ. 2017, 112, 45–62. [Google Scholar] [CrossRef]
  33. Olivieri, F.; Olivieri, L.; Neila, J. Experimental study of the thermal-energy performance of an insulated vegetal façade under summer conditions in a continental Mediterranean climate. Build. Environ. 2014, 77, 61–76. [Google Scholar] [CrossRef]
  34. Olivieri, F.; Redondas, D.; Olivieri, L.; Neila, J. Experimental characterization and implementation of an integrated autoregressive model to predict the thermal performance of vegetal facades. Energy Build. 2014, 72, 309–321. [Google Scholar] [CrossRef] [Green Version]
  35. Hoelscher, M.T.; Nehls, T.; Jänicke, B.; Wessolek, G. Quantifying cooling effects of facade greening: Shading, transpiration and insulation. Energy Build. 2016, 114, 283–290. [Google Scholar] [CrossRef]
  36. Malys, L.; Musya, M.; Inard, C. A hydrothermal model to assess the impact of green walls on urban microclimate and building energy consumption. Build. Environ. 2014, 73, 187–197. [Google Scholar] [CrossRef]
  37. De Masi, R.F.; de Rossi, F.; Ruggiero, S.; Vanoli, G.P. Numerical optimization for the design of living walls in the Mediterranean climate. Energy Convers. Manag. 2019, 195, 573–586. [Google Scholar] [CrossRef]
  38. International Organization for Standardization. ISO 6946:2017, Building Components and Building Elements—Thermal Resistance and Thermal Transmittance—Calculation Methods; ISO: Geneva, Switzerland, 2017. [Google Scholar]
  39. International Organization for Standardization. ISO 15099:2003, Thermal Performance of Windows, Doors and Shading Devices—Detailed Calculations; ISO: Geneva, Switzerland, 2003. [Google Scholar]
  40. International Organization for Standardization. ISO 52000-1:2017, Energy Performance of Buildings—Overarching EPB Assessment, Part 1: General Framework and Procedures; ISO: Geneva, Switzerland, 2017. [Google Scholar]
  41. Energy Plus Simulation Software; version 8.9; U.S. Department of Energy: Washington, DC, USA, 2018.
  42. DesignBuilder Software, version 6.0; DesignBuilder Software Ltd: London, UK, 2019.
  43. EnergyPlus. Available online: https://energyplus.net/weather-location/europe_wmo_region_6/GRC//GRC_Athens.167160_IWEC (accessed on 24 April 2020).
  44. U.S. Department of Energy. EnergyPlus™ Version 8.9.0 Documentation: Engineering Reference; U.S. Department of Energy: Washington, DC, USA, 2018.
  45. Mitalas, G.P. Room dynamic Thermal Response. In Proceedings of the 4th International Symposium on the Use of Computers for Environmental Engineering Related to Buildings, Tokyo, Japan, 30 March–2 April 1983. [Google Scholar]
  46. Sailor, D.J. A green roof model for building energy simulation programs. Energy Build. 2008, 40, 1466–1478. [Google Scholar] [CrossRef]
  47. KENAK, Greek Regulation for the Energy Efficiency of Buildings: Ministerial Decision Δ6/Β/οικ.5825/30-03-2010 ΦΕΚΒ’ 407Athens. 2010.
  48. Green Instruct. Available online: https://www.greeninstruct.eu/news-and-events/ (accessed on 24 April 2020).
  49. International Organization for Standardization. International Standard ISO 7730:2005—Ergonomics of the Thermal Environment—Analytical Determination and Interpretation of Thermal Comfort Using Calculation of the PMV and PPD Indices and Local Thermal Comfort Criteria; ISO: Geneva, Switzerland, 2005. [Google Scholar]
  50. European Committee for Standardization. European Standard EN 15251:2007. Indoor Environmental Input Parameters for Design and Assessment of Energy Performance of Buildings Addressing Indoor Air Quality, Thermal Environment, Lighting and Acoustics; CEN: Brussels, Belgium, 2007. [Google Scholar]
Figure 1. (a) Plan of the apartment and thermal zones, (b) render view.
Sustainability 12 03772 g001
Figure 2. Outdoor air temperature (a) and global solar radiation (b) of the days under investigation.
Sustainability 12 03772 g002
Figure 3. Monthly thermal energy need.
Sustainability 12 03772 g003
Figure 4. Visualization of the average daily incident solar radiation.
Sustainability 12 03772 g004
Figure 5. Visualization of the average daily external surface temperature.
Sustainability 12 03772 g005
Figure 6. Results for the living system applied to the East wall.
Sustainability 12 03772 g006
Figure 7. Results of Scenario 2.
Sustainability 12 03772 g007
Figure 8. Decrease of outside surface temperature.
Sustainability 12 03772 g008
Figure 9. PMV distribution (on the left) and decrease of inside surface temperature (on the right).
Sustainability 12 03772 g009
Table 1. Results of studies carried out in the Mediterranean climate about green walls performance.
Authors Study Green wallPeriodMain results
Mazzali et al. [22]Exp.LWOne summerOutdoor surface temperature reduction
- sunny days: 12 °C–20 °C
- cloudy days: 1 °C–2 °C.
Vox et al. [23]Exp.GFTwo yearsOutdoor surface temperature reduction
- warm days: up to 9.0 °C
- cold days (nighttime): up to 3.5 °C.
Coma et al. [11]Exp.GF
LW
Four monthsEnergy saving
- Cooling period:
Tset point 18 °C: LW 31.2%; GF 5.0%
Tset point 21 °C: LW 42.9%; GF 20.3%
Tset point 24 °C: LW 58.9%; GF 33.8%
- Heating period:
LW 4.2%; GF 1.9%
Outdoor surface temperature reduction
- Summer:
E: LW 17.0 °C; GF 13.8 °C
S: LW 21.5 °C; GF 10.7 °C
W: LW 20.1 °C; GF 13.9 °C
- Winter:
E: LW 4.5 °C; GF −0.2 °C
S: LW 16.5 °C; GF 0.7 °C
W: LW 6.5 °C; GF −0.3 °C
Victorero et al. [24]Exp.LW12 daysOutdoor surface temperature reduction
Maximum value 30 °C
Coma et al. [25]Exp.GFOne summerEnergy saving
Tset-poit 24 °C: 1% daily
Indoor temperature reduction during the free-floating period
- Air temperature: 1 °C
- Surface temperature: 0.5–2 °C
Outdoor surface temperature reduction
up to 14 °C in July and September
Pérez et al. [26]Exp.GFTwo summersEnergy saving
Tset-poit 24 °C: 34%
Indoor temperature reduction during the free-floating period
- Air temperature: 2.5 °C
- Surface temperature average daily: 2 °C
Kontoleon and Eumorfopoulou [27]Num.GFOne summerEnergy saving
Average values at Tset-poit 20 °C: N 4.7%; E 18.2%; S 7.6%; W: 20.2%
Indoor surface temperature reduction
Average of maximum values at Tset-poit: 20 °C: N 0.65 °C; E 2.04 °C; S 1.06 °C; W 3.27 °C.
Pulselli et al. [28]Num.LWOne yearEnergy saving
- Cooling period: massive wall + LW (open air cavity) 15.2%; massive wall + LW (closed air cavity) 14.0%; insulated wall + LW (open air cavity) 6.7%; insulated wall + LW (open air cavity): 6.2%
- Heating period: No variation
Perini et al. [29]Exp.
Num.
LWOne summerEnergy saving
Tset-poit: 26 °C: 26.5%
Outdoor air temperature reduction
10 °C
Manso and Castro-Gomes [30]Exp.LWFour monthsIndoor surface temperature reduction
Average of maximum values at Tset-poit: 20 °C: Sep: 2.8 °C; Oct: 4.8 °C; Nov: 5.9 °C
Outdoor surface temperature reduction
Maximum value: 15 °C
Razzaghmanesh and Razzaghmanesh [32]Exp.LWEight monthsIndoor air temperature reduction
Maximum daily values: warm days 1.8 °C; cold days 0.8 °C.
Outdoor surface temperature reduction
Average of maximum values: warm days 14.9 °C; cold days −5.9 °C
Olivieri et al [33]Exp.LWTwo monthsIndoor Surface temperature reduction
Maximum: 4.5–8.2 °C
Average maximums 6.4°
Olivieri et al. [34]Exp.LWThree yearsIndoor temperature reduction
- Surface temperature: Winter 0–2 °C; Summer 2–7 °C; Spring 2–7 °C; Autumn 2÷7 °C
- Air temperature: Summer 1–11 °C; Spring 5–12 °C; Autumn 5–12 °C
Table 2. Description of layers of building elements.
MaterialSideth[m]λ[W /(mK)]ρ[kg/ m3]cp[J/(kg K)]μ[-]
External wall
PlasterOuter0.0250.901800100022.7
Brick 0.2001.10192084010.7
PlasterInner0.0250.701400100010.7
Internal wall
PlasterInner0.0150.701400100010.7
Brick 0.0801.10192084010.7
PlasterInner0.0150.701400100010.7
Internal ceiling
MarbleInner0.0153.502800100010000
Cement mortar 0.0301.402000100022.7
Concrete screed 0.0200.5890010001
Reinforced concrete 0.2001.9124001000148.5
PlasterInner0.0150.701400100010.7
Flat roof
BitumenOuter0.0100.171200100020000
Cement mortar 0.0301.402000100022.7
Concrete screed 0.0200.5890010001
Reinforced concrete 0.2001.9124001000148.5
PlasterInner0.0150.701400100010.7
Table 3. Geometrical information.
ZoneBuilding elementGross Area [m2]Cardinal Direction
KitWall14.56East
KitWall8.68North
KitRoof16.12
KitWindow2.33North
Bed_2Wall9.24South
Bed_2Wall11.48East
Bed_2Roof16.27
Bed_2Window3.15South
Bed_3Wall8.12North
Bed_3Wall11.48West
Bed_3Roof12.85
Bed_3Window3.15North
Table 4. Thermal zones modeling.
Domestic
Kitchen
Domestic
Lounge
Domestic
Bedroom
Domestic CirculationDomestic
Bathroom
OccupantDensity0.024 people/m20.018 people/m20.023 people/m20.016 people/m20.019 people/m2
Metabolic rate160 W/people110 W/people90 W/people180 W/people120 W/people
Activity scheduleUntil: 07:00, 0
Until: 10:00, 1
Until: 19:00, 0
Until: 23:00, 0.2
Until: 24:00, 0
Until: 16:00, 0
Until: 18:00, 0.5
Until: 22:00, 1
Until: 23:00, 0.7
Until: 24:00, 0
Until: 07:00, 1
Until: 08:00, 0.5
Until: 09:00, 0.25
Until: 22:00, 0
Until: 23:00, 0.25
Until: 24:00, 0.75
Until: 07:00, 0
Until: 10:00, 1
Until: 19:00, 0
Until: 23:00, 0.2
Until: 24:00, 0
Until: 07:00, 0
Until: 10:00, 1
Until: 19:00, 0
Until: 23:00, 0.2
Until: 24:00, 0
LightingPower density7.0 W/m27.0 W/m27.0 W/m27.0 W/m27.0 W/m2
Operating scheduleUntil: 07:00, 0
Until: 10:00, 1
Until: 19:00, 0
Until: 23:00, 1
Until: 24:00, 0
Until: 16:00, 0
Until: 23:00, 1
Until: 24:00, 0
Until: 07:00, 0
Until: 10:00, 1
Until: 19:00, 0
Until: 23:00, 0.2
Until: 24:00, 0
Until: 07:00, 0
Until: 10:00, 1
Until: 19:00, 0
Until: 23:00, 1
Until: 24:00, 0
Until: 07:00, 0
Until: 10:00, 1
Until: 19:00, 0
Until: 23:00, 1
Until: 24:00, 0
EquipmentPower density30.3 W/m23.90 W/m23.58 W/m21.57 W/m21.67 W/m2
Operating scheduleUntil: 07:00, 0.1
Until: 10:00, 1
Until: 19:00, 0.1
Until: 23:00, 0.3
Until: 24:00, 0.1
For: weekdays,
Until: 16:00, 0.1
Until: 18:00, 0.5
Until: 22:00, 1
Until: 23:00, 0.7
Until: 24:00, 0.1
Until: 07:00, 0.1
Until: 08:00, 0.5
Until: 09:00, 1
Until: 10:00, 0.5
Until: 17:00, 0.1
Until: 18:00, 0.3
Until: 19:00, 0.5
Until: 20:00, 0.8
Until: 22:00, 1
Until: 23:00, 0.8
Until: 24:00, 0.3
Until: 07:00, 0.1
Until: 08:00, 0.5
Until: 09:00, 1
Until: 10:00, 0.5
Until: 17:00, 0.1
Until: 18:00, 0.3
Until: 19:00, 0.5
Until: 20:00, 0.8
Until: 22:00, 1
Until: 23:00, 0.8
Until: 24:00, 0.3
Until: 06:00, 0.1
Until: 07:00, 0.3
Until: 09:00, 1
Until: 10:00, 0.3
Until: 18:00, 0.1
Until: 19:00, 0.5
Until: 21:00, 1
Until: 22:00, 0.3
Until: 24:00, 0.1
Table 5. Real and simulated consumptions.
Real ConsumptionSimulated ConsumptionPercentage Variation
ElectricityOilElectricityOilElectricityOil
[kWh/year] [kWh/year] [kWh/year] [kWh/year] [%] [%]
1721.011185.01882.010790.09.43.5
Table 6. Mean daily values of the building envelope.
15-Jan15-Apr15-Jul15-Oct
Heat gain rate of glazed surface (kWh)Kit0.731.601.831.06
Bed_26.362.352.075.83
Bed_30.911.992.391.32
Heat loss rate of glazed surface (kWh)Kit0.580.610.440.57
Bed_20.690.690.470.76
Bed_30.630.640.470.58
Heat flux on the inner face (W/m2)Kit_Roof3.80−0.89−6.20.14
Kit_Wall_E3.201.41−3.860.66
Kit_Wall_N4.522.90−2.612.13
Bed_2_Roof2.88−2.11−7.84−0.30
Bed_2_Wall_E2.360.44−5.210.59
Bed_2_Wall_S1.831.71−3.700.09
Bed_3_Roof3.51−2.15−7.60−0.77
Bed_3_Wall_N4.051.86−3.201.28
Bed_3_Wall_W3.841.33−4.380.89
Heating energy need (kWh)Kit3.89
Bed_22.85
Bed_34.54
Cooling energy need (kWh)Kit 9.40
Bed_2 9.62
Bed_3 7.73
Table 7. Main characteristics of the modeled vegetation.
Sedum Sedum TallLawnGrassGrass Tall
Height of plants [m]0.100.300.180.100.40
Leaf Area Index (LAI) [m2/m2]0.803.002.002.505.00
Leaf Reflectivity [-]0.220.220.400.300.30
Leaf Emissivity [-]0.950.950.950.950.95
Minimum Stomatal Resistance [s/m]30030080120120
Table 8. Energy percentage decreases for the LW applied to the East wall.
Heating Need DecreaseCooling Need Decrease
With Respect to State of FactWith Respect to Insulated WallWith Respect to State of FactWith Respect to Insulated Wall
INS_32−10.3% −0.7%
INS_40−10.3% −0.7%
INS_50−10.3% −0.7%
INS_32_GRASS−10.2%0.0%−3.6%−2.9%
INS_32_GRASS_TALL−9.4%1.0%−3.9%−3.2%
INS_32_LAWN−10.1%0.2%−3.6%−2.9%
INS_32_SEDUM−10.3%−0.1%−3.6%−2.9%
INS_32_SEDUM_TALL−9.6%0.7%−3.8%−3.1%
INS_40_GRASS−10.1%0.1%−3.7%−2.9%
INS_40_GRASS_TALL−9.4%1.0%−3.9%−3.2%
INS_40_LAWN−10.1%0.2%−3.6%−2.9%
INS_40_SEDUM−10.3%−0.1%−3.6%−2.9%
INS_40_SEDUM_TALL−9.6%0.7%−3.8%−3.1%
INS_50_GRASS−10.1%0.1%−3.7%−2.9%
INS_50_GRASS_TALL−9.4%1.0%−3.9%−3.2%
INS_50_LAWN−10.1%0.2%−3.6%−2.9%
INS_50_SEDUM−10.3%−0.1%−3.6%−2.9%
INS_50_SEDUM_TALL−9.6%0.7%−3.8%−3.1%
Table 9. Energy percentage decreases of Scenario 2.
Heating Need DecreaseCooling Need Decrease
With Respect to State of Fact in the Middle floor With Respect to Insulated WallWith Respect to State of Fact in the Middle floorWith Respect to Insulated Wall
INS_32−23.0% −9.7%
INS_40−23.0% −9.7%
INS_50−23.0% −9.7%
INS_32_GRASS−23.2%−0.2%−17.7%−8.8%
INS_32_GRASS_TALL−21.4%2.1%−18.5%−9.6%
INS_32_LAWN−22.9%0.2%−17.7%−8.8%
INS_32_SEDUM−23.4%−0.4%−17.6%−8.7%
INS_32_SEDUM_TALL−21.9%1.4%−18.2%−9.3%
INS_40_GRASS−23.0%0.1%−17.8%−8.9%
INS_40_GRASS_TALL−21.4%2.1%−18.5%−9.7%
INS_40_LAWN−22.9%0.2%−17.7%−8.8%
INS_40_SEDUM−23.4%−0.4%−17.6%−8.7%
INS_40_SEDUM_TALL−21.9%1.4%−18.2%−9.3%
INS_50_GRASS−23.0%0.1%−17.8%−8.9%
INS_50_GRASS_TALL−21.4%2.1%−18.5%−9.7%
INS_50_LAWN−22.9%0.2%−17.7%−8.8%
INS_50_SEDUM−23.3%−0.4%−17.6%−8.7%
INS_50_SEDUM_TALL−21.9%1.4%−18.2%−9.3%
Table 10. Mean daily values of the building envelope.
15-Jan15-Apr15-Jul15-Oct
Heat flux on the inner face
(W/m2)
Kit_Roof3.54−0.83−5.970.08
Kit_Wall_E1.801.11−2.120.74
Kit_Wall_N4.202.86−2.361.98
Bed_2_Roof2.84−2.12−7.66−0.26
Bed_2_Wall_E0.910.78−2.640.48
Bed_2_Wall_S1.761.61−3.520.07
Bed_3_Roof3.50−2.14−7.59−0.76
Bed_3_Wall_N4.041.88−3.181.28
Bed_3_Wall_W3.821.35−4.360.89
Heating energy need (kWh)Kit3.27
Bed_22.29
Bed_34.49
Cooling energy need (kWh)Kit 8.59
Bed_2 8.63
Bed_3 7.69
Table 11. Mean daily values of operative temperature.
15 July[ °C]
Optimal comfort temperature
(EN 15251)
28.67
KitchenState of fact31.15
INS_50_SEDUM30.70
Bedroom_2State of fact31.30
INS_50_SEDUM30.80
Bedroom_3State of fact31.12
INS_50_SEDUM31.09

