1. Introduction
E-skills are very importance in this new age, for job applications, communications, online booking, banking, and ordering, as well as completing online courses. Today, businesses face many challenges such as sustainability, globalization, and the development of new technologies. The electronic evolution has affected all organizations and its influences continue to grow. Internet use has had an impact on all business process, including communication [
1] (p 94). Globalization has changed the way people and communities relate [
2] (p1). The Internet has the ability to change and influence many activities and fields and enables people to live and work wherever they desire [
3] (p 3), becoming sustainable and obtaining sustainable performance. Employees who are involved in sustainable activities and adopt sustainable development principles, become sustainable human resources [
4]. Today, the challenge is not related to how to implement new technologies but how to acquire new e-skills, use them properly and sustainably, and combine them with other channels of communication. On the basis of these reasons, the scope of this research is to use simulation and mathematical modeling to show that there is a positive and very strong relationship between sustainable HR development and Internet use, which leads to an increase in the e-skills and e-activities mentioned above. The correlation function and Excel data analysis were used for the analysis and comparison among the three established zones (Romania, average level at the EU28 level, and the best-in-class group), and demonstrated that there is a relationship which shows the future trends on the European level, therefore, helping specialists increase skills, overcome risks, make better decisions, reduce costs, and increase performance. Some research hypotheses were established such as there is a correlation and a strong and positive relationship between e-skills and some e-activities developed in the new digitized world.
Many studies have been carried that studied the sustainable development of a performance organization [
5,
6] (p 202 and p 89) and the role of training e-competencies for competence jobs, for competence programs, to improve HR training and development, or to map processes [
7] (p.120), [
8] (p.1459), [
9,
10,
11], [
12] (p.1), however, these studies did not analyze the relationship between the e-skills and e-activities in order to obtain sustainable performance. Thus, the novelty of this study is important to others as well as the specialists in the field. The study is organized as follows:
Section 2 presents a literature review and an explanation of the existing factors that influence sustainable development including the trend of Internet use, as well as the importance and evolution of e-skills, digitization, and e-activities; in
Section 3, the research methodology is presented, in
Section 4 the framework for the analysis of the relationship between the variables through the prism of the correlation between the three zones and Excel data analysis, and the results obtained by implementing the correlation matrix on the level of the three zones; and in
Section 5 the discussion and conclusions are presented.
2. Literature Review
In this section, a literature review of the studies on the relationship between e-skills and e-activities is presented. For its measurement, some tools and tests were used, such as correlation matrix, benchmarking analysis, and Excel data analysis. Due to globalization and new technologies, all processes, including communication, are changing and organizations are using flexible networks to communicate [
13] (p 1). The world is becoming smaller and inter-related using the Internet to create trust and facilitate working in teams [
14] (p 257), as well as making information available to anybody at any moment [
15] (p 171). In terms of technology, we live in a golden age of communication. Global communication has been helped by the Internet, e-mails, faxes, mobile phones, and text messaging, as well as the mediated communication through Internet, e-mail, and mobile phones [
16] (p 67). According to the official statistics, the number of Internet users increased from 360 million in 2000 to 4.5 billion in 2019 [
17], and the number of websites increased from 17 million in 2000 to 1.5 billion in 2019 [
18].
This exponential development has mainly been due to the constraints created by globalization. No one, nor physical persons or juridical ones, cannot allow for a ”technological fracture”, because this will mean the exclusion from the regional (European) market which actually became a global one [
19] (p 30). In the past few years, there has been a growth in Internet markets [
20] (p 15). According to the principle, healthy people in healthy organizations, producing healthy products for healthy customers, human resource plays an important role in the application of the sustainable development activities by developing its e-skills.
Efficiency in organizations is achieved by their human resources, their behavior, knowledge, and skills, as well as sustainable development. Sustainability of an organization is achieved by the skills of the employees, leadership, and managers in deploying activities. In a world where the resources are limited, accepting sustainability supposes the responsibility towards future generations. The learning of the continuous development of the human capital must also become sustainable, allowing organizations to compete in a changing market which is economically and socially responsible. First, sustainable processes must be aligned with the business model, used by all departments, and understood by all employees.
The Internet has become the universal source of information for millions of people, at home, at school, and at work [
21]. In 2005, on average 27.3%, and in 2019, 49.7% of the households in the EU had a personal computer at home; whereas, in 2004, 42%, and in 2018, 89% had a home Internet connection. The penetration of computers and especially of the Internet remains lower in thinly populated, rural areas throughout the European Union [
22].
Communication has contributed to the global connection of society through the Internet. Men and women, and especially the new generation, are online almost all of the time [
23] (p.1). Internet, especially e-communication, provides the opportunity to exchange ideas and information at the global level [
24] (p 43). The Internet will become the most convenient tool of global communication worldwide [
25] (p 10), enabling even small businesses cross many internal barriers [
26] (p 20) and enter to the global market. Due to exceptional online experience [
27] (p.2), from 2002, Internet traffic has increased by 86 percent a year, and from 1995, websites have increased from 20,000 sites to over 36 million by 2002 [
14] (p 68), and by 2020, to 1.7 billion websites [
18].
The Internet is not just about connecting people, it is about attracting customers, offering them independent choise, diversity, transparency [
28] (p.45), convenience or flexibility [
29], and maintaining and growing relationships with stakeholders. In North America, 88.1% (2018) and 89.4% (2019) use the Internet, while 77.4% (2018) and 87.7% (2019) from the European population and 47.7% (2018) and 58.8% (2019) worldwide use the Internet [
30], and employees use e-mails every day (with 269 billion e-mails sent every day in 2017 and 306 billion e-mails sent in 2019 [
31], however, e-communication is not yet a substitute for face-to-face communication, but a new means to communicate faster and cost effectively.
The Internet reduces face-to-face meetings with clients, creating psychological barriers and physical distance; but modeling, used in many fields, and in our case in e-activities, will bring benefits for companies and for customers, being a paramount to economic policy [
32]. In addition to this type of communication, managers use e-mails, intranet, videoconferencing, or enterprises’ software to communicate with their employees [
33] (p 165). IBM, for example, offers more than 5000 audio and video podcast ”episodes” for employees to watch or listen whenever they have time.
2.1. Digitization: The Challenge for a New Business into a Sustainable Environment
In the new digitized era, full of change and challenges, the speed, cost, and novelty of transmitting data is important for any company. The Internet helps organizations transmit data rapidly using computers and the e-skills of employees. Thus, e-communication satisfies the need for efficient transmission of information and knowledge into a globalized and digitalized world. Without these new skills, organizations are not able to gain a competitive advantage, performance, or satisfy new customers’ needs in a sustainable way, i.e., fast, cheap, and well.
According to this vision of digitization, we present important and challenging processes such as the ones presented in this work.
Using digitization at work, employees should acquire knowledge and experience as in [
34] (p 150) as follows:
Representing the stages of any process;
Exchanging information between various people and stages;
Understanding the flow of information and the consumption of resources (time, financial, and human);
Being compatible with the applications used.
Any application used must meet the following four criteria: be fast and easy to use, allow comparison between the new and old models, provide a process model that is not only descriptive but also analytical, and allow the conduct of subsequent changes in the process design. Digitization can offer an organization a competitive advantage in the market, however, every competitor has access to the same technologies, and therefore can offer the same product and service, thus, the main aspect in winning customers’ trust and be chosen by these is to create flexibility for its systems, to develop its people’s skills (e-communication and e-collaboration), and to develop its infrastructure which can provide a bridge for interconnectivity.
The infrastructure of any organization offers [
34] (p 151) the following:
New work conditions (send e-mails, acquire new PCs, develop new portals, process data, make decisions, and create strategies);
New ways to decrease the costs (due to standardization, timely information on the new demands of customers or suppliers);
New ways to communicate faster (provide tracks, make provisions, knowledge of the consumption of resources, offer understanding and to differentiate from the competition);
New ways for stakeholders to have benefits (improve the market’ position, satisfy customers, employees, and managers’ needs).
2.2. E-Skills: Importance for Sustainability and Trends
In order to obtain a performance and a competitive advantage, sustainable organizations must attract, acquire, motivate, and maintain the skilled and talented people who bring performance into the organizations. Better skilled employees mean better performance. Knowledge is a strategic resource and it is sustainable because it is not easy to imitate or copy [
35] (p 161). Thus, these employees must possess skills, competencies, experience, and knowledge bringing improved products and results for their organizations, employees, and customers. The following are among the most wanted skills: essential and occupational skills, cross-disciplinary skills, cognitive skills, problem solving skills, communication skills, foreign languages, and computer skills. Information and communication technology (ICT) skills or e-skills enable an employee to actively participate in a challenging new Knowledge-economy, by using new technologies and e-communication techniques (e-mail, e-conferences, Internet, intranet, databases, and websites).
There are four types of e-skills [
36] (p 47) as follows:
ICT practitioner skills, i.e., the capabilities required for researching, developing, designing, managing, producing, consulting, marketing, selling, integrating, installing, administrating, maintaining, supporting and servicing ICT systems;
ICT user skills, i.e., the capabilities required for the effective application of ICT systems and devices by the individual;
E-Business skills, i.e., the capabilities needed to exploit opportunities provided by ICT to explore possibilities for new ways of conducting business and organizational processes, and to establish new business;
E-Literacy, i.e., the capabilities needed for socially appropriate ICT for local development.
Hiring requires criteria beyond any real change in the skills necessary to perform productively [
37] (p 116). E-skills usually refer to a broad set of skills necessary in the modern workplace [
38] (p 807). The Commission of the European Communities (2007) extended this definition stating that e-skills represent a set of skills, knowledge, and concepts that are needed for effective consumption in terms of accessing, locating, operating, managing, understanding, and evaluating e-services provided in different stages of e-government. There are five levels of e-skills [
39] as follows:
A basic level of e-skills is close to ICT user skills and employees who possess these e-skills can use generic tools such as Word, Excel, Outlook, and PowerPoint for basic tasks.
A middle level of e-skills is represented by employees who are practitioners that have the ability to research, develop, design, plan, manage, produce, integrate, support, and service ICT systems.
An ICT specialist includes employees who have the ability to use advanced IT tools to develop, operate, repair, maintain, and create ICT systems.
The E-leadership skills level includes employees who have the ability to exploit opportunities provided by ICT and are expected to ensure effective performance.
ICT professionalism skills represent the highest level of e-skills. These employees have comprehensive and up-to-date knowledge, accommodating a common ICT body of knowledge and skills. They possess a combination of qualifications, certifications, work experience, non-formal and informal learning, as well as can offer high-quality products and services.
Achieving e-skills is not an isolated process but it is tightly linked to the highest national development policies or internationally accepted obligations. E-skills offer some benefits: sharing knowledge, collaborating, using software and learning from others, having fun, being creative, making friends, as well as practical and generally positive skills. In 2003, the European e-Skills Forum was established by the European Commission to promote the effective use of ICT and its successful introduction in all major areas of human activity, especially in the business and industrial sectors.
The need for ICT-related skills (e-skills) has been recognized in 2002 at the European e-Skills Summit. At the 2004 Forum, e-skills were divided into the following three categories: ICT practitioner skills, ICT user skills and e-business skills, which offer the opportunity to exploit the Internet and to ensure effective performance [
40] (p 66).
Statistical research on the population has been carried out based on the specific activities related to computer and Internet usage.
The following information is provided to better analyze and compare the evolution of e-skills:
The e-skills of the population [
40] (p 53):
about 50% of the population have basic skills;
50% know how to copy and paste tools (in Iceland and Denmark about 65% of the population knows how to do this; and for Latvia, Poland, and Lithuania 30% to 33% know these skills);
4 in 10 know how to send e-mails with attachments (in Iceland the share is 68%);
the average level of the way of training e-skills is 28% for EU27; countries such Iceland (51%), Sweden (40%), UK (38%), Estonia and Cyprus (36%), Luxemburg (35%), Latvia (34%), Lithuania (33%), Belgium, Denmark, and France (32%), and Hungary (31%) are over this average, but countries such as Bulgaria and Spain (20%), Romania (17%), and Italy (16%) are under this average [
41].
The individuals’ level of computer skills [
22]:
Countries such as Luxemburg (83%), Norway (82%), Iceland (80%), Denmark (75%), Germany (74%), and France (73%) have the level of computer skills over the average of the EU27, and Romania (27%) is far from this average (64%).
The individuals’ level of Internet skills:
Countries such as Iceland (93%), Denmark and Netherlands (92%), and Luxemburg and Norway (91%) have the level of Internet skills much above the average of the EU27, but Romania (50%) is again below the average of the EU27 (75%).
The individuals’ frequency of Internet use:
Countries such as Norway (98%), Iceland (97%), Netherlands and Luxemburg (96%), Denmark and Estonia (95%), and Belgium and Hungary (90%) are above the average of the EU27 (87%), but again Romania is much below this average (61%).
The employees’ level of Internet access in 2014:
The average of the EU27 was 99%, and the majority of countries had over 97% (Denmark, France, Lithuania, Luxemburg, Netherlands and Finland had 100%, and Germany, Czech Republic, Ireland, Spain, Italy, Cyprus, Latvia and Portugal had 99%, Hungary and Malta have 97%, only Romania has 92%.
The enterprises’ level of Internet access:
In 2008, the EU27 average was 93%; countries such as Finland (100%), Slovenia and Netherlands (99%), Austria (98%), and Estonia (97%) were above the EU average, but Romania had 67%, which was much below this average [
22].
2.3. The Evolution of E-Activities in the Globalized World
Due to the continuous changing work environment, market liberalization and internationalization, as well as globalization which bring technology in foreground [
42] (p.51), organizations use more and more e-communication and employees’ e-skills in order to satisfy stakeholders’ needs. Human capital is a central pillar of growth and productivity, thus, investing in people and skills is a vital topic for policy makers and enterprises, and therefore the share of the labor force with ICT skills has been steadily growing. Adapting education and training systems for a knowledge society is a crucial issue as a means to reduce the digital divide. The diffusion and use of ICT modify employment, work, and skill patterns. ICT usage fosters lifelong learning and enables workforce mobility. Any field effectiveness depends mainly on the skills of employees facing a challenging environment. Modernization has imposed the use of new information and communication technologies (ICT) and these have led to new demands regarding the skills of employees, especially in activities such as e-banking, e-booking, e-communication (using e-mailing), e-recruitment, e-government, e-commerce, e-development, and e-information.
2.3.1. E-Banking
E-banking is defined as web-based banking which involves individual and corporate clients and includes many online services for them [
43] (p 2). One characteristic of e-banking is the sheer speed of new technological developments along with a high pace of competition and changing customer preferences. In order to be the first on the market, a bank must anticipate trends to be able to respond to competitors and gain a competitive advantage [
44] (p 237).
The data on online banking penetration in European countries shows that, in 2018, 89% of the Danish population, the Netherlands, and Finland were the strongest European countries with the greatest online banking penetration in the EU28, with Romania and Bulgaria being the last ones with 7% who had accessed online banking sites.
2.3.2. E-Commerce
E-commerce refers to the use of electronic means and technologies, such as the sale, purchase, transfer, or exchange of products and services or information [
45]. E-commerce means making business transactions using the Internet [
46] (p 506) and is more than just retail, i.e., it is about production, advertising, sale, and distribution using telecommunication networks [
47] (p 2). This process connects consumers who are online and mobile, and communities on the electronic platforms, which have become an integral part of their life [
48] (p 731). The Internet offers opportunities and a great potential for small enterprises, but also for developing countries [
49].
In 2018, in the EU28, the percentage of enterprises making e-sales ranged from 11% (Bulgaria and Greece) to 30% to 39% (Ireland, Denmark, Sweden, Belgium, and Czechia) [
50]. During 2018, 43% of large enterprises conducted e-sales, having an e-sales value of 25% of the total turnover in this size class; 28% of medium sized enterprises made e-sales generating 14% of the total turnover in this size class; and 18% of small enterprises were generating 8% of the turnover of such enterprises [
42]. During 2018, 14% of EU enterprises conducted e-sales using only websites or apps, 3% used only EDI-type sales, while another 3% used both [
51]. Web sales were the dominant mode of conducting e-sales in all the EU28, in 2018. The percentage of enterprises receiving electronic orders only over websites or apps ranged from 22% in Ireland to 9% in Greece and Romania [
52]. The percentage of enterprises that had e-sales increased by seven percentage points, from 13%, in 2008, to 20% in 2018, and the turnover for the same period from 12% to 18% [
53].
2.3.3. E-Recruitment
The Internet has changed the way of searching for a vacancy [
54] (p 114). Doran A. said in 2001 that almost all recruiting is done on the web. The online job market increased faster than the traditional recruitment market, growing from 82% in 2004 [
46], to approximately 100% in 2006 [
55] (p 63). Today, almost all activities are completed online. With the use of online recruitment ads, the recruitment costs have been reduced by 85% [
56], thus, becoming sustainable. Until 2005, according to a survey, large organizations used e-recruiting systems between 70% and 90%, and it is anticipated that over 95% of organizations plan to use them in the near future [
57]. E-recruitment offers many advantages such as rapid access, winning time, lower costs, 24/7/365, broad range of applicants, and worldwide accessibility [
4].
As we observed at the EU28 level, in 2017, the percentage of individuals using the Internet to look for a job or send a job application was 17%, and in 2018, it was 18%; Finland (29%), Sweden (27%), Netherlands (25%), Denmark (24%) were sited as being in the top positions, and Romania (8%), Bulgaria (7%), and Czechia (5%) were in the lowest positions [
22].
2.3.4. E-Communication by Using E-Information and E-Mmailing
With Internet development, a new way of communicating entered the new cybernetic space, i.e., communication through e-mail which supposes information exchange and depends on the one using it, the program used, the moment of transmitting and receiving, and the answers given [
24].
Some people use other languages and grammar suffers [
23] (p 1) in order to reduce the time for writing, calling it the phenomenon of ”ne-etiquette” [
58] (p 15). According to international statistics, in January 2017, the number of e-mails sent daily was 269 billion and, in 2019, there were 306.4 billion; the number of e-mail users worldwide in the same year was 2.67 billion, and in 2018 it was 3.8 billion [
51]. E-mail has had an important influence on the workplace since the late 1990s. Some of the effects of this type of communication were positive at work, and others reduced the benefits of face-to-face communication. At the EU28 level, we observed that 71% of individuals between 16 and 74 years old used the Internet to send and receive e-mails; and in countries such as Denmark (93%), Louxemburg (93%), Norway (92%), Netherlands (90%), Sweden (88%), and Romania was in the final place with 42% [
51]. As a result of using e-mail communication, the paper consumption was lower, thus, making organizations more responsible.
2.3.5. E-Development
E-development is clearly a product of more general development. E-development solutions can be costly, with a high failure rate but with important results, i.e., achieving better productivity, efficiency, and quality of life; staying attractive, competitive, and innovative [
59]; having better relationships with customers; and having better trade and delivery of services. E-development uses the Internet or Intranet [
60] to receive guidance and new knowledge; to improve sharing and a two-way development as a win-win situation; or to use simulation in order to improve future performance [
61] (p 229). Better results for employees and organizations with better development and training has made organizations sustainable.
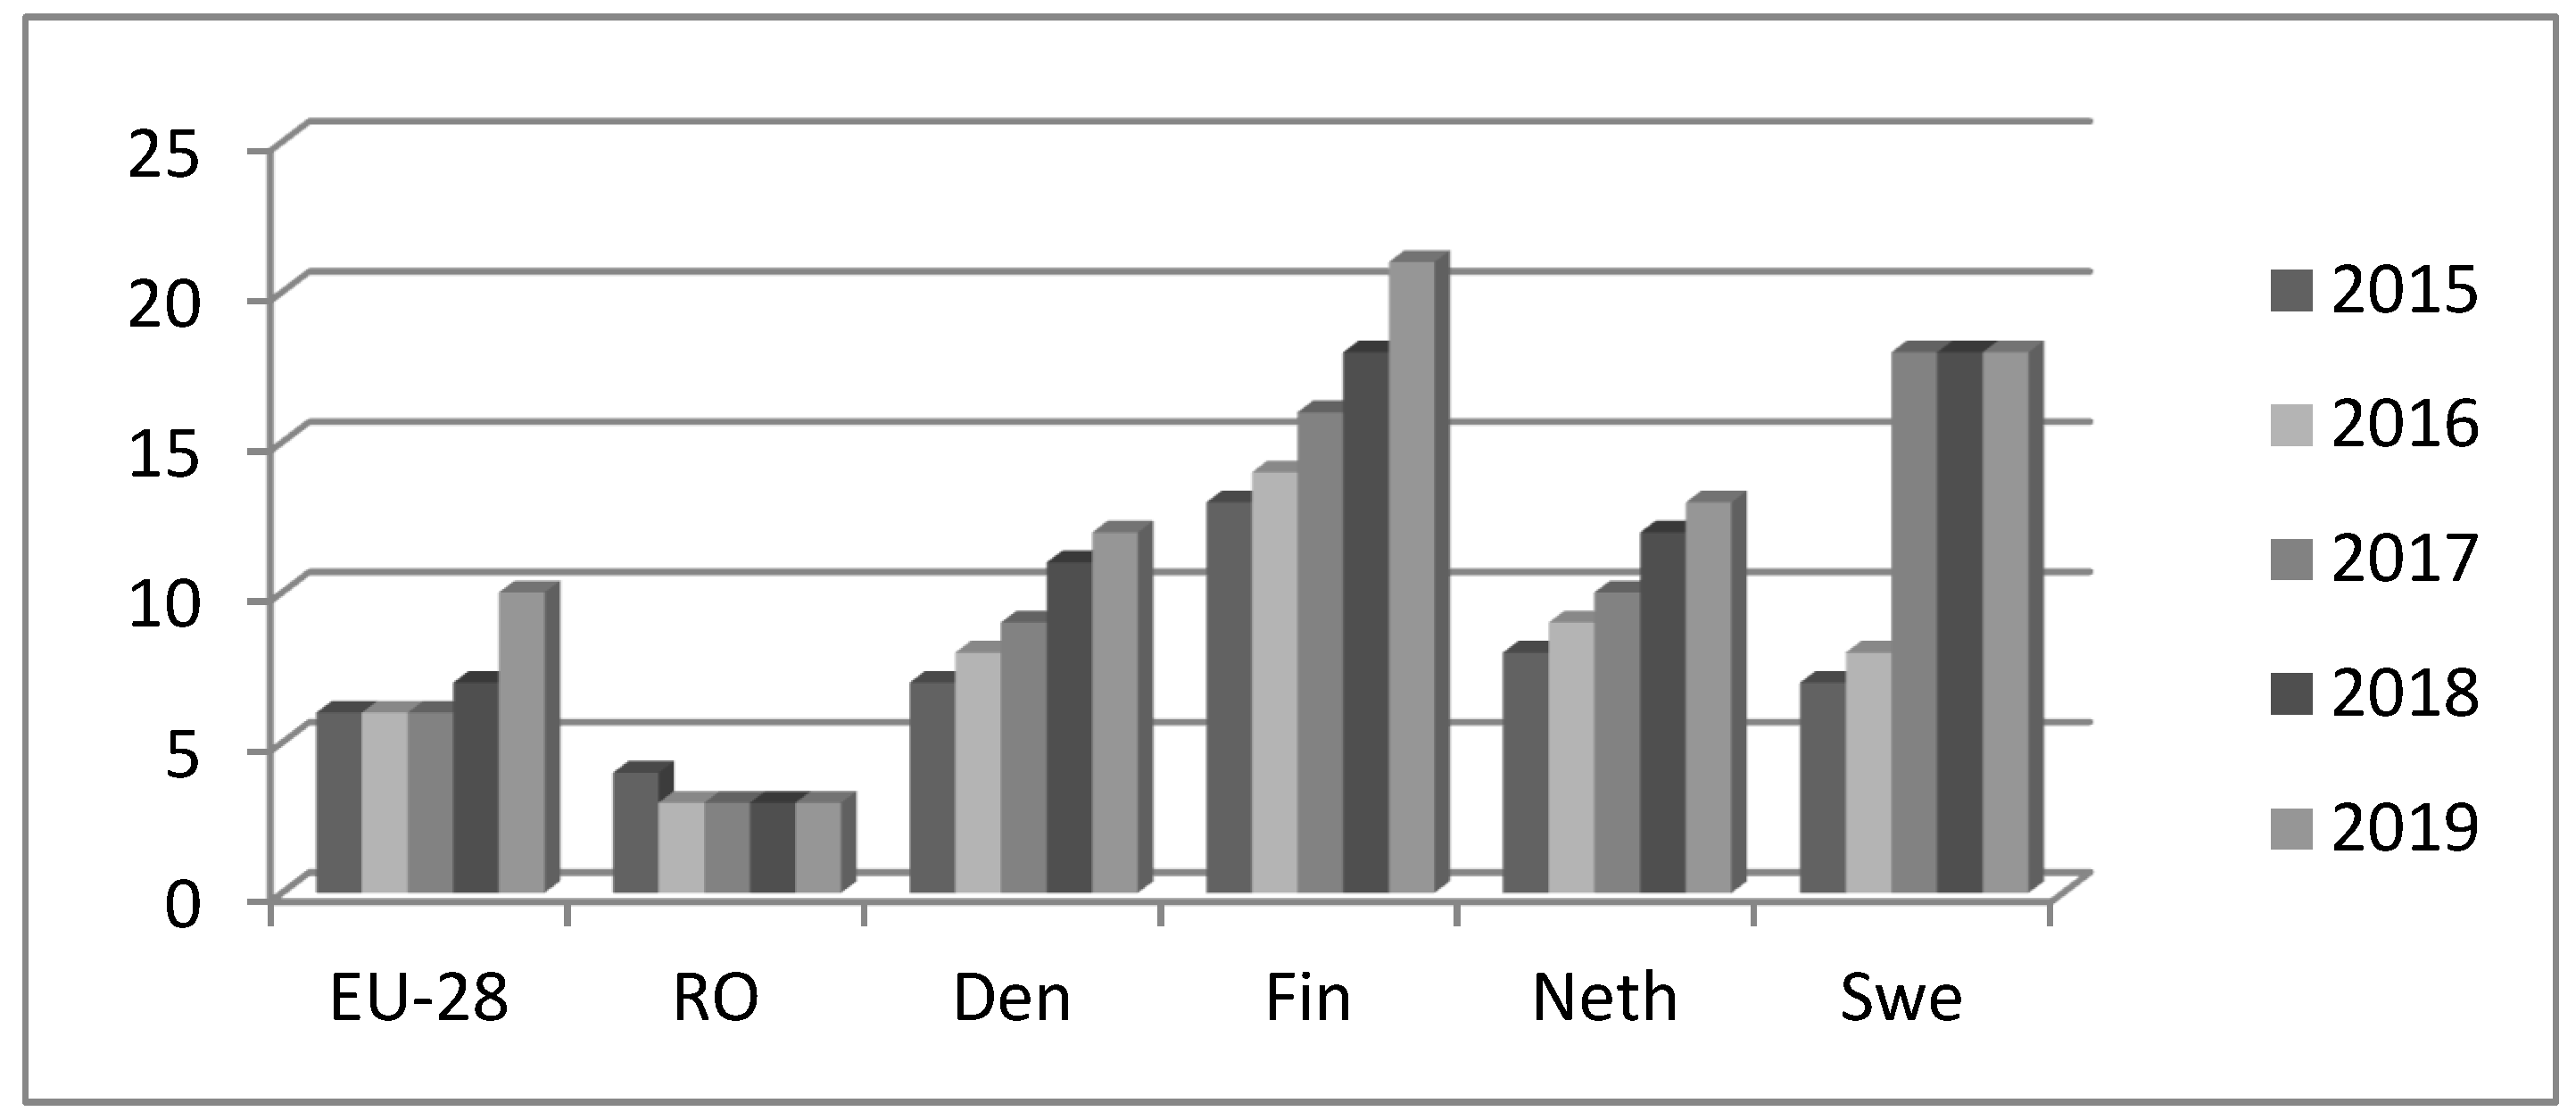
The data recorded at the EU28, in 2019, show that individuals use the Internet to do an online course (considered the e-development activities) as follows:
The average of using e-development activities is at EU28 with a level of 10;
Finland level 21, UK level 19, Spain level 15, Estonia level 14, Netherlands level 13, Denmark level 12, are the leaders in using training and education via the Internet;
The lowest rate of individuals using the Internet for this purpose is found in Croatia having a level 5, Latvia level 4, Romania level 3, and Bulgaria had a level 2 [
62].
3. Research Methodology
Many factors influence the e-activities, such as the degree of ICT adoption or the nature of the used networks [
63] as the skills necessary for sustainable human capital, proven by the fact that many processes were influenced by the use of the Internet. However, none of the studied articles analyzed the relationships between the described e-skills and e-activities, especially between countries, by years or against the best-in-class. The data on these processes were extracted from the European level (from the official site of Eurostat.com for Science, technology and digital society Internet use) presented between 2015 and 2019. The main objective was to show the relationship between e-skills and e-activities based on the principle that by having e-skills, the employees from the new e-work age will achieve sustainable performance in e-activities, such as e-recruitment, e-development, e-communication, e-banking, and e-commerce. Moreover, due to the fact that these e-activities are influenced by the detained level of e-skills, the correlation function was chosen, in order to measure the impact of e-skills on the analyzed e-activities. The analysis started from the comparison by years between Romania and the average of the EU28 countries and the best-in-class group (formed by the four European countries which repeatedly got the highest values on e-activities on years). With the use of benchmarking, the difference between Romania and the EU28 level was determined, as well as the best-in-class, making reference to e-skills and e-activities. Thus, among the best-in-class, the following countries were selected: Denmark, Finland, Netherlands, and Sweden.
Some research hypotheses were established as follows:
Hypothesis 1 (H1). There are differences between the described variables, compared by countries and by years.
Hypothesis 2 (H2). There is a correlation between e-skills and the considered e-activities.
There is an increase in using modeling [
64] (p 399), forecasting and simulation [
65] (p.139), which are important for any organizations, no matter the size or the field, and it is based on using past data, in order to see a possible future which will help to observe the risks or the factors which influence the analyzed variables.
In our research, the data from the EU28 level are used and the variables are the following: y, individuals level of digital skills (e-skills); X1, individuals sending and receiving e-mails (e-mailing); X2, individuals using the Internet to find information about goods and services (e-commerce); X3, individuals using the Internet for internet banking (e-banking); X4, individuals using the Internet to look for a job app (e-recruitment); X5, individuals using the Internet to do an online course (e-development).
In order to achieve the objective and to test the research hypotheses, trend analysis for the analyzed three zones, and correlation matrix in combination with Excel data analysis are used.
5. Discussion and Conclusions
This paper evaluates the differences between e-skills and e-activities between Romania and the EU28 level and the best-in-class group and analyzes the correlations between e-skills and e-activities among the three presented zones. The findings showed that by using simulation and a mathematical function and Excel data analysis, the specialists could observe a more comprehensive image of the data regarding the impact of e-skills on e-activities (as mentioned above). The research highlighted the existence of important differences between the three analyzed zones at the level of e-activities. The empirical results showed that there is a positive and very strong relationship between the analyzed variables. The results obtained could be important and of real use for specialists in the field, the economy as a whole, and for organizations as well as their employees. The simulation allowed us to see the correlation between the analyzed variables and describe the impact it could have on different EU zones. The model was based on a set of data collected between 2015 and 2019, for three zones, outlining the negative or positive, strong, moderate, or weak correlations between e-skills and e-activities, developed in the new digitized world.
By implementing simulation and modeling, any organization can improve its performance and become sustainable. The benefits of the two processes can be brought into organizations, including the opportunity to work in teams, to work in a virtual world with real results, to analyze real data and behaviors, to observe future simulated data and behaviors, to help identify problems and find timely solutions, to help develop future improvement plans (in our case, to increase the level of e-skills in order to improve e-activities, due to great value of relation), to help achieve objectives and offer results which help forecast changes and challenges, and to forecast performance by determining some possible events, which are easy to implement, modify and test, without risks and costs.
As a result of the analysis of the data presented in the tables above, the following characteristics for each analyzed e-activity are observed:
For e-skills, the values for e-skills are above average for the EU28 countries (58 in 2019), for Romania, the value is much below the average (31 in 2019), although it follows a positive and increasing trend. For the best-in-class group, an increased trend is observed (values between 70 and 79 for 2019).
For e-communication by e-mailing, it is observed that the number of sent e-mails is continuously increasing, but according to the table, the data from Romania show that, in 2019, the individuals using the Internet to send and receive e-mails (43) is much below the average for the EU28 countries (74), and much below the analyzed group (90–94).
For e-commerce, this activity is lower for Romania (33), in 2019, as compared with the average for the EU 28 level (68) and the values obtained for the analyzed group (83–89),
For e-banking, the average for the EU28 level is 58 (2019), for the four countries from the analyzed group it is between 84% and 91%, and Romania is in penultimate place with 8%,
For e-recruitment, in Romania, there are still lower values (6 in 2015, 8 in 2017, and 5 in 2019) as compared with the average values from the EU28 (17 in 2015 and 17 in 2019), and the analyzed group (values from 25 to 37 in 2019),
For e-development, Romania has values between 3 and 4 (2015 to 2019) as compared with the average of the EU28 (6 to 10 between 2015 and 2019), and the analyzed group between 12 and 21 (2015 to 2019) for e-development.
The analysis of the e-skill and e-activity indicators showed that for Romania the values were low as compared with those from the EU28 and from the best-in-class group. We observed low values compared with the values recorded in the group, the difference between them being important (for e-communication 43/94 and for e-skills 31/79) and very important (for e-recruitment 5/37, for e-development 3/21, for e-banking 8/91, for e-commerce 33/89), therefore, hypothesis H1 is completely fulfilled.
To achieve the objective, we also used the correlation between the analyzed variables and Excel data analysis in order to observe the differences among the three established zones for analysis, i.e. the EU28 level, Romania, and the best-in-class group.
The analysis of the correlation for the three analyzed zones showed the following:
at the EU28 level, there are positive and strong correlations among the analyzed variables, i.e., between 0.76 and 0.98.
at the Romanian level there are positive, as well as negative or inexistent values, showing a weak, moderate, or strong correlation among e-skills and e-activities. According to the calculation, the least used e-activities in Romania are e-recruitment (having a weak correlation with the e-skills) and e-development (−0.83).
at the level group, most correlations are high and very high, with the exception of Denmark, although their indicators are high enough as compared with other European countries or the European average.
Analyzing the correlations between e-skills and e-activities, we found that at the EU28 level, there are only strong and positive correlations (between 0.76 and 0.98); at the best-in-class level there are some weak (between −0.78 and -0.01) or average, and most are strong and very strong correlations (till 0.97); and at the Romanian level there are one very weak correlation (−0.81), one weak correlation (−0.29), one nonexistent (0), one average correlation (0.64), and another very strong correlation (0.91). At the Romanian level the correlations are between −1 and +1, and for the analyzed group, most are positive and strong. Thus, H2, i.e., there is a correlation between e-skills and e-activities, is not totally fulfilled because, again, Romania is showing an important gap which must be overcome by strong long-term planning and strong policy activity, as we mentioned above.
Based on this study, future work directions may be taken in consideration by integrating this relationship strength - between e-skills and e-activities - into other applications and not only in a EU zone or group of analysis and comparison, but to other zones, as international or global or other research fields.
Obtaining new e-skills helps achieve sustainable individual and organizational performance by implementing better interdisciplinary team work, to obtain lower costs, greater speed, greater interaction, connectivity, and collaboration, better learning and development, improved processes based on the principle anytime, anywhere, anyhow, and anyone, according to the principle 24/7/365.
A more thorough analysis could be made of each European area, of each European country, or of any situation considered to be important from a macroeconomic or microeconomic standpoint, drawing conclusions, making decisions in order to overcome difficult situations, risks or any problem which could affect the increasing trend of these new forms of digitized activities. This process would not try to replace the traditional processes, but improve them by developing new ways to solve problems, reduce costs, improve processes, achieve better collaboration and relationships, without any borders, anytime, and anywhere.

 ,
, 


