Article

The Assessment of Climate Change on Rainfall-Runoff Erosivity in the Chirchik–Akhangaran Basin, Uzbekistan

1
State Key Laboratory of Desert and Oasis Ecology, Xinjiang Institute of Ecology and Geography, Chinese Academy of Sciences, Urumqi 830011, China
2
University of Chinese Academy of Sciences, Beijing 100049, China
3
Key Laboratory of GIS & RS Application Xinjiang Uygur Autonomous Region, Urumqi 830011, China
4
Research Institute of Irrigation and Water Problems, Tashkent 100187, Uzbekistan
5
CAS Research Center for Ecology and Environment of Central Asia, Urumqi 830011, China
6
Institute of Geology, National Academy of Sciences of Kyrgyz Republic, Bishkek 720040, Kyrgyzstan
7
Regional State Enterprise Kazhydromet, Nur-Sultan (Astana) 010000, Kazakhstan
*
Author to whom correspondence should be addressed.
Sustainability 2020, 12(8), 3369; https://doi.org/10.3390/su12083369
Submission received: 23 March 2020 / Revised: 7 April 2020 / Accepted: 17 April 2020 / Published: 21 April 2020
(This article belongs to the Special Issue Soil Erosion and the Sustainable Management of the Landscape)

Abstract

:
Changes in the frequency or intensity of rainfall due to climate always affect the conservation of soil resources, which leads to land degradation. The importance of assessing past and future climate differences plays an important role in future planning in relation to climate change. The spatiotemporal variability of erosivity depending on precipitation using the rainfall erosivity (R) of Universal Soil Loss Equation under the global circulation model (GCM) scenarios in the Chirchik–Akhangaran Basin (CHAB), which is in the northeastern part of the Republic of Uzbekistan, was statistically downscaled by using the delta method in Representative Concentration Pathways (RCPs) 4.5 and 8.5 during the periods of the 2030s, 2050s and 2070s. The (R) was used to determine the erosivity of precipitation, and the Revised Universal Soil Loss Equation (RUSLE) itself determined the effects of changes in erosivity. Ten weather station observational data points for the period from 1990 to 2016 were used to validate the global circulation models (GCMs) and erosion model. The assessment results showed an increase in precipitation from the baseline by an average of 11.8%, 14.1% and 16.3% for all models by 2030, 2050 and 2070, respectively, while at the same time, soil loss increased in parallel with precipitation by 17.1%, 20.5 % and 23.3%, respectively, in certain scenarios. The highest rainfall was observed for the models ACCESS1–3 and CanESM2 on both RCPs and periods, while more intense rainfall was the main reason for the increase in the spatial and temporal erosion activity of the rainfall-runoff. This study is a useful reference for improving soil conservation, preventing water erosion and ensuring the future sustainability of agricultural products, as well as improving the operational management and planning of agriculture.

1. Introduction

With the advent of agriculture, the value of soil has increased dramatically in people’s lives, since land resources are one of the main bases and non-renewable resources for human development [1]. All food and many other means necessary for a person are produced directly or indirectly from the soil. The existing layer of soil has changed dramatically as a result of the societal development.
The acceleration of erosion as a result of human activities has caused anthropogenic impacts on soil [2]; nearly 36 billion tons of soil are eroded each year [3], which is facilitated by deforestation and land misuse. The regions most affected by soil erosion are Africa, and Southeast Asia, particularly China, South America, and Brazil [3]. The reasons for this are deforestation and the spread of arable land for agricultural use, and all of them are human-induced factors. Erosion is the natural process that has the greatest environmental impact, and it is the main trigger for desertification worldwide [4]. Soil erosion gradually affects fertile soil directly through precipitation [5,6,7], and it has been recognized as a serious and global environmental problem [8], which threatens not only the productivity of agriculture but also the general tenacity of the human world. The restoration of the fertile soil layer is costly and time-consuming [7,9,10], especially, in arid and semiarid zones as well as in agricultural crops [11,12,13]. Additionally, accelerated erosion in soils mainly appears in two forms: natural (e.g., through rain and wind changes) and artificial (e.g., through excessive grazing and domestic demand) [14]. Therefore, potential soil erosion varies depending on local climatic conditions [15], soil types and their properties, land-use practices and changes in the operations performed under these conditions. Erosion is primarily associated with the effects of water and wind; however, only water (rain) erosion is simulated and discussed in this study. Erosion caused by water leads to the loss of the fertile soil layer [16]. As the intensity and duration of precipitation increases, the conditions lead to a higher potential level of erosion. Although precipitation seriously affects erosion, temperature also indirectly affects soil erosion [9,17,18]. Without measuring the temperature, the climate cannot be characterized since the climate affected by both the temperature and the addition of water vapor, which changes the intensity and frequency of extreme precipitation [19].
Even though soil erosion seriously affects agriculture and its economy, in the study area, very few studies have been conducted to assess the spatial dynamics of erosion [14,20] and the impacts of climate change on erosion. Understanding past and future variations in rainfall activity and assessing the risk of soil erosion are important for planning measures to stabilize the soil after changes in nature occur [21]. Moreover, climate change in the countries of Central Asia has led to large catastrophes, i.e., the glacier reductions in the Tien Shan Mountain systems [22,23] and Pamir Alay [24,25] in the south and the drying of one of the largest seas in the world (the 4th largest worldwide)—the Aral Sea [26,27]. Therefore, a qualitative assessment of the impact of climate change and the trends of rainfall-runoff in the past and future is of great importance in the foothills under climate change conditions in the Chirchik–Akhangaran Basin (CHAB) located in the Tashkent region of Uzbekistan. Thus, the goal of this article is to assess the nature of the spatial and temporal variability of erosivity depending on precipitation using the global circulation models (GCMs) of Coupled Model Intercomparing Project Phase 5 (CMIP 5) 4.5 and 8.5.

2. Materials and Methods
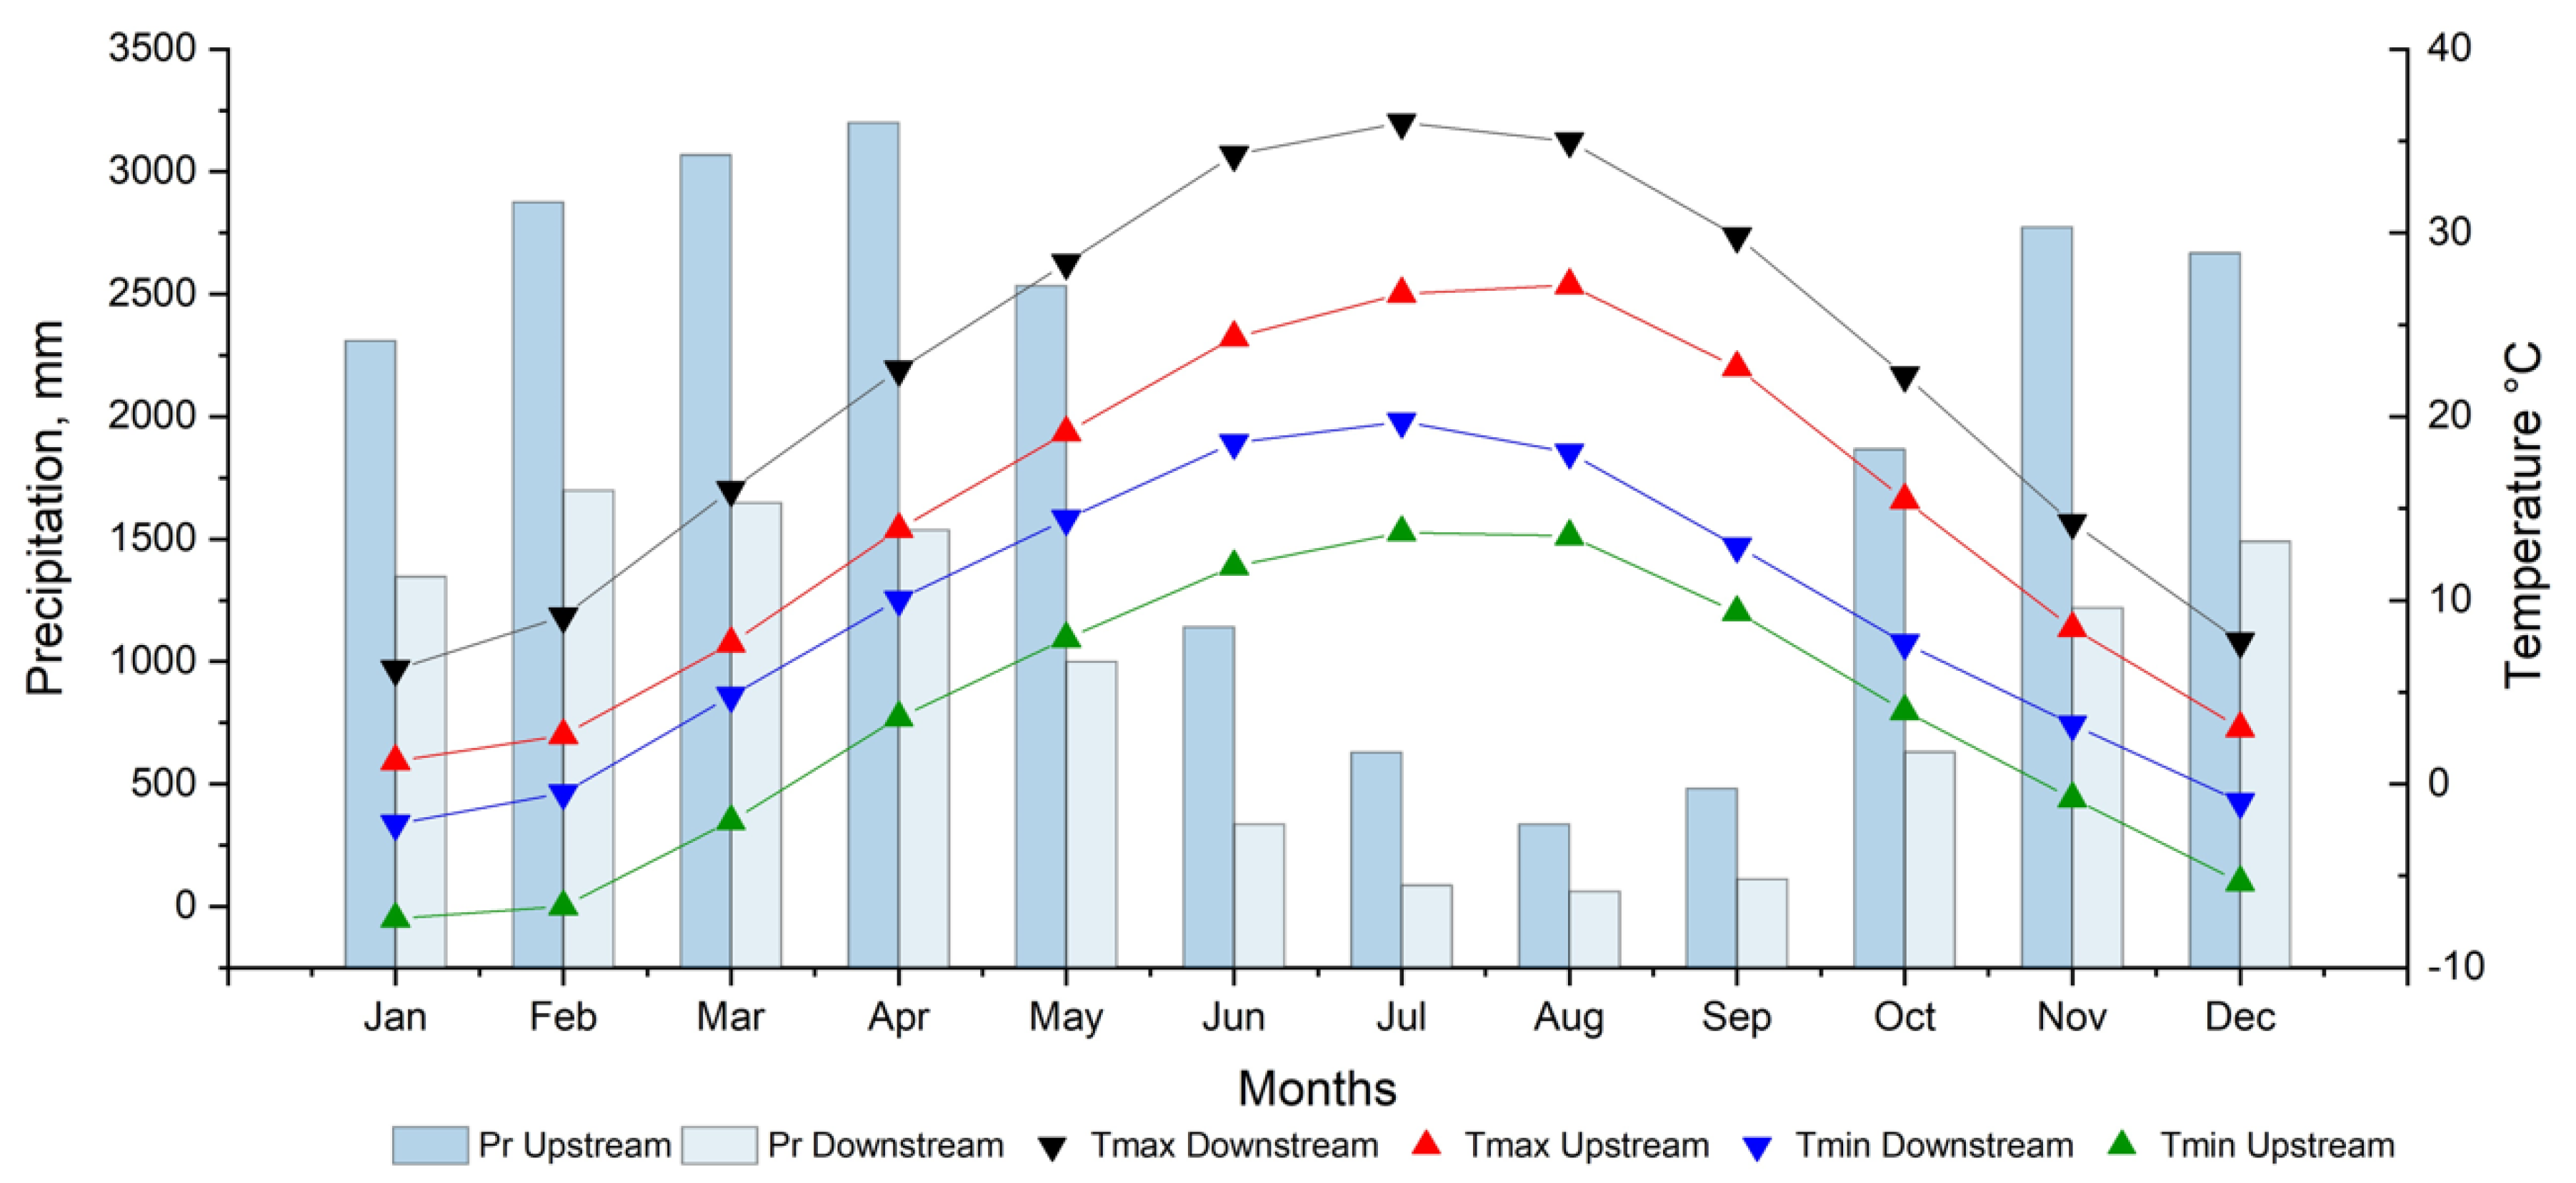
2.1. Study Area

The study area shown in Figure 1 is located at 41°10’00 “N. 69°45’00” E in the north-eastern part of the Republic of Uzbekistan between the western part of the Tien Shan Mountains and the Syr-Darya River. The region borders the Republic of Kyrgyzstan to the northeast, the Republic of Kazakhstan to the northwest, the Namangan region of Uzbekistan to the east, the Republic of Tajikistan to the south and with the Syr-Darya region of Uzbekistan to the southwest. The highest point of the Chirchik—Akhangaran district—the Beshtar peak (4299 m)—is located on the Pskem ridge, which extends between the valleys of the Pskem and Chatkal rivers. Complex relief is determined by features of regional soil-climatic zoning, such as its latitudinal and vertical distribution [28]. From the northeast to the southwest, towards the Syr-Darya River, the relief gradually decreases. As we mentioned above, the study area covers the Chatkal (Republic of Kyrgyzstan) and Ugam (Republic of Kazakhstan) Rivers, since the formation of water resources begins at the Chatkal and Pskem ranges (Figure 1b). Based on this, the total area of the study area is 22120.9 thousand km2.
The soils in the CHAB physical-geographical region are diverse, depend on the soil-forming rocks, and are displayed based on geomorphologic zoning [29]. Soil-geomorphological regions are made up of each belt of soil types and subtypes. In the territory of the basin, light brown meadow-steppe soils, mountain brown soils, and gray earth types of soils are identified [30]. Intense and heavy rainfall in the investigated area creates appropriate environmental conditions for the luxurious growth of vegetation [31]. Chirchik–Akhangaran valley vegetation including various herbs: feather grassy, fescue, mallow. It also includes shrubs and trees: almonds, hawthorn, barberry, juniper, maple, wild cherry, nuts, wild apple trees, cherry plums, poplar, willow, birch, spruce, etc. Where light and typical gray soils are developed, ephemerals and ephemerids predominately grow, e.g., bulbous, couch-grass, mountain plum bitter almonds. The main branches of agriculture are cotton growing, horticulture, grape gardening, silkworm breeding and non-rain farming (mainly wheat and barley)—in the foothills of the mountains [32].
The climate in the Chirchik–Akhangaran valley is heterogeneous and is typically semiarid and arid with a strong increase in both precipitation and temperature from the mountains to the plains from the north to south. Considerable impacts are induced by cyclones, humid western air masses, and cold northern air masses, thus causing a lower air temperature and a decline in precipitation. The amount of precipitation in the CHAB (Figure 1) is distributed unevenly, with more rain in the northeast and in the region closer to the mountains [33]; even more precipitation falls in the mountains. The minimum amount of precipitation falls in the southwest of the district and amounts to 250–300 mm per year; in the foothill northeastern part, the precipitation reaches 550 mm. In the western part of the mountains, where the air masses experience a forced rise and as a result lead to cooling and reaching a saturation state, as a result of the orographic increase in precipitation [34], the precipitation intensity reaches up to 3000 mm. The average January temperature is from −1.3 °C, to −1.8 °C, the lowest temperature is from −34 °C (the plane,) to −38 °C (mountain peaks), and the average July temperature on the plain is +26.8 °C. In the mountainous part, it is cooler, more humid and the temperature is +20 °С; in contrast, the highest air temperature in summer in the plains reaches +47 °C, and it is much cooler in the mountains [35]. During intense rains, the streams expand their channels and merge in the valley.
Figure 2 shows the average values of multiple measured-based climate data of mean monthly precipitation and maximum and minimum temperature in various elevation zones in the basin under consideration during the 1990–2016 time frame.
Monthly average observed precipitation and temperature changes in different zones in the study area based on the data were collected from the Center for Hydrometeorological Service of the Republic of Uzbekistan (UZHYMET), where the basin is divided into two parts: upstream and downstream, which is explained further using the second picture (Figure 2).
The analysis expressed in Figure 2, clarifies that in the upper stream river when the air masses cool down and reach saturation, in February-April, the orographic increase in precipitation reaches up to 3000 mm, (as occurred during 1990–2016). At the same time, in the downstream river, minimum precipitation reaches 60 mm, (as occurred during 1990–2016).
For all the climatic stations located above and below the river, the average monthly maximum temperatures during the period 1990–2016 were from +27 °C to +36 °C, however, in the summer season in the lower reaches of the river, the maximum temperature can reach +47 °C. The minimum temperature are mainly observed in the winter season and can reach up to −8 °C.

2.2. Data Set

All of the stations produced daily observed data during 1990–2016 that were collected from the Center for Hydrometeorological Service of the Republic of Uzbekistan (UZHYMET), with consideration of the basin. We divided the basin into two parts: upstream and downstream (Figure 2), to clarify where more precipitation falls. Pr Upstream and Pr Downstream indicate how the precipitation upstream and downstream of the river basin changed during the period of 1990–2016, respectively. Tmax Upstream, Tmax Downstream, Tmin Upstream, and Tmin Downstream correspond to the variability of the maximum and minimum temperatures upstream and downstream, respectively, of the investigation area during the 1990–2016period.
As sources of future meteorological data, we obtained daily precipitation outputs from 5 GCMs in the CMIP 5 archive. The study had three series of experiments for the future periods of the 2030s (2020–2039), 2050s (2040–2069) and 2070s (2060–2099). A GCM dataset was classified by using the CMIP5 model, and as the scenarios were employed, – RCP 4.5 and RCP 8.5 were statistically downscaled using the delta method (See Table 1). For assessment of the GCMs performance in the Chirchik River basin, we used historical data from 1975–2005 [36] and then interpolated, and the resulting data sets were used as input data. While RCP 4.5 involves the use of a number of technologies and strategies to reduce greenhouse gas emissions and stabilize radiation exposure until 2100 [37], the RCP 8.5 scenario characterizes an increase in greenhouse gas emissions over time due to high population growth and increasing energy demand [38]. According to Luo [39], in the GCM, various runs have a similar capacity to conduct climate projections focusing on Central Asia. All data sets were statistically reduced and resampled into 0.5 × 0.5 grids to unify their spatial resolutions [9,37].

2.3. Methodology and Parameter Estimation

2.3.1. Determination of Soil Erosion Rate

Annual soil loss due to precipitation is a common process in soils [40]. However, when compiling and updating soil maps, in order to better understand the consequences of changes in precipitation intensity and to quickly track, these changes, we selected and used a revised model of the Universal Soil Loss Equation (RUSLE) based on several criteria, as described in [41]:
A i , j = R i , j × L S i , j × K i , j × C i , j × P i , j
where: A—is the average annual potential soil erosion (tha−1 y−1) of the grid located at (i, j); R—is the factor of average rainfall erosivity, (MJ mm ha−1h−1yr−1); K—is the soil erosion compliance factor (Mg h−1MJ mm−1); and L and S are topographic factors that take into account the length and steepness of the slope, respectively [42]. The LS, C and P values are dimensionless.

2.3.2. Rainfall-Runoff Erosivity Factor (R)

When calculating the precipitation coefficient, the unit of the index is expressed as an indicator of the erosion force of a certain amount of precipitation. In this process, determining as a function of the volume of erosion over any period, a storm or a series of storms is calculated for the intensity and duration of precipitation [43]. However, due to the lack of a measuring station or the lack of data in remote regions, the regression Equations (2) and (3) between the coefficient R and the annual precipitation requires additional measurements of the parameters. Therefore, simplified methods were chosen that ensured the exceptional simplicity of studying the spatial and temporal variability of precipitation erosion. The rainfall activity data used to obtain the coefficient R are gridded GCM data precipitation from CMIP 5 archive [44].
R = 0.04830 P 1.61 ,   P < 850
R = 587.8 1.219 P + 0.004105 P 2 ,   P 850
where: R is the erosion index of rain; and P is the annual rainfall in mm. In two cases, it is recommended to use the following equation: if the annual precipitation < 850 mm, Equation (2) is used, otherwise, if the annual precipitation ≥ 850 mm, then Equation (3) is recommended. The factor R is in [MJ mm ha−1 h−1 yr−1].

2.3.3. Soil Erodibility Factor (K)

The soil erodibility coefficient (K), which reflects the rate of soil loss depending on the erosion flow (R factor), and calculated on the basis of soil textures [11], is an empirical measure of soil erosion [45,46] and represents the susceptibility of the soil to erosion [47,48]. The structure and permeability of the soil profile and organic matter are the main soil properties affecting K [46], and the value of K is characterized by the soil texture and permeability of organic compounds depending on the soil type [48] and is modeled with the aid of an equation. We deduced the value of K from the equation of EPIC as follows Equation (4) [48].
K = { 0.2 + 0.3 e x p [ 0.0256 S A N ( 1 S I L ) 100 ] } ( S I L C L A S I L ) 0.3 ( 1.0 0.25 C C + exp ( 3.72 2.95 C ) ( 1.0 0.7 S N I S N I + ( 5.51 + 22.9 S N I ) ) × 0.1317
The determination of the K-factor for soil, is given in Equation (4), and is based on its texture [11], representing the shares (%) of CLA (clay), SAN (sand) and SIL (silt), respectively, and this result explains the reason for the decrease in the K content in soils with a high content of organic carbon. Here, the value of K was converted from conventional US units to SI units by multiplying it by 0.1317 [48].

2.3.4. Slope Length and Steepness Factor LS

Calculating the slope length according to the digital elevation model (DEM) is a problematic process when modeling erosion. The need to calculate the length and slope of the site provides the most important value for the erosion estimator and depends on the parameters of the factors L and S in the equation, which are usually combined as LS [49], Equation (5) since the physical properties of the Earth have the greatest influence on the occurrence of erosion. To estimate the factor LS, Equations (6), and (7) [50] were applied using the Shuttle Radar Topography Mission (SRTM) with a resolution of 30 m provided by NASA.
L S = L × S
L i , j = ( A i , j i n + D 2 ) m + 1 A i . j i n m + 1 D m + 2 X i , j m ( 22.13 ) m
S i , j = { 10.8 sin β + 0.03 β < 15.838 ° 10.8 sin β 0.5 β 15.838 °

2.3.5. Cover Management Factor (C Factor)

Among all the risk factors for soil erosion, the C factor is an important indicator that helps preserve soil composition and reduce erosion [41,51]. The factor C, which is considered in the RUSLE model, was used as a factor that determines the vegetation, efficiency and productivity of soil cultures [52]. The calculation of factor C in this study and normalized difference vegetation index (NDVI) data provided by NASA [53] were used according to Equation (8).
C = e ( α ( ( N D V I ) / β N D V I ) )
where α and β are unitless parameters that determine the curve’s shape compared to the NDVI and the C-factor.

2.3.6. Conservation Practice (P Factor)

Factor P is an indicator of the surface conditions that affect the flow and the hydraulic system [54], and reflects the effectiveness of the practice of soil conservation, which promotes a decrease in the volume and speed of streaming water and helps reduce the rate of soil erosion [55]. In the study area, the P-factor was defined based on the studies of Wischmeier and Smith [41], and the values of P given in Table 2 were used on the basis of an analysis of the results in some studies in mountainous regions.

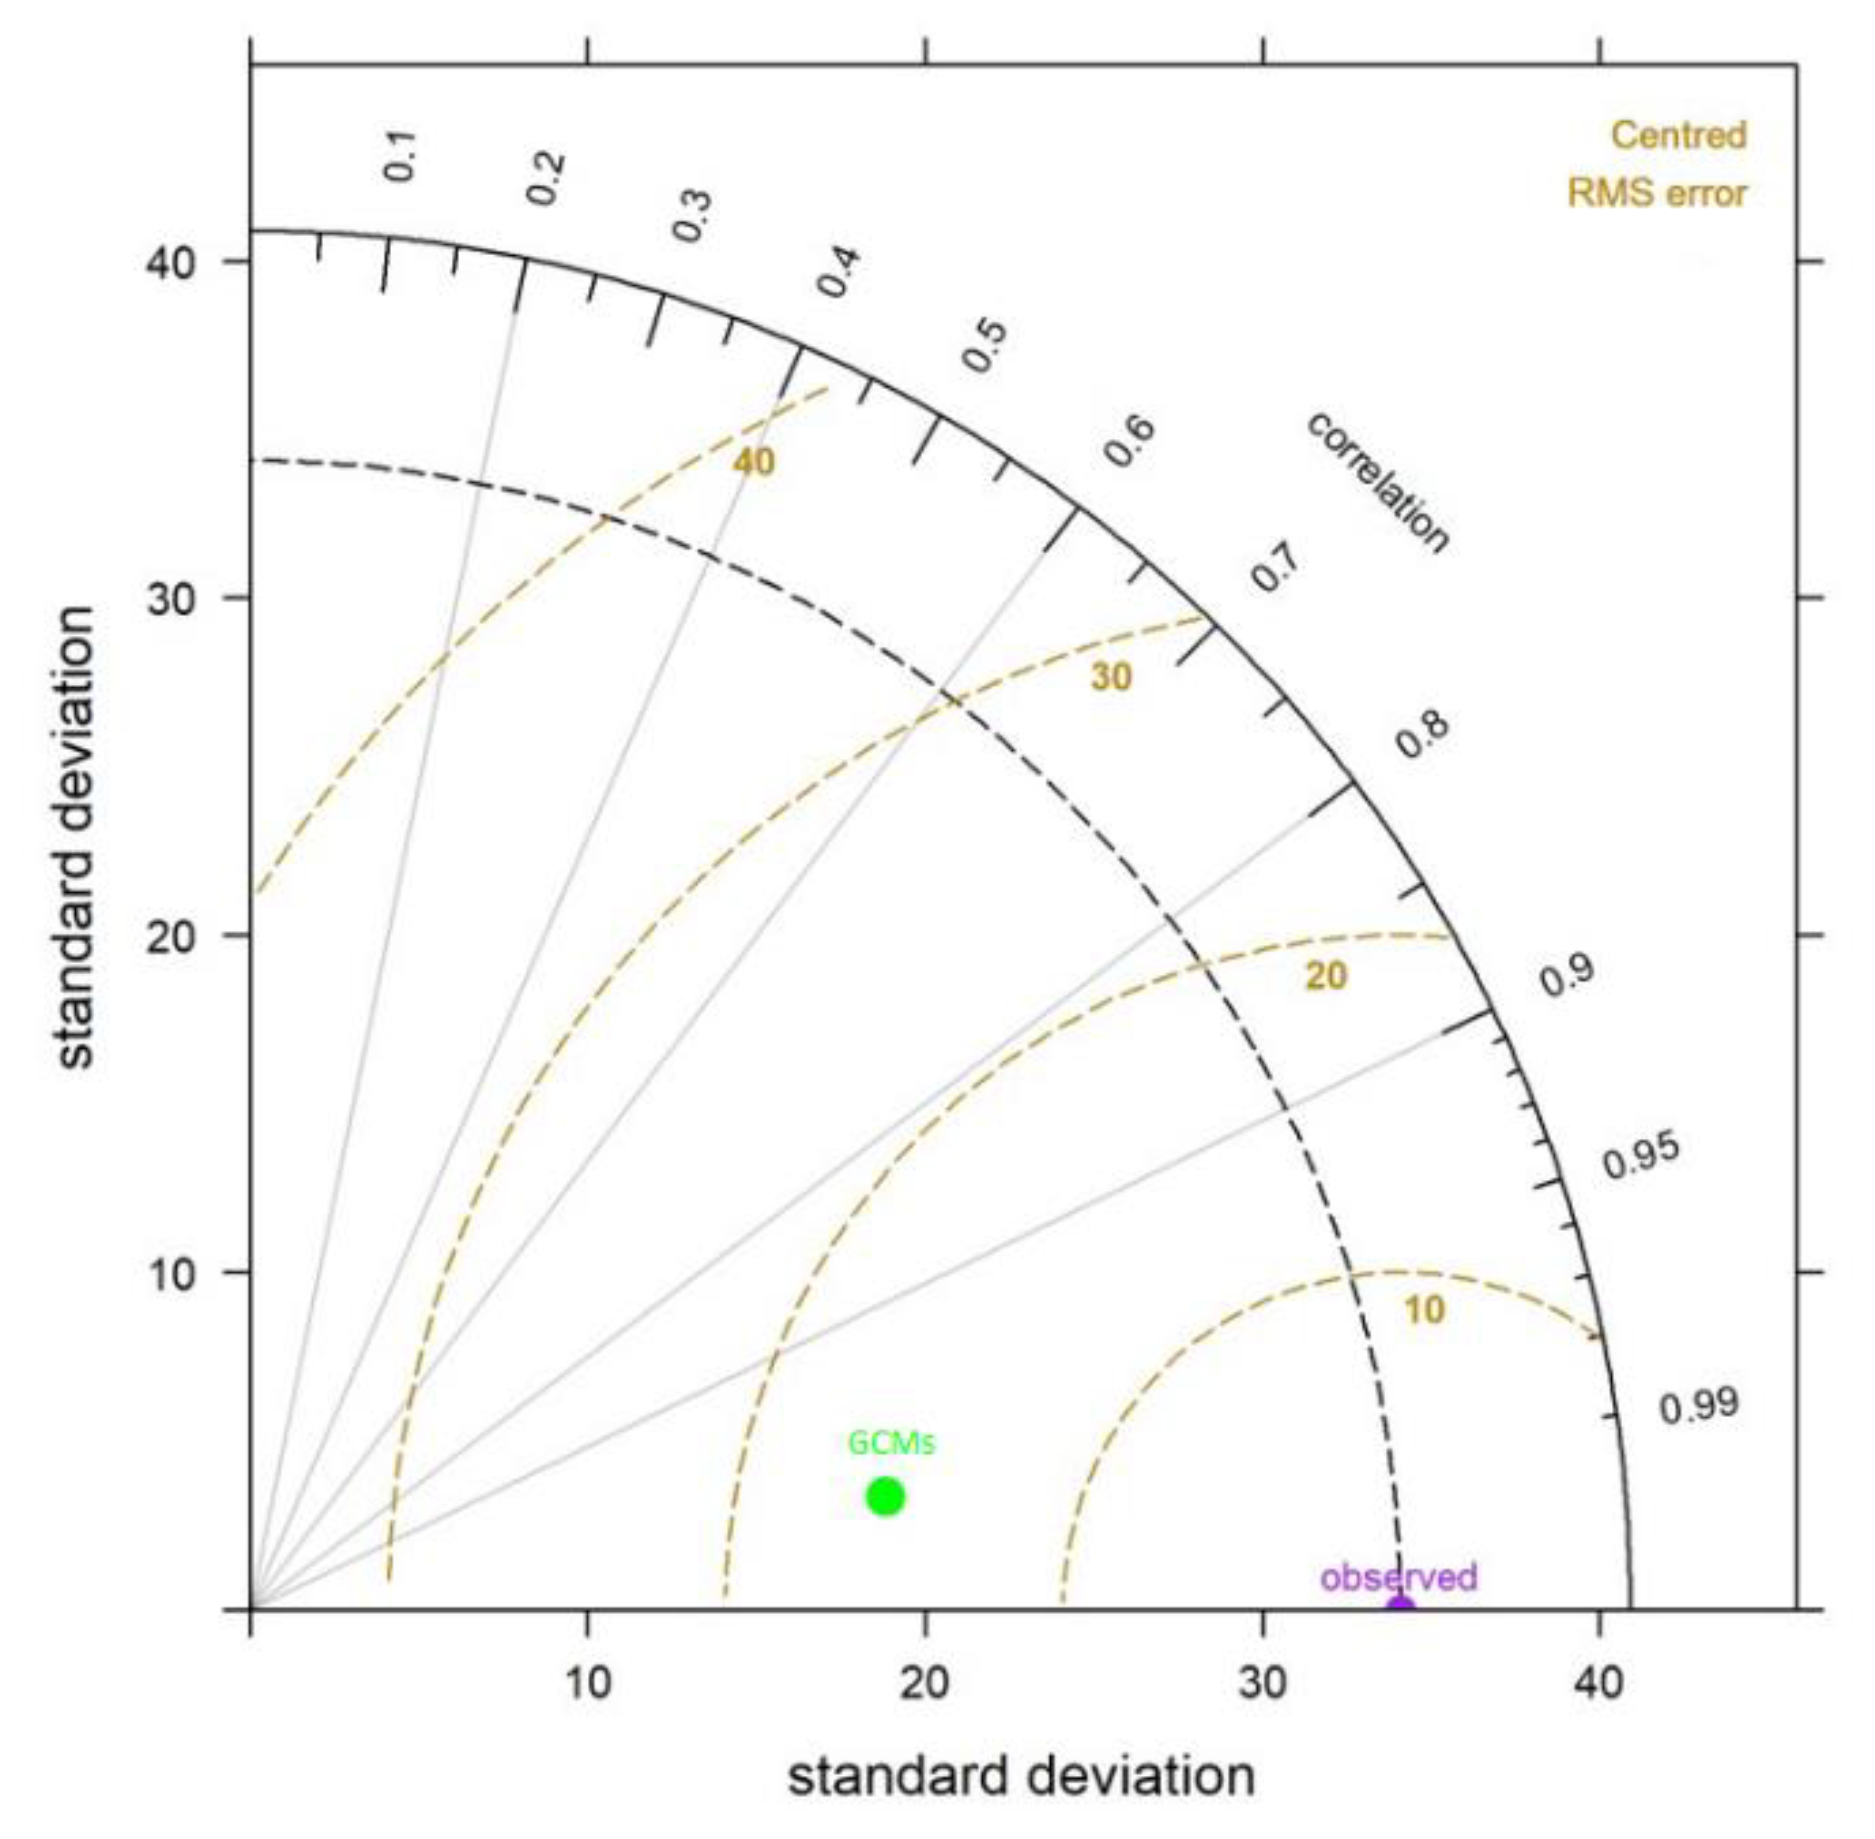
2.4. Model Validation

The validity of the derivation of R based on the data used was obtained from the mean monthly rainfall and average annual precipitation (1990–2016) from the daily data collected from the Center for Hydrometeorological Service of the Republic of Uzbekistan.
The validity of the model was evaluated statistically, through comparison using the baseline climate data (1975–2005) and observation data where the Taylor diagrams were used for comparison with the observational data for all 10 stations, when the correlation coefficient (CC) was approximately 0.98% (Figure 3). The treatment of the rainfall-runoff erosivity model was identified by comparing the R factors from the four factors of measures [56].

3. Results

3.1. Future Precipitation Change

In different periods, the rainfall frequency change for GCMs in the future was determined by baseline data, and all stations showed monthly average changes that were almost identical for RCP 4.5 and RCP 8.5 (Figure 4). In all the models, the precipitation mainly fell in winter and autumn; in general, this trend was stronger in RCP 4.5 than in RCP 8.5, except for at Tuyabuguz station (Figure 4i). Despite the decrease in rainfall activity in the summer period, July showed rain activity at all stations for both scenarios. In March, according to the RCP 4.5 scenario, the amount of precipitation at the Bekabad (Figure 4a) and Tuyabuguz (Figure 4i) stations begins to decline; at other stations, including the Chatkal (Figure 4b), Chimgan (Figure 4c), Oygaing (Figure 4d), Pskem (Figure 4e), Qizilcha (Figure 4f), Suqoq (Figure 4g) Tashkent (Figure 4h) and Yangiyul (Figure 4j), stations, recessions began in April. Despite the increase in rainfall intensity in winter at almost all stations in February, a significant decline in the average monthly rainfall was observed in the RCP 8.5 scenario, with a greater proportion of decline at the Bekabad station. When the validity of the derivation of the R factor was evaluated with mean monthly data, no significant differences were observed between the GCMs and theUzhydromet data.
Figure 5 shows scatter-plots the provide a quantitative comparison of mean monthly precipitation. The scatterplots indicate the corresponding coefficient of determination (R2) and root mean square error (RSME,); for the ACCESS1–3, bcc-csm1-1-m, CanESM2, CSIRO-Mk3-6-0, and GISS-E2-P models, the RSME values were 12.05 mm/month, 6.71 mm/month, 5.33 mm/month, 9.75 mm/month and 3.2 mm/month (Figure 5), respectively, and the R2 values were 0.64, 0.92, 0.92, 0.76 (Figure 5) and 0.88, respectively.

3.2. Rainfall Erosivity Change under Climate Change

The simulation showed that depending on the rainfall, the spatial distribution of the R values changed. Table 3 shows the effects of precipitation on past and future erosion and erosion intensities on the CHAB; in all GCM ensembles, precipitation and rainfall-runoff erosion significantly increased. All the scenarios showed that the average value increased from the baseline level in all periods. The average values were 471.6 mm, 489.2 mm and 504.8 mm in the 2030s, 2050s and 2070s, respectively. As a rule, in the 2070s, there was high growth in all RCP scenarios, and the highest growth was forecasted with the ACCESS1–3 and CanESM2 models. Additionally, the lowest value of the increase in the coefficient of radioactivity was observed in the bcc-csm1–1-m model, while the average score corresponded with the GISS-E2-R model. The design results showed that the average rainfall erosion increased to 1081.5 Mj·mm·ha−1h−1yr−1 in the 2030s, 1165.2 Mj·mm·ha−1h−1yr−1 in the 2050s and 1231.6 Mj·mm·ha−1h−1yr−1 in the 2070s, with the above periods and scenarios. Different GCMs had different precipitation activities and rainfall erosivity. All of the models showed no continuous increase or decrease in precipitation activities or rainfall erosivity; however, the average erosion value in all models showed a steady upward trend [57]. Some models indicated a decrease in precipitation and, possibly, a parallel decrease in erosion (Table 3), while some models excluded the possibility of erosion reduction with reduced precipitation. This study showed that an increase in erosivity density and erosion was associated not only with an increase in the amount of precipitation but also with an increase in the frequency of precipitation, since the frequency of precipitation is very important for the erosion process (Figure 6, Figures 8 and 9 and Table 3).

3.3. Factors Affecting the Erosion Process

According to observations from 1990–2016 period, the highest value of the average annual rainfall was 3085 mm (Figure 7a), which corresponded to the north-western and middle parts of the basin. As a rule, the lowest amount of precipitation was observed downstream of the basin in the south and southwest regions of the basin. In the study area, the solubility coefficient of the soil (K) (Figure 7b) ranged from 0 to 0.021; as a rule, 0 means water, and water bodies. Soils in the basin had sand (58.9%), silt (29.9%) and clay (36.8%). Potential soil degradation and risk factor (%) LS (Figure 7c) values of slope categories (< 5, 5–20, 21–40, 41–70, > 70) [58] were tied to the mountain tops that are up to 4299 m high. Land use/land cover in the study area was classified into 10 types, with the largest proportion (45.62%) being in grassland. It should be noted that the study area is located in a mountainous area. Cropland (22.46%), bare-rock gravel (12.76%), build-up area (7.67%), forest (6.31%), bare (3.53%), permanent glacier snow (0.80%), waterbody (0.48%), wetland (0.28%) and shrubland (0.05%) were the remaining types. According to some studies, the density of factor C (Figure 7d) gradually increased from lower to upper areas, and the highest density was observed in dense forest on mountains. The C-factor in the study object ranged from 0 to 75.4. Analyzing the soil-erosion processes, it can be concluded that the problem of soil conservation is becoming more urgent [59].

3.4. Rainfall Erosion in Recent Climate Change

Table 3 shows the changes in past and future erosion caused by precipitation activity. When the erosion tendency is observed in all periods compared with the baseline climate, CanESM2 shows that the largest increase is greater than 60, while at the same time it reflects a decrease with a slight difference and the largest decrease falls involving bcc-csm1-1-m were by RCP 8.5, -9.1% by the 2070s. The equivalent values from CSIRO-Mk3-6-0 were RCP 8.5, -3.4% by the 2030s; those from bcc-csm1–1-m were RCP 4.5, -5.7%, those from CSIRO-Mk3-6-0 were RCP 4.5, and -1.9% by the 2050s and those from CSIRO-Mk3-6-0 were RCP 4.5, and -2.6% by the 2070s, which showed a decline, despite high erosion (Table 3). However, the erosivity density (Figure 8 and Table 3) is not entirely suitable for erosion, and the density is not only associated with the rainfall-runoff activities of rains, but also with other factors affecting the density. According to several studies, an erosion density higher than 1 causes greater erosion from precipitation than does precipitation activity [60,61]. Compared to the base climate, the highest density level occurred in the GISS-E2-R model, with a maximum of 33.3% for GISS-E2-R and - 8.5 in the 2050s, and the largest decrease with a slight difference in the case of the base climate was with CSIRO-Mk3-6-0 at -8.5, which marked a decrease by 0.7% to 2030. Despite the erosivity increases shown with the CSIRO-Mk3-6-0 - 4.5, by the values for the 2030s and the 2050s show erosion density as slightly decreasing. Soil erosion caused by rainfall intensity can be an increase or decrease [62,63] due to global climate change, which is true since climate variability is determined by what is happening in the atmosphere.

4. Discussion

The change in the intensity and amount of precipitation occurs mainly due to the changing processes for water vapor in the atmosphere, which circulates from the oceans through the earth [37]. According to several studies [9,64], changes in sea surface temperature have a significant impact on the direction of water vapor from the oceans to land [65]. The formation of climate in the territory under discussion is largely determined by atmospheric processes that are characteristic of the Central Asian region as a whole [35,66]. The duration of precipitation in the study area and the features of their distribution are characteristic of the Central Asian region, with a small amount of falls in the lower part of the region annually. As a rule, more torrential rainfall falls on the mountain areas compared to the downstream in the investigated area. Since mountain slopes help to streamline and enhance convective processes, air masses on the windward slopes experience a forced rise, resulting in the cooling of the moist air masses, thereby increasing precipitation [34,35]. Significant impacts are also caused by cyclones, wet western air masses, and cold northern air masses, leading to lower air temperatures and increased rainfall and, ultimately, can cause erosion with high values which explains the spatiotemporal distribution of rainfall-runoff activity. Erosion also varies due to land use/land cover changes, as land use/land cover plays a very important role in soil erosion [52]. Based on the above considerations, the spatial distribution of precipitation in the Chirchik River basin, in turn, can explain why the erosion process is not the same in the entire research area, and this explains the change in the intensity and amount of precipitation, which in turn shows the impact on erosion.
Studies around the world, predict a significant increase or decrease [67] in erosion under future climate conditions and show that the erosion process is affected by changes in precipitation intensity and quantity as a result of climate change. For instance, estimates in accordance with GCMs [68] suggest that more than 70 percent of the territory of the European continent, will experience a 19% increase in precipitation erosion by 2050. According to [69,70], erosion varied significantly in different scenarios without any particular direction or magnitude for Eastern Africa. Given that not all GCM models show a different direction or amount of erosion, they attribute this to the uncertainty inherent in GCM scenarios. Meanwhile, studies in the United States [71] under in all GCM scenarios, the value of rainfall changes increases over time. Thus, with the inability to capture, precipitation variability equally due to the inability of GCMs, this study reflects the spatial variability of erosivity in the Chirchik–Akhangaran basin based on different GCMs (Table 3, Figure 9).
The Chirchik–Akhangaran district is exposed to outbreaks of various air masses [35]. Climate change caused by global warming as a result of urbanization and industrialization in the middle and southern parts of the basin may have a direct impact on airflow, resulting in simultaneous in increased rainfall and increased erosion. In addition, soil erosion depends not only on climate and total rainfall but is also closely related to water resources and soil cover, its composition and biological effects, physical and geographical features, plant dynamics and soil composition. Moreover, this has been confirmed in other prediction studies (e.g., [9,35,70,72]). External influences are also important in the process of erosion. Deforestation, mechanical measures, land reclamation, land development and, ultimately, improper use of water resources or inappropriate distribution of water resources also play an important role in soil erosivity.
In the study area, slopes also play an important role, which indicates a high rate of rainfall erosion in mountainous regions in the northwest as well as in the eastern and middle parts of the basin (Figure 9). The average annual R coefficient showed differences in different GCMs, while in the ACCESS1-3 and CanESM2 (both RCPs and periods) models the highest values were observed in the northeast and east of the basin when the average values were observed in the north-western and eastern parts of the basin, and the lowest values were observed in the low part, according to the GISS-E2-R (Table 3) model. Hence, the observation data gradually increased in the middle and upstream areas of the basin and decreased in the downstream.
Studies around the world show that rainfall increases over time and space [67]. All this may be due to changes in the frequency and intensity of precipitation, an increase in temperature and changes in land use, which indicates that future rainfall will significantly affect soil erosion. The erosion process in the study area is exclusively associated with precipitation. The results show that the GCMs selected for the study area do not have the same growth; however, wind changes affect the air mass, resulting in a change in the spatial distribution of rainfall intensity meaning changes in the expected erosion in the region can occur.
The impacts of physical and mechanical factors and the lack of a system to prevent erosion can further accelerate rainfall erosion in the future, and this can lead to a strong deposition on the channel of the Chirchik River, which is the Charvak reservoir; the consequences of this trend will critically affect the long-term management of agriculture and water resources in the region. Evaluation of the inverse relationship between soil cover and precipitation intensity allows for predicting future trends in soil erosion for the study area, which allows us to quickly make decisions on the operational management of sustainable agriculture and water resources management in the region.

5. Conclusions

This study demonstrated climate models combined with factors in the RUSLE model, which is a practical and relevant method for assessing the spatiotemporal variability of soil erosion and for determining long-term measures in rural management. The use of climate models and appropriate scenarios is crucial for research that addresses the uncertainties of the future and makes quick management decisions.
In this study, the impact of climate change on precipitation erosion and erosion density using statistical downscaling by the delta method was evaluated of five GCMs: ACCESS1-3, bcc-csm1-1-m, CanESM2, CSIRO-Mk3-6-0, and GISS-E2-R, based on two scenarios: RCP 4.5, and RCP 8.5. The average erosion within the baseline was approximately 630.3 tha1yr−1, 552.4 tha−1yr−1, 318.5 tha−1yr−1, 596.8 tha−1yr−1 and 302.2 tha−1yr−1 for GCMs ACCESS1-3, bcc-csm1-1-m, CanESM2, CSIRO-Mk3-6-0, GISS-E2-R, respectively, and after draining approximately 50% of the total basin area, erosion merges into the drainage zone, which leads to the degradation of agricultural land.
According to an estimate, the most affected areas by the influence of rainfall erosivity shown in the models ACCESS1-3 and CanESM2. As a result, growing trends in annual rainfall erosivity from the base climate to GCMs, show a positive change in average annual rainfall erosivity by 11.8%, 14.1% and 16.3% in the 2030s, 2050s, and 2070s, respectively compared to the baseline (1975–2005). This was found despite a decline in rainfall-runoff erosivity on the GISS-E2-R model of about 31% and 32% from the baseline climate for both RCPs, respectively, while there is an increase in average erosion from the baseline maximum of 18.8%. Overall, there is an increase in the average erosion for most of the model ensembles from the 2030s through the 2070s period. Despite the increase in the average value in all GCMs, when compared with the baseline climate in some models, average annual soil loss, erosivity density and rainfall activity decreased by small values that were incompatible with each other in the 2030s, 2050s and 2070s, respectively, which once again confirms the importance of soil erosion studies with the rainfall intensity. The cumulative, average annual rainfall intensity and erosion in all climate models and under all scenarios showed steady growth compared to the base climate.
Assessing future soil loss using the GCMs within the empirical RUSLE model gives an idea of the influence of rainfall intensity changes in the Chirchik River basin and allows for operational management of long-term agriculture, thereby improving the ecological situation in the region and ensuring the sustainability of the local economy. The result of this study may be typical but may also be useful in predicting the occurrence of a negative effect caused by climate change in a region. It is recommended to use other GCMs and scenarios in the future for assessing erosion processes in the basin, taking into account any factors affecting erosion, such as wind erosion. Hydrotechnical and agrotechnical measures, the restoration of vegetation cover, creation of a green shield, as well as organizational and economic, hydro-technical and forest reclamation should all be directed at preventing rainfall-runoff erosivity.

Author Contributions

The research was conceived and designed by A.B. K.S.G. processed the data, analyzed the result and wrote the manuscript. S.R. and T.L. contributed to the manuscript by proofreading and providing constructive ideas. Analysis tools and technical assistance were provided by F.A., L.J., K.D., E.D., M.R. and Y.M. All authors contributed to the final version of the manuscript with analytical commentary. All authors have read and agreed to the published version of the manuscript.

Funding

This work was supported by the Strategic Priority Research Program of the Chinese Academy of Sciences (Grant No. XDA20030101), the CAS Interdisciplinary Innovation Team (JCTD-2019-20) and the Water investigation Project of RCEECA (No. Y934031).

Acknowledgments

The authors are grateful for the Presidential Scholarship of the Chinese Academy of Sciences-Third World Academy of Sciences (CAS-TWAS) for their financial support of the fellowship, which allowed us to complete this research. We are also grateful to the Research Center for Ecology and Environment of Central Asia, the Chinese Academy of Sciences, for their support in collecting data.

Conflicts of Interest

The authors declare no conflict of interest.

References

  1. Xie, H.; Zhang, Y.; Wu, Z.; Lv, T. A Bibliometric Analysis on Land Degradation: Current Status, Development, and Future Directions. Land 2020, 9, 28. [Google Scholar] [CrossRef] [Green Version]
  2. Amundson, R.; Berhe, A.A.; Hopmans, J.W.; Olson, C.; Sztein, A.E.; Sparks, D.L. Soil and human security in the 21st century. Science 2015, 348, 1261071. [Google Scholar] [CrossRef] [PubMed] [Green Version]
  3. Borrelli, P.; Robinson, D.A.; Fleischer, L.R.; Lugato, E.; Ballabio, C.; Alewell, C.; Meusburger, K.; Modugno, S.; Schütt, B.; Ferro, V. An assessment of the global impact of 21st century land use change on soil erosion. Nat. Commun. 2017, 8, 1–13. [Google Scholar] [CrossRef] [PubMed] [Green Version]
  4. Pereira, E.C.B.; Lopes, F.B.; Gomes, F.E.F.; de Almeida, A.M.M.; de Magalhães, A.C.M.; de Andrade, E.M. Determining the Soil Erodibility for an Experimental Basin in the Semi-Arid Region Using Geoprocessing. Am. J. Plant Sci. 2017, 8, 3174. [Google Scholar] [CrossRef] [Green Version]
  5. Wordofa, G. Soil Erosion Modeling Using GIS and RUSLE on the Eurajoki Watershed, Finland. 2011. Available online: https://www.semanticscholar.org/paper/Soil-erosion-modeling-using-GIS-and-RUSLE-on-the-%2C-Wordofa/6b91d2573652f8d38336df452bd6005bc73a5832 (accessed on 28 June 2011).
  6. Arora, K.R. Soil Mechanics and Foundation Engineering, 6th ed.; Standard Publishers: Delhi, India, 2003; Available online: https://ru.scribd.com/document/283580022/Soil-Mechanics-Foundation-Engineering-by-K-R-Arora-6th-Edition (accessed on 4 October 2015).
  7. Efthimiou, N. The importance of soil data availability on erosion modeling. CATENA 2018, 165, 551–566. [Google Scholar] [CrossRef]
  8. Hao, C.; Oguchi, T.; Pan, W. Assessment for soil loss by using a scheme of alterative sub-models based on the RUSLE in a Karst Basin of Southwest China. J. Integr. Agric. 2017, 16, 377–388. [Google Scholar] [CrossRef] [Green Version]
  9. Duulatov, E.; Chen, X.; Amanambu, A.C.O.; Ochege, U.O.; Orozbaev, R.; Issanova, G.; Omurakunova, G. Projected Rainfall Erosivity Over Central Asia Based on CMIP5 Climate Models. Water 2019, 11, 897. [Google Scholar] [CrossRef] [Green Version]
  10. Frankl, A.; Prêtre, V.; Nyssen, J.; Salvador, P.-G. The success of recent land management efforts to reduce soil erosion in northern France. Geomorphology 2018, 303, 84–93. [Google Scholar] [CrossRef]
  11. Ganasri, B.; Ramesh, H. Assessment of soil erosion by RUSLE model using remote sensing and GIS-A case study of Nethravathi Basin. Geosci. Front. 2016, 7, 953–961. [Google Scholar] [CrossRef] [Green Version]
  12. Kim, J.B.; Saunders, P.; Finn, J.T. Rapid assessment of soil erosion in the Rio Lempa Basin, Central America, using the universal soil loss equation and geographic information systems. Environ. Manag. 2005, 36, 872–885. [Google Scholar] [CrossRef]
  13. Lu, H.; Prosser, I.P.; Moran, C.J.; Gallant, J.C.; Priestley, G.; Stevenson, J.G. Predicting sheetwash and rill erosion over the Australian continent. Soil Res. 2003, 41, 1037–1062. [Google Scholar] [CrossRef]
  14. Shiferaw, A. Estimating soil loss rates for soil conservation planning in the Borena Woreda of South Wollo Highlands, Ethiopia. J. Sustain. Dev. Afr. 2011, 13, 87–106. [Google Scholar]
  15. Wang, X.; Pedram, S.; Liu, T.; Gao, R.; Li, F.; Luo, Y. Estimated grass grazing removal rate in a semiarid Eurasian steppe watershed as influenced by climate. Water 2016, 8, 339. [Google Scholar] [CrossRef] [Green Version]
  16. Nyssen, J.; Poesen, J.; Gebremichael, D.; Vancampenhout, K.; D’aes, M.; Yihdego, G.; Govers, G.; Leirs, H.; Moeyersons, J.; Naudts, J. Interdisciplinary on-site evaluation of stone bunds to control soil erosion on cropland in Northern Ethiopia. Soil Til. Res. 2007, 94, 151–163. [Google Scholar] [CrossRef] [Green Version]
  17. Delgado-Baquerizo, M.; Eldridge, D.J.; Travers, S.K.; Val, J.; Oliver, I.; Bissett, A. Effects of climate legacies on above-and belowground community assembly. Glob. Chang. Biol. 2018, 24, 4330–4339. [Google Scholar] [CrossRef] [Green Version]
  18. Raymond, P.A.; Hamilton, S.K. Anthropogenic influences on riverine fluxes of dissolved inorganic carbon to the oceans. Limnol. Oceanogr. Lett. 2018, 3, 143–155. [Google Scholar] [CrossRef]
  19. Anderson, J.; Clapp, C. Coupling free radical catalysis, climate change, and human health. Phys. Chem. Chem. Phys. 2018, 20, 10569–10587. [Google Scholar] [CrossRef] [Green Version]
  20. Bewket, W.; Teferi, E. Assessment of soil erosion hazard and prioritization for treatment at the watershed level: Case study in the Chemoga watershed, Blue Nile basin, Ethiopia. Land Degrad. Dev. 2009, 20, 609–622. [Google Scholar] [CrossRef]
  21. Xiong, M.; Sun, R.; Chen, L. Effects of soil conservation techniques on water erosion control: A global analysis. Sci. Total Environ. 2018, 645, 753–760. [Google Scholar] [CrossRef]
  22. Duishonakunov, M.; Imbery, S.; Narama, C.; Mohanty, A.; King, L. Recent glacier changes and their impact on water resources in Chon and Kichi Naryn Catchments, Kyrgyz Republic. Water Sci. Technol. Water Sup. 2014, 14, 444–452. [Google Scholar] [CrossRef]
  23. Shahgedanova, M.; Afzal, M.; Severskiy, I.; Usmanova, Z.; Saidaliyeva, Z.; Kapitsa, V.; Kasatkin, N.; Dolgikh, S. Changes in the mountain river discharge in the northern Tien Shan since the mid-20th Century: Results from the analysis of a homogeneous daily streamflow data set from seven catchments. J. Hydrol. 2018, 564, 1133–1152. [Google Scholar] [CrossRef]
  24. Chevallier, P.; Pouyaud, B.; Mojaïsky, M.; Bolgov, M.; Olsson, O.; Bauer, M.; Froebrich, J. River flow regime and snow cover of the Pamir Alay (Central Asia) in a changing climate. Hydrol. Sci. J. 2014, 59, 1491–1506. [Google Scholar] [CrossRef]
  25. Hagg, W.; Braun, L.N.; Kuhn, M.; Nesgaard, T.I. Modeling of hydrological response to climate change in glacierized Central Asian catchments. J. Hydrol. 2007, 332, 40–53. [Google Scholar] [CrossRef] [Green Version]
  26. Lioubimtseva, E. A multi-scale assessment of human vulnerability to climate change in the Aral Sea Basin. Environ. Earth Sci. 2015, 73, 719–729. [Google Scholar] [CrossRef]
  27. Lioubimtseva, E.; Henebry, G.M. Climate and environmental change in arid Central Asia: Impacts, vulnerability, and adaptations. J. Arid Environ. 2009, 73, 963–977. [Google Scholar] [CrossRef]
  28. Stulina, G. Soils of Chirchik-Ahangaran Basin. 2008. Available online: http://www.cawater-info.net/rivertwin/documents/pdf/soil_e.pdf (accessed on 23 January 2018).
  29. Stulina, G. Пoчвы Чирчик-Ахангаранскoгo бассейна. Available online: http://www.http://www.cawater-info.net/chirchik/papers.htm (accessed on 23 January 2018).
  30. Shoira, M. Application of Defecation Lime from Sugar Industry in Uzbekistan; KTH, School of Industrial Engineering and Management (ITM): Stockholm, Sweden, 2006. [Google Scholar]
  31. Mohan Kumar, S. Application of SWAT Model to the Nethravathi River Basin. Ph.D. Thesis, National Institute of Technology Karnataka, Surathkal, India, 2011. [Google Scholar] [CrossRef] [Green Version]
  32. Chembarisov, E.I.; Makhmudov, I.E.; Lesnik, T.Y. Вoднo-земельные прoблемы бассейна р.Чирчик Республики Узбекистан. 2009. Available online: http://www.cawater-info.net/chirchik/papers/chemb.pdf (accessed on 11 July 2018).
  33. Usmanov, S.; Mitani, Y.; Kusuda, T. An Integrated Hydrological Model for Water Balance Estimation in the Chirchik River Basin, Northern Uzbekistan. Comput. Water Energy Environ. Eng. 2016, 5, 87. [Google Scholar] [CrossRef] [Green Version]
  34. Alamanov, S.; Lelevkin, V.M.; Podrezov, O.A.; Podrezov, A.O. Climate Changes and Water Problems in Central Asia; United Nations Environment Program (UNEP) and World Wildlife Fund (WWF): Moscow/Bishkek, Russia, 2006. (In Russian) [Google Scholar]
  35. Stulina, G. Климатические изменения и их влияние на вoдные ресурсы Чирчик-Ахангаранскoгo гидрoлoгическoгo райoна. Available online: http://www.cawater-info.net/rivertwin/documents/pdf/climate_r.pdf (accessed on 23 January 2018).
  36. Chen, L.; Frauenfeld, O.W. Surface air temperature changes over the twentieth and twenty-first centuries in China simulated by 20 CMIP5 models. J. Clim. 2014, 27, 3920–3937. [Google Scholar] [CrossRef]
  37. Luo, M.; Liu, T.; Meng, F.; Duan, Y.; Bao, A.; Frankl, A.; De Maeyer, P. Spatiotemporal characteristics of future changes in precipitation and temperature in Central Asia. Int. J. Clim. 2019, 39, 1571–1588. [Google Scholar] [CrossRef]
  38. Riahi, K.; Rao, S.; Krey, V.; Cho, C.; Chirkov, V.; Fischer, G.; Kindermann, G.; Nakicenovic, N.; Rafaj, P. RCP 8.5—A scenario of comparatively high greenhouse gas emissions. Clim. Chang. 2011, 109, 33. [Google Scholar] [CrossRef] [Green Version]
  39. Luo, M.; Liu, T.; Frankl, A.; Duan, Y.; Meng, F.; Bao, A.; Kurban, A.; De Maeyer, P. Defining spatiotemporal characteristics of climate change trends from downscaled GCMs ensembles: How climate change reacts in Xinjiang, China. Int. J. Clim. 2018, 38, 2538–2553. [Google Scholar] [CrossRef]
  40. Pham, T.N.Y.; Dawen, K.S.O.; Taikan, M.K. Application of RUSLE model on global soil erosion estimate. Proc. Hydraul. Eng. 2001, 45, 811–816. [Google Scholar] [CrossRef]
  41. Wischmeier, W.H.; Smith, D.D. Predicting Rainfall Erosion Losses-a Guide to Conservation Planning; Publisher: Washington, USA, 1978. [Google Scholar]
  42. Yang, D.; Kanae, Sh.; Oki, T.; Koike, T.; Musiake, K. Global potential soil erosion with reference to land use and climate changes. Hydrol. Process. 2003, 17, 2913–2928. [Google Scholar] [CrossRef]
  43. Kilinc, M.Y.; Richardson, E.V. Mechanics of Soil Erosion from Overland Flow Generated by Simulated Rainfall; Hydrology Papers (Colorado State University) No. 63; Colorado State University: Fort Collins, CO, USA, 1973. [Google Scholar]
  44. Gulizia, C.; Camilloni, I. Comparative analysis of the ability of a set of CMIP3 and CMIP5 global climate models to represent precipitation in South America. Int. J. Climatol. 2015, 35, 583–595. [Google Scholar] [CrossRef]
  45. Fu, G.; Chen, S.; McCool, D.K. Modeling the impacts of no-till practice on soil erosion and sediment yield with RUSLE, SEDD, and ArcView GIS. Soil Tillage Res. 2006, 85, 38–49. [Google Scholar] [CrossRef]
  46. Kouli, M.; Soupios, P.; Vallianatos, F. Soil erosion prediction using the revised universal soil loss equation (RUSLE) in a GIS framework, Chania, Northwestern Crete, Greece. Environ. Geol. 2009, 57, 483–497. [Google Scholar] [CrossRef]
  47. Parysow, P.; Wang, G.; Gertner, G.; Anderson, A.B. Spatial uncertainty analysis for mapping soil erodibility based on joint sequential simulation. CATENA 2003, 53, 65–78. [Google Scholar] [CrossRef]
  48. Yan, R.; Zhang, X.; Yan, S.; Chen, H. Estimating soil erosion response to land use/cover change in a catchment of the Loess Plateau, China. Int. Soil Water Conserv. Res. 2018, 6, 13–22. [Google Scholar] [CrossRef]
  49. Zhang, H.; Wei, J.; Yang, Q.; Baartman, J.E.M.; Gai, L.; Yang, X.; Li, S.; Yu, J.; Ritsema, C.J.; Geissen, V. An improved method for calculating slope length (λ) and the LS parameters of the Revised Universal Soil Loss Equation for large watersheds. Geoderma 2017, 308, 36–45. [Google Scholar] [CrossRef]
  50. Lieskovský, J.; Kenderessy, P. Modeling the effect of vegetation cover and different tillage practices on soil erosion in vineyards: A case study in Vráble (Slovakia) using WATEM/SEDEM. Land Degrad. Dev. 2014, 25, 288–296. [Google Scholar] [CrossRef]
  51. Nearing, M.; Jetten, V.; Baffaut, C.; Cerdan, O.; Couturier, A.; Hernandez, M.; Le Bissonnais, Y.; Nichols, M.H.; Nunes, J.P.; Renschler, C.S. Modeling response of soil erosion and runoff to changes in precipitation and cover. CATENA 2005, 61, 131–154. [Google Scholar] [CrossRef]
  52. Panagos, P.; Borrelli, P.; Poesen, J.; Ballabio, C.; Lugato, E.; Meusburger, K.; Montanarella, L.; Alewell, C. The new assessment of soil loss by water erosion in Europe. Environ. Sci. Policy 2015, 54, 438–447. [Google Scholar] [CrossRef]
  53. Zhou, P.; Luukkanen, O.; Tokola, T.; Nieminen, J. Effect of vegetation cover on soil erosion in a mountainous watershed. CATENA 2008, 75, 319–325. [Google Scholar] [CrossRef]
  54. Mandal, U.K. Geo-Information-Based Soil Erosion Modeling for Sustainable Agriculture Development in Khadokhola Watershed, Nepal, in Land Cover Change and Its Eco-environmental Responses in Nepal; Springer: Gateway East, Singapore, 2017; pp. 223–241. [Google Scholar]
  55. Mehri, A.; Salmanmahiny, A.; Tabrizi, A.R.M.; Mirkarimi, S.H.; Sadoddin, A. Investigation of likely effects of land use planning on reduction of soil erosion rate in river basins: Case study of the Gharesoo River Basin. CATENA 2018, 167, 116–129. [Google Scholar] [CrossRef]
  56. Wang, G.; Gertner, G.; Singh, V.; Shinkareva, S.; Parysow, P.; Anderson, A. Spatial and temporal prediction and uncertainty of soil loss using the revised universal soil loss equation: A case study of the rainfall–runoff erosivity R factor. Ecol. Model. 2002, 153, 143–155. [Google Scholar] [CrossRef]
  57. Li, Z.; Fang, H. Impacts of climate change on water erosion: A review. Earth-Sci. Rev. 2016, 163, 94–117. [Google Scholar] [CrossRef]
  58. Mukanov, Y.; Chen, Y.; Baisholanov, S.; Amanambu, A.C.; Issanova, G.; Abenova, A.; Fang, G.; Abayev, N. Estimation of annual average soil loss using the Revised Universal Soil Loss Equation (RUSLE) integrated in a Geographical Information System (GIS) of the Esil River basin (ERB), Kazakhstan. Acta Geophys. 2019, 67, 921–938. [Google Scholar] [CrossRef]
  59. Parsons, A.J. How reliable are our methods for estimating soil erosion by water? Sci. Total Environ. 2019, 676, 215–221. [Google Scholar] [CrossRef]
  60. García-Ruiz, J.M. The effects of land uses on soil erosion in Spain: A review. CATENA 2010, 81, 1–11. [Google Scholar] [CrossRef]
  61. Zhang, Y.; Zhao, Y.; Liu, B.; Wang, Z.; Zhang, S. Rill and gully erosion on unpaved roads under heavy rainfall in agricultural watersheds on China’s Loess Plateau. Agric. Ecosyst. Environ. 2019, 284, 106580. [Google Scholar] [CrossRef]
  62. Charlson, R.J.; Lovelock, J.E.; Andreae, M.O.; Warren, S.G. Oceanic phytoplankton, atmospheric sulphur, cloud albedo and climate. Nature 1987, 326, 655. [Google Scholar] [CrossRef]
  63. Jiang, C.; Zhang, H.; Wang, X.; Feng, Y.; Labzovskii, L. Challenging the land degradation in China’s Loess Plateau: Benefits, limitations, sustainability, and adaptive strategies of soil and water conservation. Ecol. Eng. 2019, 127, 135–150. [Google Scholar] [CrossRef]
  64. Dai, A.; Wigley, T. Global patterns of ENSO-induced precipitation. Geophys. Res. Lett. 2000, 27, 1283–1286. [Google Scholar] [CrossRef] [Green Version]
  65. Ma, J.; Xie, S.-P. Regional patterns of sea surface temperature change: A source of uncertainty in future projections of precipitation and atmospheric circulation. J. Clim. 2013, 26, 2482–2501. [Google Scholar] [CrossRef] [Green Version]
  66. Jiang, L.; Bao, A.; Jiapaer, G.; Guo, H.; Zheng, G.; Gafforov, Kh.; Kurban, A.; De Maeyer, P. Monitoring land sensitivity to desertification in Central Asia: Convergence or divergence? Sci. Total Environ. 2019, 658, 669–683. [Google Scholar] [CrossRef]
  67. Wang, B.; Zhang, M.; Wei, J.; Wang, S.; Li, S.; Ma, Q.; Li, X.; Pan, S. Changes in extreme events of temperature and precipitation over Xinjiang, northwest China, during 1960–2009. Quat. Int. 2013, 298, 141–151. [Google Scholar] [CrossRef]
  68. Panagos, P.; Ballabio, C.; Meusburger, K.; Spinoni, J.; Alewell, Ch.; Borrelli, P. Towards estimates of future rainfall erosivity in Europe based on REDES and WorldClim datasets. J. Hydrol. 2017, 548, 251–262. [Google Scholar] [CrossRef]
  69. Maeda, E.E.; Pellikka, P.K.E.; Siljander, M.; Clark, B.J.F. Potential impacts of agricultural expansion and climate change on soil erosion in the Eastern Arc Mountains of Kenya. Geomorphology 2010, 123, 279–289. [Google Scholar] [CrossRef]
  70. Amanambu, A.C.; Li, L.; Egbinola, C.N.; Obarein, O.A.; Mupenzi, C.; Chen, D. Spatio-temporal variation in rainfall-runoff erosivity due to climate change in the Lower Niger Basin, West Africa. CATENA 2019, 172, 324–334. [Google Scholar] [CrossRef]
  71. Segura, C.; Sun, G.; McNulty, S.; Zhang, Y. Potential impacts of climate change on soil erosion vulnerability across the conterminous United States. J. Soil Water Conserv. 2014, 69, 171–181. [Google Scholar] [CrossRef]
  72. Litschert, S.E.; Theobald, D.M.; Brown, T.C. Effects of climate change and wildfire on soil loss in the Southern Rockies Ecoregion. CATENA 2014, 118, 206–219. [Google Scholar] [CrossRef]
Figure 1. Overview of the Study area: (a) location and geographical; (b) DEM (digital elevation model, (CHABT—Chirchik–Akhangaron basin territory, PBT—Pskem basin territory, UBT—Ugar basin territory, CHBT—Chatkal basin territory); (c) spatial allocation of annual average precipitation in 1990–2016 from the Center for Hydrometeorological Service of the Republic of Uzbekistan (UZHYMET), and (d) land cover and land-use classes.
Sustainability 12 03369 g001
Figure 2. Monthly average observed precipitation and temperature change in different zones.
Sustainability 12 03369 g002
Figure 3. Taylor Diagram for Precipitation. The precision of each reduced amount of precipitation compared with the observed data over the historical period 1975–2005.
Sustainability 12 03369 g003
Figure 4. The amount of monthly rainfall change rater generated in the future periods with respect to those observed in the baseline data, (RCP4.5 and RCP8.5 scenarios) for ten stations: (a) Bekabad; (b) Chatkal; (c) Chimgan; (d) Oygaing; (e) Pskem; (f) Qizilcha; (g) Suqoq; (h) Tashkent; (i) Tuyabuguz; (j) Yangiyul.
Sustainability 12 03369 g004
Figure 5. Scatterplots of the five products depending on the rainfall rate for the GCMs between observation and baseline data.
Sustainability 12 03369 g005
Figure 6. Predicted annual mean rainfall erosivity for three periods according to the RCPs 4.5 and 8.5 scenarios for the GCMs.
Sustainability 12 03369 g006
Figure 7. Determination of soil erosion losses using RUSLE factors: (a) rainfall-runoff erosivity; (b) soil erodibility factor; (c) length and slope factor; (d) crop management.
Sustainability 12 03369 g007
Figure 8. Predicted annual mean erosivity density under climate change for three periods according to the RCP 4.5 and RCP 8.5 scenarios for the GCMs projections.
Sustainability 12 03369 g008
Figure 9. Predicted annual mean soil erosion under climate change for three periods according to the RCP4.5 and RCP8.5 scenarios for the GCMs projections.
Sustainability 12 03369 g009
Table 1. General information on selected GCMs, obtained from the Earth System Grid Federation (ESGF, https://esgf-node.llnl.gov/projects/esgf-llnl/) portal.
ModelInstitutionCountryAbbreviation
ACCESS1–3 (RCP 4.5)Commonwealth Scientific and Industrial Research OrganizationAustraliaACCESS1–3
ACCESS1–3 (RCP 8.5)
bcc-csm1–1-m (RCP 4.5)Beijing Climate Center (BCC), China Meteorological AdministrationChinabcc-csm1–1-m
bcc-csm1–1-m (RCP 8.5)
CanESM2 (RCP 4.5)Canadian Center for Climate Modeling and Analysis, Victoria, BCCanadaCanESM2
CanESM2 (RCP 8.5)
CSIRO-Mk3-6-0 (RCP 4.5)Commonwealth Scientific and Industrial Research OrganizationAustraliaCSIRO-Mk3-6-0
CSIRO-Mk3-6-0 (RCP 8.5)
GISS-E2-R (RCP 4.5)“NASA/GISS” Goddard Institute for Space Studies, New York, NYUSAGISS-E2-R
GISS-E2-R (RCP 8.5)
Table 2. P values by different land use/land cover (LULC) types.
LULC TypeP FactorArea (ha)Area %
Cropland0.54969.622.5
Forest11396.46.3
Grassland0.510092.945.6
Shrubland113.20.1
Bareland1781.03.5
Built-up land11696.97.7
Wetland162.30.3
Bare rock gravel12823.412.8
Waterbody0106.60.5
Permanent Glacier Snow0178.60.8
Table 3. Changes in average rainfall erosivity, average erosion and erosivity density under climate change.
Climate ModelsPrecipitation, mmRainfall Erosivity
(MJ mm ha−1hr−1year−1)
Change (%)Average Erosion
(tha−1yr−1)
Change (%)Erosivity DensityChange (%)
Baseline
ACCESS1–3498.81001.00.0630.30.02.00.0
bcc-csm1–1-m409.3776.70.0552.40.01.90.0
CanESM2291.5581.30.0318.50.02.00.0
CSIRO-Mk3-6-0363.3686.70.0596.80.01.90.0
GISS-E2346.6658.50.0302.20.01.90.0
2030s (2020–2039)
ACCESS1-3 - 4.5660.41572.936.0736.414.42.383.0
ACCESS1-3 - 8.5699.71744.643.0810.622.22.497.4
bcc-csm1-1-m - 4.5478.3943.718.0597.92.71.973.7
bcc-csm1-1-m - 8.5475.1935.317.0585.75.71.973.5
CanESM2 - 4.5660.41572.936.0692.354.02.383.0
CanESM2 - 8.5699.71744.643.0756.557.92.497.4
CSIRO-Mk3-6-0 - 4.5351.6666.7–3.0605.71.51.90.3
CSIRO-Mk3-6-0 - 8.5328.7630.7–9.0577.4–3.41.921.5
GISS-E2-R - 4.5175.8500.4–32.0353.74.22.8533.3
GISS-E2-R - 8.5186.0503.1–31.0378.911.92.7129.8
Average451.61081.511.8574.617.12.314.1
2050s (2040–2069)
ACCESS1-3 - 4.5723.41854.346.0868.427.42.569.9
ACCESS1-3 - 8.5742.81947.449.0905.830.42.6211.9
bcc-csm1-1-m - 4.5424.7810.54.0522.7–5.71.910.4
bcc-csm1-1-m - 8.5442.1851.29.0558.31.11.931.3
CanESM2 - 4.5723.41854.346.0807.560.62.569.9
CanESM2 - 8.5742.81947.449.0841.462.12.6211.9
CSIRO-Mk3-6-0 - 4.5354.5671.5–2.0585.8–1.91.89–0.3
CSIRO-Mk3-6-0 - 8.5377.1711.84.0626.44.71.89–0.6
GISS-E2-R - 4.5185.8503.0–31.0377.213.42.7129.8
GISS-E2-R - 8.5175.7500.3–32.0357.513.22.8533.3
Average463.91165.214.1608.220.52.415.4
2070s (2060–2099)
ACCESS1-3 - 4.5727.51873.847.0877.628.22.5810.3
ACCESS1-3 - 8.5796.02218.455.01059.540.52.7917.1
bcc-csm1-1-m - 4.5477.3941.117.0605.68.81.973.6
bcc-csm1-1-m - 8.5403.1763.4–2.0506.5–9.11.89–0.3
CanESM2 - 4.5727.51873.847.0815.861.02.5810.3
CanESM2 - 8.5796.02218.455.0987.367.72.7917.1
CSIRO-Mk3-6-0 - 4.5375.8709.53.0581.6–2.61.89–0.6
CSIRO-Mk3-6-0 - 8.5377.3712.24.0634.55.91.89–0.7
GISS-E2-R - 4.5188.2503.8–31.0365.314.12.6829.0
GISS-E2-R - 8.5179.3501.2–31.0361.818.82.832.0
Average477.21231.616.3636.623.32.416.3

