Article

Assessing Soil Acidification of Croplands in the Poyang Lake Basin of China from 2012 to 2018

1
Technical Centre for Soil, Agricultural and Rural Ecology and Environment, Ministry of Ecology and Environment, Beijing 100012, China
2
Institute of Soil and Solid Waste Environment, Chinese Research Academy of Environmental Sciences, Beijing 100012, China
3
School of Land Science and Technology, China University of Geosciences (Beijing), Beijing 100083, China
4
Key Laboratory of Land Consolidation and Rehabilitation, Ministry of Land and Resources, Beijing 100035, China
5
The 7th Institute of Geology & Mineral Exploration of Shandong Province, Linyi, Shandong 276006, China
*
Author to whom correspondence should be addressed.
Sustainability 2020, 12(8), 3072; https://doi.org/10.3390/su12083072
Submission received: 19 March 2020 / Revised: 6 April 2020 / Accepted: 7 April 2020 / Published: 11 April 2020

Abstract

:
Soil acidification, caused by intensified fertilizer application and acid deposition, has threatened the sustainability of agricultural ecosystems and soil quality in parts of China since the 1980s. However, little is known about the spatio-temporal change of soil pH in cropland at a large basin scale. Poyang Lake Basin of China was selected as the study area to identify the spatio-temporal change of cropland pH and detect potential soil acidification factors. A total of 507 and 503 topsoil samples were collected in 2012 and 2018, respectively, and methods including one-way analysis of variance (ANOVA), Pearson’s correlation analyses, and Inverse Distance Weighted (IDW) were applied. Results showed that soil pH ranged from 3.96 to 7.95 in 2012 and from 3.34 to 8.19 in 2018, with most samples being acidic (pH < 7) in both sets of data. The two soil datasets showed a significant decline (p < 0.05) of 0.1 pH units over the past six years and several soil samples that exhibited obvious uptrends in the groups of pH < 4.5 and 4.5–5.0 from 2012 to 2018. Overall, the distribution patterns of pH at the two sampling dates were similar, whereas local details of the pH spatial distribution patterns differed. While we found a significant correlation (p < 0.05) between soil pH and aspect, elevation and slope showed no significant correlation with pH. ANOVA showed that pH values in the water density (river or lake network density) range of 6.27–19.94 were significantly higher (p < 0.05) than the other water densities. Large amounts of precipitation with low pH values were found to significantly influence soil pH, whereas N-fertilizer inputs exerted limited effects on soil pH over the entire study area. These findings provided new insights on soil acidification assessment and potential factor detection at the basin scale.

1. Introduction

As a measure of soil acidity or alkalinity, soil pH regulates soil biogeochemical processes [1], controls soil quality [2], affects the structure and functioning of terrestrial ecosystems [3], and has some impact on crop productivity [4]. Soil pH also has a stimulating role in soil microbial biomass growth [5]. Under the combined influence of natural factors and anthropogenic activities, soil pH values are variable over space and dynamic over time [6,7]. Thus, understanding the scale and reasons for soil pH changes can provide valuable information that reveals the mechanisms for and predicts acidification processes.
Soil acidification is defined as a decrease in soil pH and is commonly a slow process under natural conditions [8,9]. Nevertheless, this process can be dramatically increased by a series of factors, including acidic precipitation and the deposition of acidifying gases or particles, consequently resulting in a variety of environmental impacts [10,11]. It has been widely reported that soil pH values could be significantly changed within decades due to the influence of human activities [12,13]. For example, acidification can be hastened by the application of nitrogen fertilizer [14,15,16], which produces an excess of H+ ions in soil. It could also result from waste water percolating through the soil, which encourages the dissolution of soil carbonates [17]. Natural environmental factors could also shape soil pH and its spatial distribution. For instance, temperature, microbial community composition, and landscape factors were observed to be directly correlated with soil pH [18,19,20]. The spatial distribution of pH or pH change has been well researched. Xie et al. [21] identified the spatial distribution of pH change in the Yangtze River Delta of China between 1989 and 2015 and found that significant topsoil acidification occurred in major croplands of the study area. Yang et al. [22] reported that mean soil pH across northern China's grasslands was 8.17 in the 1980s but 7.50 in the 2000s, with a decline rate of about 0.034 pH units per year.
However, little data has been provided from watershed-scale observations, and as far as we know, research on the effect of environmental factors and human activities on soil pH has been seldom reported. The Poyang Lake Basin in South China was chosen as the area in which to conduct this study as it is a typical area characterized by soil acidification, acid rain, and high precipitation. Additionally, the problem of soil acidification in the region has received significant attention from both the government and scholars in recent years. In this study, we hypothesize that N-fertilizer inputs in the study area were relatively high and consequently promoted soil acidification. Our study, aiming to examine soil acidification of croplands in the Poyang Lake Basin of China, was based on 507 topsoil samples taken in 2012 and 503 samples taken in 2018. Specifically, the objectives of the study were to (1) identify the spatial distribution of soil pH and pH change during the study period, (2) detect the potential factors influencing soil pH change, and (3) evaluate the effects of N-fertilizer inputs and precipitation on soil pH dynamics.

2. Materials and Methods
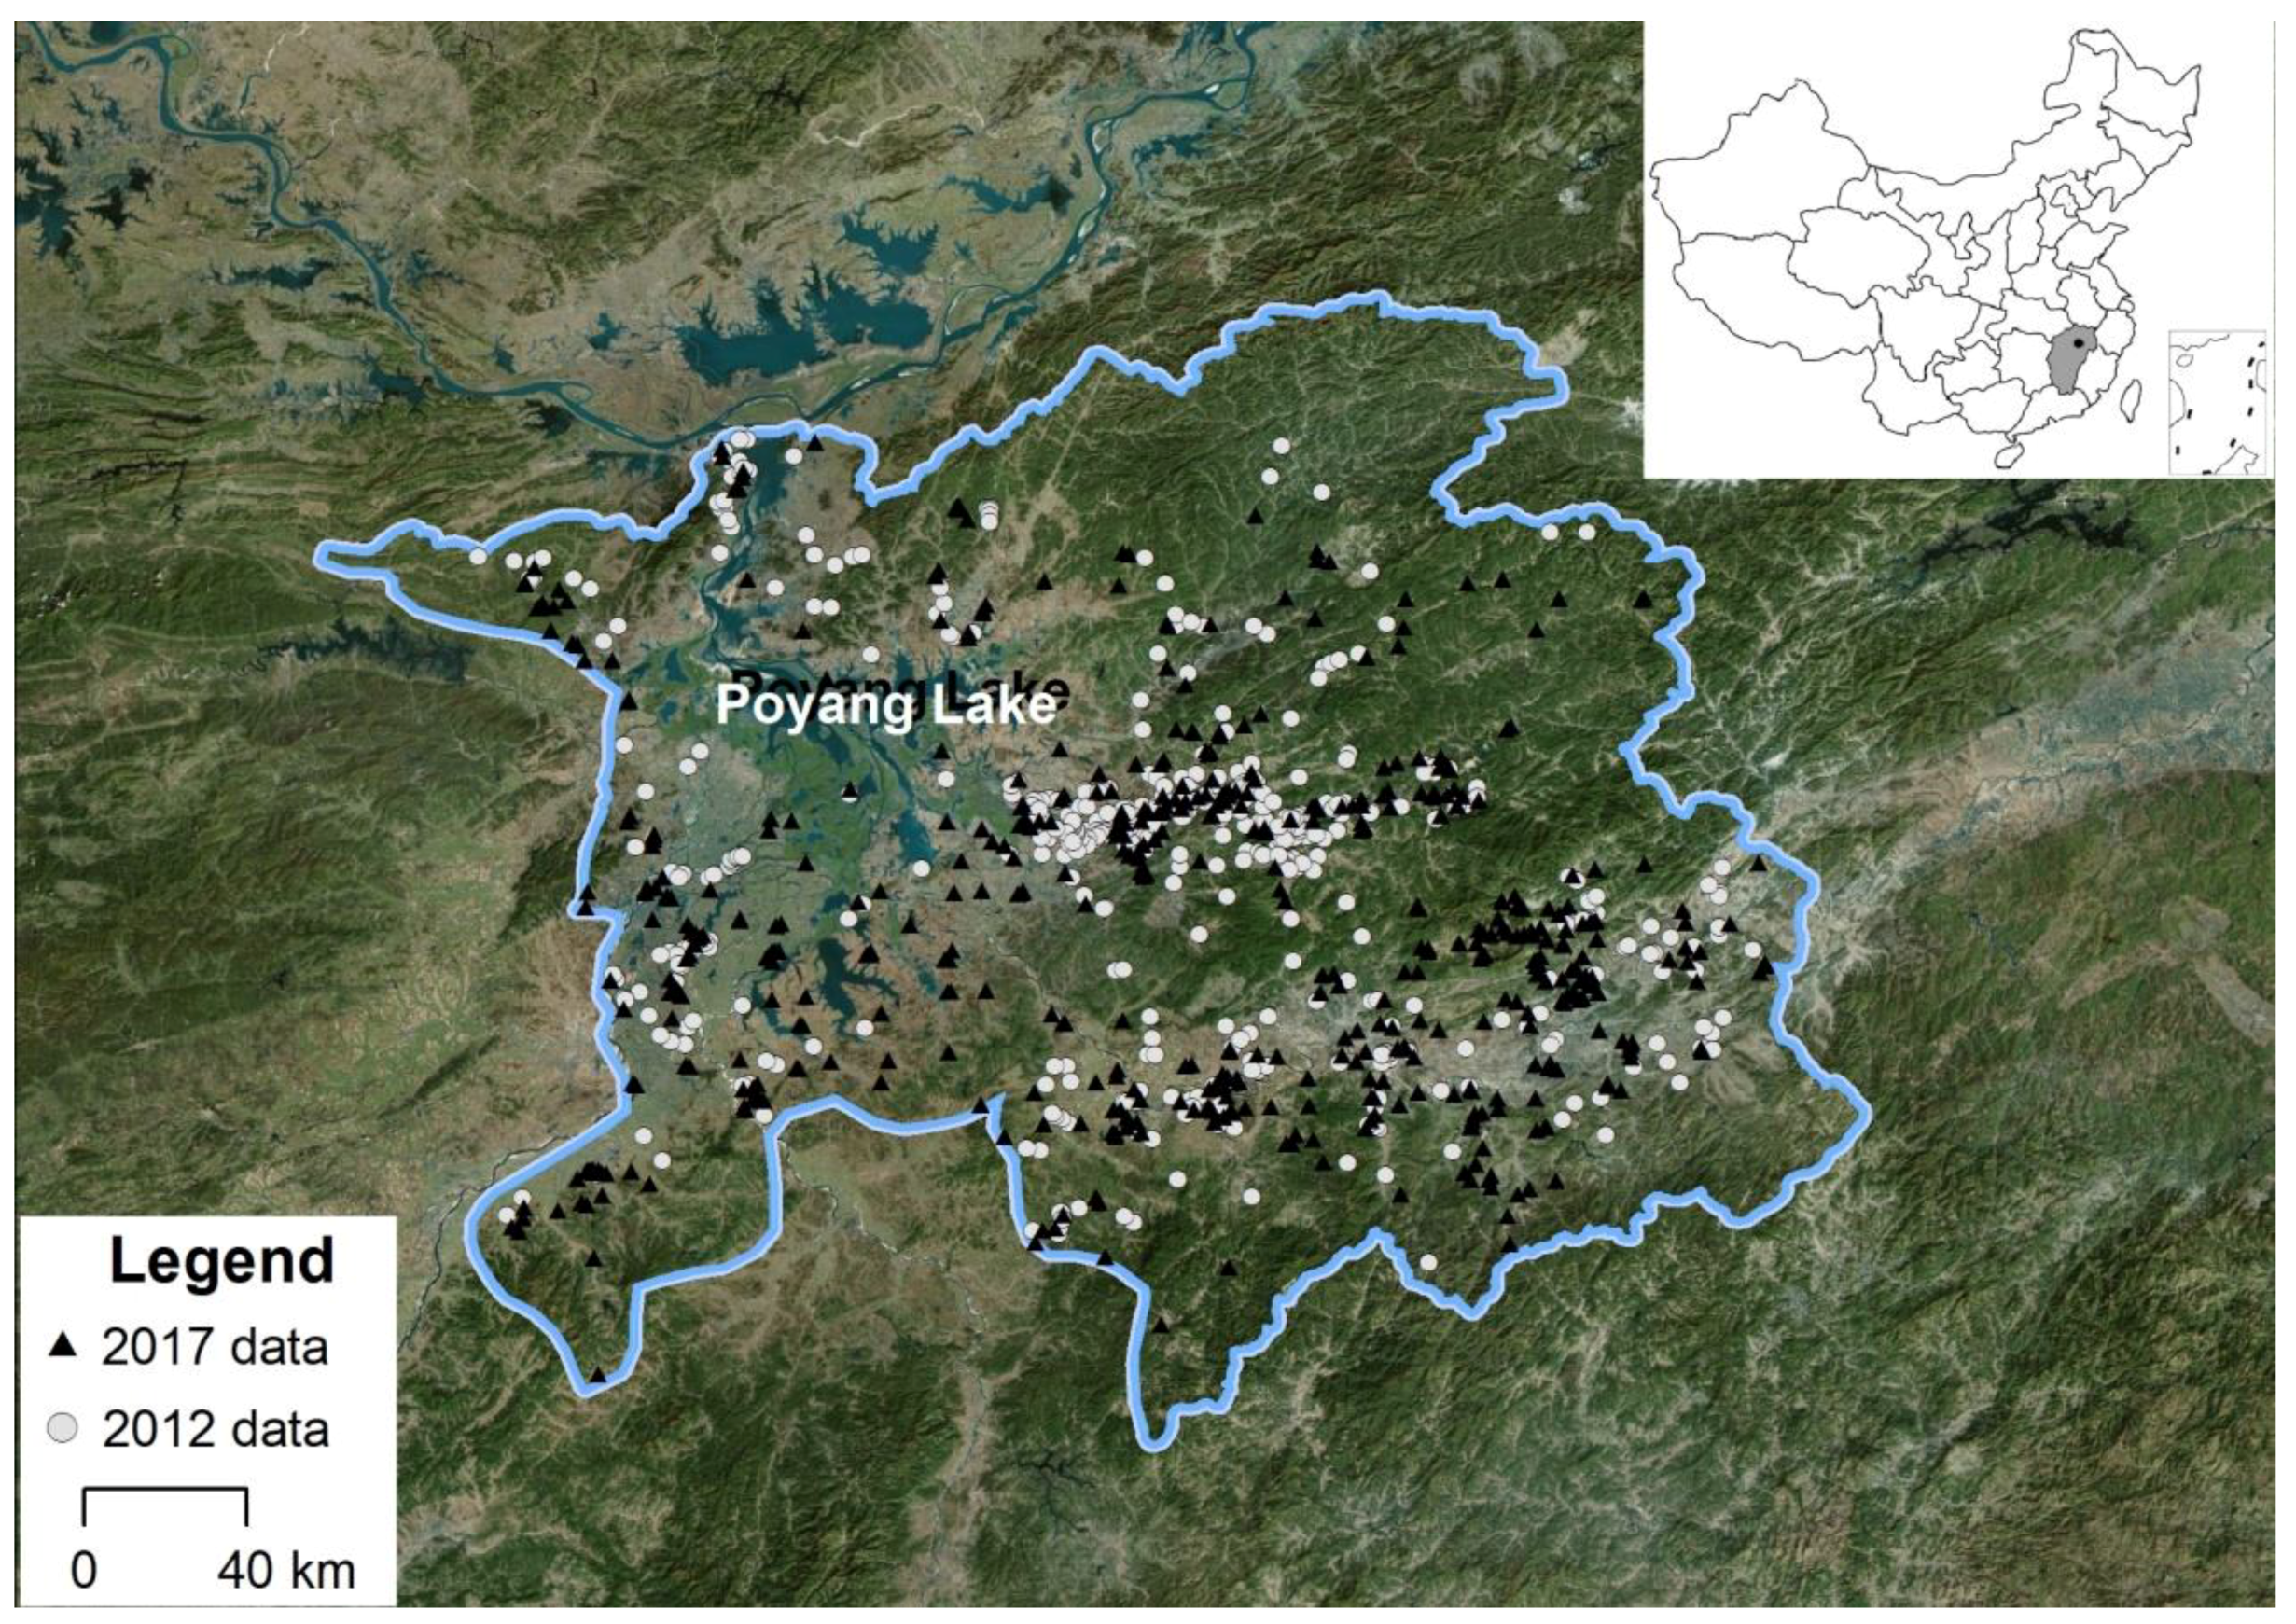
2.1. Study Area

The Poyang Lake Basin is on the south bank of the middle reach of the Yangtze River. It is in Jiangxi province, in the monsoon region of eastern China. It has a subtropical climate with an average annual precipitation of 1341 to 1940 mm and an average annual temperature of 11.6–19.6 °C. The soil types in this region can be divided into eight subtypes based on Chinese soil genetic classification, namely red earth, yellow earth, mountain meadow soil, mountain yellow brown soil, purple soil, lime soil, alluvial soil, and paddy soil. Among them, red earth, paddy soil, and yellow earth dominate, accounting for 56%, 12%, and 10% of the total area, respectively. The composition of the Poyang Lake water system is complex. Besides the Poyang Lake itself, there are various rivers such as Xiushui, Raohe, Xinjiang, Fuhe, the five reaches of the Ganjiang River, etc.
The study area covered most of Poyang Lake Basin and is specifically composed of three sub-basins with a total area of 512.19 hectares. The geographical delimitation is 27.50°–30.07° N and 115.18°–118.60° E. Soil parent material types mainly include quaternary red clay, acid crystal rock weathering, and red sandstone weathering. The location of the study area is given in Figure 1.

2.2. Data Sources

The data of N-fertilizer inputs in the study area, Jiangxi province, and China were collected in the government statistical yearbooks of Jiangxi and China (2013–2017), respectively. The average pH values of precipitation in Jiangxi province were extracted from the Monthly Report of Environmental Quality in Jiangxi Province (http://www.jxepb.gov.cn). Landscape factors were calculated based on the DEM downloaded from Geospatial Data Cloud (http://www.gscloud.cn). Water system data was downloaded from the National Catalogue Service for Geographic Information (http://www.webmap.cn).

2.3. Soil Sampling and Analysis

The soil sampling was conducted in the croplands; 507 and 503 composite soil samples were collected in 2012 and 2018, respectively. All the sampling locations were planned in the center of typical, large agricultural land parcels. Each soil sample was composed by mixing five subsamples collected randomly within 10 m of the planned location. Soil subsamples were collected at depths of 0–20 cm. All soil samples were air-dried (72 h), ground, and sieved through 2 mm mesh sieves for further analysis. Soil pH was measured in a soil slurry (1:2.5, soil: distilled water) using a pH meter.

2.4. Statistical Analysis

The experimental soil pH data was analyzed via descriptive statistics, one-way analyses of variance (ANOVA), and Pearson’s correlation analyses. All statistical analyses and figures were performed and constructed using SPSS ver. 19.0 (SPSS Inc., Chicago, IL, USA) and SigmaPlot ver. 12.5 (Systat Software Inc., San Jose, CA, USA). The spatial distribution was interpolated by IDW (Inverse Distance Weighted) using ArcGIS software 10.2 (ESRI, 2009, Redlands, CA, USA). Terrain factors and water densities were calculated based on DEM and water system data of the study area using ArcGIS software. Water densities were represented by line density, which is the total length of river channel per unit area.

3. Results and Discussion

3.1. Descriptive Statistics of Soil pH

Table 1 shows the descriptive statistics of soil pH values on the two sampling dates. The average topsoil pH values in 2012 and 2018 were 5.06 and 4.96, respectively. Soil pH ranged from 3.96 to 7.95 in 2012, and from 3.34 to 8.19 in 2018, with most samples being acidic (pH < 7) in both sets of data. Compared with soils in other regions where soil acidification has occurred in China, such as topsoil in the Yangtze River Delta region (with pH ranging from 5.72 to 6.80 during 1980 to 2015) [21] and topsoil in three cities of central subtropical China (with the average pH of 5.30 in 2014) [23], pH values in the study area were lower. The soil pH values in 2012 and 2018 in this study showed kurtosis values greater than zero, which suggests a steeper than normal distribution of the pH values in the soil samples. Furthermore, the skewness values recorded for pH were greater than one, indicating right-handed skewness and leptokurtic kurtosis. Soil pH is not a homogeneous value in time and space [13,24]. According to the classification standard proposed by Nielsen and Bouma [25], the variations in soil pH in 2012 and 2018 were moderate, with coefficients of variation (CV) of 10.47% and 11.29% and standard deviations (SD) of 0.53 and 0.56. Similar results were also reported by Li et al. [26] for moderate variability of soil pH.

3.2. Temporal Dynamics of Soil pH

Soil acidification is a very slow process under natural conditions [27], and an acidification trend in soil is commonly regarded as undesirable [28]. Nevertheless, the two soil datasets in our study showed a significant decline (p < 0.05) of 0.1 pH units over the past six years (0.017 pH unit yr−1), indicating that soil acidification occurred in the study area. This is in line with the early reports by Li et al. [29] and Wen et al. [30] that soil pH values declined near Poyang Lake and in Jiangxi province over the past decades. Compared with the forest soil acidification rate in China (about 0.018 pH unit yr–1) [31], the rate in our study is almost the same.
To further investigate the downward shift process and grasp the details of the change, soil samples were equally spaced and divided into five groups based on pH values (A: < 4.5, B: 4.5–5.0, C: 5.0–5.5, D: 5.5–6.0, E: > 6.0). The difference between sample numbers in the five groups between the two dates is given in Figure 2. As shown, the number of samples in the five groups clearly differed, and the pH values of most samples were concentrated in group B (4.5–5.0). Specifically, 49.90% of samples in 2012 and 53.35% of samples in 2018 fell into this group, indicating strong acidity in the soils of the study area. Zhu et al. [32] also found that acidic soils with a pH of 4.5–5.5 dominated in cultivated land, paddyfield, and dry land during 2005–2012 in Jiangxi province. The percentage of soil samples that fell into group C (5.0–5.5) was also relatively high, with 30.57% and 24.67% in 2012 and 2018, respectively. The number of soil samples with pH values exceeding 6.0 was the least, with 4.93% of samples in 2012 and 4.59% in 2018 falling into this group. The soil samples exhibited a clear uptrend in the groups of pH < 4.5 and 4.5–5.0 from 2012 to 2018. From 2012 to 2018, the percentage of samples with pH < 4.5 increased from 6.31% to 11.47%, and the percentage of samples with pH 4.5–5.0 increased from 49.90% to 53.35%. In contrast, the percentage of soil samples with pH values ranging from 5.0 to 6.0 decreased over the past six years. Specifically, the percentage of samples with a pH of 5.0–5.5 decreased from 30.57% to 24.67%, and those with a pH of 5.5–6.0 decreased from 8.28% to 5.93%, exhibiting an overall shift of soil pH from the higher values (5.0–6.0) to the lower values (<5.0). Similar results regarding the number of soil samples with different acidity levels over time have been found in other regions [21], with the percentage of soil samples with pH values exceeding 6.0 being low and a minor changing scale over the period from 2012 to 2018.
It should be noted that most literature regarding soil acidification was based on pH data at different times and differing in both location and record numbers (i.e., unpaired data) [31]. To compare the differences of pH values in soil samples with the same spatial location in the two datasets, samples with the shortest distance within 5 km in 2012 and 2018 were paired and assumed to have the same location in our study. In total, 280 samples were paired and the subtractions between the pH values in 2012 and those in 2018 are shown in Figure 3. The number of samples with a subtraction value higher than zero (N = 114) was smaller than the number with a subtraction value lower than zero (N = 166), indicating that pH values decreased in most paired samples. The average subtraction of pH (2018) > pH (2012) was 0.50, slightly lower than that (–0.51) of pH (2018) < pH (2012).

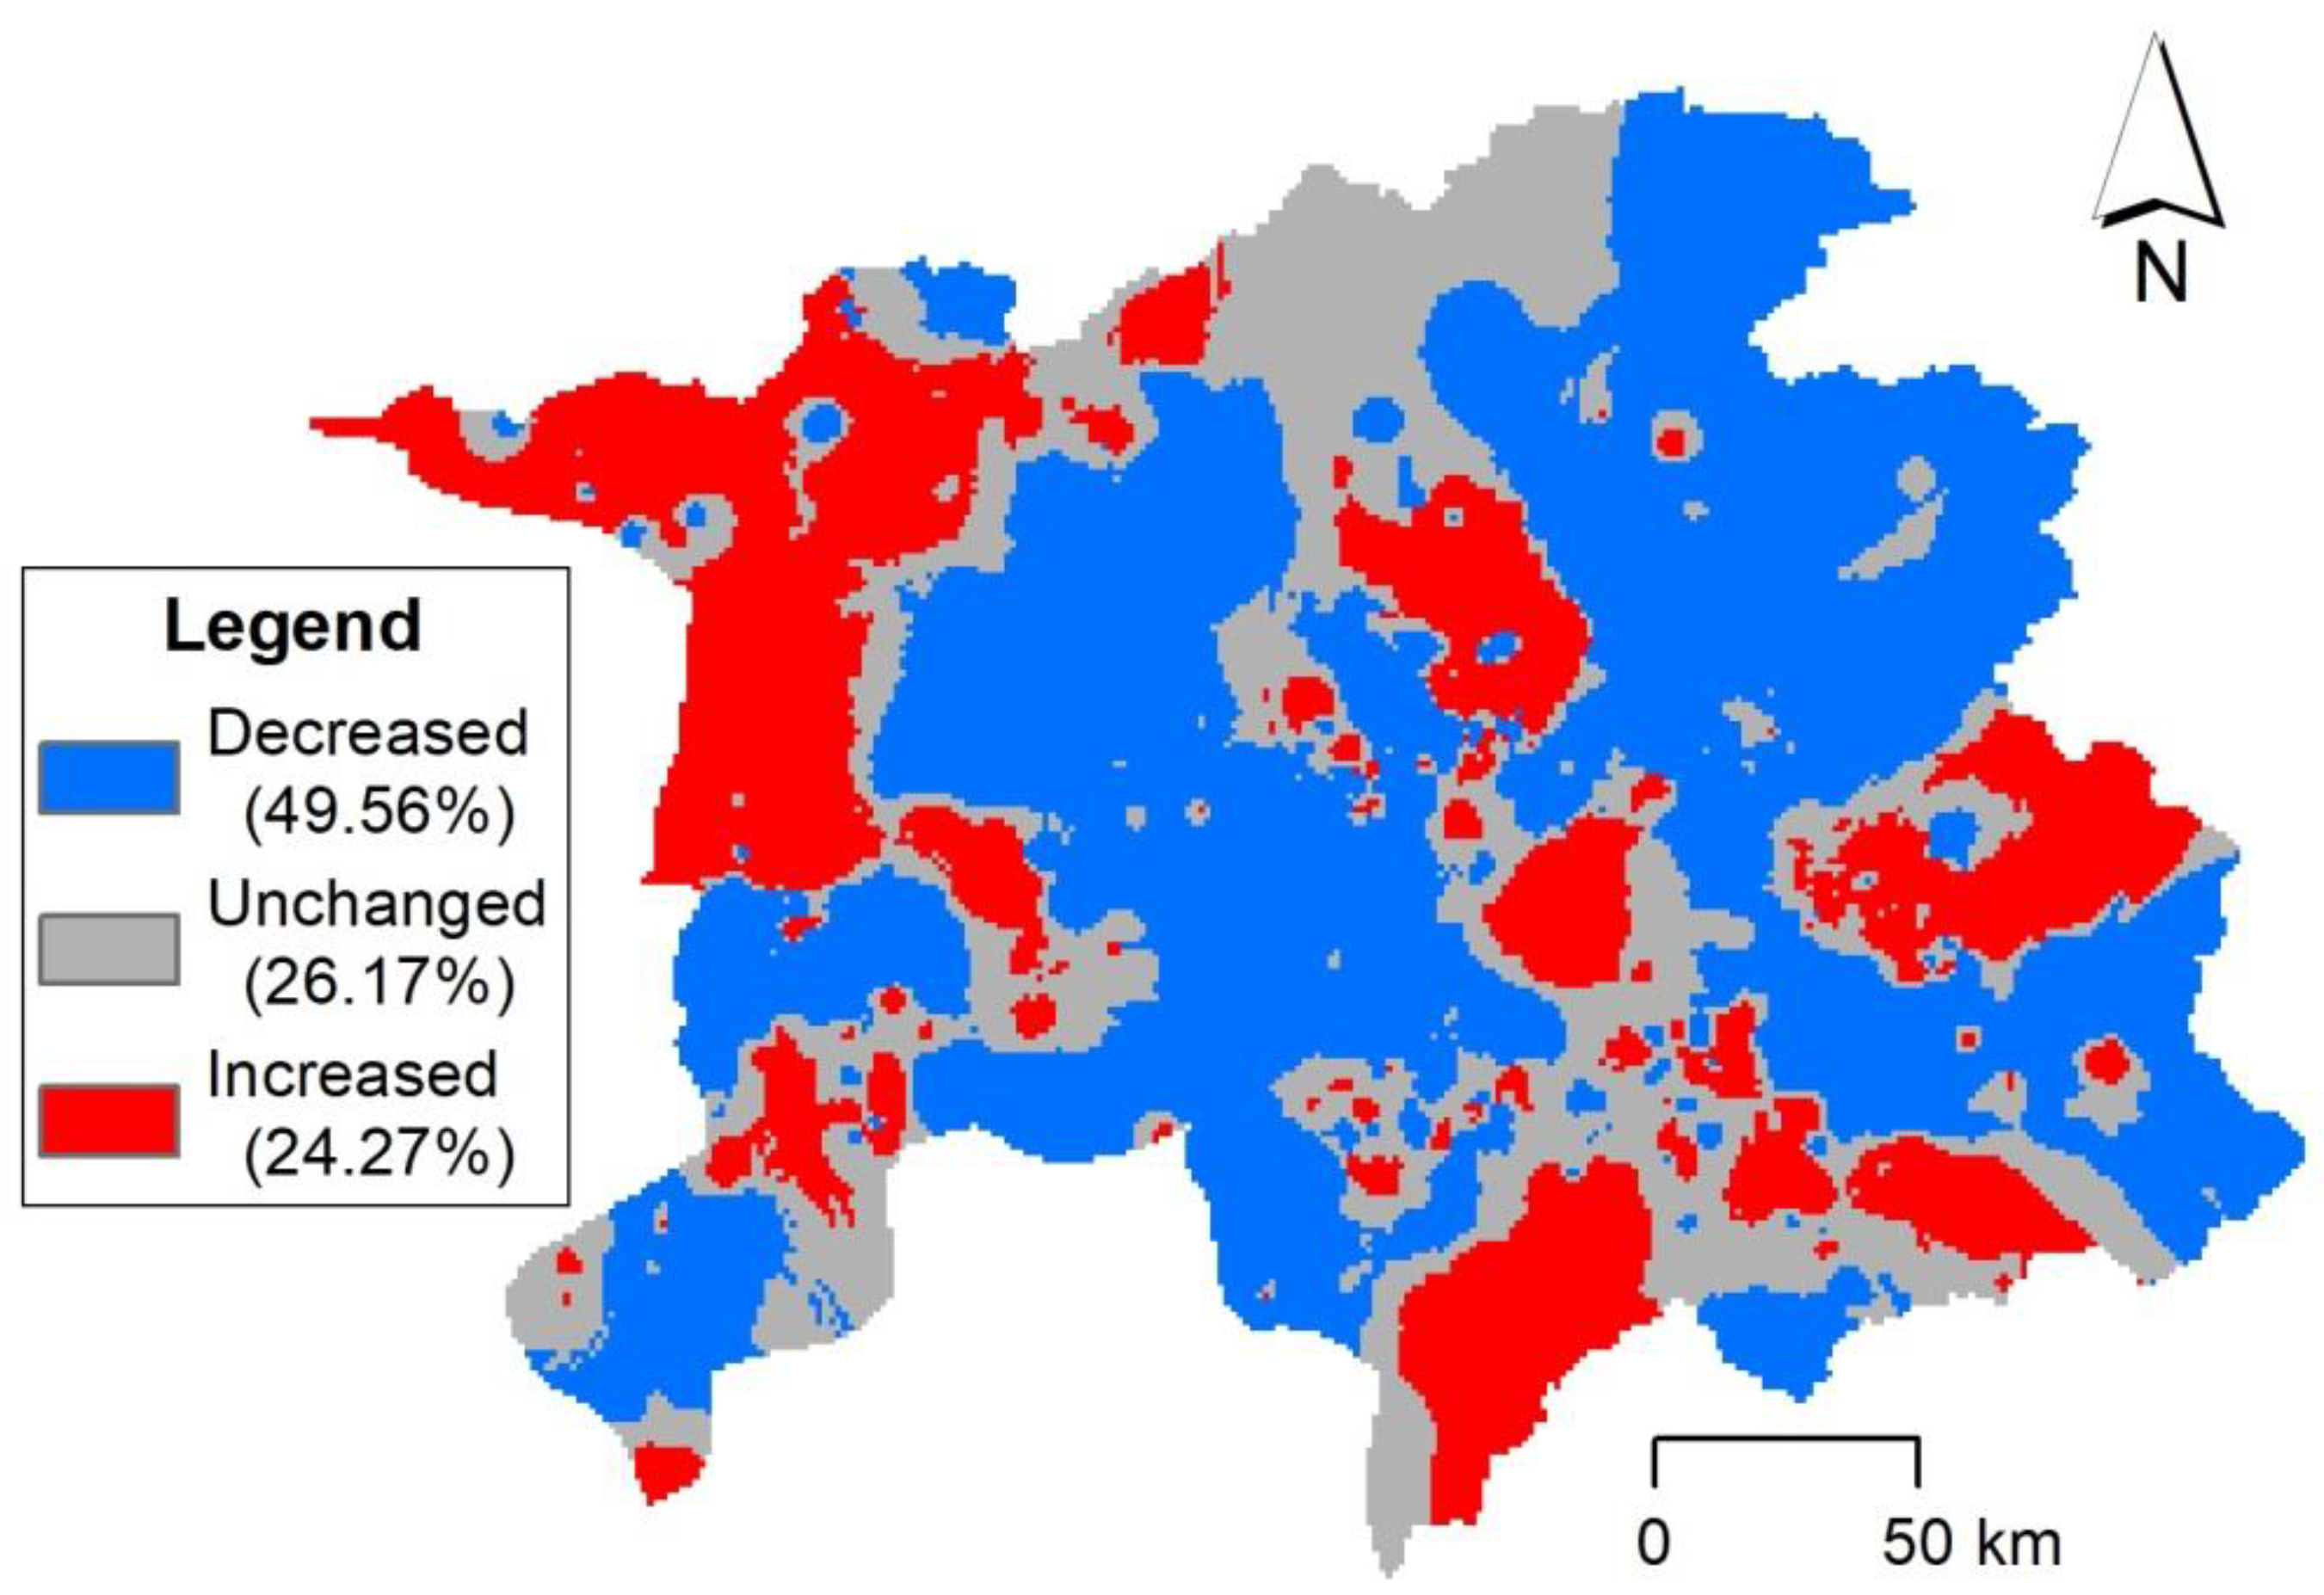
3.3. Spatial Distribution Patterns of Soil pH and Identification of Areas with Clearly Changed pH

The distribution of soil pH across a large geographical space is determined by different environmental factors [33,34] and thus shows different characteristics. The spatial distribution patterns of soil pH in 2012 and 2018 are presented in Figure 4. Overall, the distribution patterns of pH from the two sampling dates were similar. The soils with a pH ranging from 4.5–5.0 in the two datasets covered most of the study area, and the soils with a pH of 5.0–5.5 dominated in the northwestern and southeastern portions of the study area. However, local details of pH spatial distribution patterns differed among the two datasets. In 2012, areas with soil pH values lower than 4.5 were small and scattered. Soils with pH values exceeding 5.5 were mainly distributed in the central and eastern areas. In comparison, areas with soil pH < 4.5 expanded and were mainly concentrated on the north central part of the study area in 2018. Meanwhile, areas with soil pH values ranging from 5.5 to 6.0 shifted to the extreme northwestern part of the study area. Different spatial distribution patterns of soil pH in the same scope but with various sampling dates were also reported in the other regions [21].
To identify the clearly changed pH areas across the study area, the spatial pattern of soil pH in 2012 was subtracted from that in 2018. Areas with a subtraction value (Δ pH) exceeding 0.1 or lower than –0.1 were assumed to be notably changed. A similar method was successful in detecting changes in soil environmental parameters in the lower Changjiang plain, China [35]. The spatial distribution of the clearly changed pH is shown in Figure 5. Overall, zones with clearly decreased soil pH (49.56% of the total area) covered most of the study area, indicating a decreasing trend of soil pH values over the last six years. Nevertheless, 24.27% of the study area showed elevated pH values. They were mainly distributed in the northwestern and south-central areas. Unchanged areas accounted for 26.17% of the total area and had a banded distribution in the north-south direction. This result indicated that pH changes were highly variable across the study area. The spatial distribution of pH change can be used in the fertilizer recommendation strategy [13].

3.4. Soil pH Change Among Different Terrain Conditions, Land use Types, Soil Types, and Water Densities

Terrain attributes act as soil forming factors and, therefore, are related to soil forming processes and their properties [20]. The pH value showed the same trend, with a significant correlation to elevation only at the topsoil. The correlations between soil pH value and main terrain factors including elevation, aspect, and slope are given in Table 2. Across the entire study area, we found a significant correlation (p < 0.05) between soil pH and aspect, while elevation and slope showed no significant correlation with pH value. This indicates that aspect exerts a relatively strong effect on soil pH in this area. Our result was not in line with some earlier literature [36], which found that a significant correlation exists between pH values and elevation at the topsoil. Samples collected in the same basin with no significant change of elevation may weaken the correlation of soil pH and elevation in our study. Similarly, Fang et al. [37] and Tu et al. [38] also concluded the correlation of soil pH and elevation did not exhibit statistical significance (p > 0.05).
The effects of land use types and environmental factors, including soil types and water densities, on soil pH values were also analyzed and are presented in Figure 6. Among different land use types (Figure 6A), soils in irrigable land had significantly higher pH values (5.76). The average pH value of soil in dryland was 5.00, followed by that in paddyfield (4.94) and garden plot (4.49). Filippi et al. [17] also found a more pronounced acidification trend under non-irrigated land uses than the other land uses. However, the differences in pH values among dryland, paddyfield, and garden plot were not significant at p < 0.05. Soil pH changes across the study area in different soil types are shown in Figure 6B. Different types of soil with various parent materials play a vital role in modifying soil buffering systems and can result in divergent pH values [39]. Considering the average pH values, the following order was observed in different soil types: fluvo-aquic soils (5.14) > red earths (4.97) > paddy soils (4.93) > lakes and reservoirs (4.83). Nevertheless, no significant differences were observed among the four soil types at p < 0.05 and as tested by ANOVA. The difference of soil pH values in different water densities is given in Figure 6C. Overall, pH values tended to decrease with increasing water densities. The average soil pH values in the water density ranges of 6.27–19.94 and 64.49–108.19 were 5.03 and 4.82, respectively. ANOVA showed that pH values in the water density range of 6.27–19.94 were significantly higher than the other water densities, implying that low water density contributed to elevated pH values. Lardner et al. [40] also reported that a highly significant interaction effect exists between soil pH and soil water content.

3.5. Relationships of Soil pH Change with N-Fertilizer Inputs and Acidic Precipitation

Moderate levels of N-fertilization can stimulate plant nitrogen uptake and growth, but high N loading can cause nitrate loss and base cation depletion [41]. The effects of N addition on soil acid buffering capacity and acidification rates have been well documented [42,43,44]. Generally, soil H+ is mainly derived from acid deposition, microbial decomposition of organic matter, and soil nitrification [45]. Long-term N input increases NH4+ and H+ concentrations in soil solutions via enhanced N mineralization and nitrification leading to the decrease of soil pH values [46]. The data of N-fertilizer application amounts in the cultivated land of the study area, Jiangxi province, and China in 2017 was extracted from the Jiangxi statistical yearbook and China statistical yearbook. The statistical figures of N-fertilizer application rates are given in Figure 7.
As shown, N-fertilizer application rates in cultivated land decreased from 2013 to 2017. Specifically, they decreased from 127.00 kg/hm2 in 2012 to 117.94 kg/hm2 in 2018 in the study area. In the past five years, N-fertilizer application rates also decreased by 10.78% and 7.21% in Jiangxi province and China, respectively, showing the effect of the policy of rational fertilization in China. Compared with Jiangxi province and China, N-fertilizer application rates in the study area are clearly lower. The N-fertilizer application rates in the study area accounted for 89.72%–95.53% and 70.08–71.61% of the average values in Jiangxi province and China, respectively, during 2013–2017. This indicates that N-fertilizer application rates in the study area were relatively lower, and the assumption of N-fertilizer input being among the main causes of soil acidification is strengthened. A similar result was also reported by Damgaard et al. [47] who found no significant effect of N deposition on soil pH on wet heathlands. Li et al. [26] certified that soil pH decreased significantly when nitrogen fertilizer rates exceeded 200 kg/ha, whereas only small changes in pH were observed when nitrogen fertilizer rates were below that threshold. Yang et al. [48] also confirmed that a high nitrogen fertilizer application rate can accelerate soil acidification, while low and moderate nitrogen treatments showed non-significant effects upon soil pH. Moreover, the initial soil pH in our study was more concentrated at 4.5–5.0, and the effect of N addition on soil acidification was weakened by the low initial soil pH [13,44,49].
Recent syntheses suggest that precipitation also influenced the response of soil pH [44] and acid deposition decreased soil pH [50,51,52]. The monthly average pH values of precipitation each month during 2013 to 2017 in Jiangxi province are summarized in Figure 8. Overall, pH values tended to increase from January to December of each year. Elevated pH values were also found during the past years when compared with the pH change curves of different years. The monthly average pH values ranged from 4.78–5.66, and the yearly average pH values had a range of 5.13–5.38 over the past five years. According to the China Environmental Status Bulletin [53], the yearly average pH value of precipitation in China was 5.58, and the study area was divided into areas with severe acid rain. The large amount of precipitation with low pH values was an important factor that influenced soil pH.

4. Conclusions

This paper provides a comprehensive assessment of soil acidification and detects potential factors of soil pH change in croplands near Poyang Lake at the basin scale. A significant decline (p < 0.05) in soil pH values was found during 2012–2018. Although the spatial distribution of pH at the two sampling dates was similar, local details were different, and areas with lower pH values expanded in 2018. Among the potential factors, soil pH showed a significant difference (p < 0.05) between various aspect, land use types, and water densities. Nevertheless, the difference between the four soil types was not significant. N-fertilizer application was proved not to be one of the most important factors that control soil pH in the study area. The large amount of precipitation with low pH values plays an important role in the control of soil pH change. This suggests that the role of environmental factors seems to be more evident in influencing soil acidification when compared to human activities in the study. However, the relationship between the influencing factors is complex, and in most cases, there will be interactions between the factors. Some environmental factors were influenced by industrial activities (e.g., the pH value of precipitation). To slow down the soil acidification rate of cropland in Poyang Lake Basin, the local government must continue to work hard to reduce the emission of acid pollutants. Further, we will conduct a more in-depth study on the influence of different types of human activities on soil acidification.

Author Contributions

Methodology, Z.B.; software, X.L. (Xiaoyang Liu); resources, H.S. and X.L. (Xiaocai Liu); writing—original draft preparation, X.L. (Xiaoyang Liu); writing—review and editing, B.Y. and D.Y.; funding acquisition, H.S. and B.Y. All authors have read and agreed to the published version of the manuscript.

Funding

This research work was funded by the National Key Research Program of China (2018YFC1800505, 2018YFF0213401, 2018YFC1800203), the National Natural Science Foundation of China (41701607, U1810107) and the environmental impact assessment program of the Ministry of Environmental Protection of China (5014004).

Acknowledgments

The authors are extremely grateful to the anonymous reviewers for their insightful comments and suggestions.

Conflicts of Interest

The authors declare no conflict of interest.

References

  1. Falkengren-Grerup, U.; Brink, D.T.; Brunet, J.; Lund, U.; Department, O.B.; Lunds, U.; Biologiska, I. Land use effects on soil N, P, C and pH persist over 40–80 years of forest growth on agricultural soils. For. Ecol. Manag. 2006, 225, 74–81. [Google Scholar] [CrossRef]
  2. Bhandari, K.B.; West, C.P.; Acosta-Martinez, V. Assessing the role of interseeding alfalfa into grass on improving pasture soil health in semi-arid Texas High Plains. Appl. Soil Ecol. 2020, 147, 103399. [Google Scholar] [CrossRef]
  3. Bi, J.; Blanco, J.A.; Seely, B.; Kimmins, J.P.; Ding, Y.; Welham, C. Yield decline in Chinese-fir plantations: A simulation investigation with implications for model complexity. Can. J. For. Res. 2007, 37, 1615–1630. [Google Scholar] [CrossRef]
  4. Darilek, J.L.; Huang, B.; Wang, Z.; Qi, Y.; Zhao, Y.; Sun, W.; Gu, Z.; Shi, X. Changes in soil fertility parameters and the environmental effects in a rapidly developing region of China. Agric. Ecosyst. Environ. 2009, 129, 286–292. [Google Scholar] [CrossRef]
  5. Bhandari, K.B.; West, C.P.; Acosta-Martinez, V.; Cotton, J.; Cano, A. Soil health indicators as affected by diverse forage species and mixtures in semi-arid pastures. Appl. Soil Ecol. 2018, 132, 179–186. [Google Scholar] [CrossRef]
  6. Russenes, A.L.; Korsaeth, A.; Bakken, L.R.; Dörsch, P. Spatial variation in soil pH controls off-season N2O emission in an agricultural soil. Soil Biol. Biochem. 2016, 99, 36–46. [Google Scholar] [CrossRef]
  7. Hansen, M.; Bang-Andreasen, T.; Sørensen, H.; Ingerslev, M. Micro vertical changes in soil pH and base cations over time after application of wood ash on forest soil. For. Ecol. Manag. 2017, 406, 274–280. [Google Scholar] [CrossRef]
  8. Guo, J.H.; Liu, X.J.; Zhang, Y.; Shen, J.L.; Han, X.W.; Zhang, W.F.; Christie, P.; Goulding, K.W.T.; Vitousek, P.M.; Zhang, F.S. Significant acidification in major Chinese croplands. Science 2010, 327, 1008–1010. [Google Scholar] [CrossRef] [Green Version]
  9. Zhu, Q.; Liu, X.; Hao, T.; Zeng, M.; Shen, J.; Zhang, F.; De Vries, W. Modeling soil acidification in typical Chinese cropping systems. Sci. Total Environ. 2018, 613, 1339–1348. [Google Scholar] [CrossRef] [Green Version]
  10. Mao, Q.; Lu, X.; Zhou, K.; Chen, H.; Zhu, X.; Mori, T.; Mo, J. Effects of long-term nitrogen and phosphorus additions on soil acidification in an N-rich tropical forest. Geoderma 2017, 285, 57–63. [Google Scholar] [CrossRef]
  11. Zou, X.; Xiao, X.; Zhou, H.; Chen, F.; Zeng, J.; Wang, W.; Feng, G.; Huang, X. Effects of soil acidification on the toxicity of organophosphorus pesticide on Eisenia fetida and its mechanism. J. Hazard. Mater. 2018, 359, 365–372. [Google Scholar] [CrossRef] [PubMed]
  12. Hong, S.; Piao, S.; Chen, A.; Liu, Y.; Liu, L.; Peng, S.; Sardans, J.; Sun, Y.; Peñuelas, J.; Zeng, H. Afforestation neutralizes soil pH. Nat. Commun. 2018, 9, 520–527. [Google Scholar] [CrossRef] [PubMed] [Green Version]
  13. Minasny, B.; Hong, S.Y.; Hartemink, A.E.; Kim, Y.H.; Kang, S.S. Soil pH increase under paddy in South Korea between 2000 and 2012. Agric. Ecosyst. Environ. 2016, 221, 205–213. [Google Scholar] [CrossRef]
  14. Russell, A.E.; Laird, D.A.; Parkin, T.B.; Mallarino, A.P. Impact of nitrogen fertilization and cropping system on carbon sequestration in midwestern Mollisols. Soil Sci. Soc. Am. J. 2005, 69, 413–422. [Google Scholar] [CrossRef] [Green Version]
  15. Zhou, J.; Xia, F.; Liu, X.; He, Y.; Xu, J.; Brookes, P.C. Effects of nitrogen fertilizer on the acidification of two typical acid soils in South China. J. Soil Sediment. 2014, 14, 415–422. [Google Scholar] [CrossRef]
  16. Ou, Y.; Rousseau, A.N.; Wang, L.; Yan, B. Spatio-temporal patterns of soil organic carbon and pH in relation to environmental factors—A case study of the Black Soil Region of Northeastern China. Agric. Ecosyst. Environ. 2017, 245, 22–31. [Google Scholar] [CrossRef]
  17. Filippi, P.; Cattle, S.R.; Bishop, T.F.A.; Odeh, I.O.A.; Pringle, M.J. Digital soil monitoring of top- and sub-soil pH with bivariate linear mixed models. Geoderma 2018, 322, 149–162. [Google Scholar] [CrossRef]
  18. Ji, C.; Yang, Y.H.; Han, W.X.; He, Y.F.; Smith, J.; Smith, P. Climatic and edaphic controls on soil pH in alpine grasslands on the Tibetan Plateau, China: A quantitative analysis. Pedosphere 2014, 24, 39–44. [Google Scholar] [CrossRef]
  19. Tsiknia, M.; Paranychianakis, N.V.; Varouchakis, E.A.; Nikolaidis, N.P. Environmental drivers of the distribution of nitrogen functional genes at a watershed scale. FEMS Microbiol. Ecol. 2015, 91. [Google Scholar] [CrossRef] [Green Version]
  20. Hao, Y.J.; Chang, Q.R.; Li, L.H.; Wei, X.R. Impacts of landform, land use and soil type on soil chemical properties and enzymatic activities in a Loessial Gully watershed. Soil Res. 2014, 52, 453–462. [Google Scholar] [CrossRef]
  21. Xie, E.; Zhao, Y.; Li, H.; Shi, X.; Lu, F.; Zhang, X.; Peng, Y. Spatio-temporal changes of cropland soil pH in a rapidly industrializing region in the Yangtze River Delta of China, 1980–2015. Agric. Ecosyst. Environ. 2019, 272, 95–104. [Google Scholar] [CrossRef]
  22. Yang, Y.; Ji, C.; Ma, W.; Wang, S.; Wang, S.; Han, W.; Mohammat, A.; Robinson, D.; Smith, P. Significant soil acidification across northern China’s grasslands during 1980s–2000s. Glob. Chang. Biol. 2012, 18, 2292–2300. [Google Scholar] [CrossRef]
  23. Zhu, Q.; Zhu, H.; Chen, C.; Xu, C.; Huang, D. Effects of soil acidification and liming on the phytoavailability of cadmium in paddy soils of central subtropical China. Environ. Pollut. 2016, 219, 99–106. [Google Scholar] [CrossRef] [PubMed]
  24. Yang, J.; Hammer, R.D.; Blanchar, R.W. Microscale pH spatial distribution in the Ap horizon of Mexico silt loam. Soil Sci. 1995, 160, 371–375. [Google Scholar] [CrossRef]
  25. Nielsen, D.R.; Bouma, J. Soil Spatial Variability: Proceedings of a Workshop of the ISSS and the SSSA, Las Vegas, USA/Pdc296; Center Agricultural Pub and Document: Pudoc Wageningen, The Netherlands, 1985. [Google Scholar]
  26. Li, Q.; Li, B.; Li, Y.; Li, S.; Xiao, Y.; Zhao, B.; Wang, C.; Wang, Y.; Gao, X.; Bai, G.; et al. Soil acidification and its influencing factors in the purple hilly area of southwest China from 1981 to 2012. Catena 2019, 175, 278–285. [Google Scholar] [CrossRef]
  27. Chen, S.; Liang, Z.; Webster, R.; Zhang, G.; Zhou, Y.; Teng, H.; Hu, B.; Arrouays, D.; Shi, Z. A high-resolution map of soil pH in China made by hybrid modelling of sparse soil data and environmental covariates and its implications for pollution. Sci. Total Environ. 2019, 655, 273–283. [Google Scholar] [CrossRef] [PubMed]
  28. Helyar, K.R.; Hochman, Z.; Brennan, J.P. The problem of acidity in temperate area soils and its management. In National Soils Conference; Australian Society of Soil Science: Nedlands, Australia, 1988. [Google Scholar]
  29. Li, W.F.; Ye, Y.C.; Zhu, A.F.; Rao, L.; Sun, K.; Yuan, J.; Guo, X. Spatio-temporal Variation of pH in Cropland of Jiangxi Province in the Past 30 Years and Its Relationship with Acid Rain and Fertilizer Application. J. Nat. Resour. 2017, 32, 1942–1953. [Google Scholar]
  30. Wen, B.Y.; Yang, Z.F.; Hou, Q.Y.; Yang, X.Y.; Yin, G.S.; Zhong, C.D. The Relationship between Soil Acidification and Nitrogen Inputs in the Poyang Lake Area, Jiangxi Province, China. Geoscience 2011, 25, 562–568. [Google Scholar]
  31. Zhu, Q.; De Vries, W.; Liu, X.; Zeng, M.; Hao, T.; Du, E.; Zhang, F.; Shen, J. The contribution of atmospheric deposition and forest harvesting to forest soil acidification in China since 1980. Atmos. Environ. 2016, 146, 215–222. [Google Scholar] [CrossRef] [Green Version]
  32. Zhu, A.F.; Shao, H.; Zhang, L.H. Current Situation and Improvement Measures of Cultivated Land Soil Acidification in Jiangxi Province. Acta Agric. Jiangxi 2014, 26, 43–45. [Google Scholar]
  33. Slessarev, E.W.; Lin, Y.; Bingham, N.L.; Johnson, J.E.; Dai, Y.; Schimel, J.P.; Chadwick, O.A. Water balance creates a threshold in soil pH at the global scale. Nature 2016, 540, 567–569. [Google Scholar] [CrossRef] [PubMed]
  34. Hong, S.; Gan, P.; Chen, A. Environmental controls on soil pH in planted forest and its response to nitrogen deposition. Environ. Res. 2019, 172, 159–165. [Google Scholar] [CrossRef] [PubMed]
  35. Xia, X.; Yang, Z.; Yu, T.; Hou, Q.; Mutelo, A.M. Detecting changes of soil environmental parameters by statistics and GIS: A case from the lower Changjiang plain, China. J. Geochem. Explor. 2017, 181, 116–128. [Google Scholar] [CrossRef]
  36. Simon, A.; Dhendup, K.; Rai, P.B.; Gratzer, G. Soil carbon stocks along elevational gradients in Eastern Himalayan mountain forests. Geoderma Reg. 2018, 12, 28–38. [Google Scholar] [CrossRef]
  37. Fang, Q.; Hong, H.; Algeo, T.J.; Huang, X.; Sun, A.; Churchman, G.J.; Chorover, J.; Chen, S.; Liu, Y. Microtopography-mediated hydrologic environment controls elemental migration and mineral weathering in subalpine surface soils of subtropical monsoonal China. Geoderma 2019, 344, 82–98. [Google Scholar] [CrossRef]
  38. Tu, C.; He, T.; Lu, X.; Luo, Y.; Smith, P. Extent to which pH and topographic factors control soil organic carbon level in dry farming cropland soils of the mountainous region of Southwest China. Catena 2018, 163, 204–209. [Google Scholar] [CrossRef]
  39. Fabian, C.; Fabian, K.; Reimann, C.; Birke, M.; Baritz, R.; Haslinger, E. GEMAS: Spatial distribution of the pH of European agricultural and grazing land soil. Appl. Geochem. 2014, 48, 207–216. [Google Scholar] [CrossRef]
  40. Lardner, T.; George, S.; Tibbett, M. Interacting controls on innate sources of CO2 efflux from a calcareous arid zone soil under experimental acidification and wetting. J. Arid Environ. 2015, 122, 117–123. [Google Scholar] [CrossRef]
  41. Goulding, K.W.T.; Varennes, A. Soil acidification and the importance of liming agricultural soils with particular reference to the United Kingdom. Soil Use Manag. 2016, 32, 390–399. [Google Scholar] [CrossRef]
  42. Halada, U.; Hreško, J.; Cleveland, C.C.; Bowman, W.D.; Baron, J.S. Negative impact of nitrogen deposition on soil buffering capacity. Nat. Geosci. 2008, 1, 767–770. [Google Scholar]
  43. Lu, X.; Mao, Q.; Mo, J.; Gilliam, F.S.; Zhou, G.; Luo, Y.; Zhang, W.; Huang, J. Divergent responses of soil buffering capacity to long-term N deposition in three typical tropical forests with different land-use history. Environ. Sci. Technol. 2015, 49, 4072–4080. [Google Scholar] [CrossRef] [PubMed]
  44. Tian, D.; Niu, S. A global analysis of soil acidification caused by nitrogen addition. Environ. Res. Lett. 2015, 10, 24019. [Google Scholar] [CrossRef]
  45. Arnold, G.; Van Beusichem, M.L.; Van Diest, A. Nitrogen mineralization and H+ transfers in a Scots Pine (Pinus-Sylvestris L.) forest soil as affected by liming. Plant. Soil 1994, 161, 209–218. [Google Scholar] [CrossRef]
  46. Cai, J.; Luo, W.; Liu, H.; Feng, X.; Zhang, Y.; Zhang, Y.; Wang, R.; Xu, Z.; Jiang, Y. Precipitation-mediated responses of soil acid buffering capacity to long-term nitrogen addition in a semi-arid grassland. Atmos. Environ. 2017, 170, 312–318. [Google Scholar] [CrossRef]
  47. Damgaard, C.; Strandberg, M.; Kristiansen, S.M.; Nielsen, K.E.; Bak, J.L. Is Erica tetralix abundance on wet heathlands controlled by nitrogen deposition or soil acidification? Environ. Pollut. 2014, 184, 1–8. [Google Scholar] [CrossRef]
  48. Yang, X.; Ni, K.; Shi, Y.; Yi, X.; Zhang, Q.; Fang, L.; Ma, L.; Ruan, J. Effects of long-term nitrogen application on soil acidification and solution chemistry of a tea plantation in China. Agric. Ecosyst. Environ. 2018, 252, 74–82. [Google Scholar] [CrossRef]
  49. Kuzyakov, Y.; Razavi, B.S. Rhizosphere size and shape: Temporal dynamics and spatial stationarity. Soil Biol. Biochem. 2019, 135, 343–360. [Google Scholar] [CrossRef]
  50. White, C.; Dawod, A.; Cruickshank, K.; Gammack, S.; Cresser, M. Evidence for acidification of sensitive Scottish soils by atmospheric deposition. Water Air Soil Pollut. 1995, 85, 1203–1208. [Google Scholar] [CrossRef]
  51. White, C.C.; Cresser, M.S. Sensitivity of Scottish upland moorland podzols derived from sandstones and quartzites to acidification: The potential importance of the mobile anion effect. Water Air Soil Pollut. 1998, 103, 229–244. [Google Scholar] [CrossRef]
  52. Xu, H.; Demetriades, A.; Reimann, C.; Jiménez, J.J.; Filser, J.; Zhang, C.; GEMAS, P.T. Identification of the co-existence of low total organic carbon contents and low pH values in agricultural soil in north-central Europe using hot spot analysis based on GEMAS project data. Sci. Total Environ. 2019, 678, 94–104. [Google Scholar] [CrossRef]
  53. Ministry of Ecological Environment of the People’s Republic of China. China Environmental Status Bulletin; Ministry of Ecological Environment of the People’s Republic of China: Beijing, China, 2019; p. 20.
Figure 1. Study area and sampling locations in the Poyang Lake Basin.
Sustainability 12 03072 g001
Figure 2. Temporal dynamics of pH groups from 2012 to 2018. The samples were divided into five groups based on the following pH value ranges. A: < 4.5, B: 4.5–5.0, C: 5.0–5.5, D: 5.5–6.0, E: > 6.0.
Sustainability 12 03072 g002
Figure 3. Difference of pH values in paired soil samples. Soil samples collected in 2012 and 2018 were paired based on spatial location within 5 km of each other.
Sustainability 12 03072 g003
Figure 4. Spatial distribution of pH in 2012 and 2018.
Sustainability 12 03072 g004
Figure 5. Areas showing clear pH changes from 2012 to 2018. Unchanged refers to pH changes in the range of 0.1. Decreased and increased indicate pH changes over 0.1.
Sustainability 12 03072 g005
Figure 6. pH differences in various land use types, soil types, and water densities. (A) L1 represents dryland (N = 66), L2 represents paddyfield (N = 444), L3 represents irrigable land (N = 10), and L4 represents garden plot (N = 3). (B) S1 represents fluvo-aquic soils (N = 23), S2 represents paddy soils (N = 263), S3 represents red earths (N = 213), and S4 represents lakes and reservoirs (N = 8). (C) W1 represents 6.27–19.94 (N = 223), W2 represents 19.94–38.19 (N = 200), W3 represents 38.19–64.49 (N = 66), and W4 represents 64.49–108.19 (N = 34). Lowercase letters on the histogram represent significant differences (p < 0.05).
Sustainability 12 03072 g006
Figure 7. Comparison of N-fertilizer application rates between Jiangxi Province and China in cultivated land. Carbamide is the most frequently used N-fertilizer.
Sustainability 12 03072 g007
Figure 8. Average pH values of rain every month during 2013 and 2017 in Jiangxi Province. Data were extracted from the Monthly Report of Environmental Quality in Jiangxi Province.
Sustainability 12 03072 g008
Table 1. Descriptive statistics of soil pH in the study area.
YearNRangeAverage ValueSDKurtosisSkewnessCV (%)
20125073.96–7.955.060.536.832.0510.47
20185233.34–8.194.960.567.402.1011.29
Table 2. Correlation coefficients between pH and main terrain factors.
ParameterpHElevationCos (Aspect)Slope
pH1
Elevation0.0761
Cos (Aspect)0.106 *–0.041
Slope0.0780.719 **–0.0851
* Correlation is significant at the 0.05 level (2-tailed). ** Correlation is significant at the 0.01 level (2-tailed).

