Article

Ecological Suitability of Island Development Based on Ecosystem Services Value, Biocapacity and Ecological Footprint: A Case Study of Pingtan Island, Fujian, China

1
State Key Laboratory of Estuarine and Coastal Research, East China Normal University, Shanghai 200241, China
2
Third Institute of Oceanography, Ministry of Natural Resources, Xiamen 361005, China
*
Authors to whom correspondence should be addressed.
Sustainability 2020, 12(6), 2553; https://doi.org/10.3390/su12062553
Submission received: 14 February 2020 / Revised: 20 March 2020 / Accepted: 21 March 2020 / Published: 24 March 2020
(This article belongs to the Section Environmental Sustainability and Applications)

Abstract

:
The ecological environment and resource endowment of an island are more vulnerable compared to the mainland, and special assessment and measurement of the ecological suitability for development are significant. Pingtan Island (Fujian, China) was taken as a case study. Changes in ecosystem services value and the profit-and-loss balance between ecological footprint and biocapacity were assessed using land use/cover changes based on remote-sensing images taken in 2009, 2014 and 2017, and the ecological suitability of development was measured. Results show that island development led to a decrease in the ecosystem services value and an increase in ecological footprint and biocapacity. The key ecological factors restricting the scale of island development are topography, vegetation with special functions and freshwater. Biocapacity of islands can increase not only by changing from lower-yield land types to higher-yield construction land types but also by external investment. A new measurement framework was proposed that simply and clearly reveals the ecological suitability of island development and the underlying key constraints.

Highlights:

  • A new measurement framework for the ecological suitability of island development based on ecosystem services value, ecological footprint and biocapacity was proposed.
  • Marine ecosystems were considered in calculations of ecosystem services value and biocapacity.
  • The key ecological factors restricting the scale of island development are topography, vegetation with special functions and freshwater.
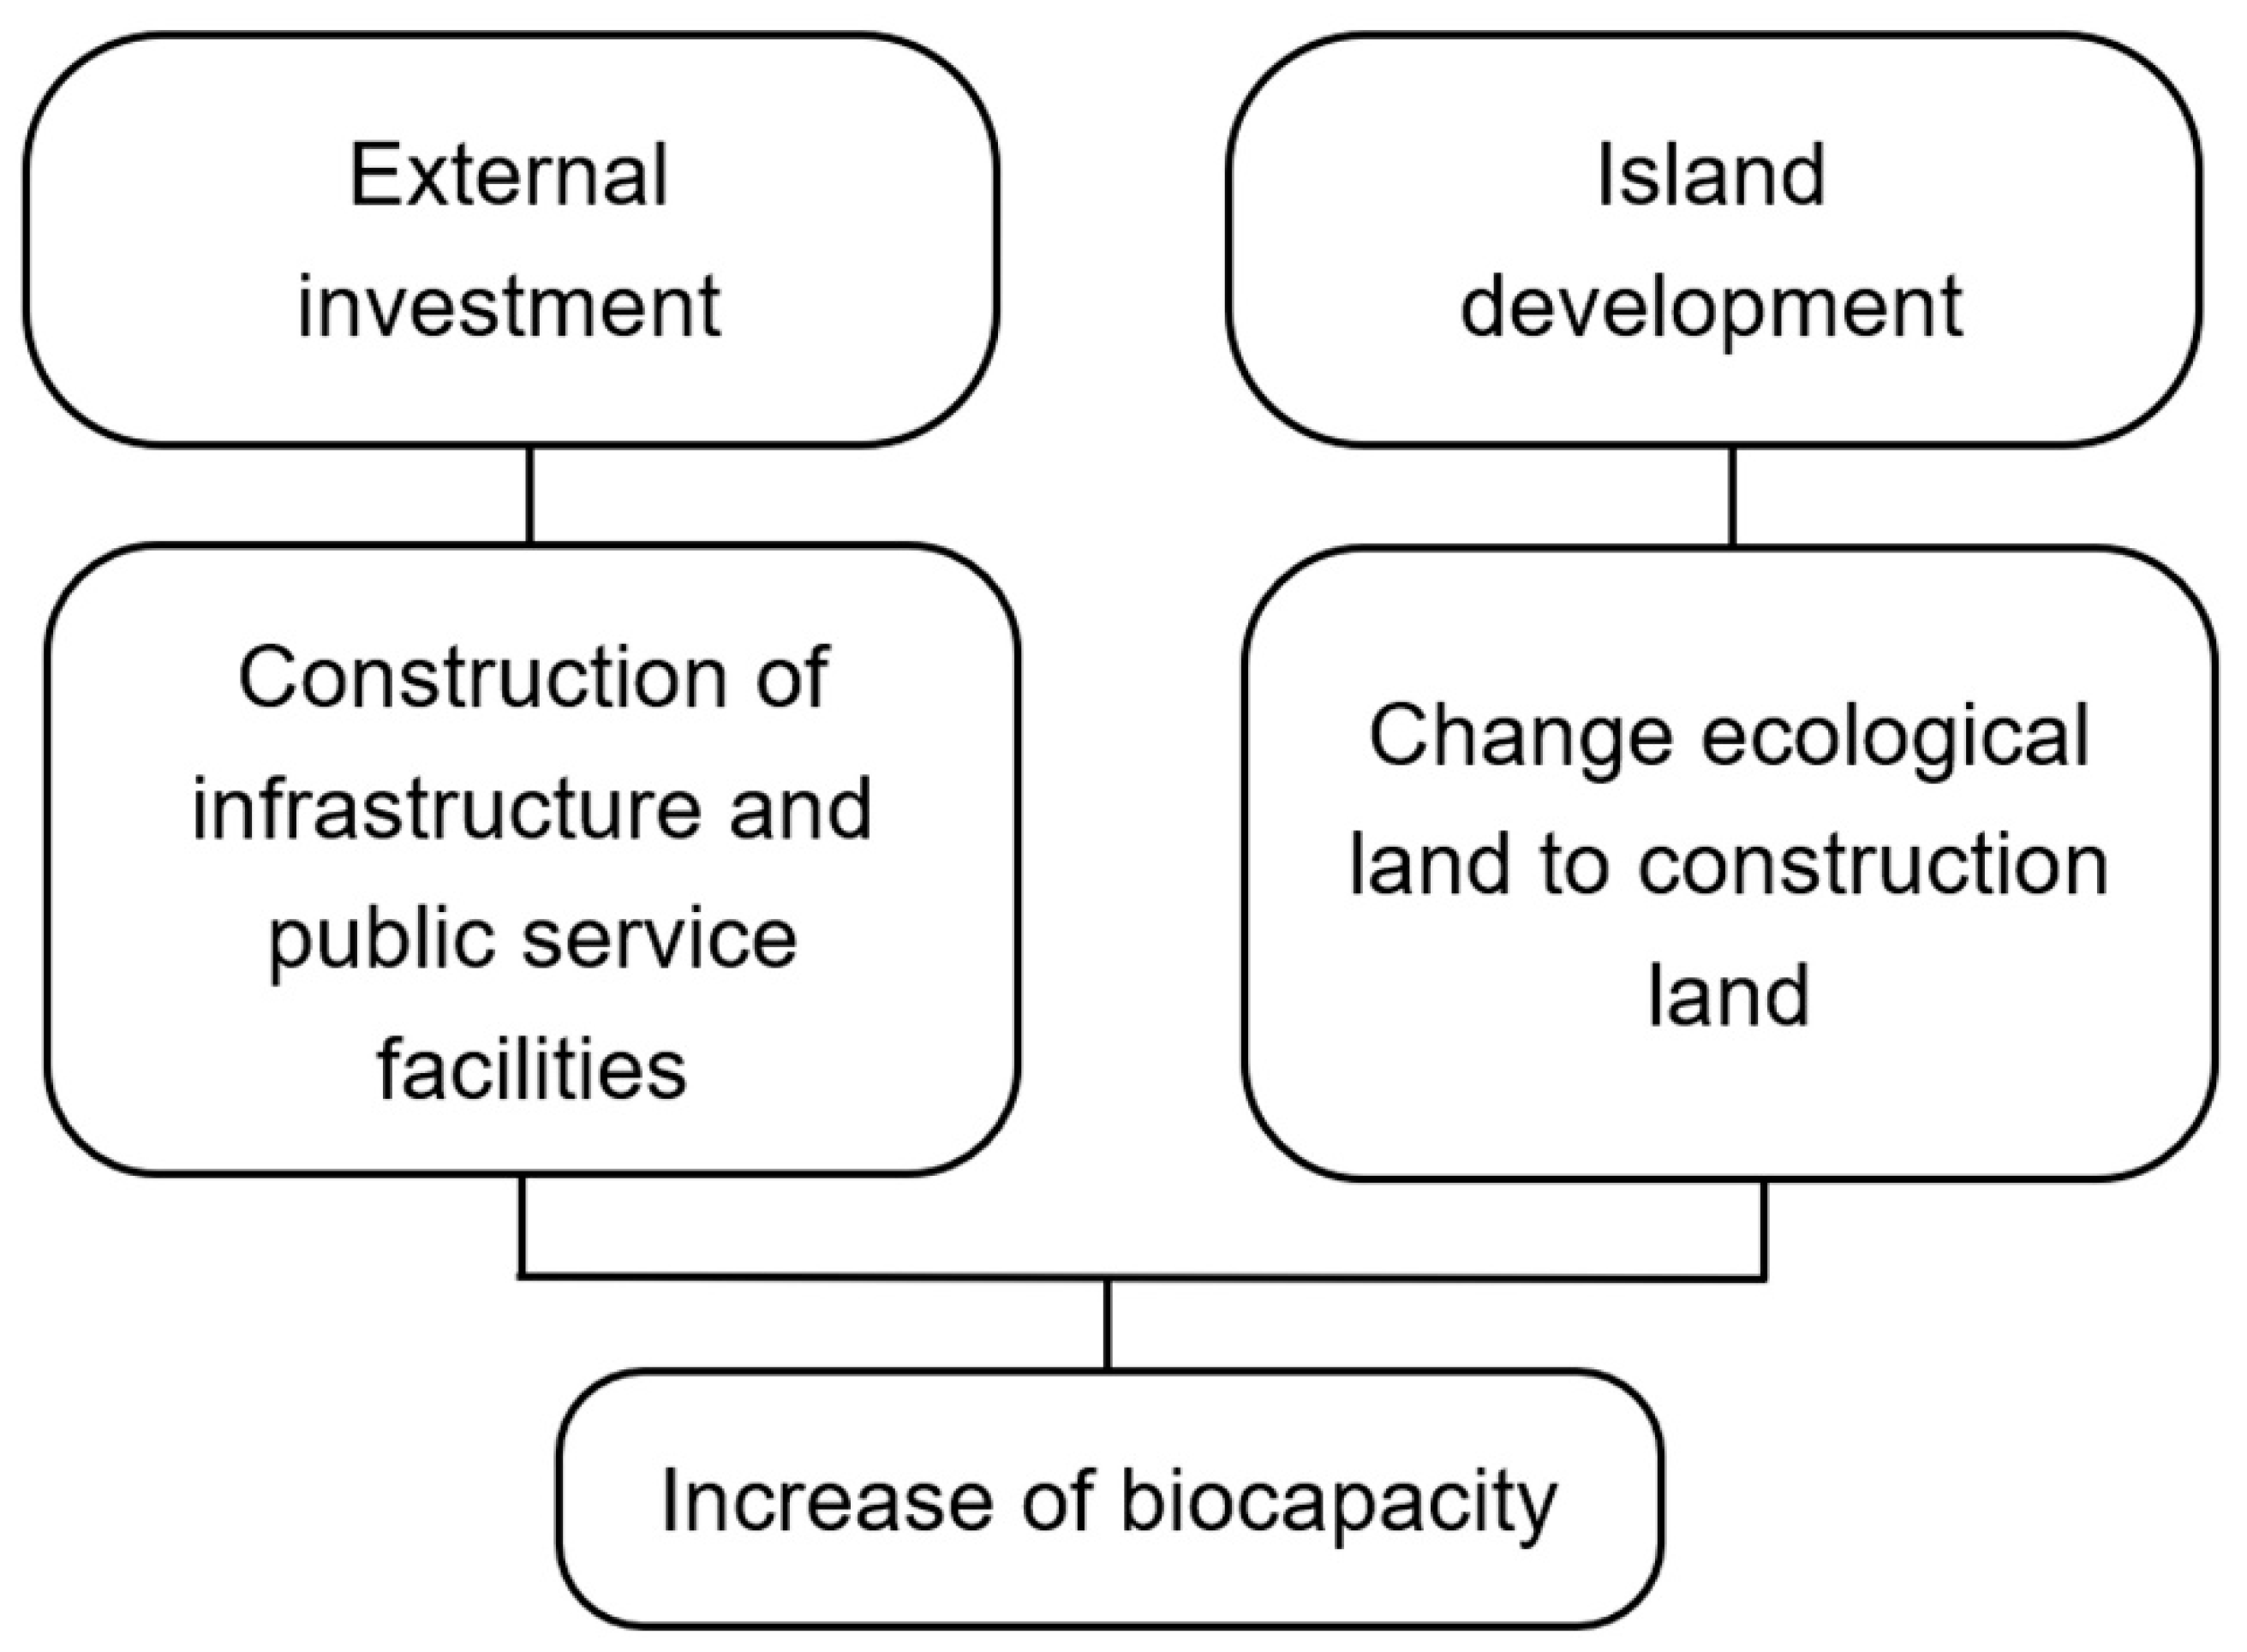
  • Island development improves the biocapacity through changes from lower-yield land types to higher-yield construction land types and by external investment.

1. Introduction

With the continuous migration of population and economies to coastal areas, many coastal economic developmental plans consider islands to be potential sites for development. With the progress in marine science and technology, the social and economic development of islands has changed from previous eras, which depended on marine biological resources, to the current era, which depends on the comprehensive development of marine resources [1,2]. Islands have become a strategic focus for urban expansion toward the sea and the growth of regional development. Islands have little freshwater, thin soil and poor vegetation, and are susceptible to typhoons, storm surges and other natural disasters. Furthermore, island ecosystems have very limited abilities to self-regulate these issues [3], and recovery is difficult once the ecology is destroyed. Nevertheless, the ecological suitability of island development has attracted widespread attention [4].
In 1970, the Man and Biosphere (MAB) plan began to focus on the dynamic balance between human beings and the environment in island habitats. In 1973, the MAB plan for the rational utilization of island ecosystems was formulated and successively implemented in South Pacific, Mediterranean and Caribbean islands [5]. The International Scientific Council for Island Development, established by the United Nations Educational, Scientific and Cultural Organization (UNESCO), launched the journal “Island” in 1992 to discuss issues related to the protection and sustainable development of island resources. “Agenda 21”, drawn up at the Earth Summit in 1992, considered islands and island communities to be special cases of economic development. Since then, scholars from various countries have conducted studies on the responses of island environments to human social and economic activities and the management and sustainable development of islands from multiple perspectives and using multiple methods [6,7,8,9,10,11,12,13,14]. Most studies have been at the scale of the administrative unit because of the difficulties of island data acquisition, whereas the ecological suitability of island development is seldom measured and assessed directly [15,16]. With the rapid increase in anthropogenic disturbance, the ecological vulnerability of islands has tended to increase [17]. Once the ecological environment is destroyed, the living conditions of local residents are also affected. As islands are a significant part of the coast, the ecological problems of islands cannot be neglected during coastal development, and research into island sustainability is crucial to coastal sustainability. It is necessary to assess the ecological suitability before development and to identify the areas that need special attention during the development process.
Land use and land cover change (LUCC) is a direct manifestation of environmental changes caused by island development, and changes in ecosystem services value (ESV) are the representation of the state of the ecological environment [18]. Ecosystem services are the benefits that people can obtain from ecosystems [19]. An evaluation model of the changes in ESV based on LUCC has been widely used [20,21,22,23]. In addition, ecological footprint (EF) and biocapacity (BC) are also important measurements of the ecological suitability of national and regional economic development [24,25]. EF refers to the biologically productive area the of land that can continuously serve a given population by providing all of the resources needed and absorbing all of the generated waste. BC measures the biological productivity [26,27]. The profit–loss relationship between EF and BC has also been used to assess the sustainable development of islands [28,29,30].
Compared to mainland areas, the depth and breadth of ESV research on islands are insufficient [31], and there is a lack of ecological assessment studies combining ESV, EF and BC. Moreover, in comparison to mainland areas, an essential characteristic of an island is that it is surrounded by ocean and the effects of development cannot be separated from the effects of the ocean. Historically, some islands have maintained large populations of humans because they had the support of the marine ecosystems and were able to live on resources from the sea. Therefore, it is necessary to take marine ecosystems into consideration when researching an island’s ecosystem. Nevertheless, few studies have considered the role of marine ecosystems in island development.
This study attempted to analyze changes in the ESV and the profit–loss balance between BC and EF in the development of Pingtan Island. LUCC data of Pingtan Island were collected, and ocean ecosystems were considered. Finally, a new measurement framework for ecological suitability was proposed. This study provides a theoretical basis for island development and ecological protection.

2. Study Area

Pingtan Island is located on the east coast of Fujian, China. With a land area of 324.12 km2, it is the fifth-largest island in China and the nearest county-level island between Mainland China and Taiwan Island (Figure 1). It is located in a subtropical, semi-humid climate region. The north and south of Pingtan Island have hills and plateaus, while the middle is an area of plains [32]. The types of coast are bedrock coast, sandy coast, muddy coast and mixed sand muddy coast. Since the end of 2009, Pingtan Island has been viewed as an area for cross-strait exchange and cooperation, and a substantial amount of attention has been paid to its development [33]. The development has been categorized according to three types: transformation, preservation and aggregation [34]. The transportation systems, green spaces and coastal tourism and leisure landscapes have been developed simultaneously. Pingtan Island is a comprehensive experimental area for island development as well as social and economic transformation and upgrading.

3. Methods and Data

3.1. Data and Processing of LUCC

The large-scale development and construction of Pingtan Island started in 2010. Cloud-free thematic mapper (TM) images of April 2009 (before development) and December 2014 and October 2017 (after large-scale land development was largely completed according to the plan) were chosen for analysis. The resolution was 30 m. As a 10 m isobath is used to define the boundary of shallow seas when calculating the sea areas of most fisheries, offshore construction and marine resources statistics [35,36,37], a 10 m isobathic line was selected based on the development and utilization status of the water area surrounding the island.
The downloaded remote-sensing images [38] were converted into the standard transverse Mercator projections through the projection conversion module of Environment for Visualizing Images (ENVI). At the same time, the frame deviation angles of the images were corrected. Then, the maximum-likelihood method was used to classify the three remote-sensing images according to the same classification criteria for land use. Common land use types in the ESV and BC calculations were considered in the classification (Figure 2). Land use in Pingtan Island was divided into eight types: cultivated land, forestland, grassland, construction land, bare land, wetland, water area and sea area.

3.2. Calculation of ESV

Ecosystem services were classified into four major categories: supporting, regulating, provisioning and cultural services [19]. Marine ecosystems are notably different from land ecosystems [39] (Table 1).
Based on analyses of the relevant literature, expert knowledge and statistical data, the equivalent value factors of ESV were obtained for different land use types in China [40,41] and compared to global ESV [42]. Due to the complexities of different ecosystems, there are differences in equivalent ESV due to variations in biomass, climate, topography and soil [43]. The previous equivalents of ESV [41] had been corrected according to the situation of Pingtan Island. Since vegetation types on Pingtan Island are a mixture of Pinus thunbergii Parl., Casuarina equisetifolia Forst., Acacia confusa Merr. and shrub-grass, and the cultivated land on Pingtan Island is mainly dry land, equivalent ESV of mixed coniferous broad-leaved forest, shrub-grass and dry land were used as those of forestland, grassland and cultivated land, respectively. The ecosystem services of construction land are similar to those of bareland, and thus the equivalent ESV was adopted. Compared with water area, sea area cannot provide water supply, hydrological regulation or soil conservation services. Therefore, the equivalent ESV of these factors was 0. The ESV of land types of the island and sea areas were calculated as follows:
ESV = A k × VC k
where Ak is the area of land use type k, and VCk is the equivalent ESV (per unit area of land type). One equivalent ESV is equal to the economic value of the annual natural grain yield of 1 hm2 of farmland. Although there are still uncertainties in the evaluation system [44], these values are relatively comparable in the same regions.

3.3. Calculation of EF and BC

The biologically productive areas of land that serve humans were divided into six types (cultivated land, grassland, forestland, water area, construction land and energy land) for the EF calculation, and the unit of measurement was the global hectare (gha). EF can be calculated as:
EF = N · ef = i = 1 n C i E P i E Q i = i = 1 n ( P i + I i E i ) E P i E Q i
where ef is the per capita EF, N is the population, Ci is the consumption of the resource i, EPi is the yield factor of the global average ecological productivity of the resource i (kg/gha), EQi is the equivalence factor of land occupied by the resource I, and Pi, Ii and Ei are the annual production, annual import and annual export of the resource i, respectively [45]. Data come from government statistics (see details in the Supplementary Information) [46,47,48]. Because of the lack of historical data in this study, per capita EF was calculated for the closed years 2014 and 2016.
According to the degree of productivity, global biological productive land can be divided into five types (cultivated land, grassland, forestland, water area and construction land) when calculating BC, where
B C = N · b c = j = 1 5 A j · E P j · E Q j
Here, bc is the per capita BC, Aj is the productive land area of type j, EPj is the yield factor of the productive land of type j (the ratio of the average productivity of type j land to that of type j land in the world), and EQj is the equivalence factor of the productive land of type j (the ratio of type j land to the comprehensive average productivity of all the land in the world) [45]. Yield factors and equivalence factors vary by land use and by year [49]. The unit of BC is gha.
One difference between the mainland and an island is that an island has the support of the surrounding marine resources. The surrounding sea area within the 10 m isobathic line was included in the calculation of BC, and the related coefficient is the same as water area. In addition, two more land use types were classified in Pingtan Island. Wetland has a similar function as water area, and bareland is mainly developing land, which could be used as construction land; thus the same coefficients as water area and construction land were used. The equivalence factors and yield factors of BC were the same as EF [50,51,52,53]. As some amount must be conserved for the biodiversity and integrity of ecosystems [54], per capita BC was also calculated and the relationship of EF and BC can be concluded as
per capita BC = total BC × (1-α)/population
EF BC × ( 1 α )
Here, α means the bio-productive land area rate that is set aside as a biodiversity conservation area to maintain the function of the ecosystem. Previous studies have discussed the specific number of α, but controversies exist. Most studies adopted the 12% recommended by World Commission on Environment and Development(WCED) [53,54,55,56]. In this study, 12% was also chosen in the calculation. When Formula (5) is established, the ecological situation of an island is suitable for development, which is called ecological overshoot. When it is not established, the ecology situation of an island is poor and unsuitable for development, which is called ecological deficit.
Although the calculations of EF and BC involve large datasets and the results of different studies vary [57,58], controversies exist concerning the calculated models [59,60], and the calculation methods for the equivalence factor and yield factor are being continuously improved [61,62]. However, the focus of this study was not on the specific values, but on the underlying meaning.

4. Results

4.1. LUCC on Pingtan Island
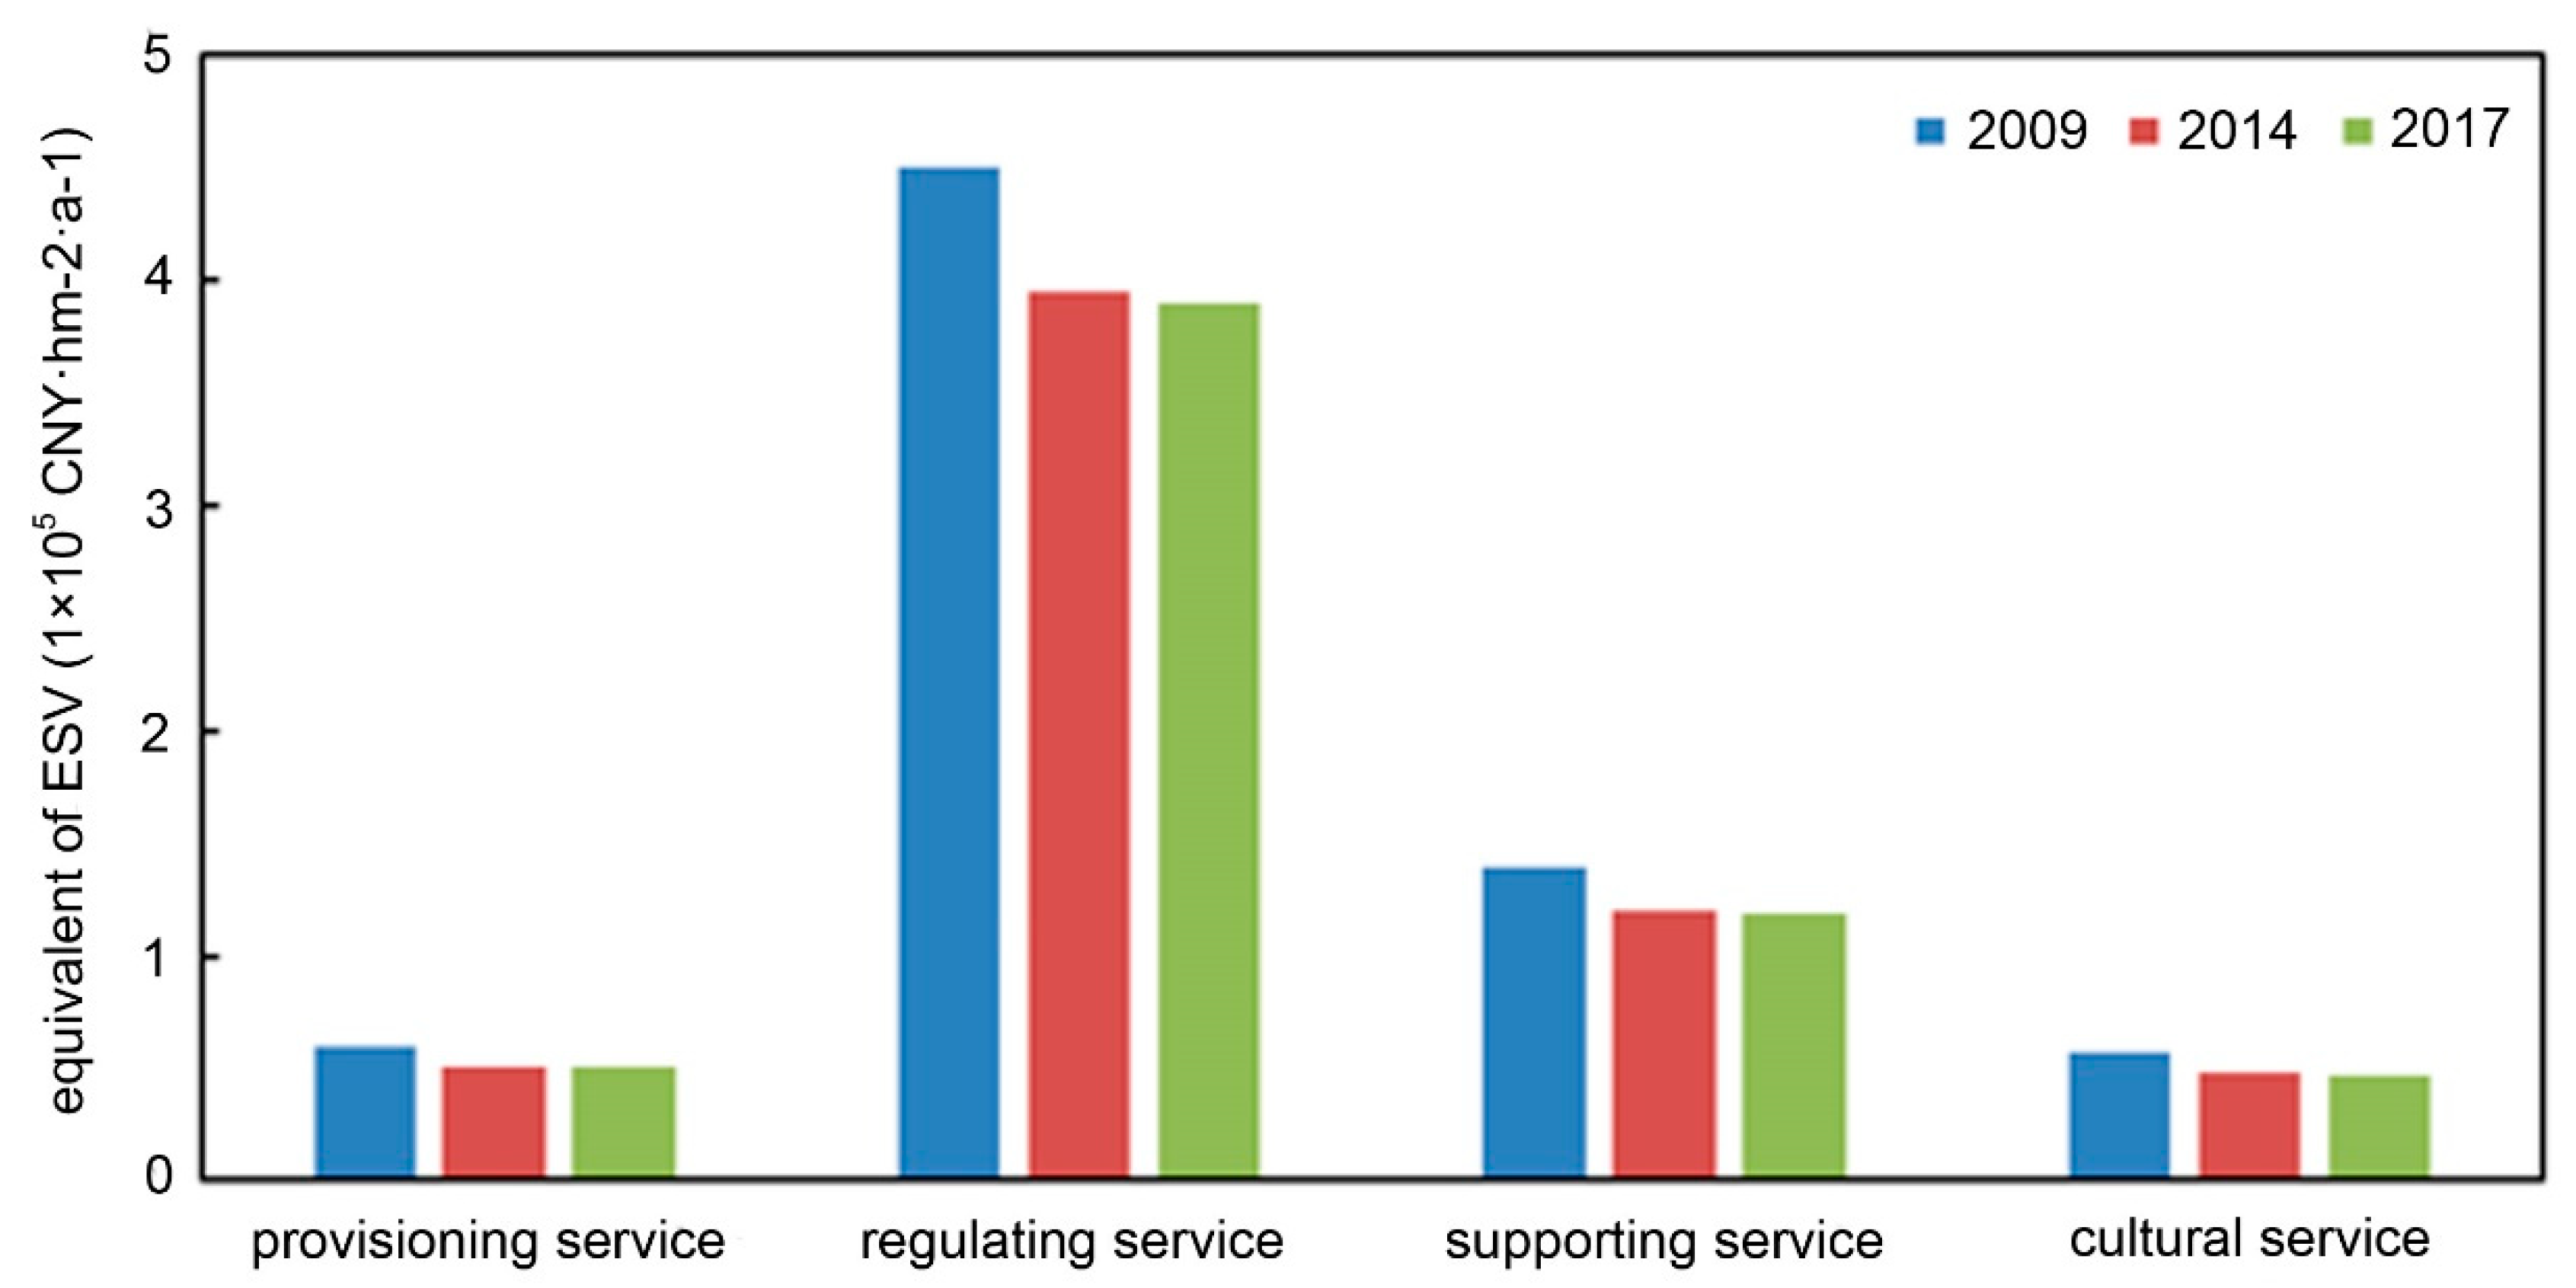
From the land use classification results of Pingtan Island in 2009, 2014 and 2017 (Figure 3), the LUCC and the potential changes in land use (Table 2) show that the area of forestland increased but then plateaued because of the increase of plantation activity during the development. The construction land area increased because of the conversion of some grassland, cultivated land, wetland and sea area to construction land. The greatest change was in the area of bareland, which initially increased, then decreased, mainly because of reclamation and then conversion to construction land and cultivated land. In addition, water area increased because of the increase in area of landscape waters such as artificial lakes and ponds. Generally, ecological land was mostly replaced by cultivated land, followed by wetland and sea area. Reclamation is a significant reason for the large areas of land use change, which increased the island area and decreased sea and wetland area. Another reason is that wetland and cultivated lands are flat and easy to convert to construction land.

4.2. Changes in ESV

The equivalents of ESV per unit area of land use type (Table 3) and the ESV in 2009, 2014 and 2017 (Table 4) indicated that the value equivalents of ecological provisioning services, ecological regulating services, ecological supporting services and ecological cultural services declined (Figure 4). Among them, the most significant change was the shortage of water provisioning services of the ecosystem after island development, especially in 2017.

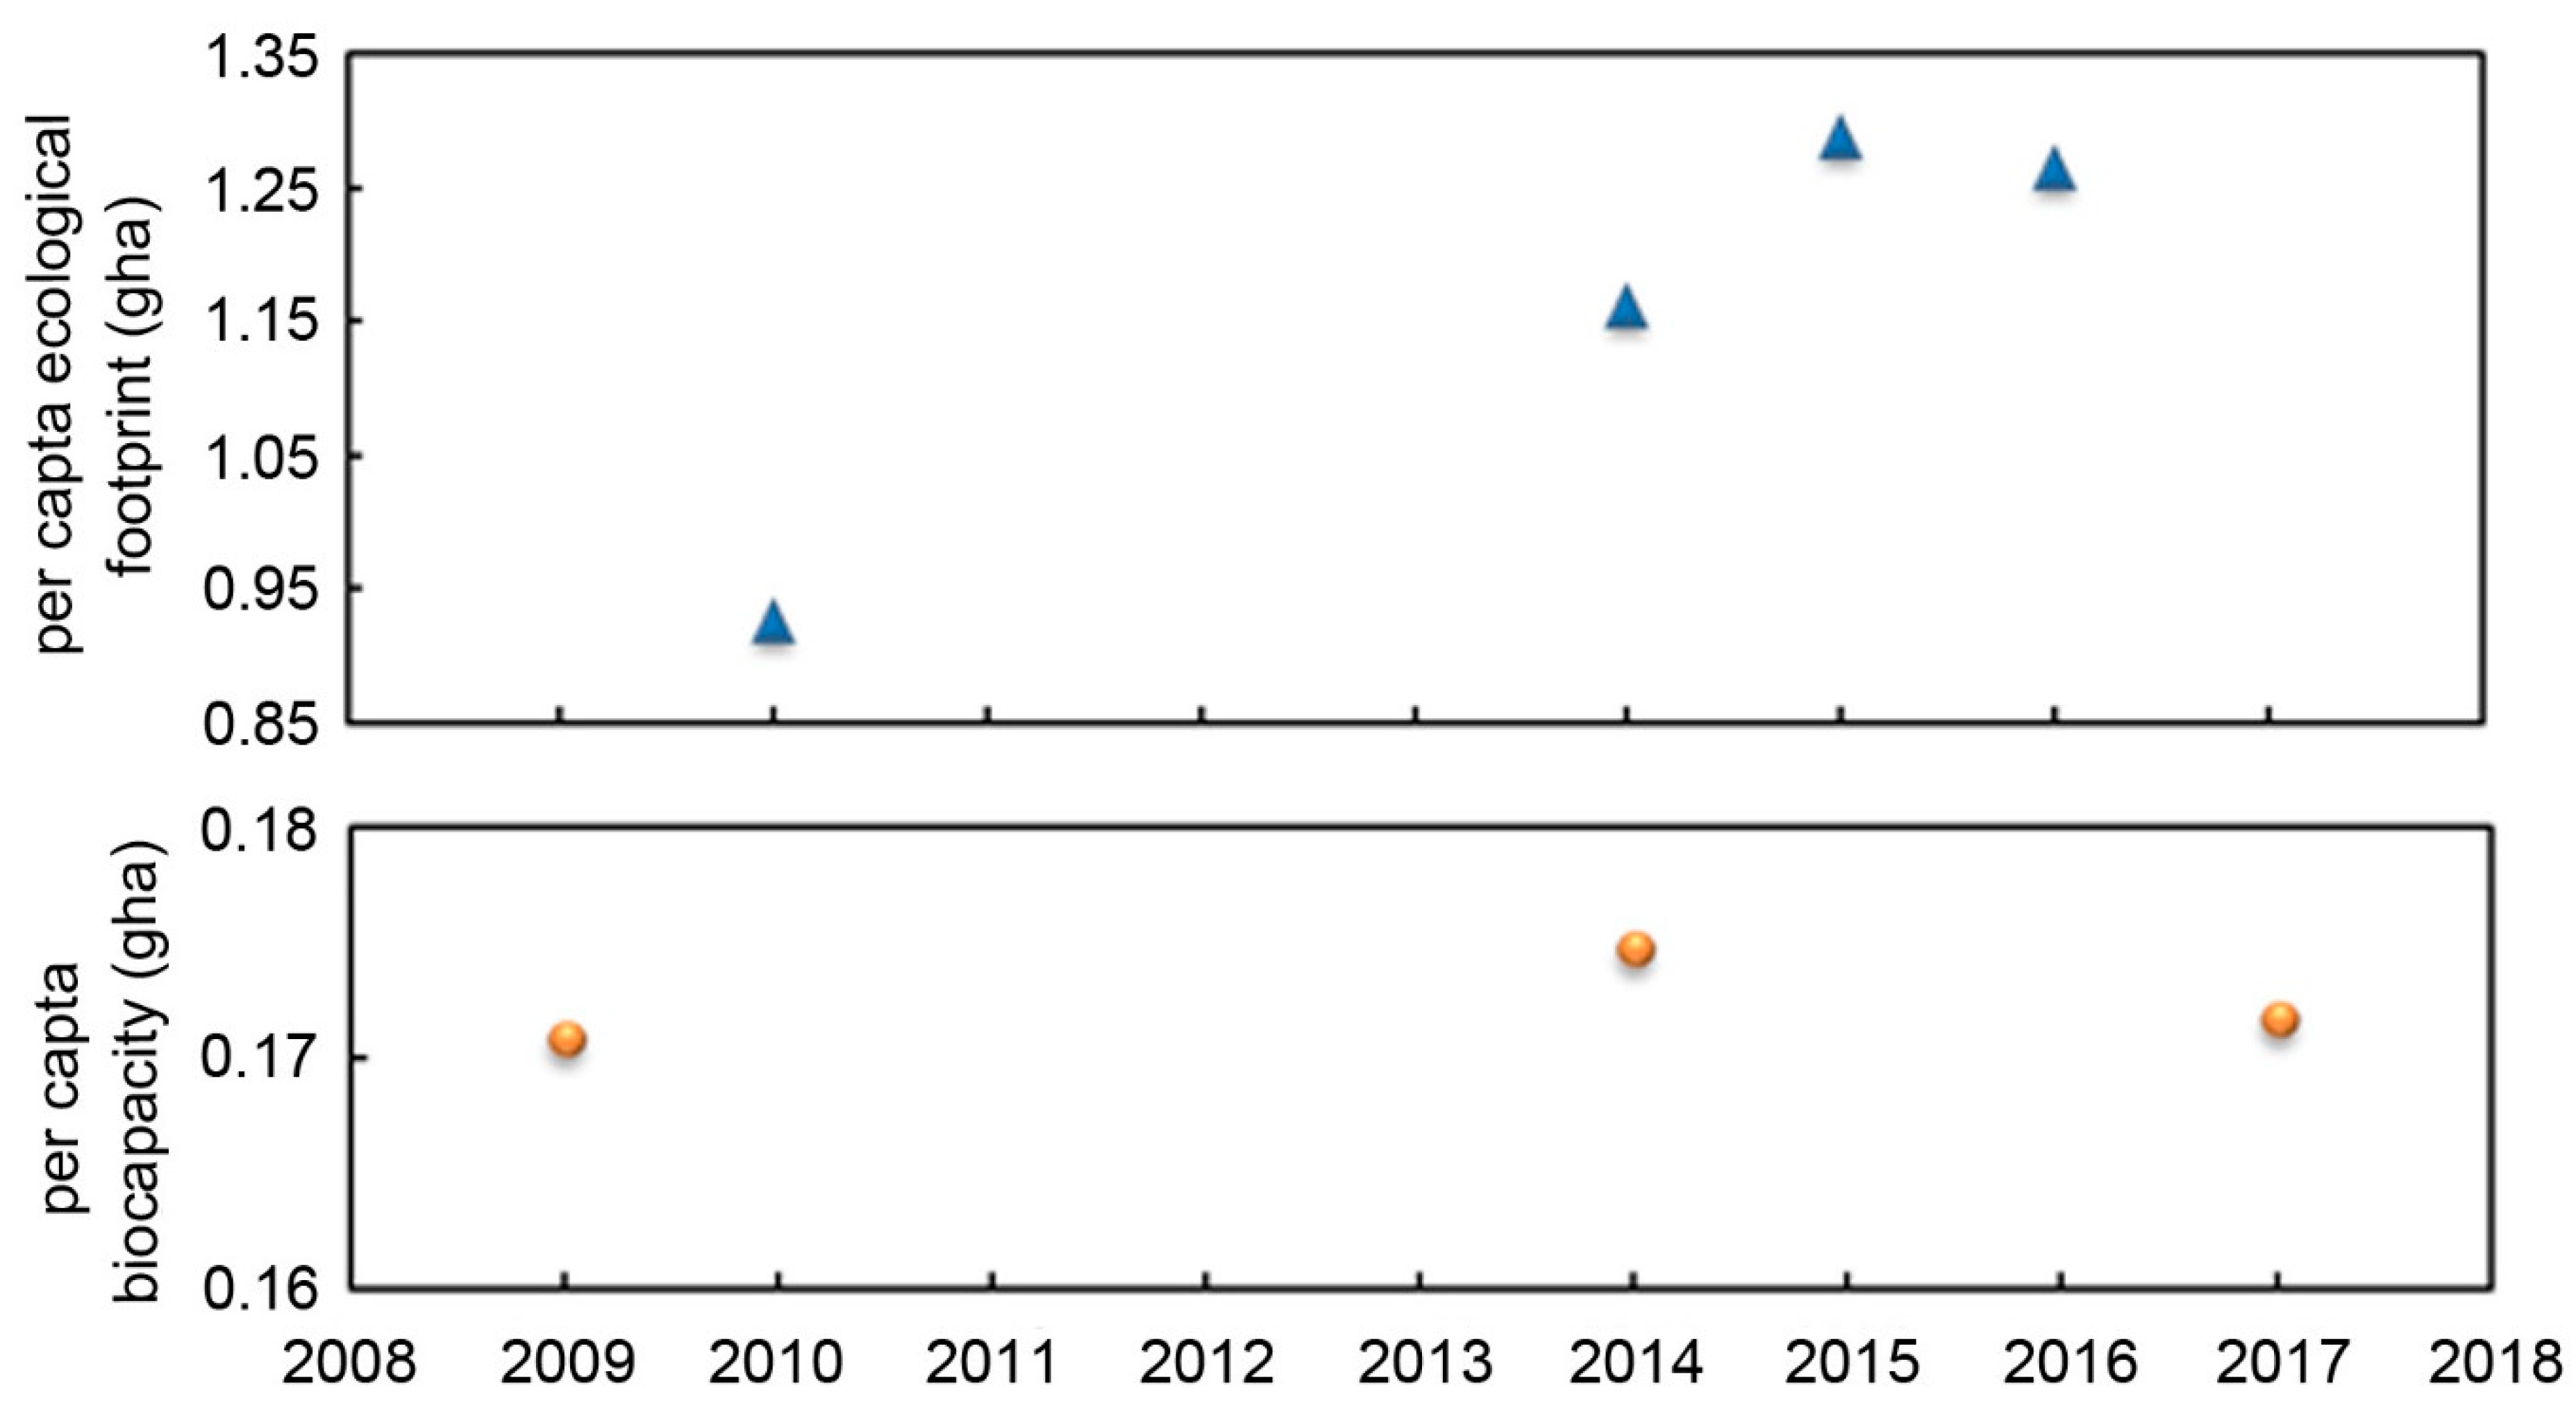
4.3. Changes in EF and BC

The BC of Pingtan Island in 2009, 2014 and 2017 shows that the total BC of the island increased after development, whereas the per capita BC did not increase, but decreased from 2014 to 2017 due to the increase in population (Table 5). The per capita EF of Pingtan Island in 2014 and 2016 were calculated as 1.161 gha and 1.264 gha, respectively, and in 2010 and 2015, they were 0.925 gha and 1.288 gha, respectively [53]. The per capita EF in 2014, 2015 and 2016 were higher than that in 2009. However, the per capita EF in 2016 was lower than that in 2015 although the total EF was higher (Figure 5).

5. Discussion

5.1. The ESV Revealed the Restraining Factors in Pingtan Island Development

Generally, island development was driven by social and economic development needs. Considering the constraints of forest and cultivated land protection policies, the non-arable parts of cultivated land, grassland, and wetlands were generally converted to construction land. Sea area was also reclaimed for land expansion. Consequently, ecological land decreased and construction land increased, which led to a significant reduction in the ESV (Figure 6).
During the development of Pingtan Island, the occupation of wetlands for development and construction meant that the supply of water resources was insufficient, leading to the decline of surface water levels. Even so, the ecological environment also requires freshwater [14,63,64,65], and shortages result in soil desertification and withered plants, threatening the ecosystem. Since most islands in the world, including Pingtan Island, are short of freshwater [66,67], freshwater is a constraint in island development. As the supplement of freshwater on the island depends on rainfall and groundwater, island development should not destroy vegetation or alter geomorphologic characteristics that store and recharge groundwater.
The reduction of provisioning services could be externally compensated for after island development. Other than the discharge of waste gas and wastewater, which can be adjusted through technology, regulating and supporting services can only be provided by the island’s own ecosystem. Wetland and water areas contributed the most to hydrological regulation, while forestland contributed the most to the regulating and supporting services. Hence, the protection of wetland and vegetation, especially vegetation with special functions such as wind breaking and sand-fixation, is the most important aspect of island development. Furthermore, previous studies have shown that the ecological effects of forestland communities with distinct tree, shrub and grass layers are two to three times that of single-layer grass structures [68]. Construction land should maintain a sufficient proportion of garden space and wetland, especially those of relatively large areas and complex ecological community structures.
In addition, wetland makes the greatest contribution to cultural services, followed by water area and sea area. Transformation from ecological land to construction land results in the loss of natural landscapes. Natural landscapes, without any traces of human intervention, are difficult to reconstruct after they have been destroyed. Recreation, ecotourism and aesthetic values decrease. Consequently, scenic spots with higher cultural service functions should also be protected.
Many coastal countries, such as the USA, Netherlands and China, have conducted coastal reclamation for agriculture, industry and urban development [69,70,71]. Reclamation can remedy the shortage of land and provide economic benefits. The continuous large-scale reclamation of coastal regions including islands leads to enormous losses to vegetated coastal wetlands and negative environmental impacts [72]. Furthermore, sea area and the related industries such as fishery and aquaculture are also affected by reclamation. For islands, ESV including food supply, climate regulation and biodiversity can be obtained from the surrounding sea and cannot be ignored. Thus, it is essential to consider sea area during development.
In spite of the uncertainty regarding the use of equivalent ESV and the difficulties in measuring values [73,74], the objective of this study was not to calculate absolute values but to explore the marginal changes in ESV related to environment changes [75,76].

5.2. Ecological State of the Island after Development, Based on EF and BC

The ecological deficits of Pingtan Island are obvious (Figure 5). A comparison of EF and BC between Pingtan Island with Fujian, China and the world (Table 6) shows that the EF and BC of Pingtan Island are lower than the averages of Fujian, China and the world before and after development. The results indicate that Pingtan Island might not be able to provide enough ecological resources to support a high quality of life for the existing population.
Nevertheless, utilization of the non-renewable resources left from the past and renewable resources can support the development of a social economy, even though the ecological deficit of the region is serious [79]. According to the calculated model of BC, the equivalence and yield factors of construction land are higher than those of natural ecosystems because of human productive labor. Therefore, the BC of islands improves when the ecological land with low BC is converted into construction land (Figure 7). Furthermore, after the development of Pingtan Island, the deficits in food, raw materials and energy could be adjusted by trade, and freshwater resources could be introduced from the mainland via a cross-sea pipe. With the transformation of industry during island development, provisioning services previously provided by the island’s ecosystem can be obtained from elsewhere [80,81]. That is, the BC can be obtained externally. Nonetheless, external supplies are limited due to distances, transportation, costs etc.
Both the BC and EF of Pingtan Island increased with island development. Island development can be divided into a primary stage, an improvement stage, a high-speed development stage and a top stage. Assuming that the EF and BC are balanced before island development, the primary stage is simply the aggregation of EF. However, during the improvement and high-speed development stages, urbane expansion and the formation of urban systems often require mass infrastructure construction, resulting in a continuous increase in total EF. At the top stage, with the improvements in infrastructure, the EF providing for construction would decrease and the EF providing for humans would improve. This is the reason for the continuous migration from inland areas with rich ecology but poor infrastructure to coastal areas with ecological deficits but good infrastructure [82], and it is also the theoretical basis for supporting island development.
However, with the continuous aggregation of populations and industry, the total EF of an island would far exceed the total BC. In contrast to total EF and BC, per capita EF and BC decreased from 2014 to 2017. Therefore, strategies such as population control, agriculture relocation and pollution reduction should be adopted to balance the EF and BC of the island [83].

5.3. A New Measurement Framework of Ecological Suitability

As freshwater is one of the restraining factors of island development, water demand is closely associated with water supply and hydrological regulating services of the ecosystem. Thus, freshwater supply can be used to help determine the ecological suitability of island development. In recent studies, lakes, wetlands and the water demands of rivers were chosen as indicators to determine the ecological suitability of development [84,85,86]. If the water demands of wetland and lakes can be met before island development, while some of them cannot be met after island development, the reduction in the hydrological regulating service due to island development has exceeded the threshold. At this time, the area of ecological land converted into construction land has also exceeded the threshold.
Moreover, resources on islands are limited, and some ecological land will be converted into construction land. However, not all ecological lands can be converted. Except for the land that should be set aside, the conversion is restricted by topography [87], water conservation and vegetation with special functions such as wind breaking. If the remaining ecological lands were converted into construction land and the BC is still lower than the EF, the scale of island development has reached the upper limit.
In general, the water demand, the land area that can be converted into construction land, and the profit–loss balance between EF and BC can be used as assessment indexes. A framework for measuring the ecological suitability of island development based on ESV, BC and EF was designed (Figure 8). All of the characteristics of islands are fully considered in the framework, and sea area is included as ecological land, which makes the evaluation of ecological suitability more comprehensive. Water demand is included in the framework, which considers the importance of this restricting factor. In addition, through analysis of the changes in ESV, we can determine which services need to be supplemented from off-island. The quantitative calculation depends on the further study of equivalent factors and yield factors of ESV, as well as water yield and the water demand of the ecology. The framework is suitable for islands that develop rapidly, including Pingtan Island, with rapid land use change and high pressure on ecological environment. The framework provides a guide to balance economics and the ecological environment when deciding on island planning and development.
Although islands can obtain more BC from the surrounding oceans, the increased value depends on the available ocean area and resources. Compared with the mainland, island development consumes more energy and raw materials for infrastructure, and only the islands with relatively large land areas and certain population and economic thresholds have value for development. Otherwise, islands should be protected as specific ecosystem resources for science, education and tourism.

6. Conclusion

Taking Pingtan Island in Fujian, China, as a case study, and through analyses based on the ecosystem services value, ecological footprint and biocapacity, the following main conclusions were obtained:
(1) Development on Pingtan Island led to a decrease in ecosystem services value. Vegetation and freshwater resources that provide regulating services are the main restricting factors of development on Pingtan Island and must be strictly protected.
(2) Ecologically suitable and sustainable development on islands can be realized when the increase in biocapacity matches the increase in the ecological footprint. Biocapacity can be increased not only by changing from lower-yield land types to higher-yield construction land types but also by external investment. This is an important theoretical basis for supporting island development. Moreover, strategies can also be taken to reduce the ecological footprint.
(3) A new measurement framework for ecological suitability of island development was proposed, based on the ecosystem services value, ecological footprint and biocapacity, which can simply and clearly reveal the underlying key constraints. The framework contributes to island development resource management, ecological protection and ecological restoration.

Supplementary Materials

The following are available online at https://www.mdpi.com/2071-1050/12/6/2553/s1, Figure S1: Grain yield in 2014 and 2016, Figure S2: Yield of crop and fruits in 2014 and 2016, Table S1: Population and industrial output value of Fuzhou and Pingtan, Table S2: Yield, import and convert coefficient, Table S3: Aquatic products yield and convert coefficient, Table S4: Consumption of energy sources, Table S5: Data sources and calculation methods.

Author Contributions

Data curation, W.Z.; formal analysis, S.C. and F.C.; funding acquisition, F.C., J.Z. and H.Q.; investigation, W.Z., F.C. and J.Z.; methodology, W.Z., S.C. and F.C.; project administration, F.C.; supervision, S.C. and F.C.; writing—original draft preparation, W.Z.; writing—review and editing, W.Z., S.C., F.C., J.Z., H.Q., S.Z. and J.L. All authors have read and agree to the published version of the manuscript.

Funding

This study was supported by the Scientific Research Foundation of the Third Institute of Oceanography, the Ministry of Natural Resources under contract (No. 2018003), the Science and Technology Planning Project of Fujian Province (2018Y0060) and the China-Association of Southeast Asian Nations (ASEAN) Maritime Cooperation Fund: China-ASEAN Countries Collaboration on Marine Endangered Species Researches (MESR).

Acknowledgments

Our gratitude for the “Pingtan Statistical Yearbook” provided by the Pingtan Statistics Bureau, and to Zhenliang Chen for assistance in accounting for the ecological footprint and biocapacity of Pingtan Island.

Conflicts of Interest

The authors declare no conflict of interest.

Abbreviations

LUCCland use and land cover change
ESVecosystem services value
EFecological footprint
BCbiocapacity

References

  1. Zhang, Y. Latest Evolvement and development pattern of the industrial structure in China’s island counties. Mar. Econ. 2011, 1, 1–7. [Google Scholar]
  2. Jupiter, S.; Mangubhai, S.; Kingsford, R.T. Conservation of biodiversity in the Pacific islands of Oceania: Challenges and opportunities Pacific. Pac. Conserv. Biol. 2014, 20, 206–220. [Google Scholar] [CrossRef]
  3. Chi, Y.; Shi, H.; Guo, Z.; Ding, D. Connotation, features and causes of island ecological vulnerability. Acta Oceanol. Sin. 2015, 37, 93–105. [Google Scholar]
  4. Povilanskas, R.; Armaitienė, A.; Dyack, B.; Jurkus, E. Islands of prescription and islands of negotiation. J. Destin. Mark. Manag. 2016, 5, 260–274. [Google Scholar] [CrossRef]
  5. Wood, J. Proceedings of the Workshop on Biosphere Reserves and other Protected Areas for Sustainable Development of Small Caribeane Island; US National Park Service: Atlanta, GA, USA, 1983. [Google Scholar]
  6. Hill, J.; Hostest, P.; Tsiourlis, G.; Kasapidis, P.; Udelhoven, T.H.; Diemer, C. Monitoring 20 years of increased grazing impact on the Greek island of Crete with earth observation satellites. J. Arid Environ. 1998, 39, 165–178. [Google Scholar] [CrossRef]
  7. Kenneth, R. Introduction to the special issue on a modern role for traditional coastal-marine resource management systems in the Pacific Islands. Ocean Coast. Manag. 1998, 40, 99–103. [Google Scholar]
  8. Pakhomov, E.A.; Froneman, P.W.; Ansorge, I.J.; Lutjeharms, J.R.E. Temporal variability in the physico-biological environment of the Prince Edward Islands (Southern Ocean). J. Mar. Syst. 2000, 26, 75–95. [Google Scholar] [CrossRef]
  9. McDonald, G.W.; Patterson, M.G. Ecological footprints and interdependencies of New Zealand regions. Ecol. Econ. 2004, 50, 49–67. [Google Scholar] [CrossRef]
  10. Kerr, S.A. What is small island sustainable development about? Ocean Coast. Manag. 2005, 48, 503–524. [Google Scholar] [CrossRef]
  11. Chi, Y.; Shi, H.; Sun, J.; Guo, Z.; Ma, D. Evaluation on island resources and environment carrying capacity under the background of urbanization. J. Nat. Resour. 2017, 32, 1374–1384. [Google Scholar]
  12. Cao, W.; Li, R.; Chi, X.; Chen, N.; Chen, J.; Zhang, H.; Zhang, F. Island urbanization and its ecological consequences: A case study in the Zhoushan Island, East China. Ecol. Indic. 2017, 76, 1–14. [Google Scholar] [CrossRef]
  13. Aburto, J.A.; Gaymerab, C.F. Struggling with social-ecological mismatches in marine management and conservation at Easter Island. Mar. Policy 2018, 92, 21–29. [Google Scholar] [CrossRef]
  14. Chi, Y.; Zhang, Z.; Gao, J.; Xie, Z.; Zhao, M.; Wang, E. Evaluating landscape ecological sensitivity of an estuarine island based on landscape pattern across temporal and spatial scales. Ecol. Indic. 2019, 101, 221–237. [Google Scholar] [CrossRef]
  15. Chen, Q. Research on Non-Resident Islands’ Exploitation Suitability based on Ecology and Economy; Xiamen University: Xiamen, China, 2009. [Google Scholar]
  16. Xu, L.; Huang, Q.; Ding, D.; Mei, M.; Qin, H. Modelling urban expansion guided by land ecological suitability: A case study of Changzhou City, China. Habitat Int. 2018, 75, 12–24. [Google Scholar] [CrossRef]
  17. Xie, Z.; Li, X.; Jiang, D.; Lin, S.; Yang, B.; Chen, S. Threshold of island anthropogenic disturbance based on ecological vulnerability assessment-A case study of Zhujiajian Island. Ocean Coast. Manag. 2019, 167, 127–136. [Google Scholar] [CrossRef]
  18. Chen, B.; Yu, W. Studies on comprehensive ecosystem assessment methods of islands. J. Oceanogr. Taiwan Strait 2006, 25, 566–571. [Google Scholar]
  19. MA (Millennium Ecosystem Assessment). Ecosystems and Human Well-Being: A Framework for Assessment; Island Press: Washington, DC, USA, 2003. [Google Scholar]
  20. Yue, D.; Xu, X.; Hui, C.; Xiong, Y.; Han, X.; Ma, J. Biocapacity supply and demand in Northwestern China: A spatial appraisal of sustainability. Ecol. Econ. 2011, 70, 988–994. [Google Scholar] [CrossRef]
  21. Liu, G.; Zhang, L.; Zhang, Q. Spatial and temporal dynamics of land use and its influence on ecosystem services value in Yangtze River Delta. Acta Ecol. Sin. 2014, 34, 3311–3319. [Google Scholar]
  22. Song, W.; Deng, X. Land-use/land-cover change and ecosystem service provision in China. Sci. Total Environ. 2017, 576, 705–719. [Google Scholar] [CrossRef]
  23. Li, B.; Wang, W. Trade-offs and synergies in ecosystem services for the Yinchuan Basin in China. Ecol. Indic. 2018, 84, 837–846. [Google Scholar] [CrossRef]
  24. Niccolucci, V.; Tiezzi, E.; Pulselli, F.M.; Capineri, C. Biocapacity vs ecological footprint of world regions: A geopolitical interpretation. Ecol. Indic. 2012, 16, 23–30. [Google Scholar] [CrossRef]
  25. Al-Mulali, U.; Weng-Wai, C.; Sheau-Ting, L.; Mohammed, A.H. Investigating the Environmental Kuznets Curve (EKC) hypothesis by utilizing the ecological footprint as an indicator of environmental degradation. Ecol. Indic. 2015, 48, 315–323. [Google Scholar] [CrossRef]
  26. Wackernagel, M.; Rees, W.E. Our Ecological Footprint: Reducing Human Impact on the Earth; New Society Publishers: Cabriola Island, BC, Canada, 1996. [Google Scholar]
  27. Lewan, L.; Craig, S. The Use of Ecological Footprint and Biocapacity Analyses as Sustainability Indicators for Subnational Geographical Areas: A Recommended Way Forward; Ambiente Italia: Milan, Italy, 2001. [Google Scholar]
  28. Li, L.; Li, J. Evaluation of island ecological resource utilization based on ecological footprint model-A case study of Changdao. Mar. dev. Manag. 2011, 9, 93–99. [Google Scholar]
  29. Sun, Y.; Zhu, J.; Huang, H. Ecological footprint analysis on tourism sustainability of Meizhou Island. Ecol. Sci. 2015, 34, 124–129. [Google Scholar]
  30. Zhang, H.; Chen, J.; Zhou, P. A modified ecological footprint model to evaluate the land carring capacity of island cities: Take Zhoushan City as example. Econ. Geogr. 2016, 36, 155–160. [Google Scholar]
  31. Liquete, C.; Piroddi, C.; Drakou, E.G.; Gurney, L.; Katsanevakis, S.; Charef, A.; Egoh, B. Current status and future prospects for the assessment of marine and coastal ecosystem services: A systematic review. PLoS ONE 2013, 8, e67737. [Google Scholar] [CrossRef] [Green Version]
  32. Li, Q.; Huang, J.; Wang, C.; Lin, H.; Zhang, Z.; Jiang, J.; Wang, B. Land development suitability evaluation of Pingtan Island base on scenario analysis and landscape ecological quality evaluation. Sustainability. 2017, 9, 1292. [Google Scholar] [CrossRef] [Green Version]
  33. Lan, H.; Lu, J.; Cao, Y.; Lin, T. A brief analysis of the main marine disasters and strategies of Pingtan Island. Mar. Dev. Manag. 2014, 2, 55–58. [Google Scholar]
  34. Pingtan Comprehensive Experimental Area Administration Committee. Overall Planning of Pingtan Comprehensive Experimental Area (2010–2030); Pingtan: Fujian, China, 2010. [Google Scholar]
  35. Wu, L. All-round development, diversified investment, accelerate the coastal construction of Ganyu, Jiangsu. Mar. Dev. Manag. 2001, 6, 77–78. [Google Scholar]
  36. Liu, M. Implement of comprehensive marine management and acceleration of maritime construction in Dongying. Mar. Dev. Manag. 2002, 4, 58–60. [Google Scholar]
  37. Zhang, Y.; Ding, Y.; Guo, Y.; Li, T.; Xue, B.; Bao, J. Investigation on marine fishery resources and production status near Feiyun and Aojiang River Estuary, Reian, Wenzhou. Hebei Fish. 2012, 7, 41–46. [Google Scholar]
  38. Geospatial Data Cloud Site, Computer Network Information Center, Chinese Academy of Sciences. 2018. Available online: http://www.gscloud.cn (accessed on 22 December 2018).
  39. MA (Millenium Ecosystem Assessment). Ecosystems and Human Well-Being: Desertification Synthesis; World Resources Institute: Washington, DC, USA, 2005. [Google Scholar]
  40. Xie, G.; Zhen, L.; Lu, C.; Yu, X.; Cao, C. Expert knowledge based valuation method of ecosystem services in China. J. Nat. Resour. 2008, 23, 911–919. [Google Scholar]
  41. Xie, G.; Zhang, C.; Zhang, L.; Chen, W.; Li, S. Improvement of the evaluation method forecosystem service value method based on per unit area. J. Nat. Resour. 2015, 30, 1243–1254. [Google Scholar]
  42. Costanza, R.; d’Arge, R.; de Groot, R.; Faber, S.; Grasso, M.; Hannon, B.; Limburg, K.; Naeem, S.; O’Neill, R.V.; Paruelo, J.; et al. The value of the world’s ecosystem services and natural capital. Nature 1997, 387, 253–260. [Google Scholar] [CrossRef]
  43. Xu, L.; Xu, X.; Luo, T.; Zhu, G.; Ma, Z. Services based on land use: A case study of Bohai Rim. Geogr. Res. 2012, 31, 1775–1784. [Google Scholar]
  44. Boithias, L.; Terrado, M.; Corominas, L.; Ziv, G.; Kumar, V.; Marqués, M.; Schuhmacher, M.; Acuña, V. Analysis of the uncertainty in the monetary valuation of ecosystem services - A case study at the river basin scale. Sci. Total Environ. 2016, 543, 683–690. [Google Scholar] [CrossRef]
  45. Toderoiu, F. Ecological footprint and biocapacity–Methodology and regional and national dimensions. Agric. Econ. Rural Dev. 2010, 2, 213–238. [Google Scholar]
  46. Fujian Statistics Bureau. Fujian Statistical Yearbook. 2019. Available online: http://tjj.fujian.gov.cn/tongjinianjian/dz2017/index-cn.htm (accessed on 17 March 2019).
  47. Fuzhou Statistics Bureau. Fuzhou Statistical Yearbook. 2019. Available online: http://tjj.fuzhou.gov.cn/zz/fztjnj/2017fztjnj/indexch.htm (accessed on 17 March 2019).
  48. Pingtan Statistics Bureau. Pingtan Statistical Yearbook; Pingtan Statistics Bureau: Fujian, China, 2017. [Google Scholar]
  49. Borucke, M.; Moore, D.; Cranston, G.; Gracey, K.; Iha, K.; Larson, J.; Lazarus, E.; Morales, J.C.; Wackernagel, M.; Galli, A. Accounting for demand and supply of the biosphere’s regenerative capacity: The national footprint accounts’ underlying methodology and framework. Ecol. Indic. 2013, 24, 518–533. [Google Scholar] [CrossRef]
  50. Global Footprint Network. Available online: https://www.footprintnetwork.org (accessed on 10 March 2019).
  51. Qiu, S. Ecological footprint and ecological bearing capacity of fujian province in 2008. Dev. Res. 2009, 12, 80–83. [Google Scholar]
  52. Liu, M.; Li, W.H.; Xie, G.D. Estimation of China ecological footprint production coefficient based on net primary productivity. China J. Ecol. 2010, 29, 592–597. [Google Scholar]
  53. Chen, Z. Study on ecological carrying capacity of new island city based on ecological footprint model -A case study of Pingtan Comprehensive experimental zone. Environ. Dev. 2017, 27, 214–215. [Google Scholar]
  54. Wackernagel, M.; Lewan, L.; Hansson, C.B. Evaluating the use of natural captical with the ecological footprint: Application in Sweden and Sub regions. Ambio 1999, 28, 604–612. [Google Scholar]
  55. WCED. Report of the World Commission on Environment and Development: Our Common Future; Oxford University Press: Oxford, UK, 1987. [Google Scholar]
  56. Liu, Y. Research on Comprehensive Carrying Capacity in Arid Area of Central Ningxia; Ningxia University: Ningxia, China, 2016. [Google Scholar]
  57. Jeswani, H.K.; Azapagic, A. Water footprint: Methodologies and a case study for assessing the impacts of water use. J. Clean. Prod. 2011, 19, 1288–1299. [Google Scholar] [CrossRef]
  58. Jiao, W.; Min, Q.; Chen, S.; Li, W. The waste absorption footprint (WAF): A methodological note on footprint calculations. Ecol. Indic. 2013, 34, 356–360. [Google Scholar] [CrossRef]
  59. Hanafiah, M.M.; Huijbregts, M.A.J.; Hendriks, A.J. The influence of nutrients and non-CO2 greenhouse gas emissions on the ecological footprint of products. Sustainability 2010, 2, 963–979. [Google Scholar] [CrossRef] [Green Version]
  60. Fang, K.; Ding, D.; Shen, W. Discussion on shortcoming and improvement of ecological footprint theory in energy consumption assessment. J. Nat. Resour. 2010, 25, 1013–1021. [Google Scholar]
  61. Mózner, Z.; Tabi, A.; Csutora, M. Modifying the yield factor based on more efficient use of fertilizer - the environmental impacts of intensive and extensive agricultural practices. Ecol. Indic. 2012, 16, 58–66. [Google Scholar] [CrossRef] [Green Version]
  62. Zhou, T.; Wang, Y.; Gong, J.; Wang, F. Ecological footprint model modification and method improvement. Acta Ecol. Sin. 2015, 5, 4592–4603. [Google Scholar]
  63. Zhang, X.; Cai, H. Regional Ecological Environmental Water Demand and Rational Allocation of Water Resources; Northwest Agricultural and Forestry University Press: Yangling, China, 2008. [Google Scholar]
  64. Sajedipour, S.; Zarei, H.; Oryan, S. Estimation of environmental water requirements via an ecological approach: A case study of Bakhtegan Lake, Iran. Ecol. Eng. 2017, 100, 246–255. [Google Scholar] [CrossRef]
  65. Shojaei, P.; Gheysari, M.; Nouri, H.; Myers, B.; Esmaeili, H. Water requirements of urban landscape plants in an arid environment: The example of a botanic garden and a forest park. Ecol. Eng. 2018, 123, 43–53. [Google Scholar] [CrossRef]
  66. Taboroši, D.; Jenson, J.W.; Sánchez Collazo, M.; Zega, M. Availability, usage, and threats to freshwater resources on low carbonate islands in Micronesia. In Proceedings of the Egu General Assembly Conference, Vienna, Austria, 2–7 May 2010. [Google Scholar]
  67. Mycoo, M.A. Achieving SDG 6: Water resources sustainability in Caribbean Small Island Developing States through improved water governance. Nat. Resour. Forum 2018, 42, 54–68. [Google Scholar] [CrossRef]
  68. Wang, X.; Li, Z.; Jiang, X.; Liao, W. Quantitative evaluation on the ecological benefit of public park green space. J. Plant Resour. Environ. 2005, 14, 42–45. [Google Scholar]
  69. Kennish, M.J. Coastal salt marsh systems in the US: A review of anthropogenic impacts. J. Coast. Res. 2001, 17, 731–748. [Google Scholar]
  70. Ma, Z.; Melville, D.S.; Liu, J.; Chen, Y.; Yang, H.; Ren, W.; Zhang, Z.; Piersma, T.; Li, B. Rethinking China’s new great wall. Science 2014, 346, 912–914. [Google Scholar] [CrossRef] [PubMed] [Green Version]
  71. Hoeksema, R.J. Three stages in the history of land reclamation in the Netherlands. J. Irrig. Drain. Eng. 2007, 56, 113–126. [Google Scholar] [CrossRef]
  72. Tian, B.; Wu, W.; Yang, Z.; Zhou, Y. Drivers, trends, and potential impacts of long-term coastal reclamation in China from 1985 to 2010. Estuar. Coast. Shelf Sci. 2016, 170, 83–90. [Google Scholar] [CrossRef]
  73. Li, Y.; Wen, R.; Chen, K. A review on the progress in marine ecosystem services valuation. Ecol. Econ. 2017, 33, 120–126. [Google Scholar]
  74. Turner, R.K.; Paavola, J.; Cooper, P.; Farber, S.; Jessamy, V.; Georgiou, S. Valuing nature: Lessons learned and future research direction. Ecol. Econ. 2003, 46, 493–510. [Google Scholar] [CrossRef] [Green Version]
  75. Fisher, B.; Turner, R.K.; Morling, P. Defining and classifying ecosystem services for decision making. Ecol. Econ. 2009, 68, 643–653. [Google Scholar] [CrossRef] [Green Version]
  76. Bateman, I.J.; Mace, G.M.; Fezzi, C.; Atkinson, G.; Turner, K. Economic analysis for ecosystem service assessments. Environ. Resour. Econ. 2011, 48, 177–218. [Google Scholar] [CrossRef] [Green Version]
  77. Lin, D.; Hanscom, L.; Murthy, A.; Galli, A.; Evans, M.; Neill, E.; Mancini, M.; Martindill, J.; Medouar, F.Z.; Huang, S.; et al. Ecological footprint accounting for countries: Updates and results of the national footprint accounts, 2012–2018. Resources 2018, 7, 58. [Google Scholar] [CrossRef] [Green Version]
  78. Wang, G.; Zha, X.; Huang, S.; Chen, S. Research of the sustainable development in Fujian province based on the ecological footprint model. J. Shenyang Norm. Univ. (Nat. Sci. Ed). 2016, 2, 178–182. [Google Scholar]
  79. Xie, G.; Zhou, H.; Lu, C.; Zhen, L. Carrying capacity of natural resources in China. China Popul. Resour. Environ. 2005, 15, 93–98. [Google Scholar]
  80. Kissinger, M.; Rees, W.E. Importing terrestrial biocapacity: The U.S. case and global implications. Land Use Policy 2010, 27, 589–599. [Google Scholar] [CrossRef]
  81. Coscieme, L.; Pulselli, F.M.; Niccolucci, V.; Patrizi, N.; Sutton, P.C. Accounting for ‘land-grabbing’ from a biocapacity viewpoint. Sci. Total Environ. 2016, 530, 551–559. [Google Scholar] [CrossRef]
  82. Liu, D.; Feng, Z.; Yang, Y. Ecological balance between supply and demand in China using ecological footprint method. J. Nat. Resour. 2012, 27, 614–624. [Google Scholar]
  83. Beyer, R.M.; Manica, A.; Rademacher, T.T. Relocating agriculture could drastically reduce humanity’s ecological footprint. BioRxiv 2008, 488841. [Google Scholar] [CrossRef] [Green Version]
  84. Jin, M. Review of evaluation methods and research advance on ecological water requirement. J. Agric. Resour. Environ. 2013, 30, 53–57. [Google Scholar]
  85. Li, C.; Cai, Y.; Qian, J. A multi-stage fuzzy stochastic programming method for water resources management with the consideration of ecological water demand. Ecol. Indic. 2018, 95, 930–938. [Google Scholar] [CrossRef]
  86. Clara, I.; Dyack, B.; Rolfe, J.; Newton, A.; Borg, D.; Povilanskas, R.; Brito, A.C. The Value of Coastal Lagoons: Case Study of Recreation at the Ria de Aveiro, Portugal in comparison to the Coorong, Australia. J. Nat. Conserv. 2018, 43, 190–200. [Google Scholar] [CrossRef]
  87. Zong, Y.; Wang, R.; Wang, C.; Wang, H.; Zhang, L. Ecological suitability assessment on land use based on potential-constrain approach: The case of urbanized areas in Dalian city, China. Geogr. Res. 2007, 26, 1117–1126. [Google Scholar]
Figure 1. The geographical location of Pingtan Island.
Sustainability 12 02553 g001
Figure 2. Flowchart of the study and calculation processes. EF: ecological footprint; BC: biocapacity.
Sustainability 12 02553 g002
Figure 3. LUCC of Pingtan Island in 2009, 2014 and 2017.
Sustainability 12 02553 g003
Figure 4. Changes in the equivalents of ESV of Pingtan Island from 2009 to 2017.
Sustainability 12 02553 g004
Figure 5. Changes in the per capita EF and BC during Pingtan Island development.
Sustainability 12 02553 g005
Figure 6. Changes of ESV during island development.
Sustainability 12 02553 g006
Figure 7. Changes in the BC of island development.
Sustainability 12 02553 g007
Figure 8. Framework for measuring the ecological suitability of island development.
Sustainability 12 02553 g008
Table 1. Comparison of ecosystem services between land and marine ecosystems.
Land Ecosystem ServicesMarine Ecosystem Services
Supporting ServicesMaintain the functions of the ecosystem itselfInclude orders of magnitude more of primary production, material recycling, and biodiversity
Provisioning ServicesProvide products, including agriculture, forestry, animal husbandry, fishery products, freshwater, wood and medicinal materialsInclude vastly larger food supplies, raw material supplies and genetic resources
Regulating ServicesInclude climate regulation, water conservation, soil conservation, pollutant degradation, wind protection, sand fixation, disaster prevention and reduction etc.Extend in scale to climate regulation, air quality regulation, water quality purification etc.
Cultural ServicesInclude landscape aesthetic appreciation, leisure opportunities and support for tourism and entertainmentInclude many more spiritual and cultural elements, knowledge extension services and tourism and entertainment services
Table 2. Land use area of Pingtan Island in 2009, 2014 and 2017.
Land Type2009 (hm2)2014 (hm2)2017 (hm2)Change Trend
Forestland5505.936493.866397.11+ -
Grassland4226.583541.323512.07- -
Cultivated land11,246.858635.059163.71- +
Construction land2729.433707.014804.38+ +
Bareland751.594767.843561.93+ -
Wetland2617.831123.29944.01- -
Water area572.40593.10624.15+ +
Sea area17,113.4115,902.5515,756.66- -
Total44,764.0244,764.0244,764.02
Note: “+” means increase and “-” means decrease.
Table 3. Equivalents of ESV per unit area. (unit: CNY·hm−2·a−1).
Type of Ecological LandProvisioning ServicesRegulating ServicesSupporting ServicesCultural Services
Food SupplyRaw Material SupplyWater SupplyAir RegulationClimate RegulationEnvironment PurificationHydrological RegulationSoil ConservationNutrient CycleBiodiversityAesthetic Landscape
Forestland0.310.710.372.357.031.993.512.850.222.601.14
Grassland0.380.560.311.975.211.723.822.400.182.180.96
Cultivated land0.850.400.020.670.360.100.271.030.120.130.06
Construction land0.000.000.000.020.000.100.030.020.000.020.01
Wetland0.510.502.591.903.603.6024.232.310.187.874.73
Water area0.800.238.290.772.295.55102.240.930.072.551.89
Sea area0.800.230.000.772.295.550.000.000.072.551.89
Bareland0.000.000.000.020.000.100.030.020.000.020.01
Table 4. Changes in the equivalents of ESV on Pingtan Island in 2009, 2014 and 2017. (unit: CNY·hm−2·a−1).
YearProvisioning ServicesRegulating ServicesSupporting ServicesCultural Services
Food SupplyRaw Material SupplyWater SupplyAir RegulationClimate RegulationEnvironment PurificationHydrological RegulationSoil ConservationNutrient CycleBiodiversityAesthetic Landscape
200928,356.5016,151.4915,097.7547,462.26114,700.73127,279.74160,564.6344,069.095030.9390,762.2156,852.42
201424,467.9914,403.4411,499.3643,027.85109,029.61116,319.54126,762.8639,216.654459.1876,800.3747,895.46
201724,692.9414,413.7811,258.1442,665.84107,479.00114,835.90125,281.6039,027.804455.7674,847.8346,722.68
Change- +- +- -- -- -- -- -- -- -- -- -
Note: “+” means increase and “-” means decrease.
Table 5. Calculated results of BC on Pingtan Island in 2009, 2014 and 2017. (unit: gha).
Ecological TypeEquivalence Factor [50]Yield FactorsBC in 2009BC in 2014BC in 2017
Liu [52]Qiu [51]Average Data
Forestland1.280.860.7850.82255796.64 6836.74 6734.88
Grassland0.460.512.90791.708953322.59 2783.89 2760.90
Cultivated land2.51.741.51751.6287545,795.77 35,160.84 37,313.48
Construction land2.51.741.51751.6287511,113.90 15,094.48 19,562.83
Wetland0.370.7410.87842.68 361.59 303.88
Water area0.370.7410.87184.26 190.92 200.91
Sea area0.370.7410.875508.81 5119.03 5072.07
Bareland2.51.741.51751.628753060.38 19,414.05 14,503.73
Total BC (gha):75,625.02 84,961.54 86,452.69
The population of Pingtan Island (×104):38.9742.7944.32
Per capita BC (gha):0.1710.1750.172
Table 6. Regional per capita EF and BC. (Unit: gha).
The Average Data of the World [77]The Average Data of China [50]The Average Data of Fujian [78]The Average Data of
Pingtan Island
Per capita EF2.840
(2014)
3.600
(2016)
2.258
(2014)
0.925
(2010)
1.161
(2014)
1.264
(2016)
Per capita BC1.680
(2014)
1.000
(2016)
1.961
(2014)
0.171
(2009)
0.175
(2014)
0.172
(2017)

