An Assessment of Water Resources in the Taiwan Strait Island Using the Water Poverty Index


Abstract
:1. Introduction
2. Development and Application of the WPI
2.1. Framework of the WPI
- (1)
- Water resources: Based on economic and calculated considerations, available water resources are usually estimated using post rainfall runoff and groundwater recharge (blue water);
- (2)
- Measure of access: In areas where access to water is difficult, the time it takes to fetch water is very important. During the dry season, rich or influential people can obtain sufficient water resources, while the poor can only find the water that is naturally available. People who have insufficient income often must choose between food or water, making their lives very difficult.
- (3)
- Water quality and change: Water quality is an indicator used to define environmental improvements. Changes in the water supply are often overlooked indicators, and, in developing countries, this impact factor can determine the uncertainty of the water supply in the region.
- (4)
- Water used for production or food: The United Nations only focuses on the water required for people’s livelihoods; however, the food manufacturing sector also uses a large amount of water (industries such as animal husbandry, agriculture, and manufacturing), which should be included in the calculation of the WPI.
- (5)
- Ability to manage water resources: the effective management of water resources is closely related to education and income levels and affects whether water resources can be effectively used and whether relevant units can properly resolve issues.
- (6)
- Environment: The improvement of water resources must not cause environmental damage, and environmental sustainability must be a priority. The areas of nature reserves, the popularizing rate of environmental information, and the special environmental features of each region should be discussed from this perspective.
- (7)
- Spatial scale: The state of water resources often changes with space. Sometimes, areas less than a few kilometers apart have different socio–economic features that affect their use of water resources. Therefore, spatial scale requires careful consideration to reflect the degree of discrepancy in regional water use.
2.2. Application of the WPI
2.3. Development of the WPI in Taiwan
2.4. Study area
- (1)
- Based on the framework of the WPI in Taiwan, to calculate the WPI in Kinmen;
- (2)
- Based on the calculation results of the WPI in Kinmen, compare the ranking with the WPI in Taiwan;
- (3)
- For influential indicators, use a time-series forecast by year to understand the changes in the WPI in Kinmen until 2030.
- (1)
- In the WPI, every component, second component, and indicator project can illustrate the water resource problems in Kinmen.
- (2)
- Different indicators have different calculation scales so that the differences between the indicators can be identified.
- (3)
- The indicator calculation results reflect the conditions of water resources in Kinmen.
2.5. Development of Water Resources in Kinmen
3. Research Method
3.1. The WPI Calculation Method
3.1.1. Transnational Application of the WPI
3.1.2. Development of Taiwan’s WPI
3.2. Time-Series Analysis
4. Research Results
4.1. Comparisons with Other Counties and Cities
- (1)
- The resource score: In situation 1, the total score of the Kinmen region was 0.621; thus, Kinmen was ranked 13th among all counties and cities. In situation 2, the total score of the Kinmen region was 0.619, ranking it 13th among all counties and cities. In both situations, Kinmen had the same rank.
- (2)
- The access score: In situation 1, the total score of the Kinmen region was 0.828, which ranked Kinmen 11th among all counties and cities. In situation 2, the total score of the Kinmen region was 0.838, ranking Kinmen 9th among all counties and cities. Kinmen’s ranking in situation 2 was more than that in situation 1.
- (3)
- The capacity score: In situation 1, the total score of the Kinmen region was 0.523, which ranked Kinmen 17th among all counties and cities. In situation 2, the total score of the Kinmen region was 0.522, ranking Kinmen 17th among all counties and cities. In these two situations, Kinmen had the same rank.
- (4)
- The use score: In situation 1, the total score of the Kinmen region was 0.532, ranking Kinmen 16th among all counties and cities. In situation 2, the total score of the Kinmen region was 0.547, which ranked Kinmen 15th among all counties and cities. Kinmen’s ranking in situation 2 was greater than that in situation 1.
- (5)
- The environment score: In situation 1, the total score of the Kinmen region was 0.809, ranking Kinmen first among all counties and cities. In situation 2, the total score of the Kinmen region was 0.799, which ranked Kinmen first among all counties and cities. In these two situations, Kinmen had the same rank.
- (6)
- An analysis of the overall scores and county and city rankings showed that, in situation 1, the total score of Kinmen was 0.663, which ranked Kinmen 10th among the 23 counties and cities, and, in situation 2, the total score of Kinmen was 0.664, which ranked Kinmen 9th among the 23 counties and cities.
4.2. Comparisons with Other Regions
- (1)
- In situation 1, Kinmen ranked last among the regions, including southern Taiwan, central Taiwan, northern Taiwan, eastern Taiwan, and Kinmen. In situation 2, Kinmen ranked the same. Figure 7 and Figure 8 compare Kinmen and the other regions of Taiwan in situations 1 and 2, respectively. In both figures, Taiwan is divided into four regions, namely north, central, south, and east, to facilitate its comparison with Kinmen.
- (2)
- Comparing the differences between each component of Kinmen in situations 1 and 2. Except for the capacity component in situation 2 (0.01), which was higher than that in situation 1, the other components in situation 1 were all higher than those in situation 2 by 0.01–0.03. Overall, no significant differences were observed in the WPI between situations 1 and 2.
4.3. The Future Development of the WPI of Kinmen
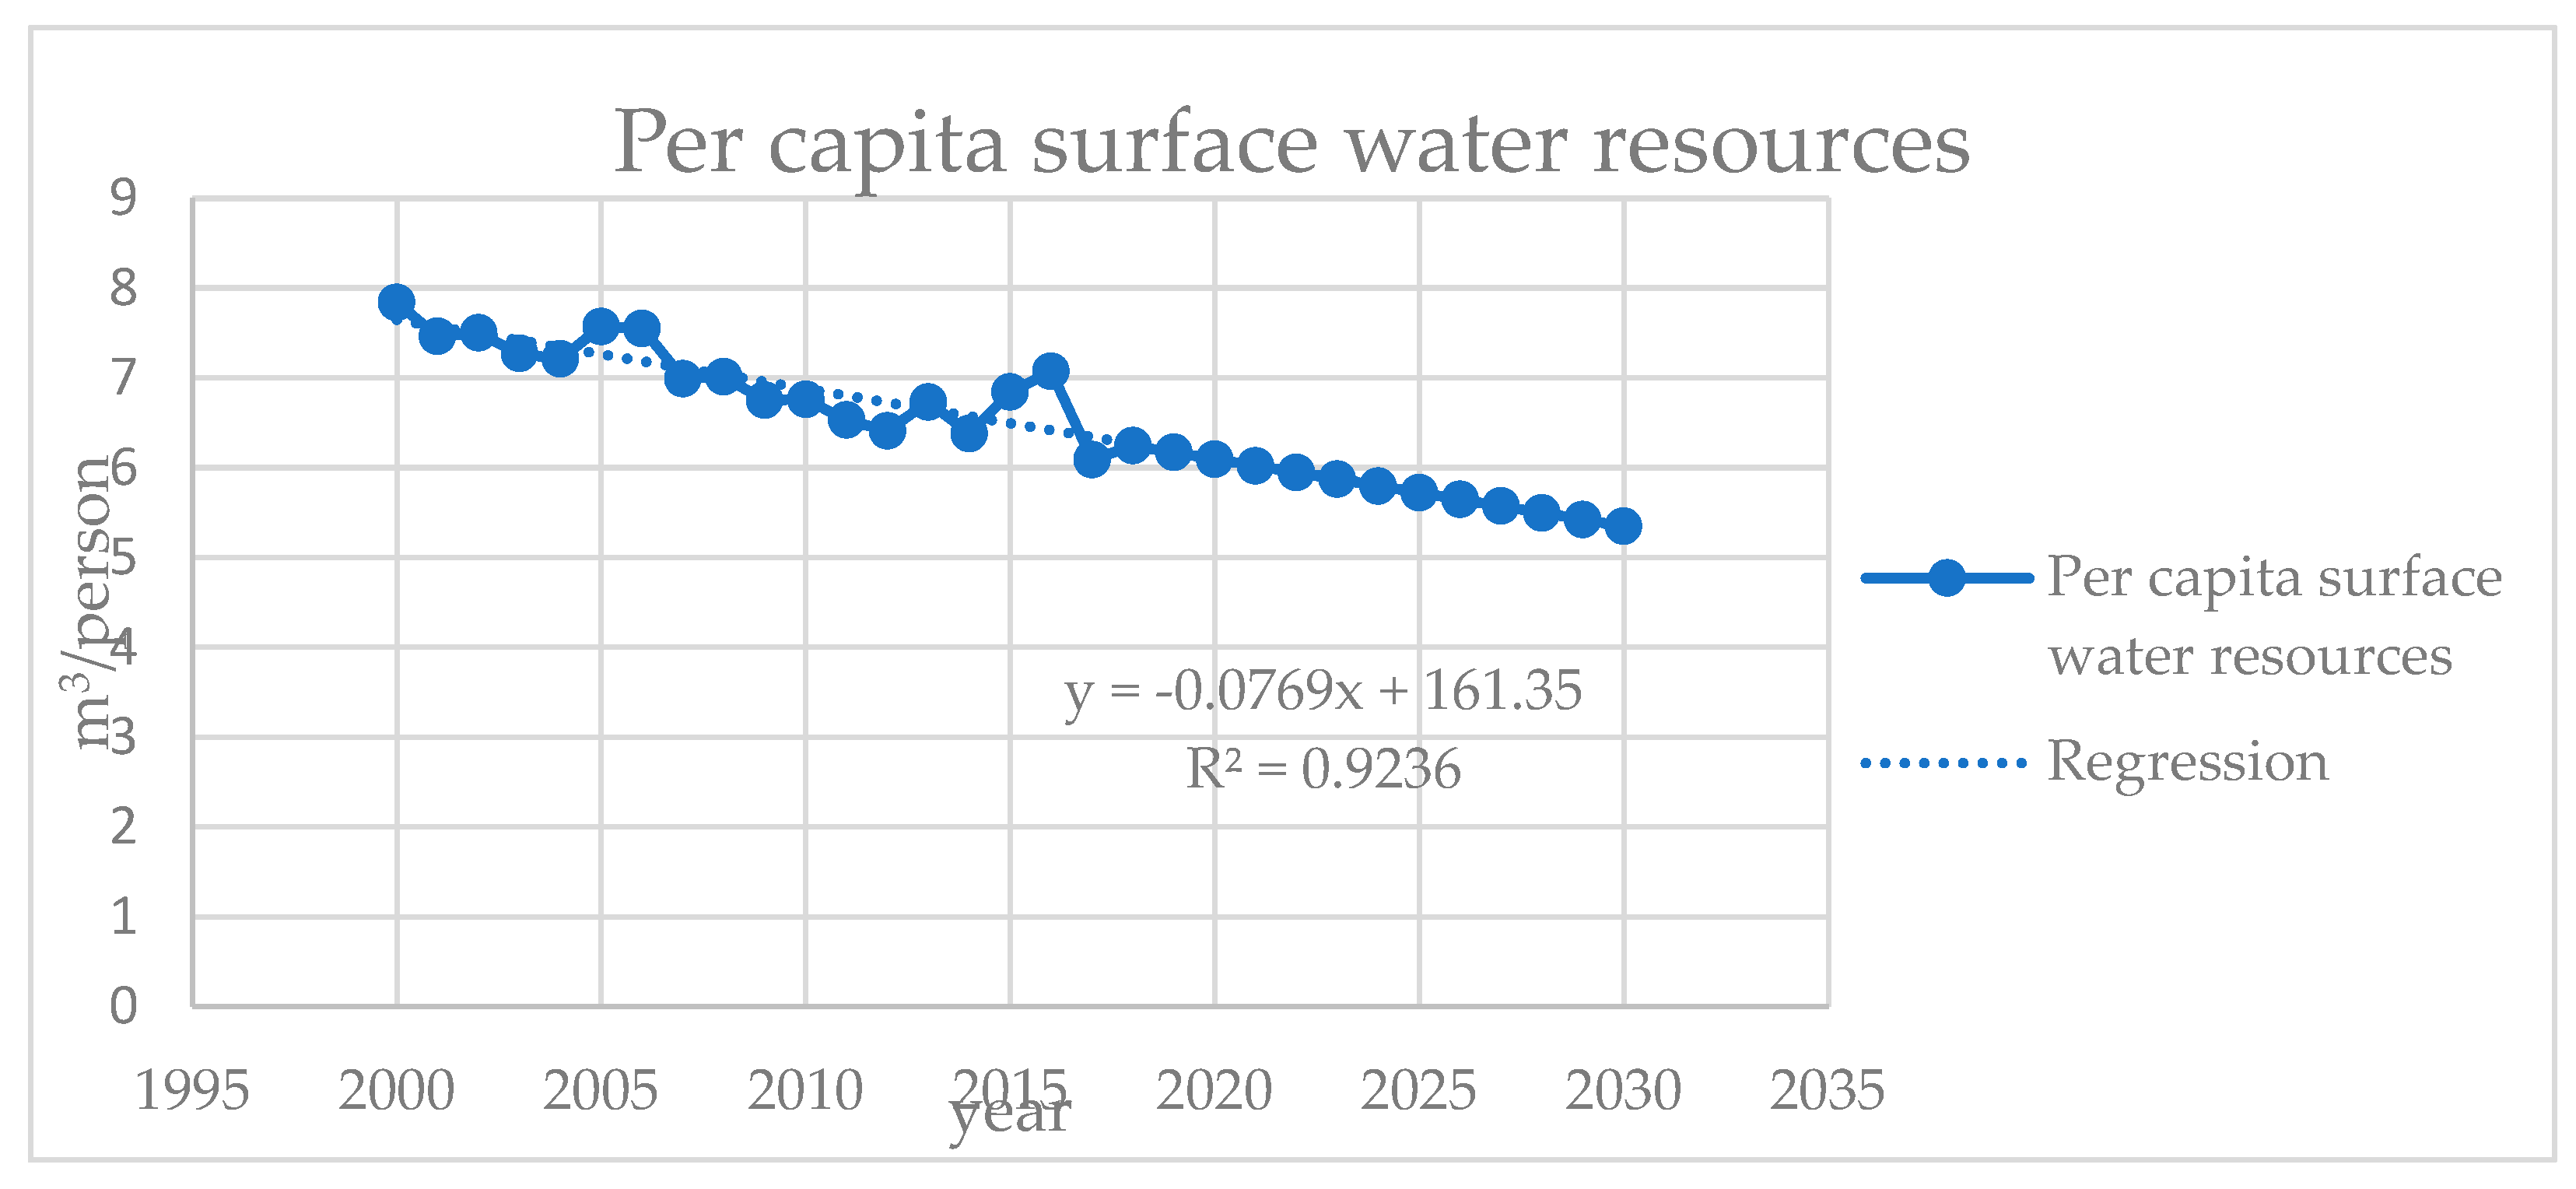
- (1)
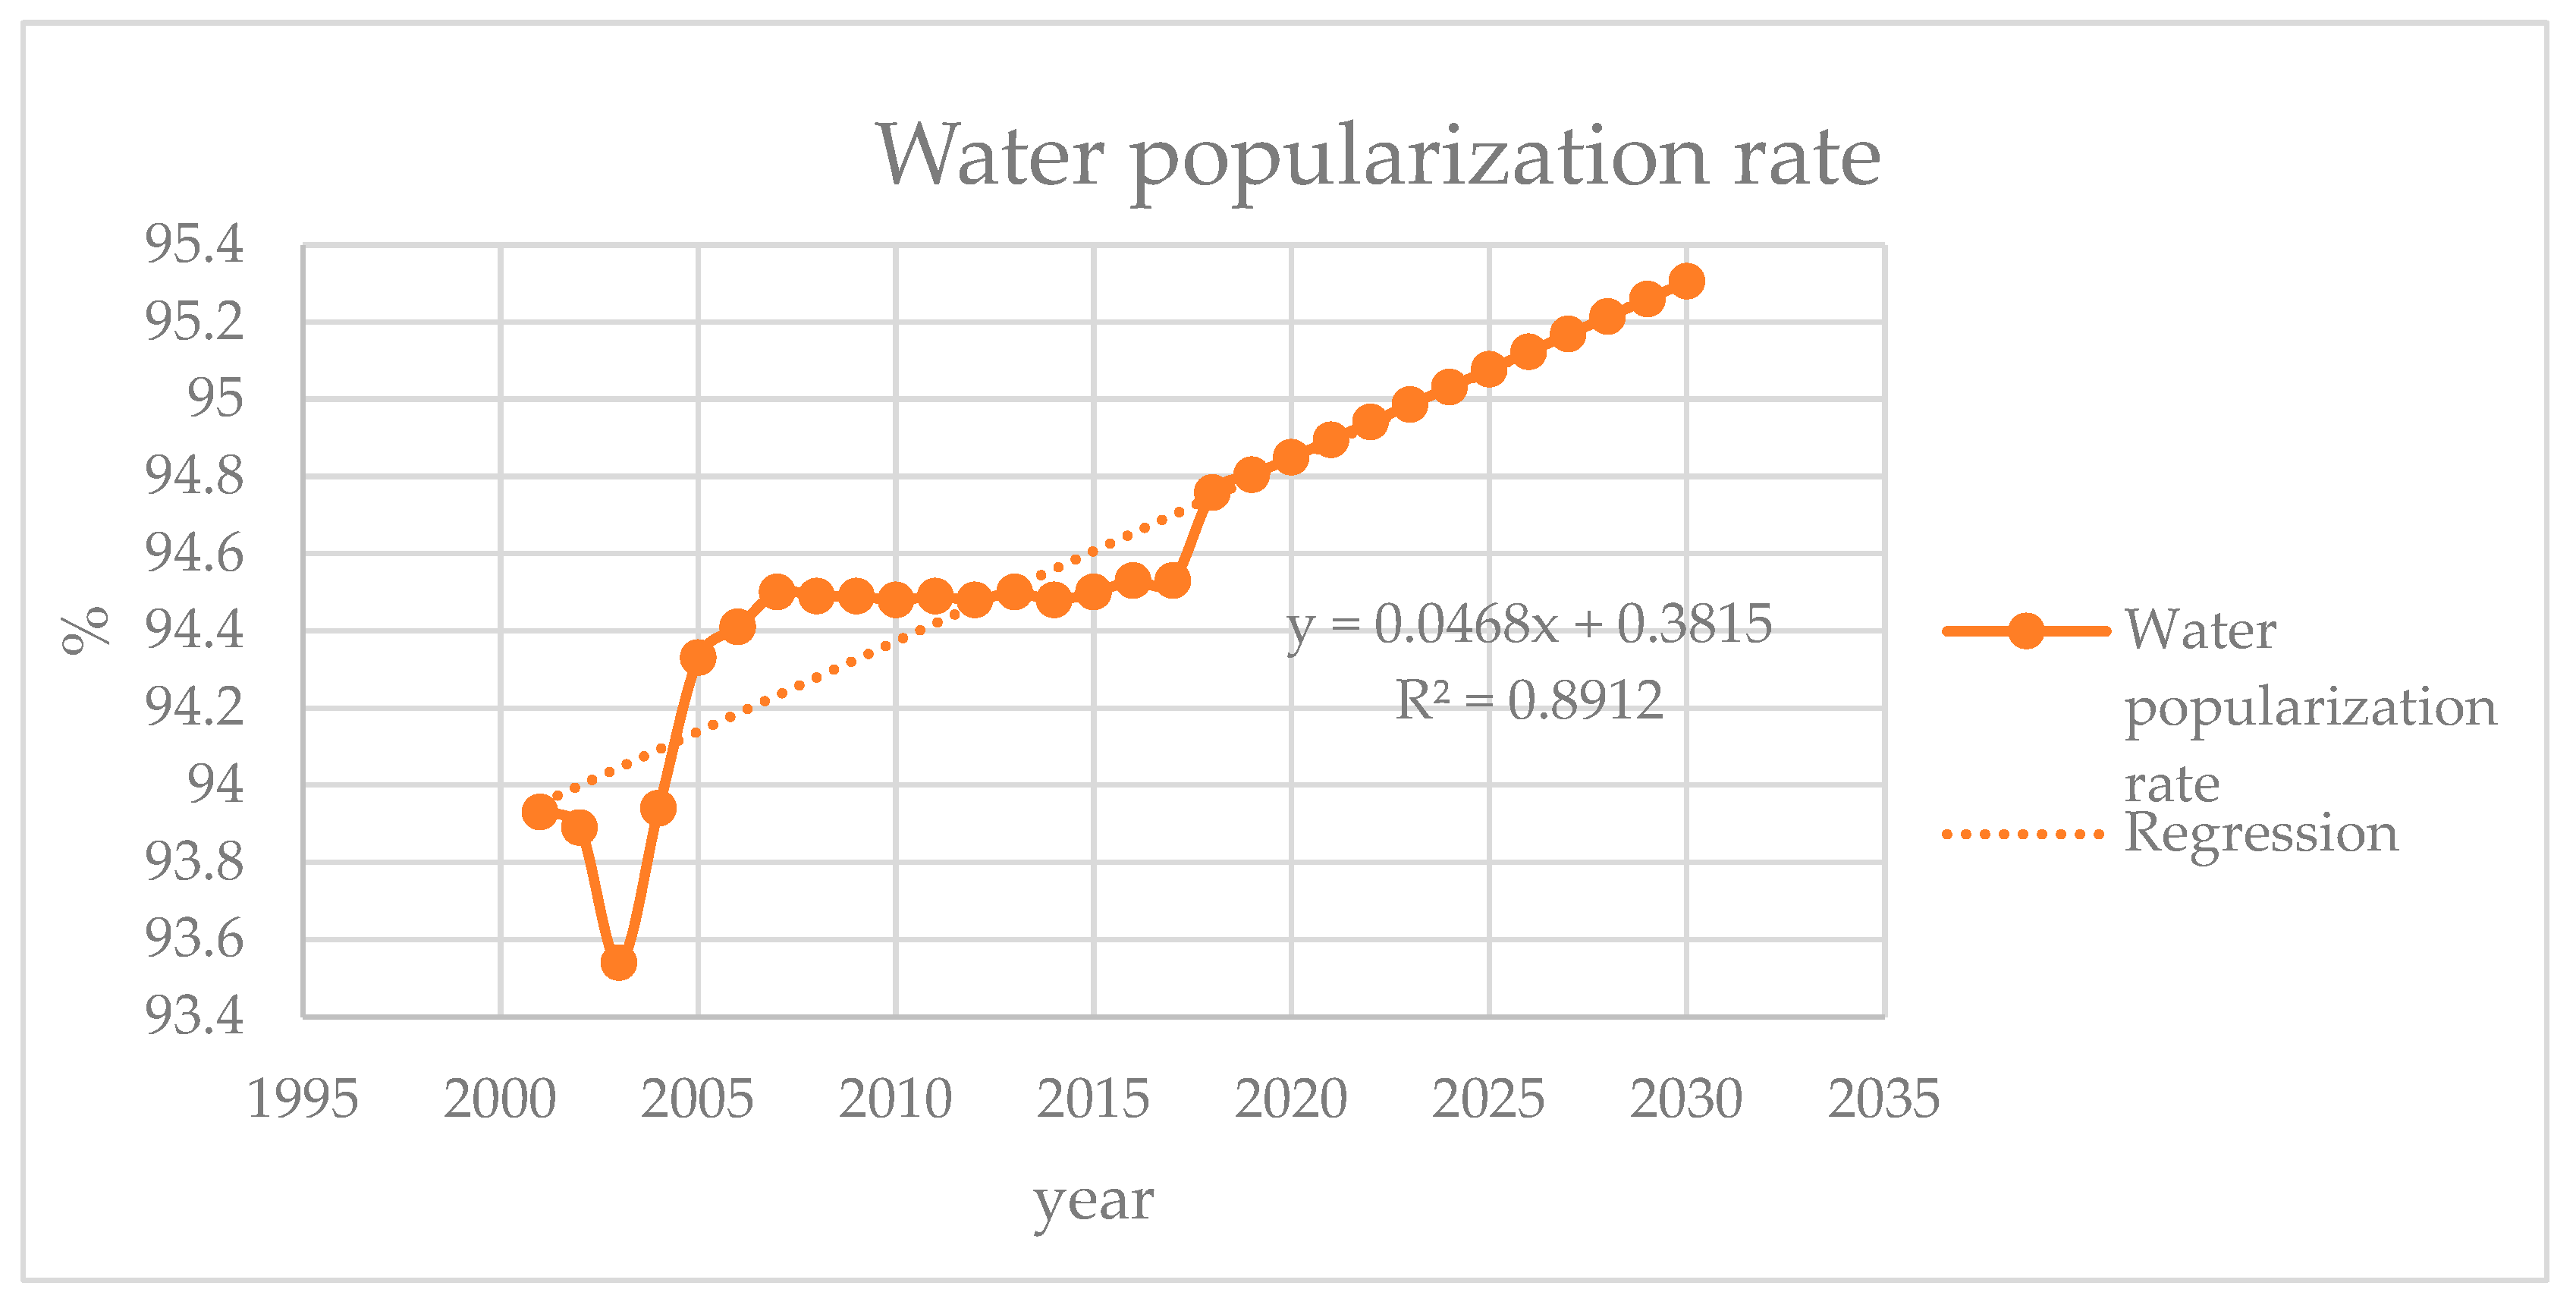
- (2)
- Water popularization rate: According to estimations based on the WPI data, the water popularization rate in Kinmen will be reduced to approximately 95.3% because of the increase in the immigrant population by 2030 (Figure 10).
- (3)
- People over 15 years old according to their proportion of higher education: According to estimations based on the WPI data, the proportion of people over 15 years old with higher education in Kinmen will increase to approximately 56% by 2030 (Figure 11).
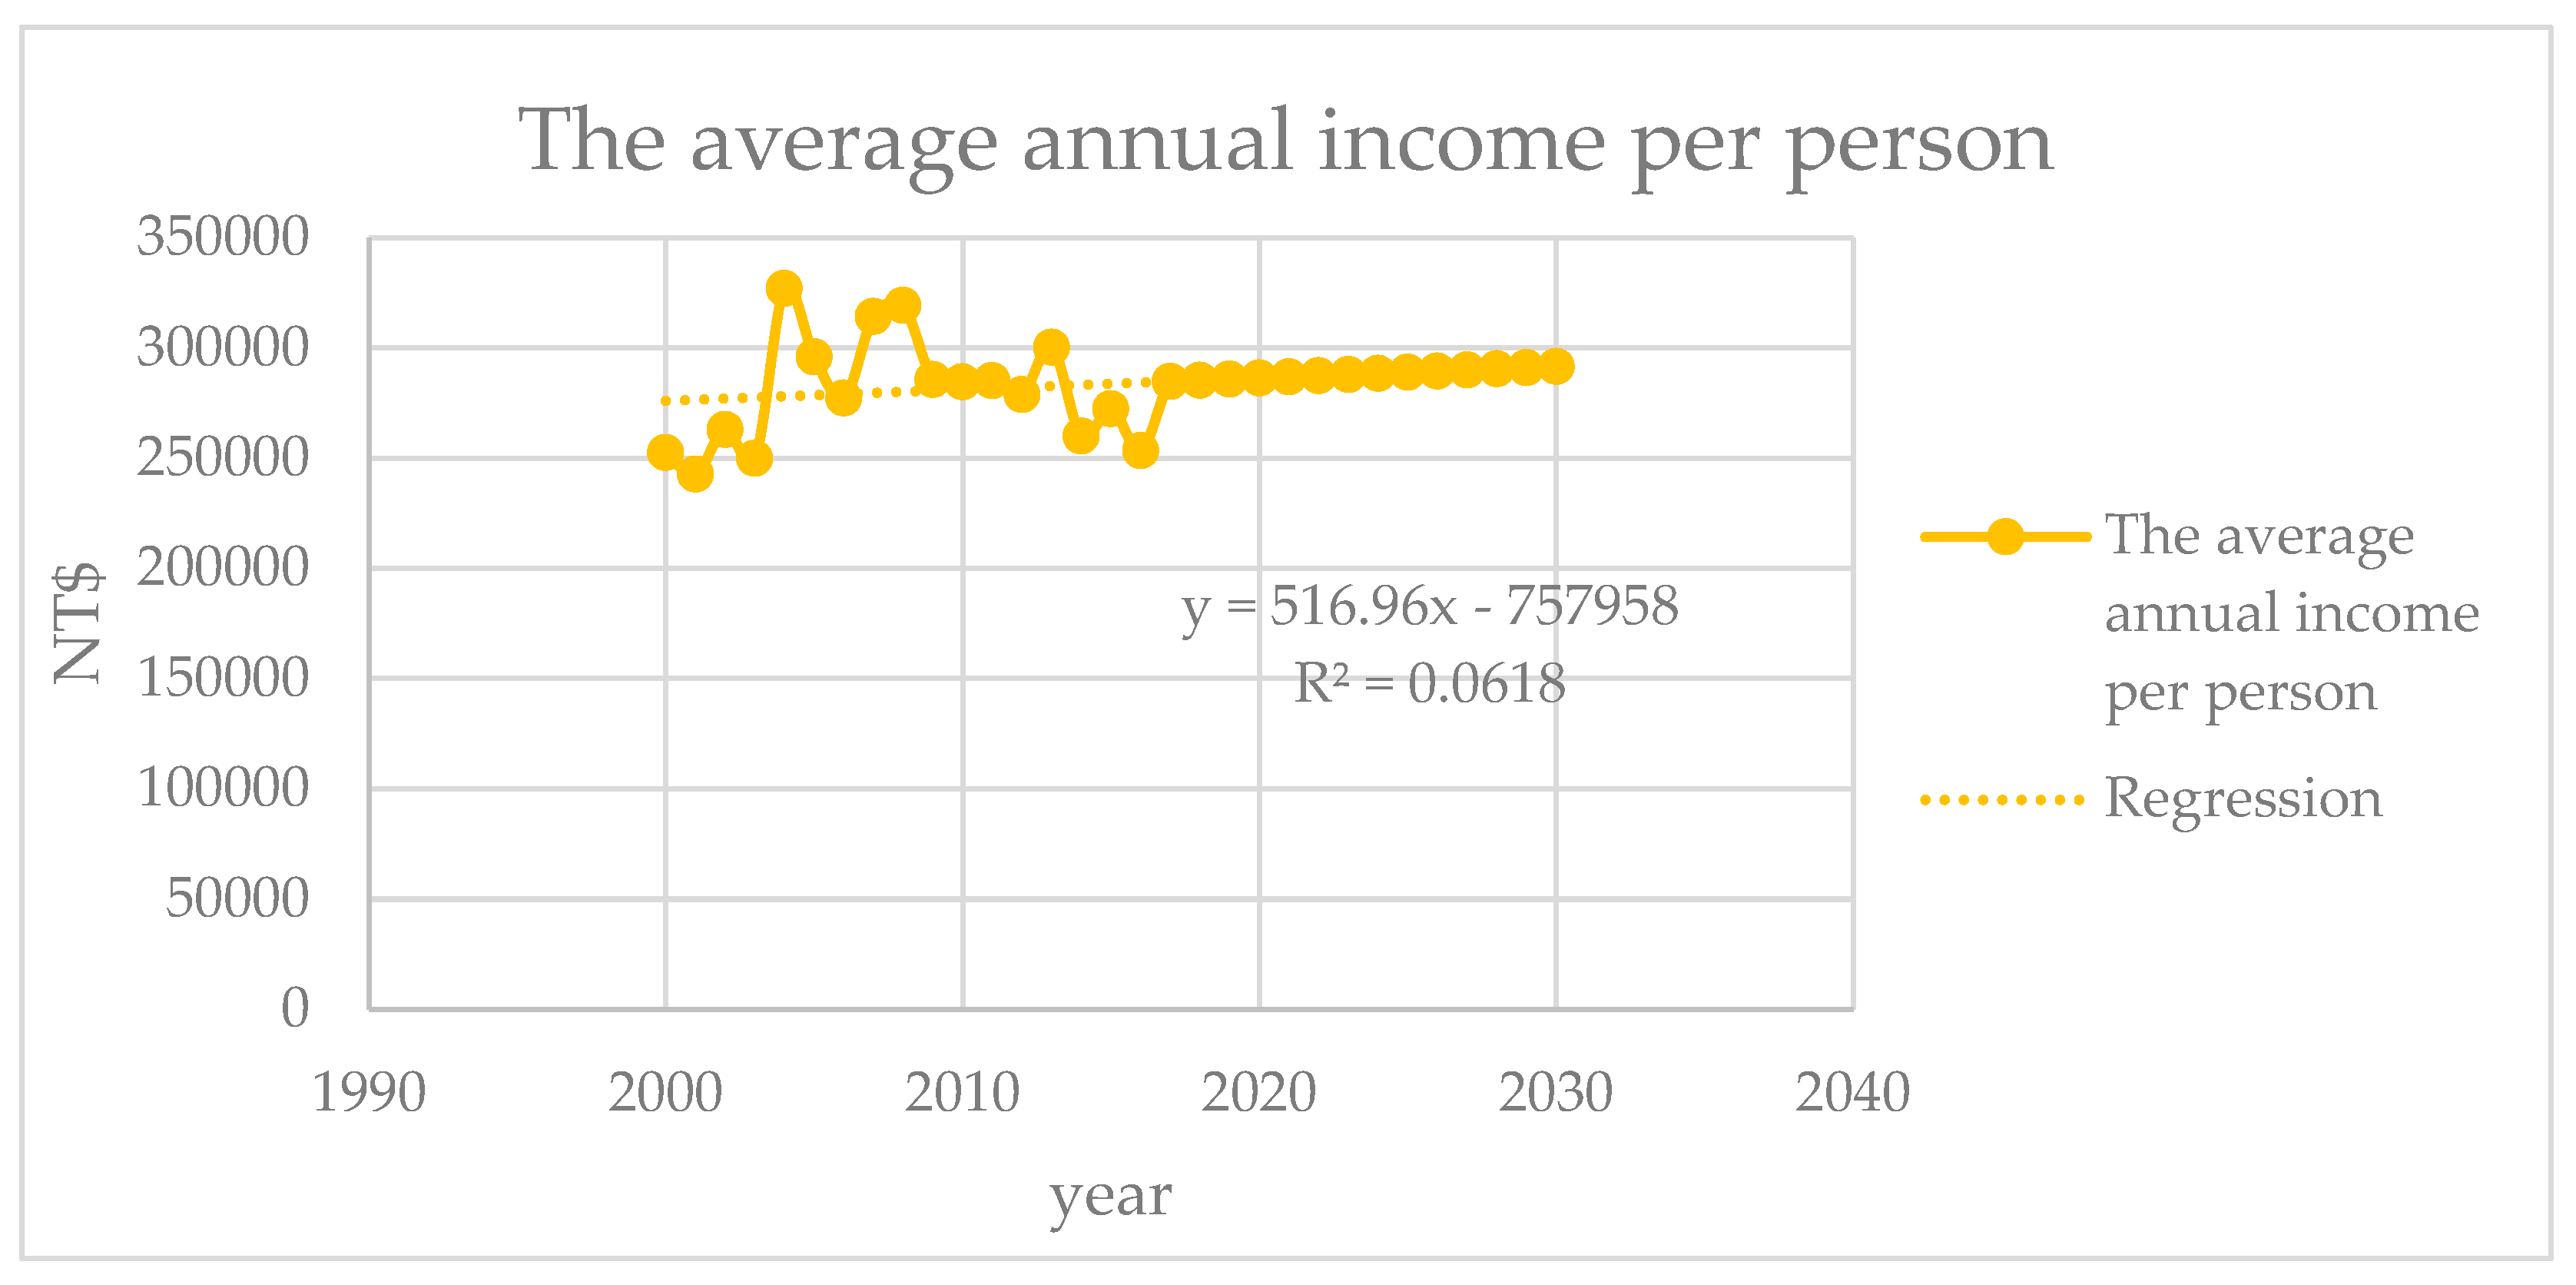
- (4)
- The average annual income per person: According to estimations based on the WPI data, the average annual income per person in Kinmen will increase to approximately 291,000 yuan/person by 2030 (Figure 12).
- (5)
- Daily livelihood water consumption per person: According to estimations based on the WPI data, the daily livelihood water consumption per person in Kinmen will be reduced to approximately 88.71 L/person by 2030 (Figure 13).
- (6)
- Water pipeline leakage rate: According to estimations based on the WPI data, the water pipeline leakage rate in Kinmen will be reduced to approximately 10.42% by 2030 (Figure 14).
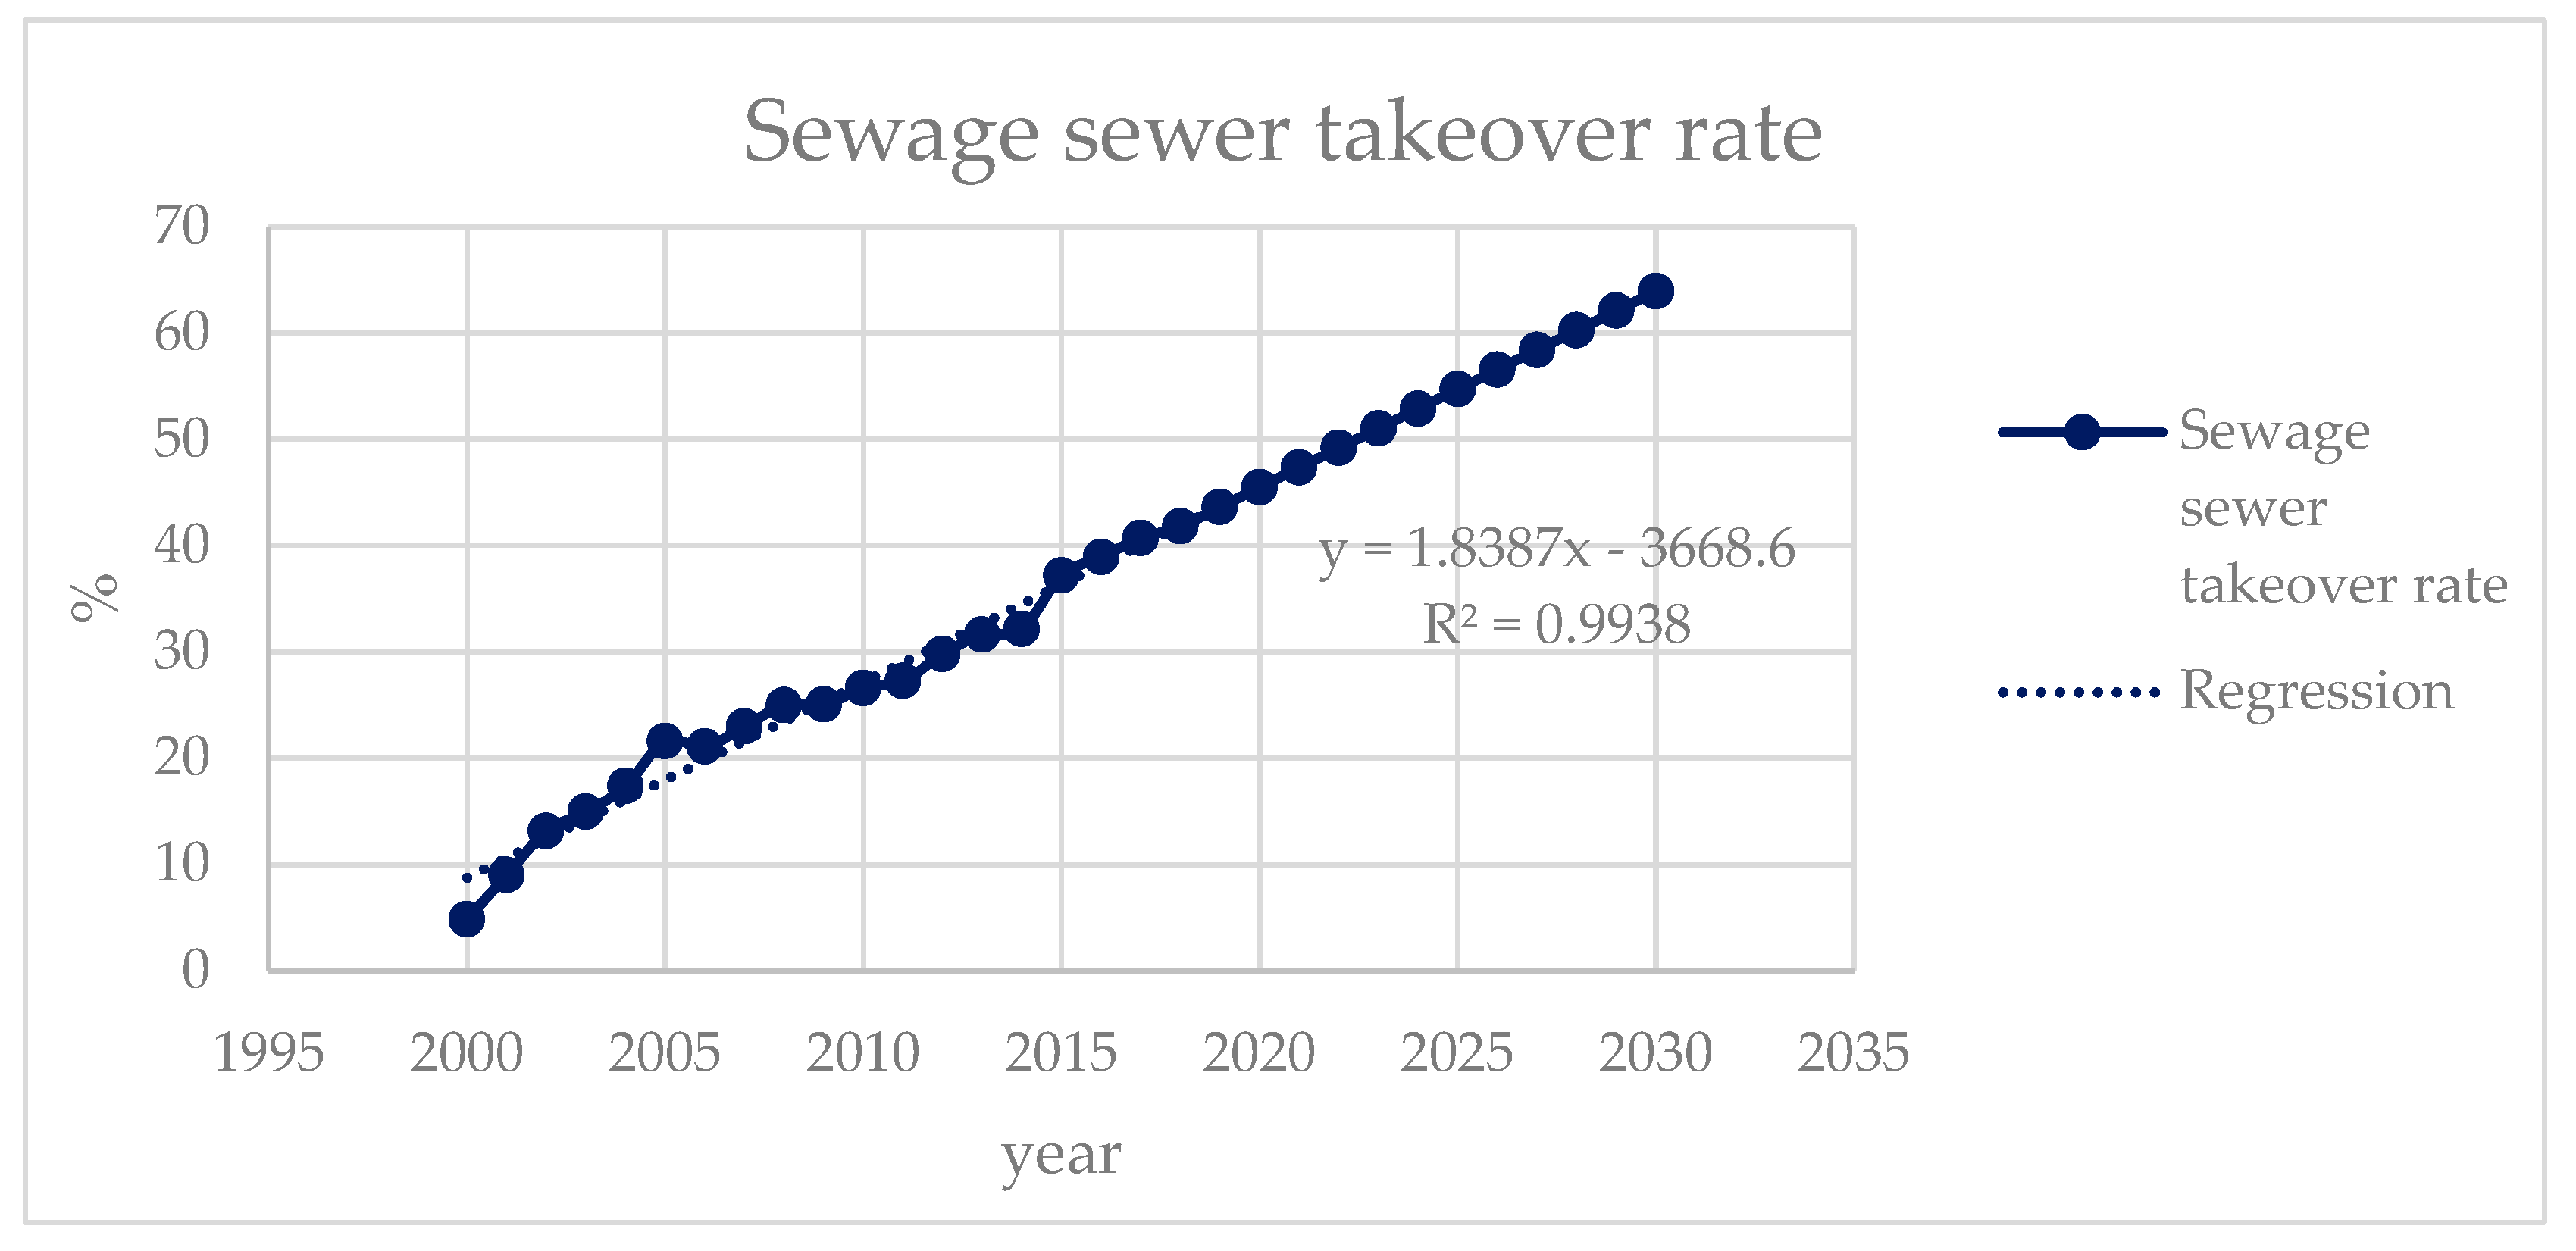
- (7)
- Sewage sewer takeover rate: According to estimations based on the WPI data, the sewage sewer takeover rate in Kinmen will be approximately 63.9% by 2030 (Figure 15).
5. Conclusions and Suggestions
5.1. Conclusions
5.2. Policies and Suggestions
Author Contributions
Funding
Conflicts of Interest
References
- Eliasson, J. The rising pressure of global water shortages. Nature 2015, 517, 6. Available online: https://www.nature.com/news/the-rising-pressure-of-global-water-shortages-1.16622 (accessed on 17 March 2020). [CrossRef] [PubMed]
- Cakir, R.; Raimonet, M.; Sauvage, S.; Paredes-Arquiola, J.; Grusson, Y.; Roset, L.; Meaurio, M.; Navarro, E.; Sevilla-Callejo, M.; Lechuga-Crespo, J.L.; et al. Hydrological Alteration Index as an Indicator of the Calibration Complexity of Water Quantity and Quality Modeling in the Context of Global Change. Water 2019, 12, 115. [Google Scholar] [CrossRef] [Green Version]
- Mekonnen, M.M.; Hoekstra, A.Y. Four billion people facing severe water scarcity. Sci. Adv. 2016, 2, e1500323. [Google Scholar] [CrossRef] [PubMed] [Green Version]
- Vörösmarty, C.J.; McIntyre, P.B.; Gessner, M.O.; Dudgeon, D.; Prusevich, A.; Green, P.; Glidden, S.; Bunn, S.E.; Sullivan, C.A.; Liermann, C.R. Global threats to human water security and river biodiversity. Nature 2010, 467, 555–561. [Google Scholar] [CrossRef] [PubMed]
- European Environment Agency (EEA). EEA Report Water Use and Environmental Pressures; EEA: Copenhagen, Denmark, 2018. [Google Scholar]
- Roudier, P.; Andersson, J.C.; Donnelly, C.; Feyen, L.; Greuell, W.; Ludwig, F. Projections of future floods and hydrological droughts in Europe under a+ 2 C global warming. Clim. Chang. 2016, 135, 341–355. Available online: https://www.eea.europa.eu/ (accessed on 30 January 2020). [CrossRef] [Green Version]
- UNWWSD. Water, Energy, Health, Agriculture and Biodiversity: In Synthesis of the Framework Paper of the Working Group on WEHAB; UN. Working Group on WEHAB: Johannesburg, South Africa, 2002; Available online: https://digitallibrary.un.org/record/472693 (accessed on 30 January 2020).
- Sullivan, C.A.; Meigh, J.R.; Giacomello, A.M. The water poverty index: Development and application at the community scale. Nat. Resour. Forum 2003, 27, 189–199. [Google Scholar] [CrossRef]
- Cudennec, C.; Leduc, C.; Koutsoyiannis, D. Dryland hydrology in Mediterranean regions—A review. Hydrol. Sci. J. /J. Des Sci. Hydrol. 2007, 52, 1077–1087. [Google Scholar] [CrossRef]
- Prinz, D.; Singh, A.K. Water resources in arid regions and their sustainable management. Ann. Arid Zone 2000, 39, 251–272. [Google Scholar]
- Alqadi, M.; Margane, A.; Al Raggad, M.; Subah, H.A.; Disse, M.; Hamdan, I.; Chiogna, G. Implementation of Simple Strategies to Improve Wellfield Management in Arid Regions: The Case Study of Wadi Al Arab Wellfield, Jordan. Sustainability 2019, 11, 5903. [Google Scholar] [CrossRef] [Green Version]
- Redoloza, F.; Li, L. A novel method for well placement design in groundwater management: Extremal optimization. Adv. Water Resour. 2019, 132, 103405. [Google Scholar] [CrossRef]
- Cousquer, Y.; Pryet, A.; Delbart, C.; Valois, R.; Dupuy, A. Adaptive optimization of a vulnerable well field. Hydrogeol. J. 2019, 27, 1673–1681. [Google Scholar] [CrossRef]
- Gejl, R.N.; Rygaard, M.; Henriksen, H.; Rasmussen, J.; Bjerg, P.L. Understanding the impacts of groundwater abstraction through long-term trends in water quality. Water Res. 2019, 156, 241–251. [Google Scholar] [CrossRef] [PubMed]
- Kawo, N.S.; Zhou, Y.; Magalso, R.; Salvacion, L. Optimization of an artificial-recharge–pumping system for water supply in the Maghaway Valley, Cebu, Philippines. Hydrogeol. J. 2018, 26, 963–977. [Google Scholar] [CrossRef]
- Wagner, B.J. Recent advances in simulation-optimization groundwater management modeling. Rev. Geophys. 1995, 33, 1021–1028. [Google Scholar] [CrossRef]
- Hartmann, B. Rethinking climate refugees and climate conflict: Rhetoric, reality and the politics of policy discourse. J. Int. Dev. J. Dev. Stud. Assoc. 2010, 22, 233–246. [Google Scholar] [CrossRef]
- Dryzek, J.S. The Politics of the Earth: Environmental Discourses; Oxford University Press: Oxford, UK, 2013. [Google Scholar]
- Hussein, H.; Natta, A.; Yehya, A.A.K.; Hamadna, B. Syrian Refugees, Water Scarcity, and Dynamic Policies: How Do the New Refugee Discourses Impact Water Governance Debates in Lebanon and Jordan? Water 2020, 12, 325. [Google Scholar] [CrossRef] [Green Version]
- Sullivan, C. Calculating a water poverty index. World Dev. 2002, 30, 1195–1210. [Google Scholar] [CrossRef]
- Yeh, S.-C.; Liu, M.-L. Research of Water Poverty Index to Taiwan. Water Resources Agency; Ministry of Economic Affairs: Taipei, Taiwan, 2003. [Google Scholar]
- Brack, W.; Dulio, V.; Ågerstrand, M.; Allan, I.; Altenburger, R.; Brinkmann, M.; Bunke, D.; Burgess, R.M.; Cousins, I.; Escher, B.I. Towards the review of the European Union Water Framework management of chemical contamination in European surface water resources. Sci. Total Environ. 2017, 576, 720–737. [Google Scholar] [CrossRef]
- Huang, S.; Feng, Q.; Lu, Z.; Wen, X.; Deo, R.C. Trend Analysis of Water Poverty Index for Assessment of Water Stress and Water Management Polices: A Case Study in the Hexi Corridor, China. Sustainability 2017, 9, 756. [Google Scholar] [CrossRef] [Green Version]
- Meng, X.; Zhang, Y.; Yu, X.; Zhan, J.; Chai, Y.; Critto, A.; Li, Y.; Li, J. Analysis of the Temporal and Spatial Distribution of Lake and Reservoir Water Quality in China and Changes in Its Relationship with GDP from 2005 to 2010. Sustainability 2015, 7, 2000–2027. [Google Scholar] [CrossRef] [Green Version]
- Feitelson, E.; Chenoweth, J. Water poverty: Towards a meaningful indicator. Water Policy 2002, 4, 263–281. [Google Scholar] [CrossRef]
- Cho, D.I.; Ogwang, T. Water Poverty Index. In Encyclopedia of Quality of Life and Well-Being Research; Michalos, A.C., Ed.; Springer: Dordrecht, The Netherlands, 2014; pp. 7003–7008. [Google Scholar] [CrossRef]
- Sullivan, C.; Meigh, J. Considering the Water Poverty Index in the context of poverty alleviation. Water Policy 2003, 5, 513–528. [Google Scholar] [CrossRef]
- Jemmali, H.; Matoussi, M.S. A multidimensional analysis of water poverty at local scale: Application of improved water poverty index for Tunisia. Water Policy 2013, 15, 98–115. [Google Scholar] [CrossRef] [Green Version]
- Forouzani, M.; Karami, E. Agricultural water poverty index and sustainability. Agron. Sustain. Dev. 2011, 31, 415–431. [Google Scholar] [CrossRef] [Green Version]
- Shin-cheng, Y.; Ming-Long, L.; Yi-Lin, C. Research and Applications of Water Poverty Index to Taiwan; Water Resources Agency, Ministry of Economic: Taipei, Taiwan, 2004. (In Chineses) [Google Scholar]
- Manandhar, S.; Pandey, V.P.; Kazama, F. Application of water poverty index (WPI) in Nepalese context: A case study of Kali Gandaki River Basin (KGRB). Water Resour. Manag. 2012, 26, 89–107. [Google Scholar] [CrossRef]
- Ifabiyi, I.; Ogunbode, T. The use of composite water poverty index in assessing water scarcity in the rural areas of Oyo State, Nigeria. AFRREV STECH Int. J. Sci. Technol. 2014, 3, 51–65. [Google Scholar] [CrossRef] [Green Version]
- Ayeni, A.; Soneye, A. Mapping Population Water Poverty of Akoko Northeast Communities, Nigeria. Environ. Res. Chall. Sustain. Dev. Niger. 2011, 1, 81–90. [Google Scholar]
- Sullivan, C.A.; Jemmali, H. Toward understanding water conflicts in MENA region: A comparative analysis using water poverty index. In Proceedings of the Economic Research Forum, Cairo, Egypt, 22–24 March 2014. [Google Scholar]
- Joint Research Centre-European Commission. Handbook on Constructing Composite Indicators: Methodology and User Guide; OECD Publishing: Paris, France, 2008. [Google Scholar]
- Saltelli, A. Composite indicators between analysis and advocacy. Soc. Indic. Res. 2007, 81, 65–77. [Google Scholar] [CrossRef]
- Jemmali, H. Mapping water poverty in Africa using the improved Multidimensional Index of Water Poverty. Int. J. Water Resour. Dev. 2017, 33, 649–666. [Google Scholar] [CrossRef]
- Garriga, R.G.; Foguet, A.P. Improved method to calculate a water poverty index at local scale. J. Environ. Eng. 2010, 136, 1287–1298. [Google Scholar] [CrossRef] [Green Version]
- van der Vyver, C. Water poverty index calculation: Additive or multiplicative function? J. S. Afr. Bus. Res. 2013, 2013, 1–11. [Google Scholar] [CrossRef]
- Juran, L.; MacDonald, M.C.; Basu, N.B.; Hubbard, S.; Rajagopal, R.; Rajagopalan, P.; Philip, L. Development and application of a multi-scalar, participant-driven water poverty index in post-tsunami India. Int. J. Water Resour. Dev. 2017, 33, 955–975. [Google Scholar] [CrossRef]
- Yeh, Y.-H. Applications of GIS to Comparing WPI and CVI in Counties/Cities in Taiwan. Master’s Thesis, National Kaohsiung Normal University Kaohsiung, Kaohsiung, Taiwan, 2005. (In Chineses). [Google Scholar]
- Kinmen County Government. Kinmen County Government World Wide Web. 2020. Available online: https://www.kinmen.gov.tw/ (accessed on 28 February 2020).
- Ministry of Economic Affairs, R.O.C. Master Plan of Water Resources Management for Eastern Taiwan and Offshore Islands (Ratified Version); Ministry of Economic Affairs: Taipei, Taiwan, 2017. (In Chineses) [Google Scholar]
- Kinmen County Government. Strategic Research Plan for Management and Utilization of Groundwater Resources in Kinmen; Kinmen County Government: Kinmen County, Taiwan, 2012. (In Chineses)
- Meighand, D.J.; Sullivan, D.C. The Water Poverty Index: Scale Issues and Applications; Centre for Ecology & Hydrology: Wallingford, UK, 2003. [Google Scholar]
- Yeh, S.-C. Application of Taiwan’s Water Poverty Index and International Cooperation; Report No. MOEAWRA0940227; Environmental Quality Protection Foundation: Taipei, Taiwan, 2005. (In Chineses) [Google Scholar]
- Woudenberg, F. An evaluation of Delphi. Technol. Forecast. Soc. Chang. 1991, 40, 131–150. [Google Scholar] [CrossRef]
- Rowe, G.; Wright, G.; Bolger, F. Delphi: A reevaluation of research and theory. Technol. Forecast. Soc. Chang. 1991, 39, 235–251. [Google Scholar] [CrossRef]
- Lindeman, C.A. Delphi survey of priorities in clinical nursing research. Nurs. Res. 1975, 24, 434–441. [Google Scholar] [CrossRef]
- Hsu, W.-L.; Chen, Y.-S.; Shiau, Y.-C.; Liu, H.-L.; Chern, T.-Y. Curriculum Design in Construction Engineering Departments for Colleges in Taiwan. Educ. Sci. 2019, 9, 65. [Google Scholar] [CrossRef] [Green Version]
- Linstone, H.A. The delphi technique. In Environmental Impact Assessment, Technology Assessment, and Risk Analysis; Springer: Berlin/Heidelberg, Germany, 1985; pp. 621–649. [Google Scholar]
- Fischer, R.G. The Delphi method: A description, review and criticism. J. Acad. Librariansh. 1978, 4, 64–70. [Google Scholar]
- Murry Jr, J.W.; Hammons, J.O. Delphi: A Versatile Methodology for Conducting Qualitative Research. Rev. High. Educ. 1995, 18, 423–436. [Google Scholar] [CrossRef]
- Hwang, C.L.; Lin, M.L. Group Decision Making Under Multiple Criteria Method & Application; Springer: Berlin/Heidelberg, Germany, 1987. [Google Scholar]
- Powell, C. The Delphi technique: Myths and realities. J. Adv. Nurs. 2003, 41, 376–382. [Google Scholar] [CrossRef] [Green Version]
- Hsu, W.-L.; Tsai, F.-M.; Shiau, Y.-C. Planning and assessment system for light rail transit construction in Taiwan. Microsyst. Technol. 2018. [Google Scholar] [CrossRef]
- Yeh, S.C. Applications of Taiwan’s Water Poverty Index and lnternational Cooperation. In Reserach Report of Environmental Quality Protection Foundation Commissioned by the Water Resources Agency of the Ministry of Economic Affairs; Ministry of Economic Affairs: Taipei, Taiwan, 2005. (In Chineses) [Google Scholar]
- Kinmen County Government. 2002–2012 Annual Statistical Report of Kinmen County; Kinmen County Government: Kinmen County, Taiwan, 2012. (In Chineses)
- Central Weather Bureau. 2004-2011 Daily Precipitation Data Obtained by Meteorological Stations in Kinmen; Central Weather Bureau: Taipei, Taiwan, 2019. (In Chineses) [Google Scholar]


| Component | Subcomponent |
|---|---|
| Resources | Internal volume of fresh water sources, foreign water, population. |
| Access | Percentage of the population that can get clean water; percentage of the population that can use sanitary equipment, percentage of the population for whom irrigation is acceptable. |
| Capacity | GDP Per Capita, under-five infant mortality, the proportion of education, Gini index (income distribution). |
| Use | Daily water consumption, the proportion of industrial water and agricultural water. |
| Environment | Standard (Z) value of the water quality, water pressure, environmental laws and management, biodiversity, information technology capacity indicators in the environmental sustainability index architecture. |
| Component | S1/S2 | Subcomponent | S1/S2 | Indicator | S1/S2 |
|---|---|---|---|---|---|
| Resources | 0.200/0.213 | Surface water | 0.066/0.072 | Amount of surface water resources per capita | 0.066/0.072 |
| Groundwater | 0.066/0.072 | Amount of groundwater recharge per capita | 0.033/0.037 | ||
| 0.066/0.067 | Proportion of groundwater use and recharge amount | 0.066/0.035 | |||
| Storage capacity | 0.066/0.067 | Effective capacity of reservoir per capita in area | 0.066/0.067 | ||
| Access | 0.200/0.188 | Water used for people’s livelihoods | 0.066/0.072 | Installation popularity rate of household water pipelines | 0.033/0.037 |
| Annual water rationing days of water use for people’s livelihood | 0.033/0.035 | ||||
| industrial water | 0.066/0.059 | Water rationing, days of annual industrial water | 0.066/0.059 | ||
| agricultural water | 0.066/0.057 | Proportion of irrigated area under arable land | 0.033/0.029 | ||
| Cost of compensation for water rationing effect irrigation fallow | 0.033/0.028 | ||||
| Capacity | 0.200/0.178 | Health | 0.050/0.050 | Infant mortality | 0.050/0.050 |
| Education | 0.050/0.045 | Literacy rates for population over 15 years of age | 0.025/0.023 | ||
| Proportion of people over 15 years of age received higher education | 0.025/0.022 | ||||
| Consumption capacity | 0.050/0.040 | Average annual disposable income per person | 0.025/0.020 | ||
| Engle coefficient | 0.025/0.019 | ||||
| Investment in water | 0.050/0.045 | Proportion of investment funds for water resource construction in public fixed capital | 0.050/0.045 | ||
| Use | 0.200/0.213 | Amount of water used for people’s livelihoods | 0.050/0.056 | Daily water consumption for people’s livelihoods per person | 0.050/0.056 |
| Efficiency of water use | 0.050/0.057 | Economic efficiency of industrial water use | 0.017/0.020 | ||
| Economic efficiency of water used in the service industry | 0.017/0.019 | ||||
| Economic efficiency of agricultural water use | 0.017/0.019 | ||||
| Cost | 0.050/0.049 | Cost of one cubic meter of running water | 0.050/0.049 | ||
| Leakage | 0.050/0.051 | Leakage rate of water pipeline | 0.050/0.051 | ||
| Environment | 0.200/0.213 | Landslide | 0.040/0.043 | Number of landslides declared per unit area | 0.040/0.043 |
| Flood | 0.040/0.041 | Annual average number of casualties caused by floods in recent ten years | 0.020/0.020 | ||
| Rainfall wet season and dry season ratio | 0.020/0.021 | ||||
| Formation subsidence | 0.040/0.044 | Proportion of the area of continuous subsidence caused by the groundwater exceeding pumping | 0.040/0.044 | ||
| Biological diversity | 0.040/0.037 | Proportion of forest cover | 0.013/0.013 | ||
| Percentage of area of nature reserves | 0.013/0.012 | ||||
| Proportion of species threatened by survival | 0.013/0.012 | ||||
| Pollution | 0.040/0.048 | Proportion of being classified as heavily contaminated river sections | 0.020/0.023 | ||
| Sewage sewer takeover rate | 0.020/0.025 |
| Component | Resources | Access | Capacity | Use | Environment | WPI Total Score S1/S2 | Total Rank S1/S2 |
|---|---|---|---|---|---|---|---|
| County/City | S1/S2 | S1/S2 | S1/S2 | S1/S2 | S1/S2 | ||
| Keelung City | 0.589/0.585 | 0.782/0.786 | 0.505/0.506 | 0.274/0.283 | 0.533/0.531 | 0.537/0.533 | 23/23 |
| Taipei County | 0.633/0.628 | 0.810/0.813 | 0.624/0.628 | 0.535/0.523 | 0.755/0.749 | 0.671/0.666 | 7/8 |
| Taipei City | 0.614/0.610 | 0.825/0.828 | 0.762/0.758 | 0.506/0.495 | 0.644/0.634 | 0.670/0.658 | 9/12 |
| Taoyuan County | 0.637/0.633 | 0.736/0.749 | 0.510/0.504 | 0.663/0.652 | 0.760/0.755 | 0.661/0.662 | 12/10 |
| Hsinchu County | 0.691/0.688 | 0.629/0.614 | 0.614/0.620 | 0.634/0.626 | 0.786/0.779 | 0.671/0.669 | 7/7 |
| Hsinchu City | 0.612/0.608 | 0.759/0.744 | 0.610/0.609 | 0.777/0.777 | 0.780/0.777 | 0.708/0.705 | 2/3 |
| Miaoli County | 0.830/0.828 | 0.732/0.717 | 0.749/0.756 | 0.679/0.673 | 0.778/0.767 | 0.754/0.749 | 1/1 |
| Taichung County | 0.741/0.737 | 0.842/0.837 | 0.499/0.497 | 0.459/0.455 | 0.777/0.769 | 0.663/0.660 | 10/11 |
| Taichung City | 0.432/0.428 | 0.925/0.921 | 0.580/0.578 | 0.400/0.394 | 0.719/0.716 | 0.611/0.601 | 21/21 |
| Nantou County | 0.790/0.786 | 0.778/0.776 | 0.533/0.538 | 0.571/0.573 | 0.782/0.770 | 0.691/0.692 | 4/4 |
| Changhua County | 0.588/0.589 | 0.886/0.881 | 0.507/0.513 | 0.662/0.667 | 0.490/0.487 | 0.627/0.625 | 18/17 |
| Yunlin County | 0.666/0.671 | 0.890/0.886 | 0.602/0.610 | 0.623/0.621 | 0.364/0.355 | 0.629/0.623 | 17/18 |
| Chiayi County | 0.730/0.734 | 0.841/0.839 | 0.584/0.586 | 0.658/0.658 | 0.573/0.562 | 0.677/0.675 | 6/6 |
| Chiayi City | 0.392/0.392 | 0.829/0.832 | 0.631/0.638 | 0.653/0.653 | 0.700/0.698 | 0.641/0.638 | 16/15 |
| Tainan County | 0.584/0.586 | 0.853/0.853 | 0.565/0.568 | 0.742/0.736 | 0.530/0.519 | 0.655/0.650 | 13/13 |
| Tainan City | 0.500/0.500 | 0.875/0.875 | 0.610/0.616 | 0.749/0.744 | 0.533/0.534 | 0.653/0.650 | 14/14 |
| Kaohsiung County | 0.572/0.573 | 0.828/0.826 | 0.477/0.476 | 0.527/0.520 | 0.718/0.707 | 0.624/0.620 | 19/19 |
| Kaohsiung County | 0.278/0.279 | 0.945/0.939 | 0.574/0.575 | 0.607/0.604 | 0.688/0.701 | 0.618/0.613 | 20/20 |
| Pingtung County | 0.688/0.691 | 0.744/0.729 | 0.563/0.564 | 0.651/0.650 | 0.744/0.735 | 0.678/0.676 | 5/5 |
| Taitung County | 0.647/0.644 | 0.790/0.786 | 0.500/0.492 | 0.251/0.262 | 0.728/0.720 | 0.583/0.579 | 22/22 |
| Hualien County | 0.760/0.759 | 0.793/0.786 | 0.623/0.615 | 0.239/0.245 | 0.749/0.740 | 0.633/0.626 | 15/16 |
| Yilan County | 0.826/0.825 | 0.882/0.874 | 0.555/0.557 | 0.594/0.596 | 0.684/0.681 | 0.708/0.708 | 2/2 |
| Kinmen County | 0.621/0.619 | 0.828/0.838 | 0.523/0.522 | 0.532/0.547 | 0.809/0.799 | 0.663/0.664 | 10/9 |
© 2020 by the authors. Licensee MDPI, Basel, Switzerland. This article is an open access article distributed under the terms and conditions of the Creative Commons Attribution (CC BY) license (http://creativecommons.org/licenses/by/4.0/).
Share and Cite
Chen, T.-T.; Hsu, W.-L.; Chen, W.-K. An Assessment of Water Resources in the Taiwan Strait Island Using the Water Poverty Index. Sustainability 2020, 12, 2351. https://doi.org/10.3390/su12062351
Chen T-T, Hsu W-L, Chen W-K. An Assessment of Water Resources in the Taiwan Strait Island Using the Water Poverty Index. Sustainability. 2020; 12(6):2351. https://doi.org/10.3390/su12062351
Chicago/Turabian StyleChen, Tung-Tsan, Wei-Ling Hsu, and Wen-Kuang Chen. 2020. "An Assessment of Water Resources in the Taiwan Strait Island Using the Water Poverty Index" Sustainability 12, no. 6: 2351. https://doi.org/10.3390/su12062351