Identifying Urban Flood Regulation Priority Areas in Beijing Based on an Ecosystem Services Approach


Abstract
:1. Introduction
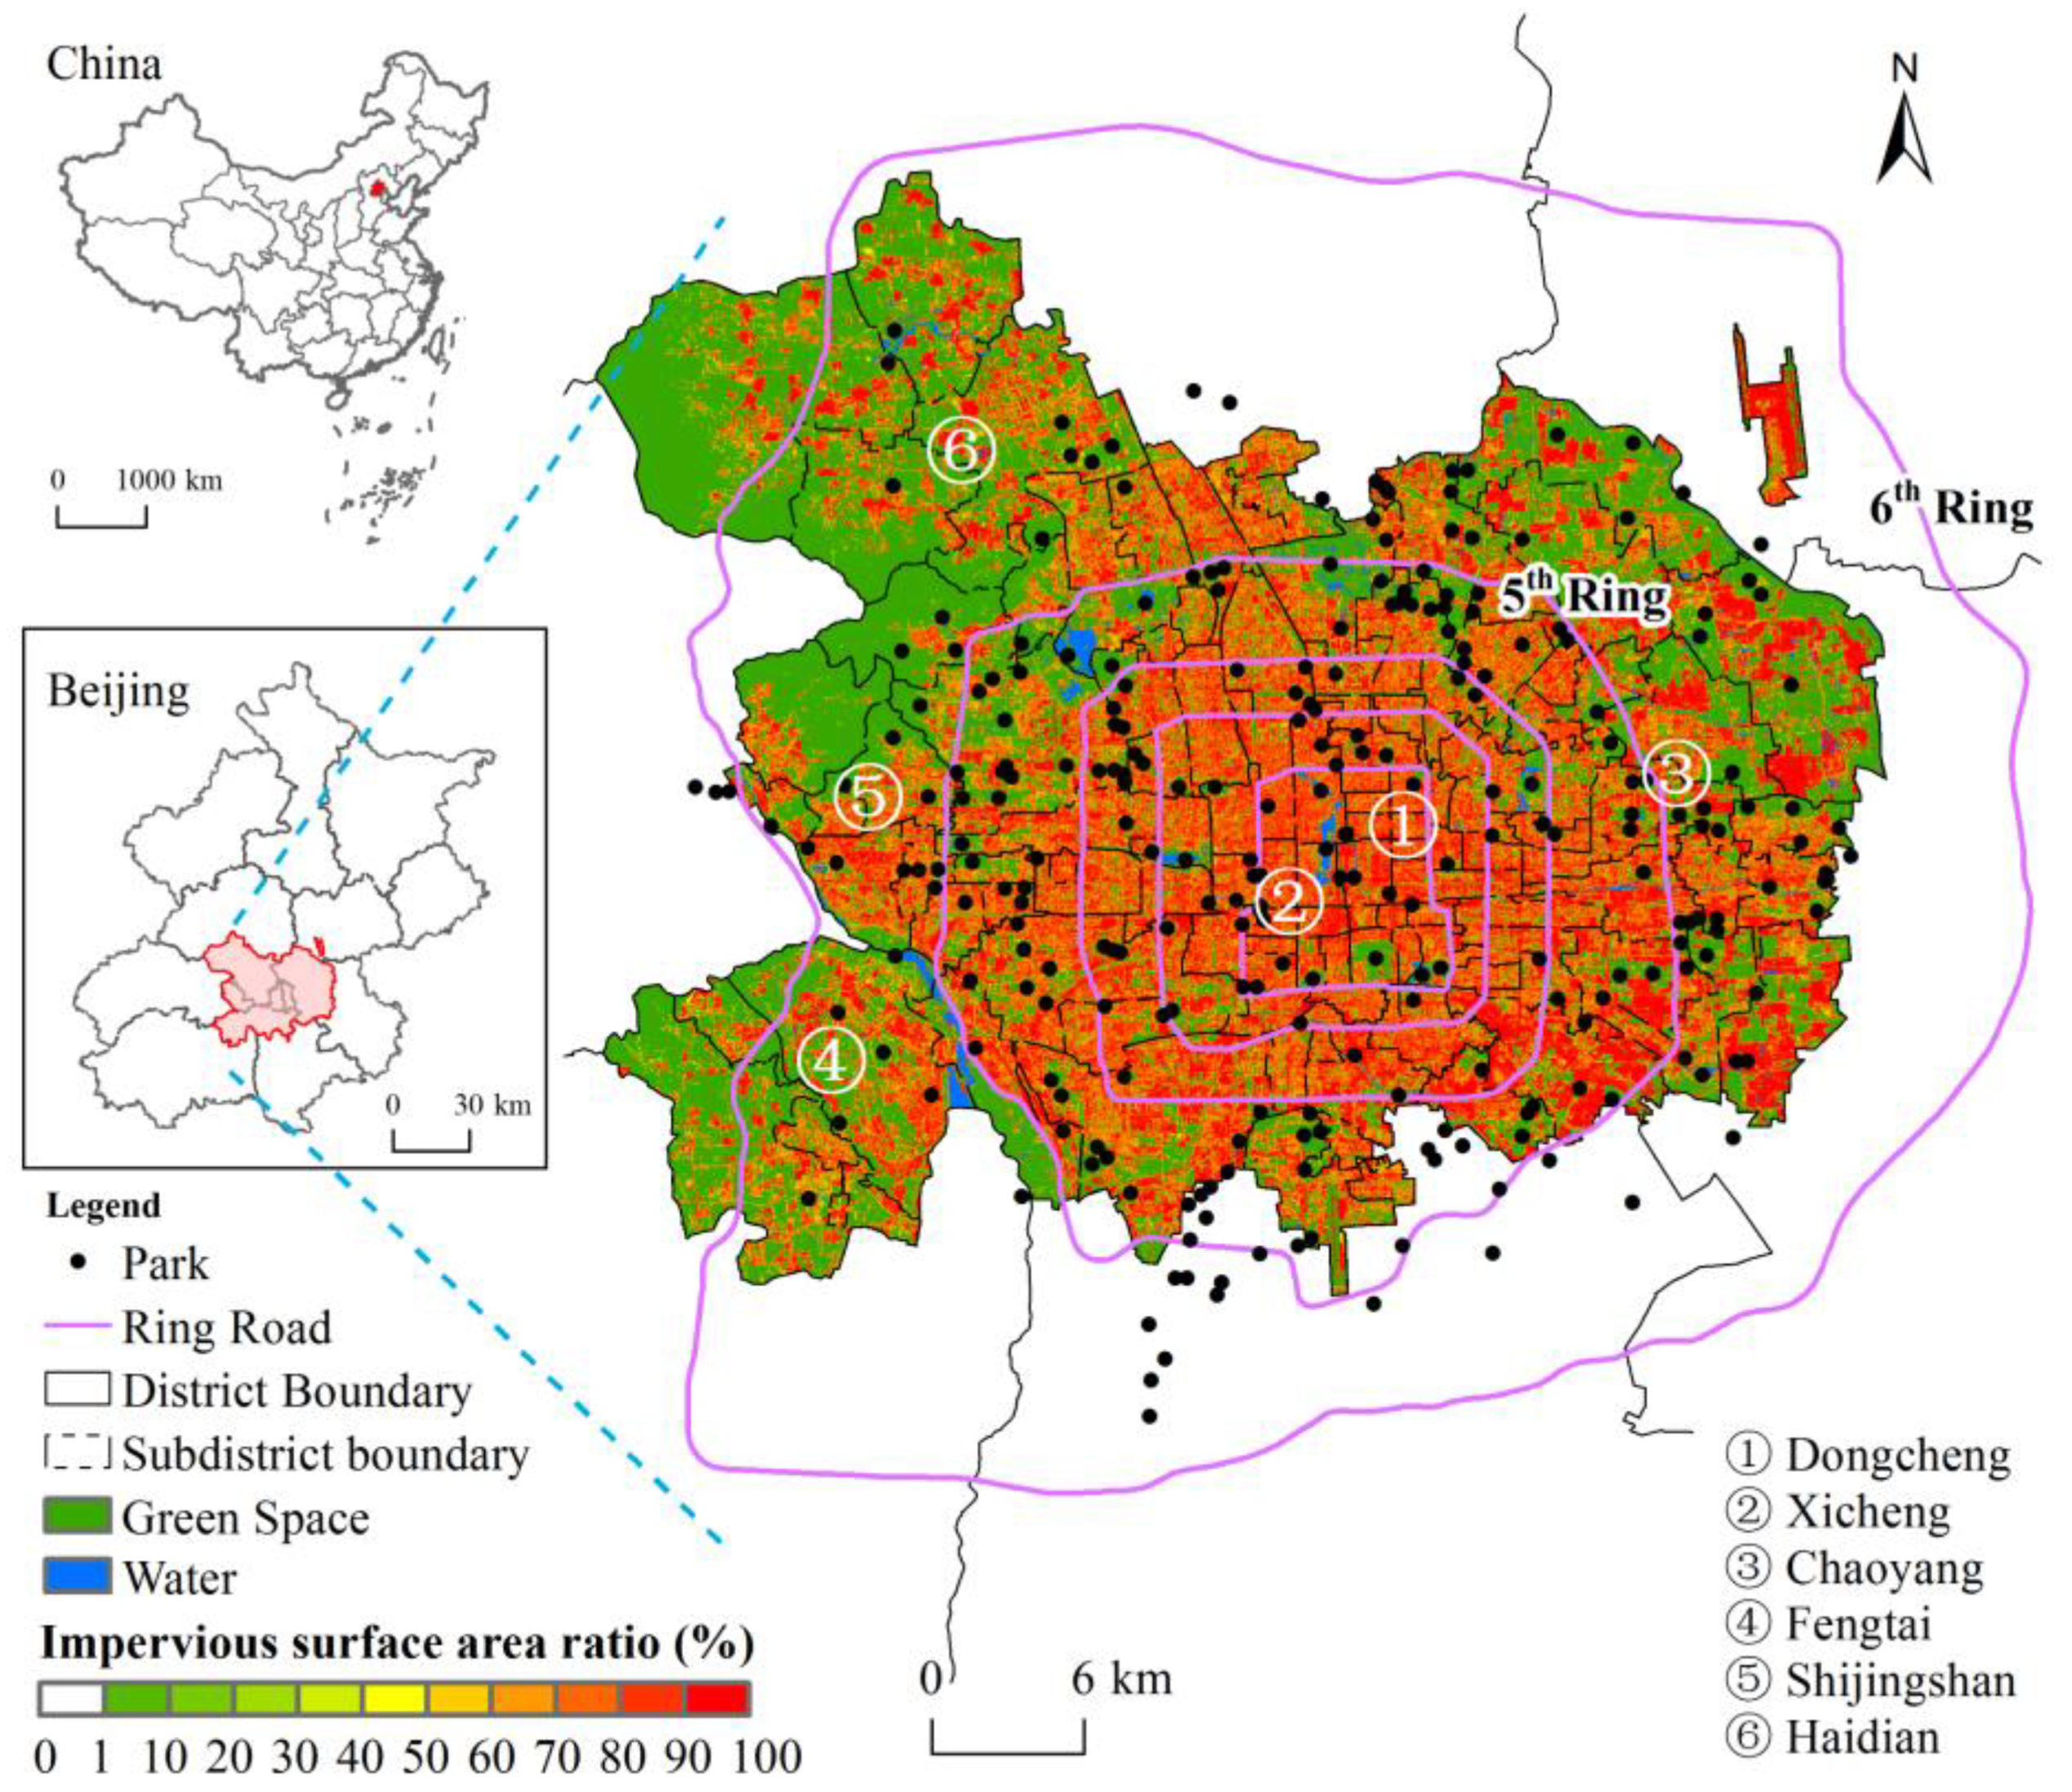
2. Study Area
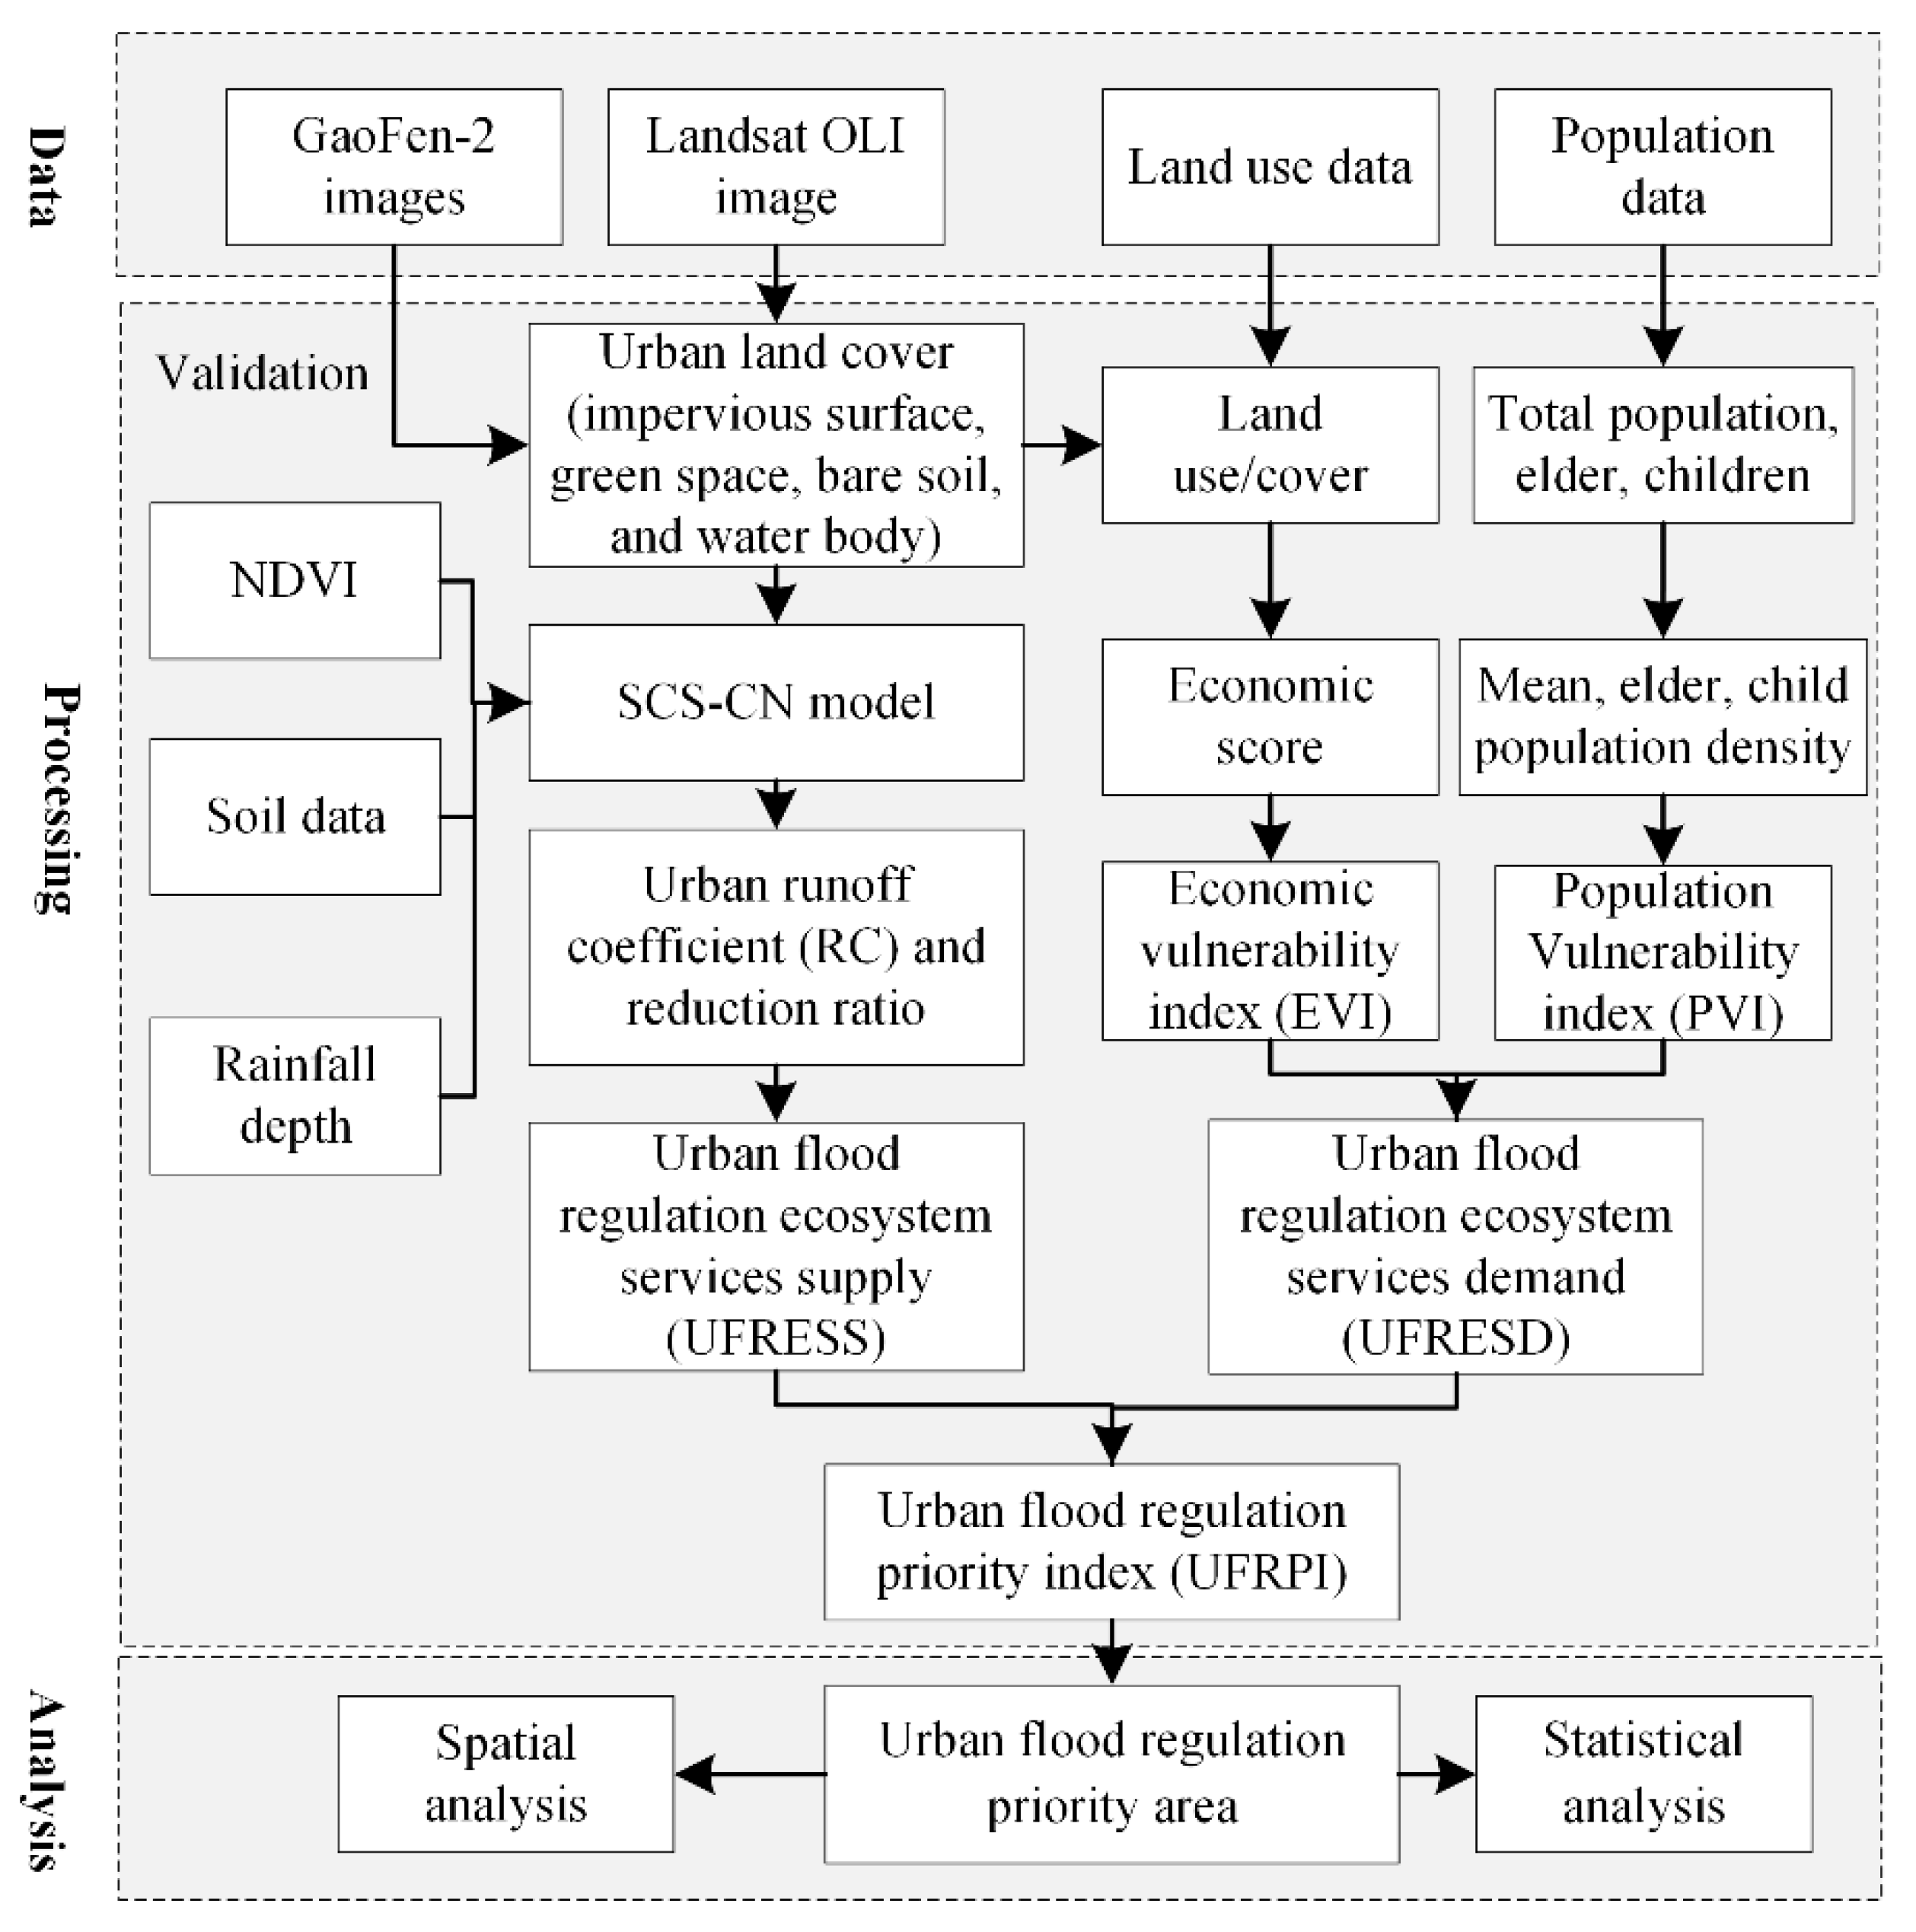
3. Data and Methods
3.1. Data Sources and Pre-Processing
3.2. Urban Runoff Simulation
3.3. Evaluating the Supply for Urban Flood Regulation Ecosystem Services
3.4. Evaluating the Demand for Urban Flood Regulation Ecosystem Services
3.5. Identifying Urban Flood Regulation Priority Areas
4. Results
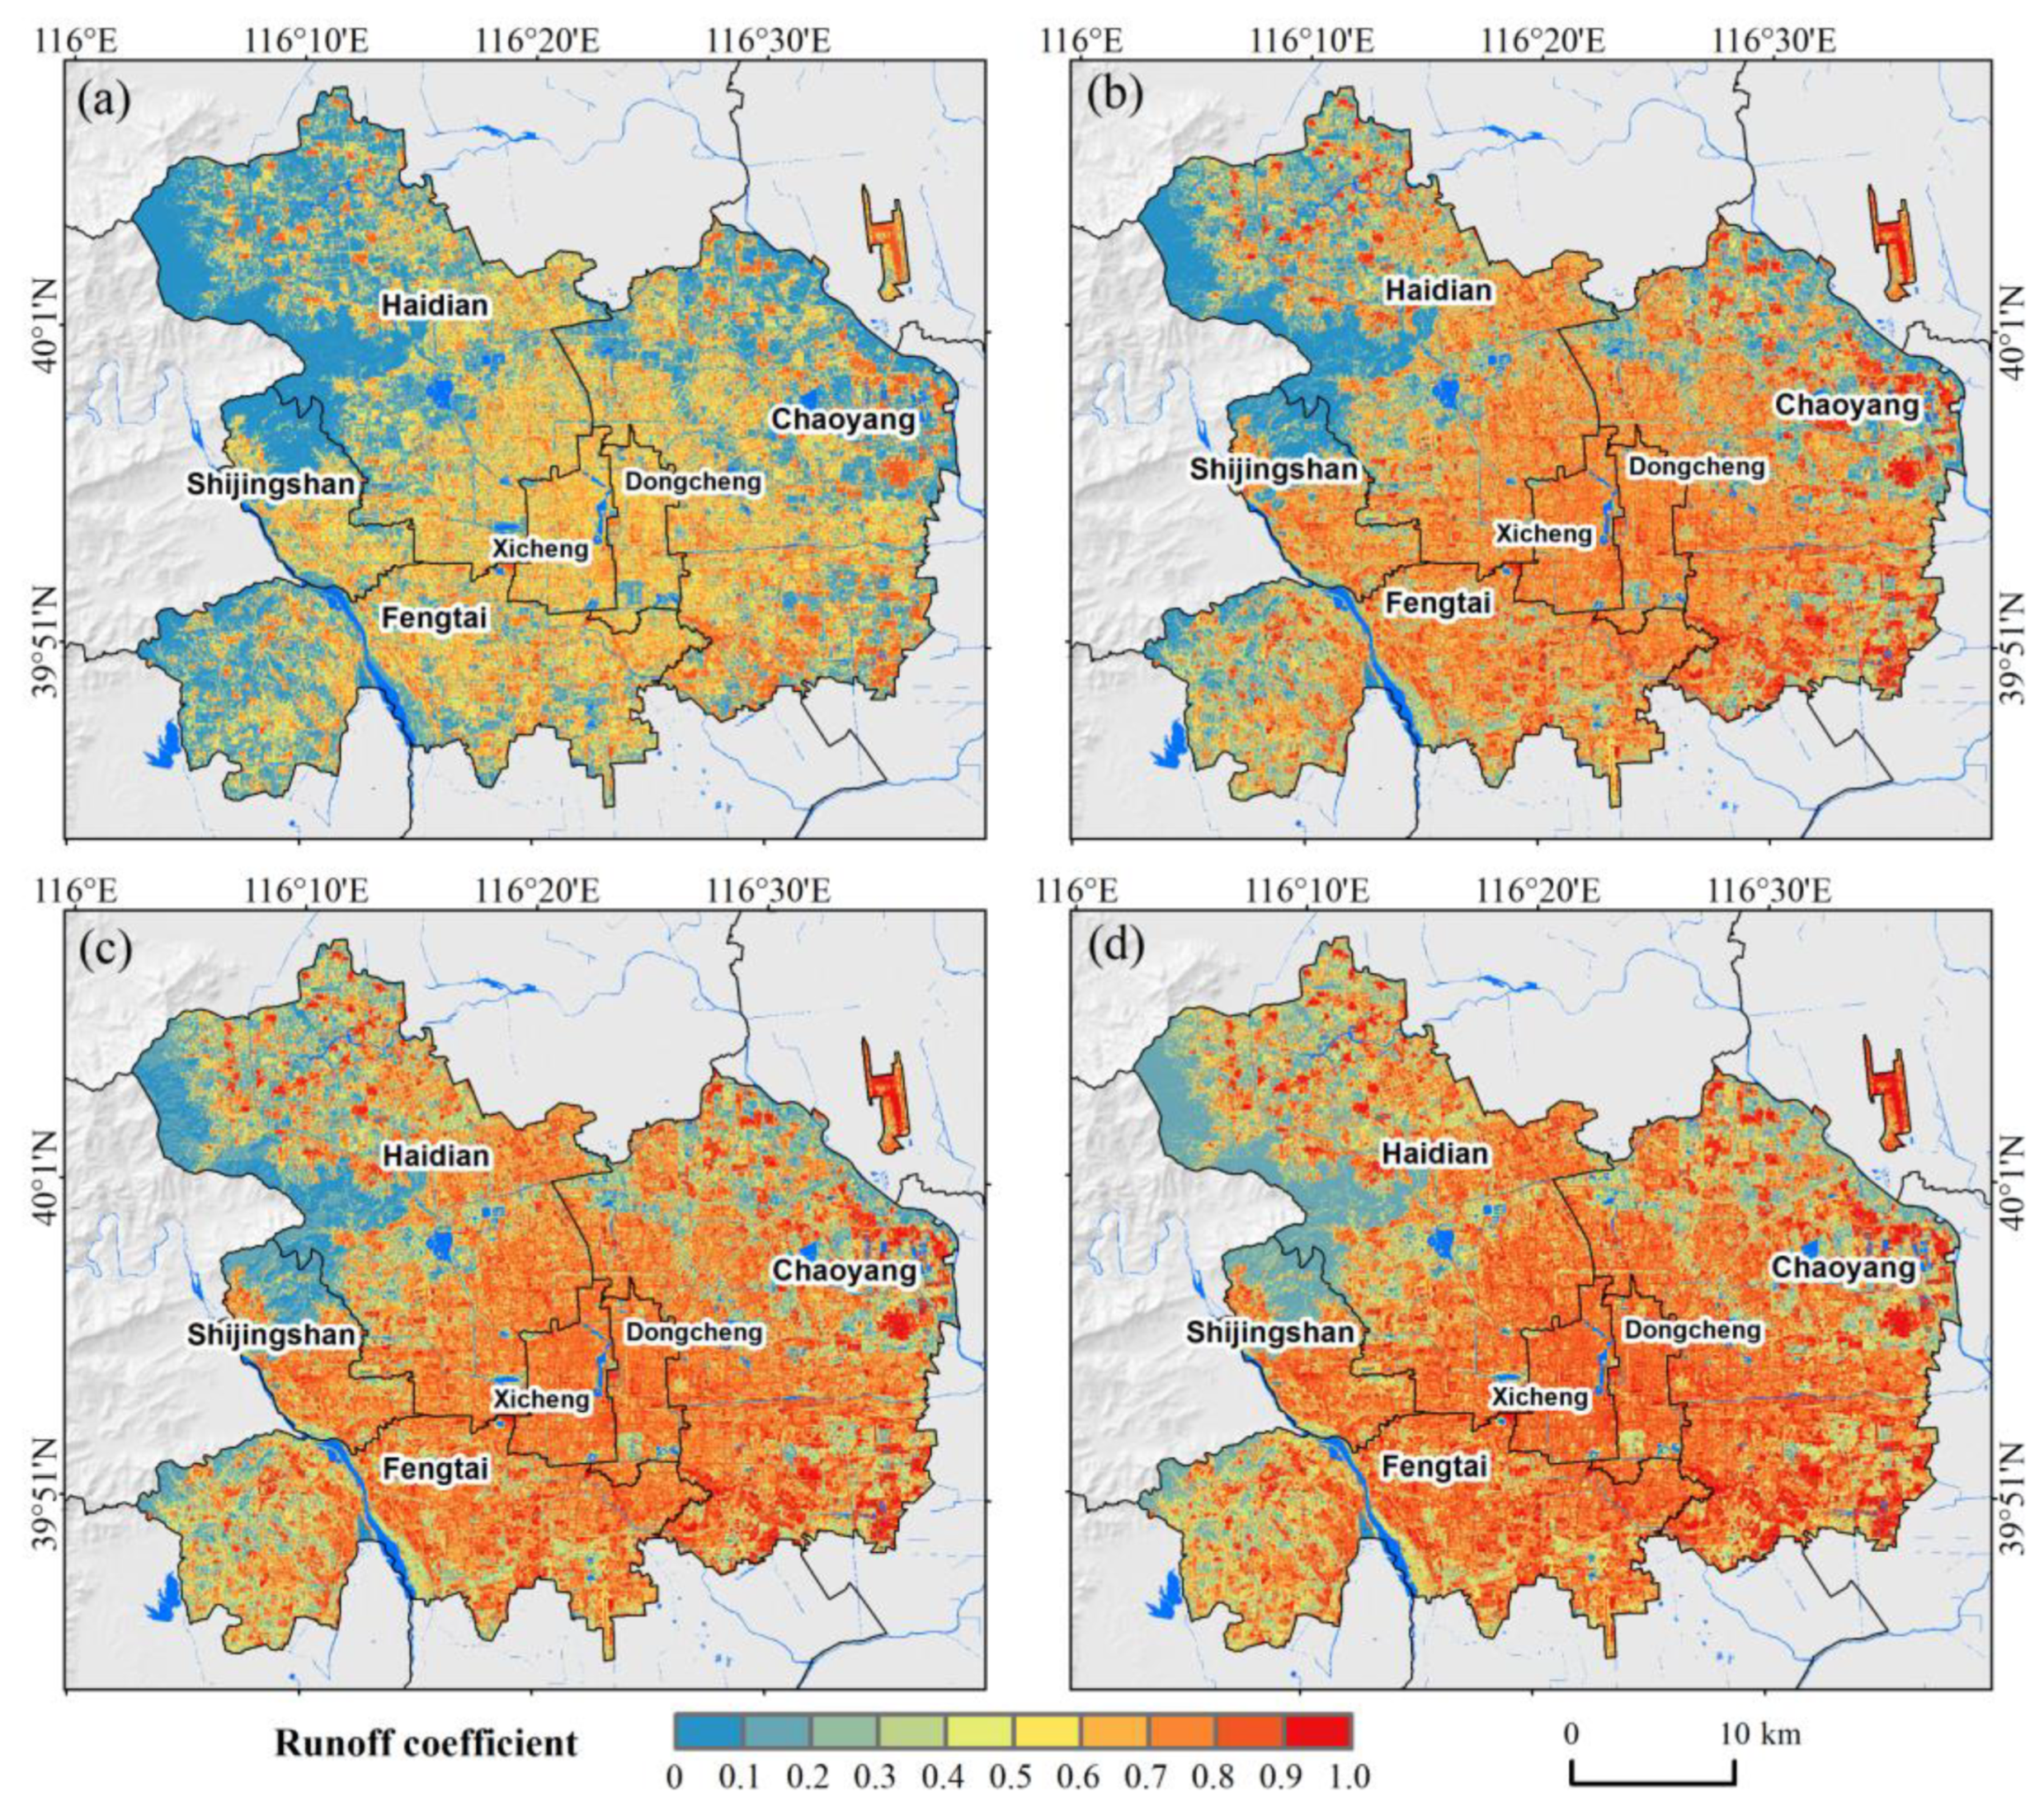
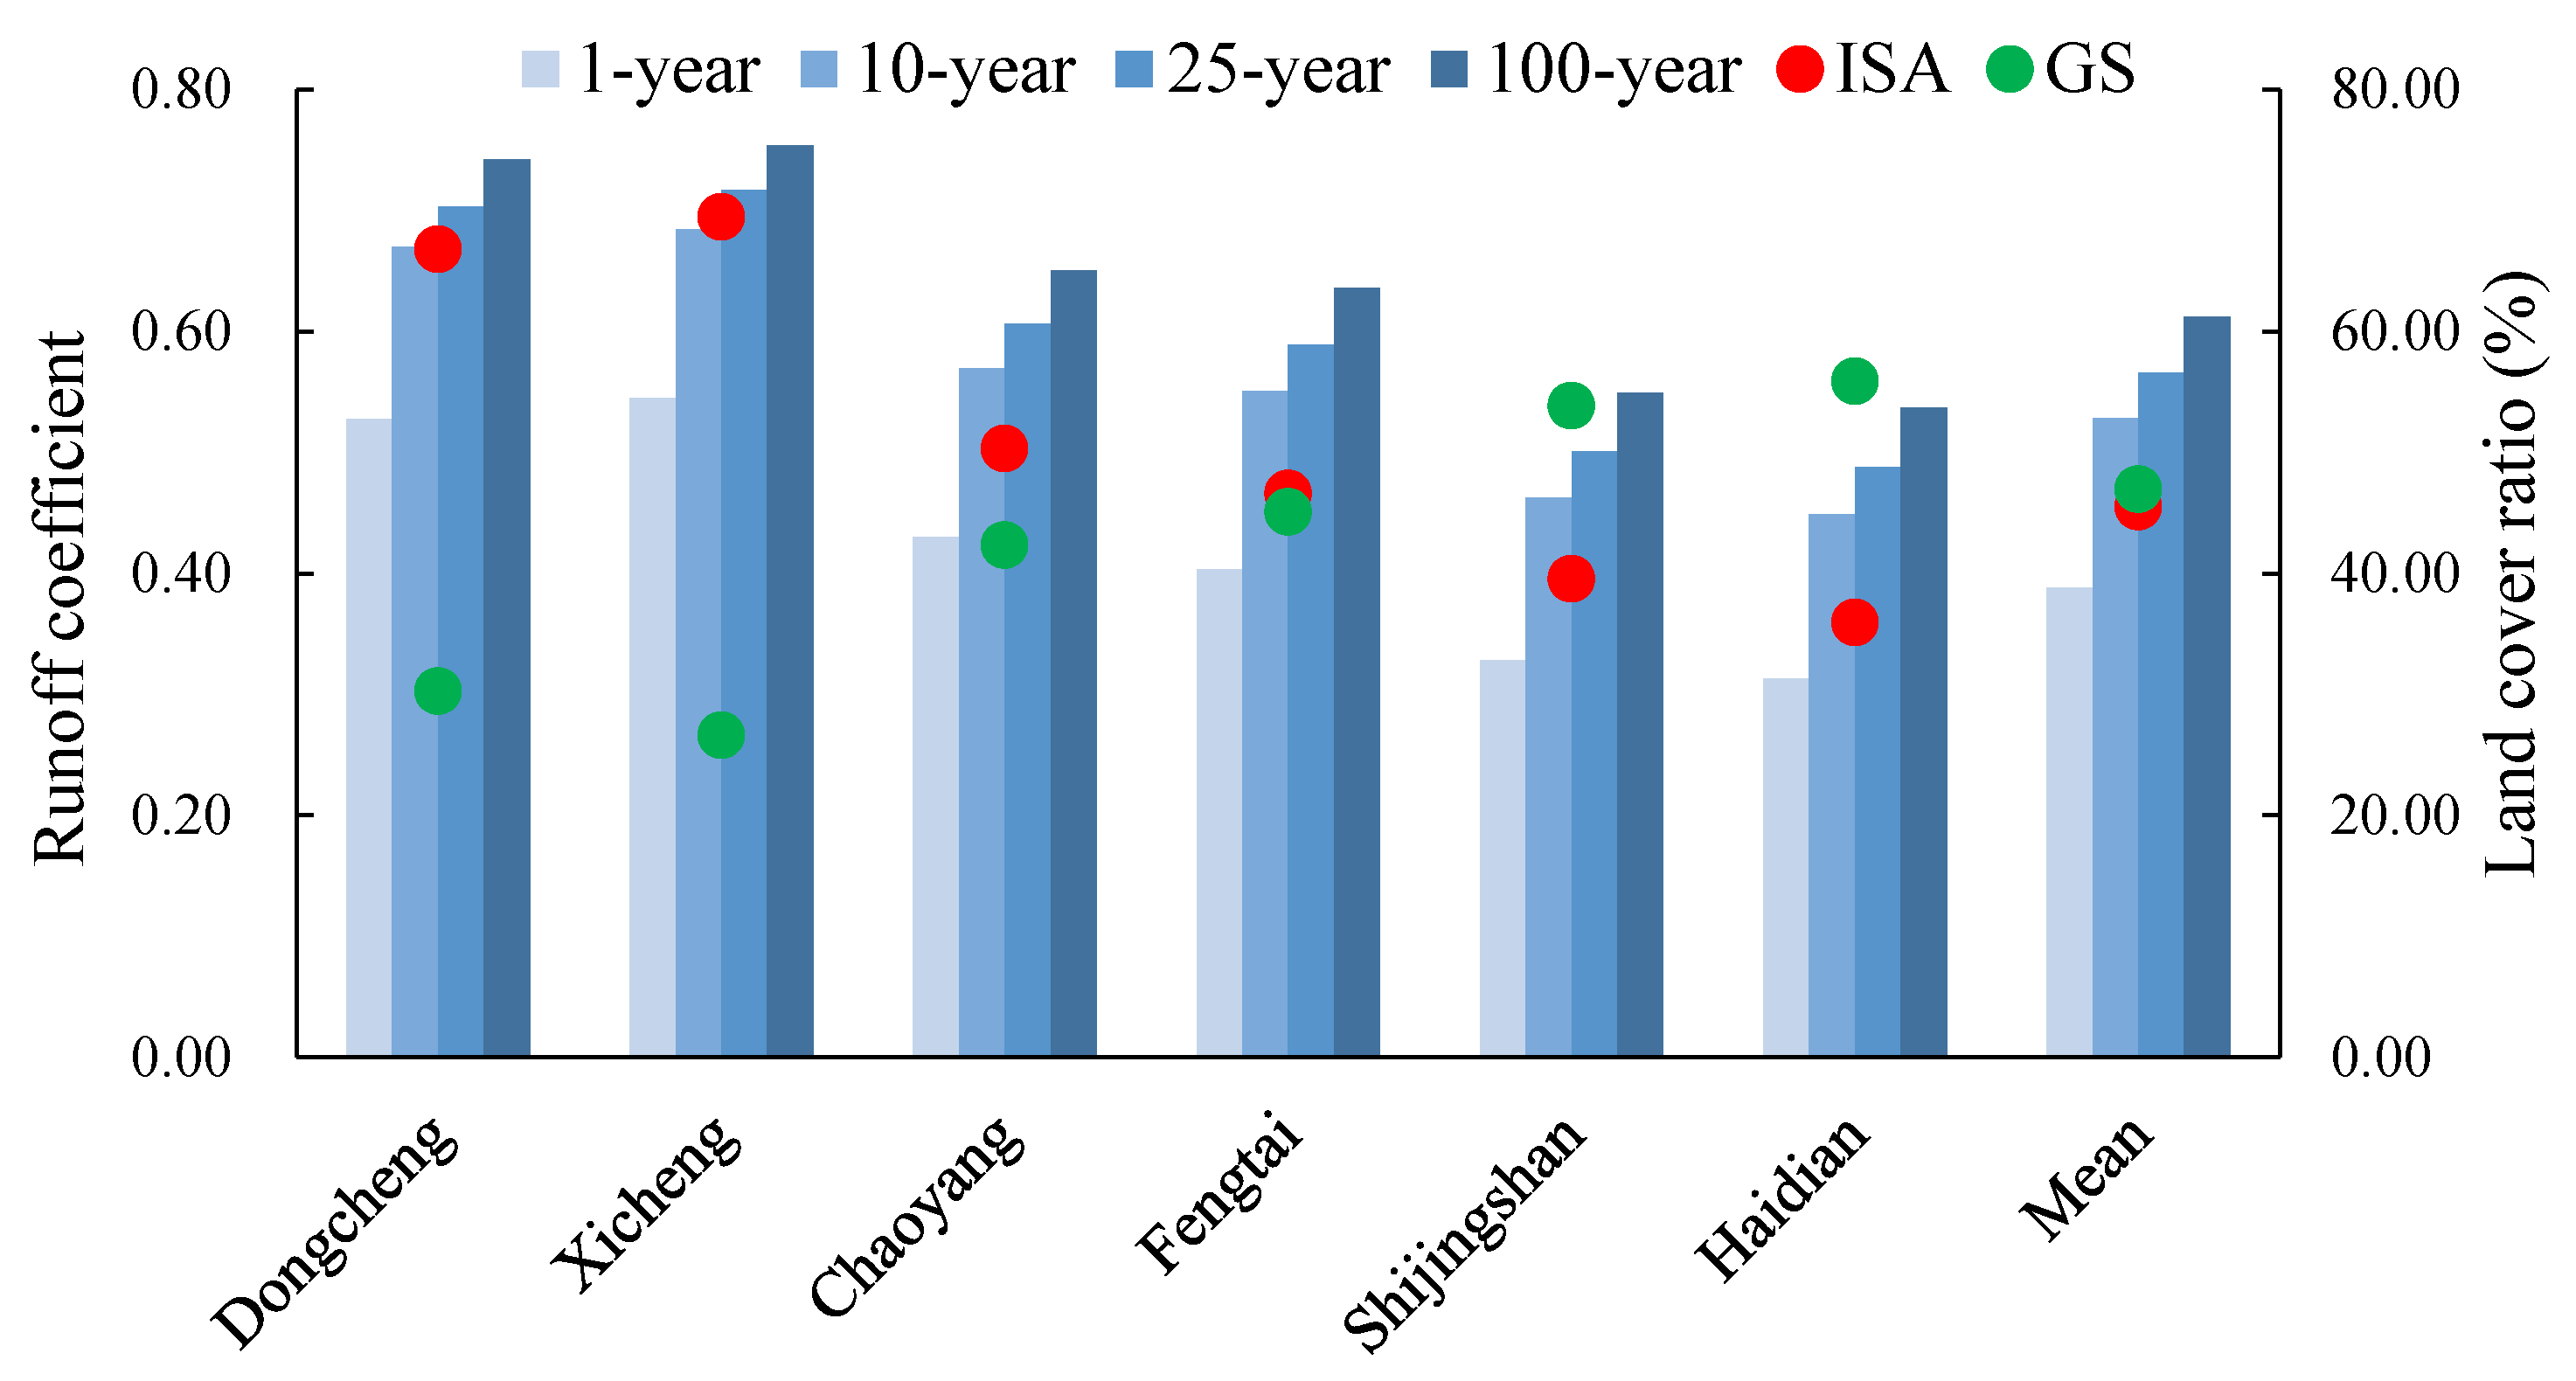
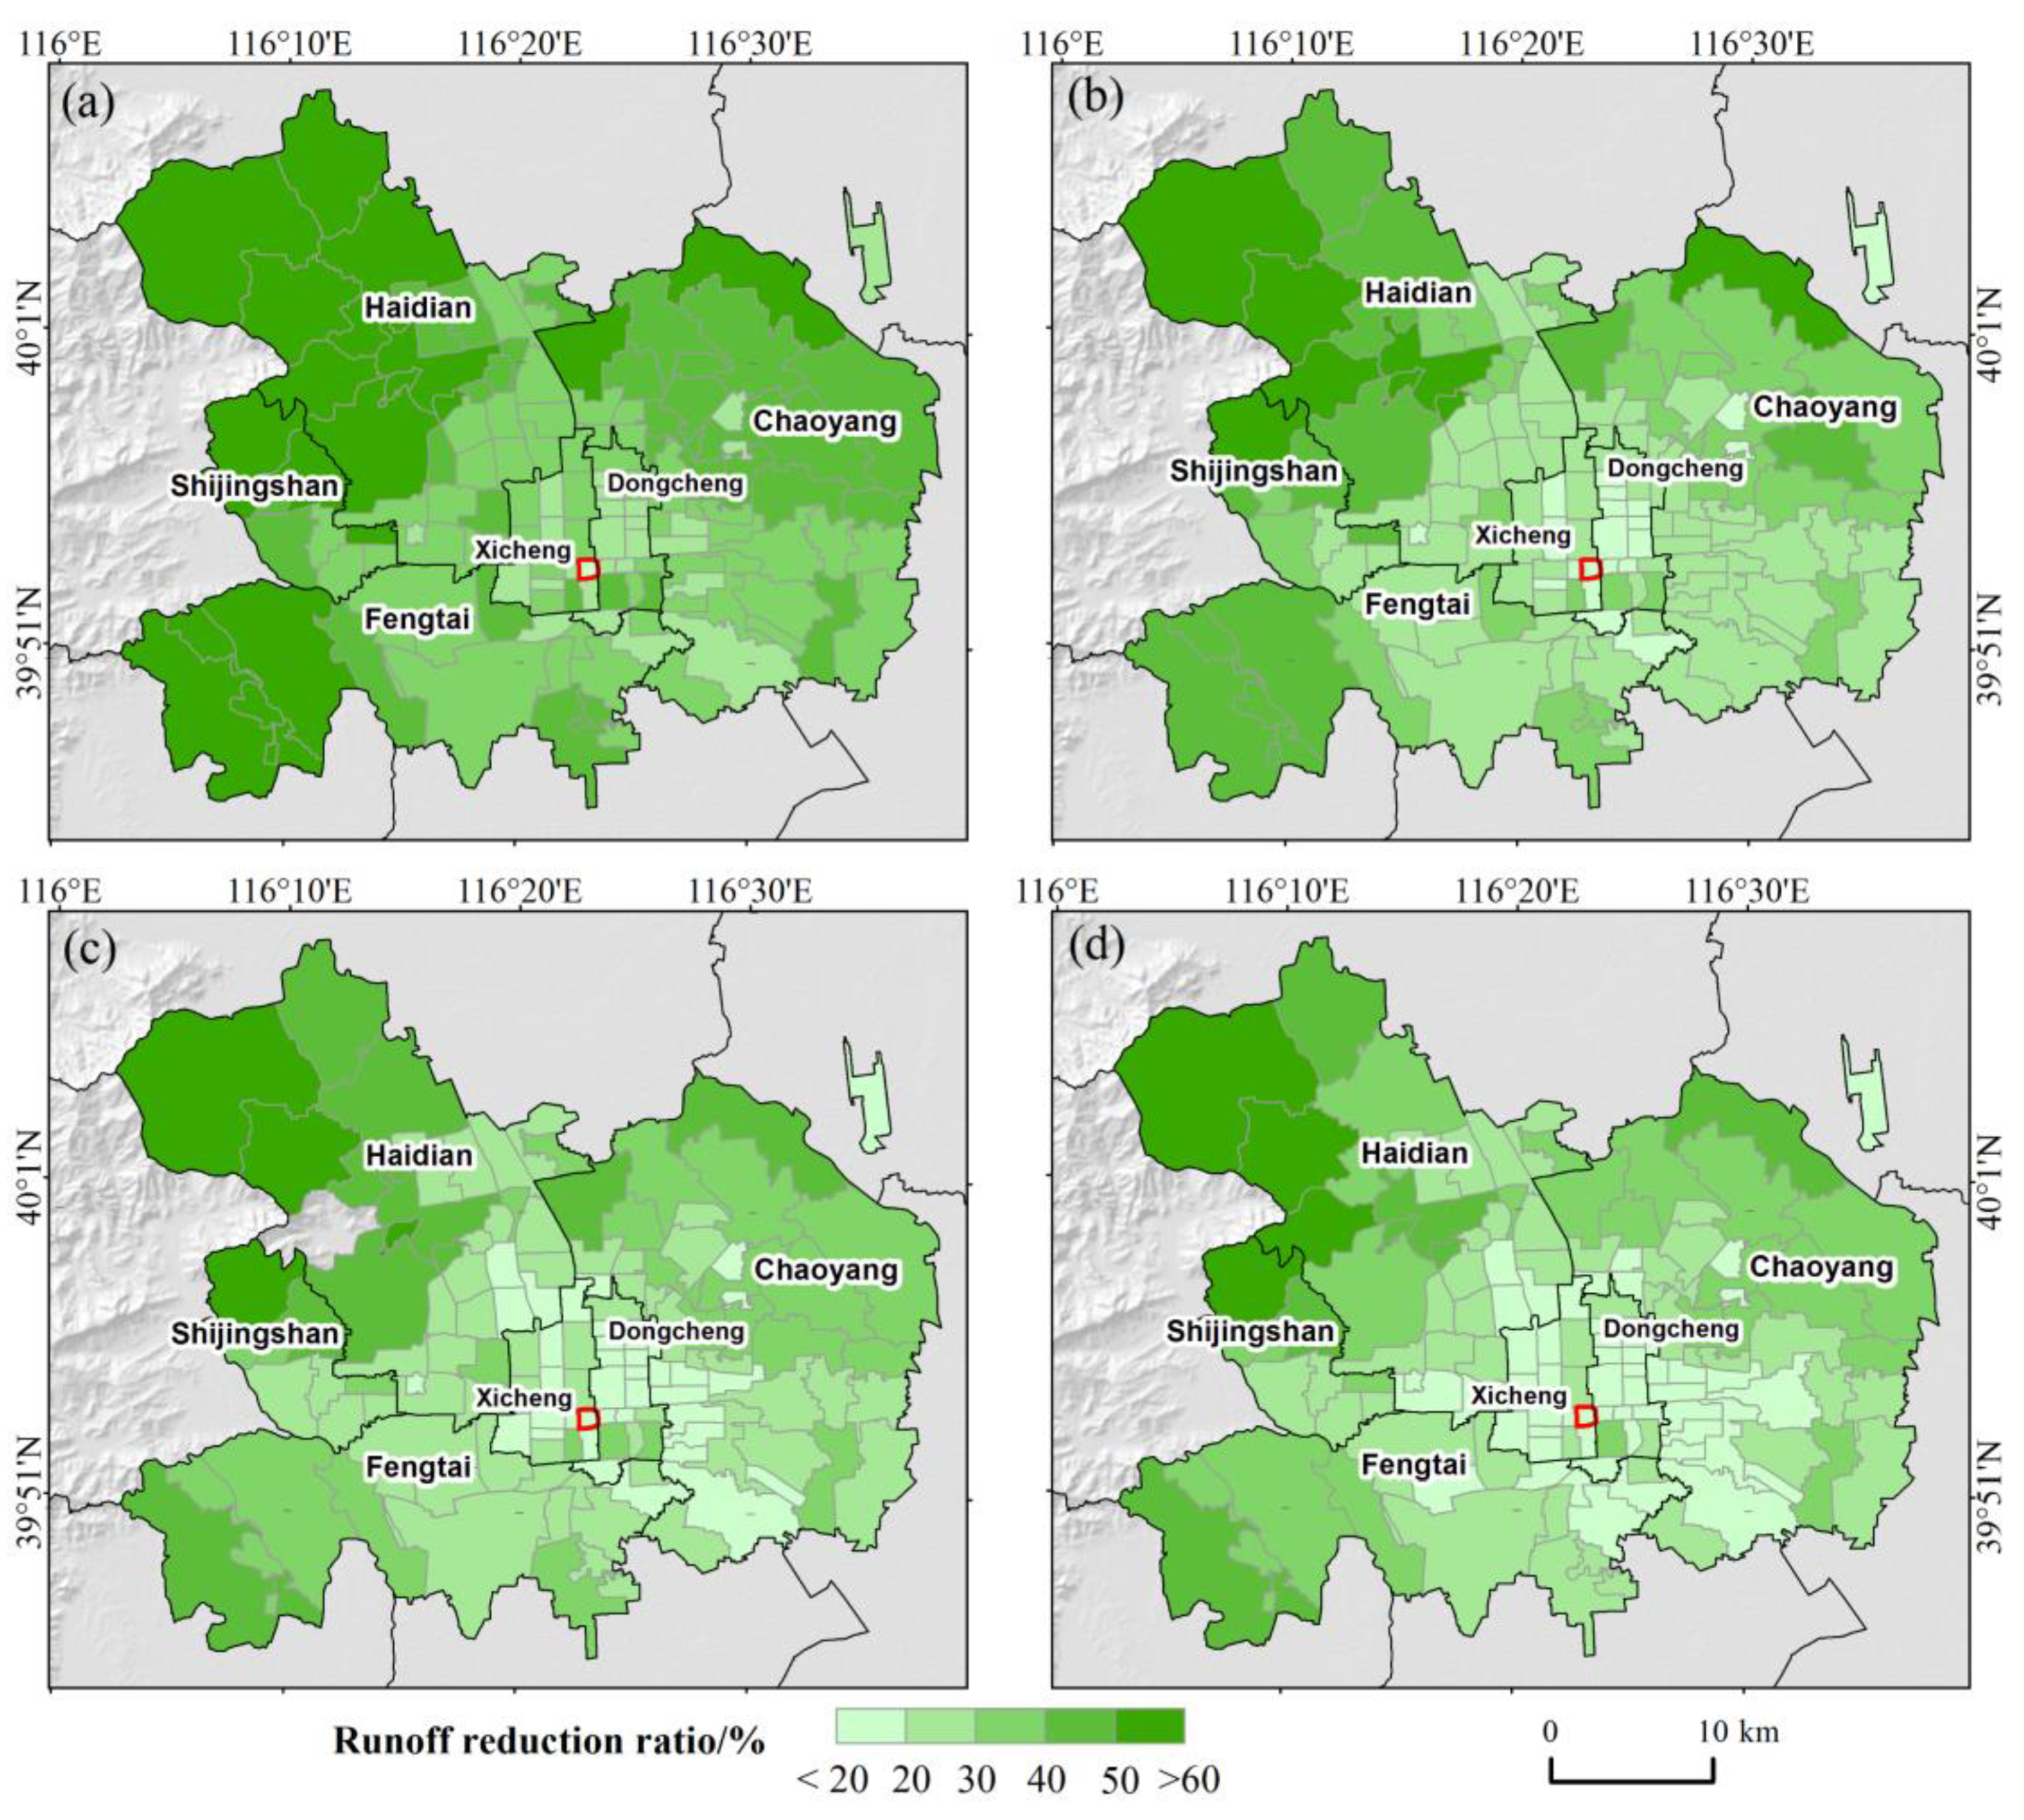
4.1. Analysis of Urban Surface Runoff for Different Rainfall Scenarios
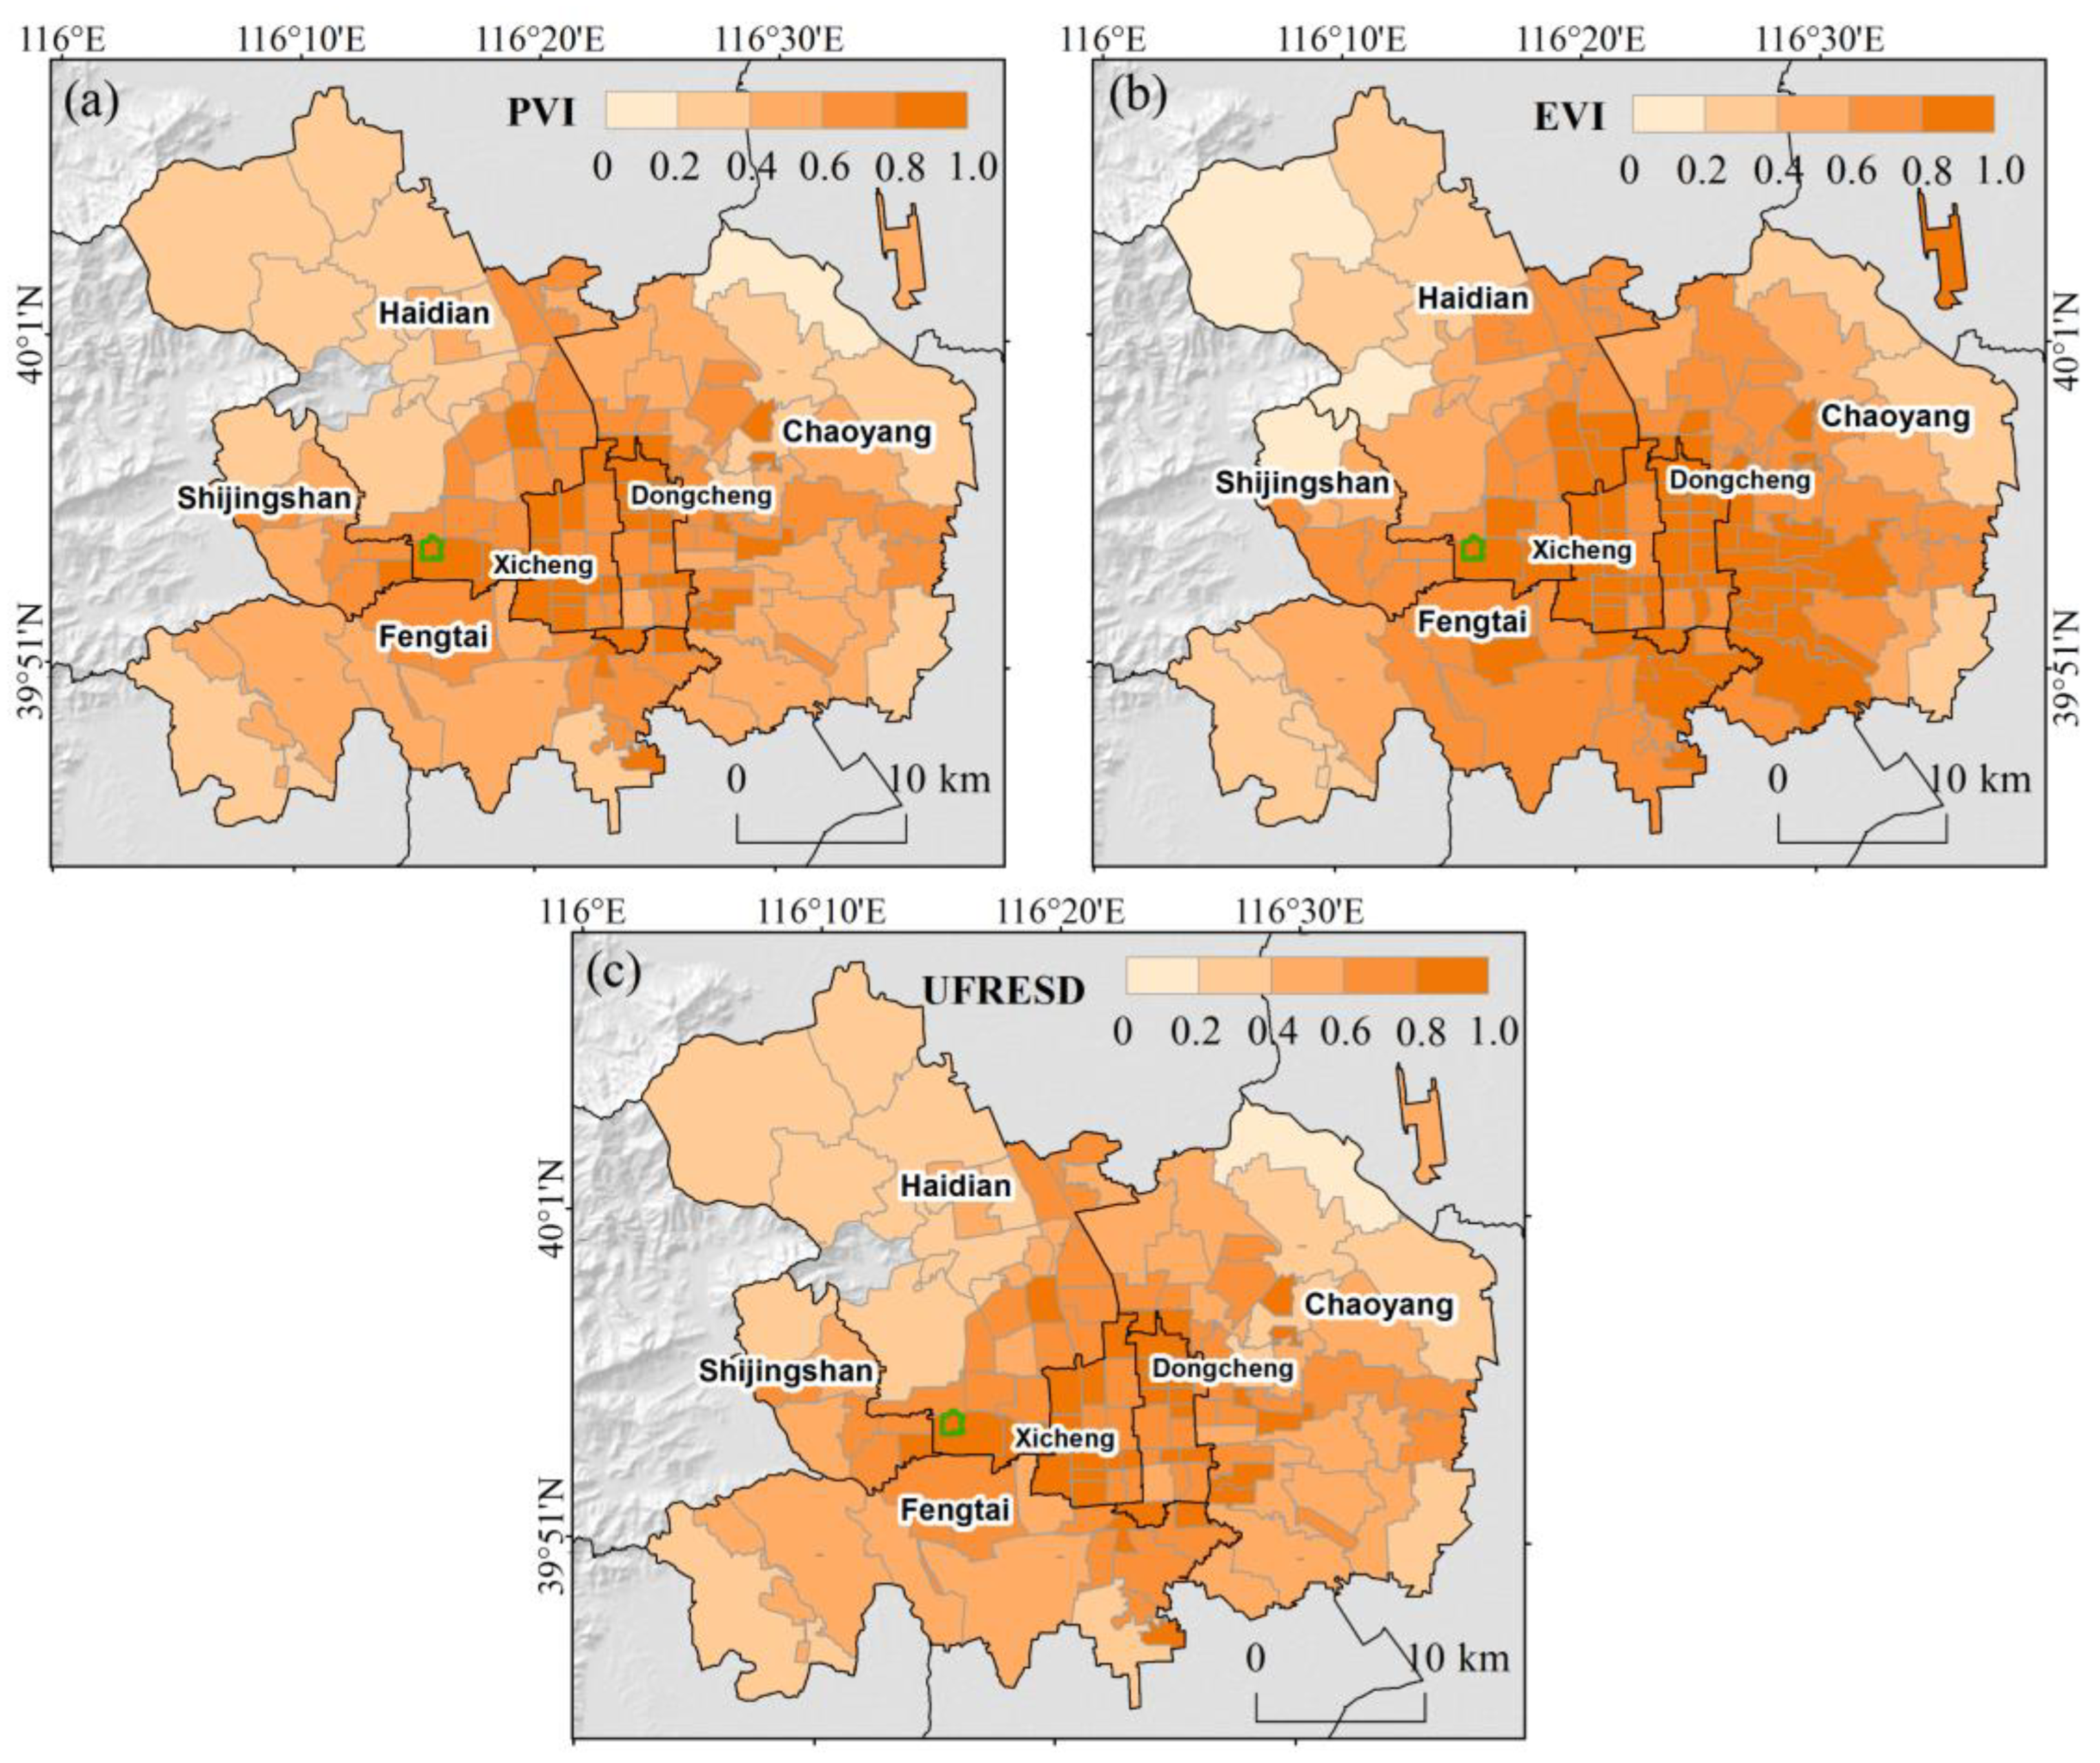
4.2. Supply for Urban Flood Regulation Ecosystem Services under Different Rainfall Scenarios in Beijing
4.3. Demand for Urban Flood Regulation Ecosystem Services in Beijing
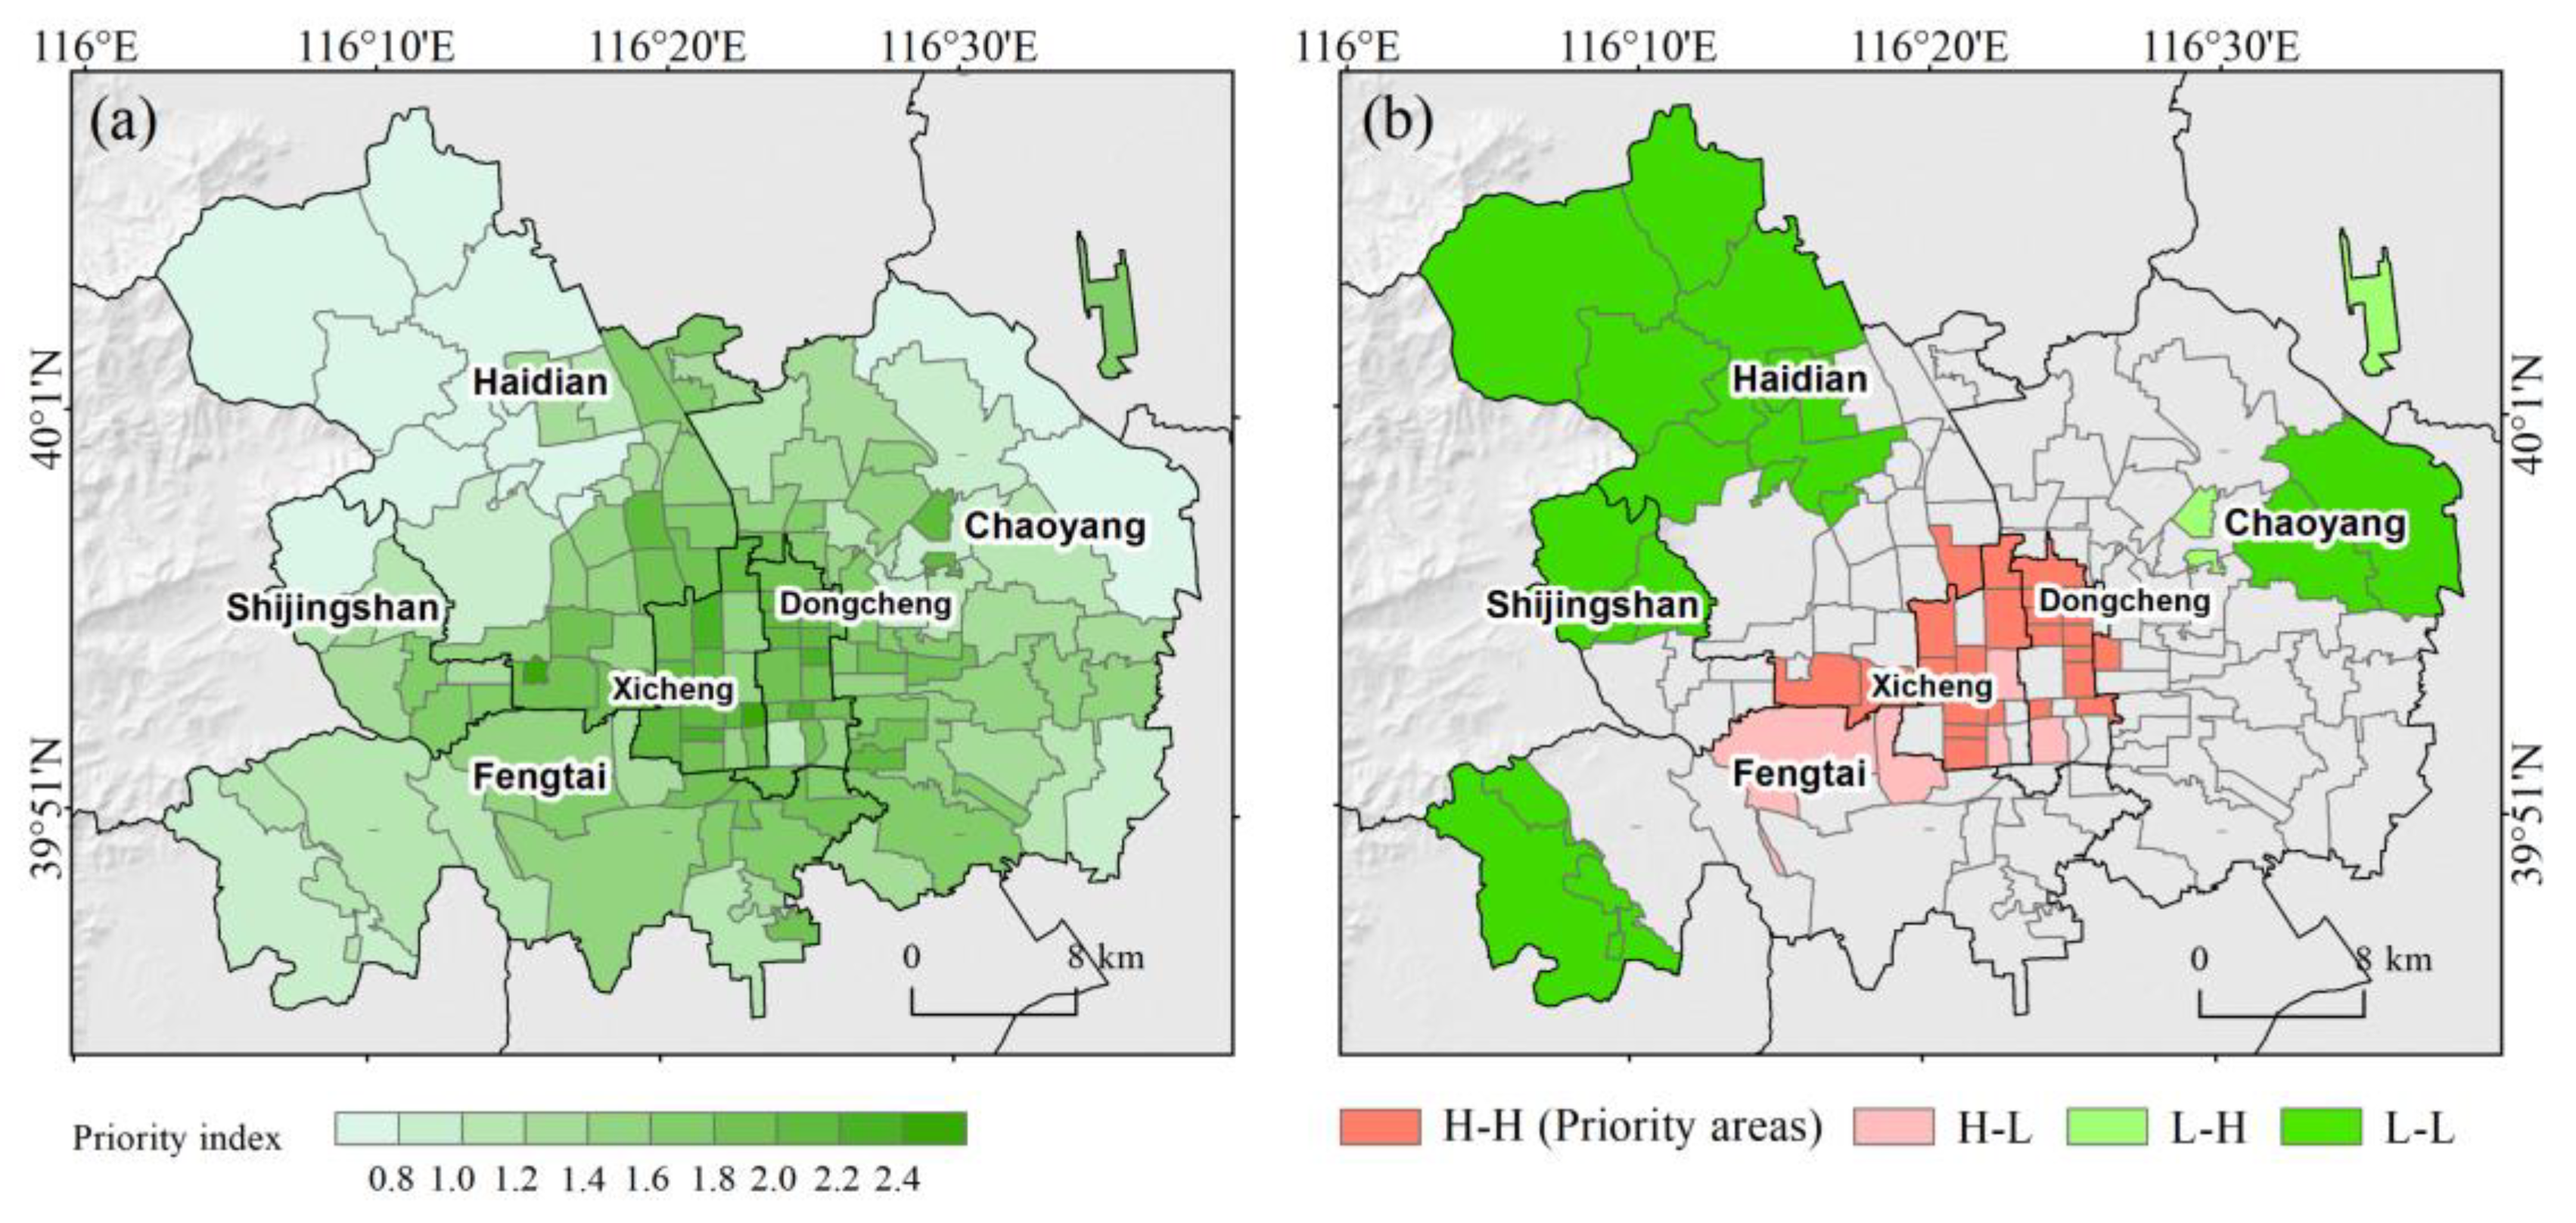
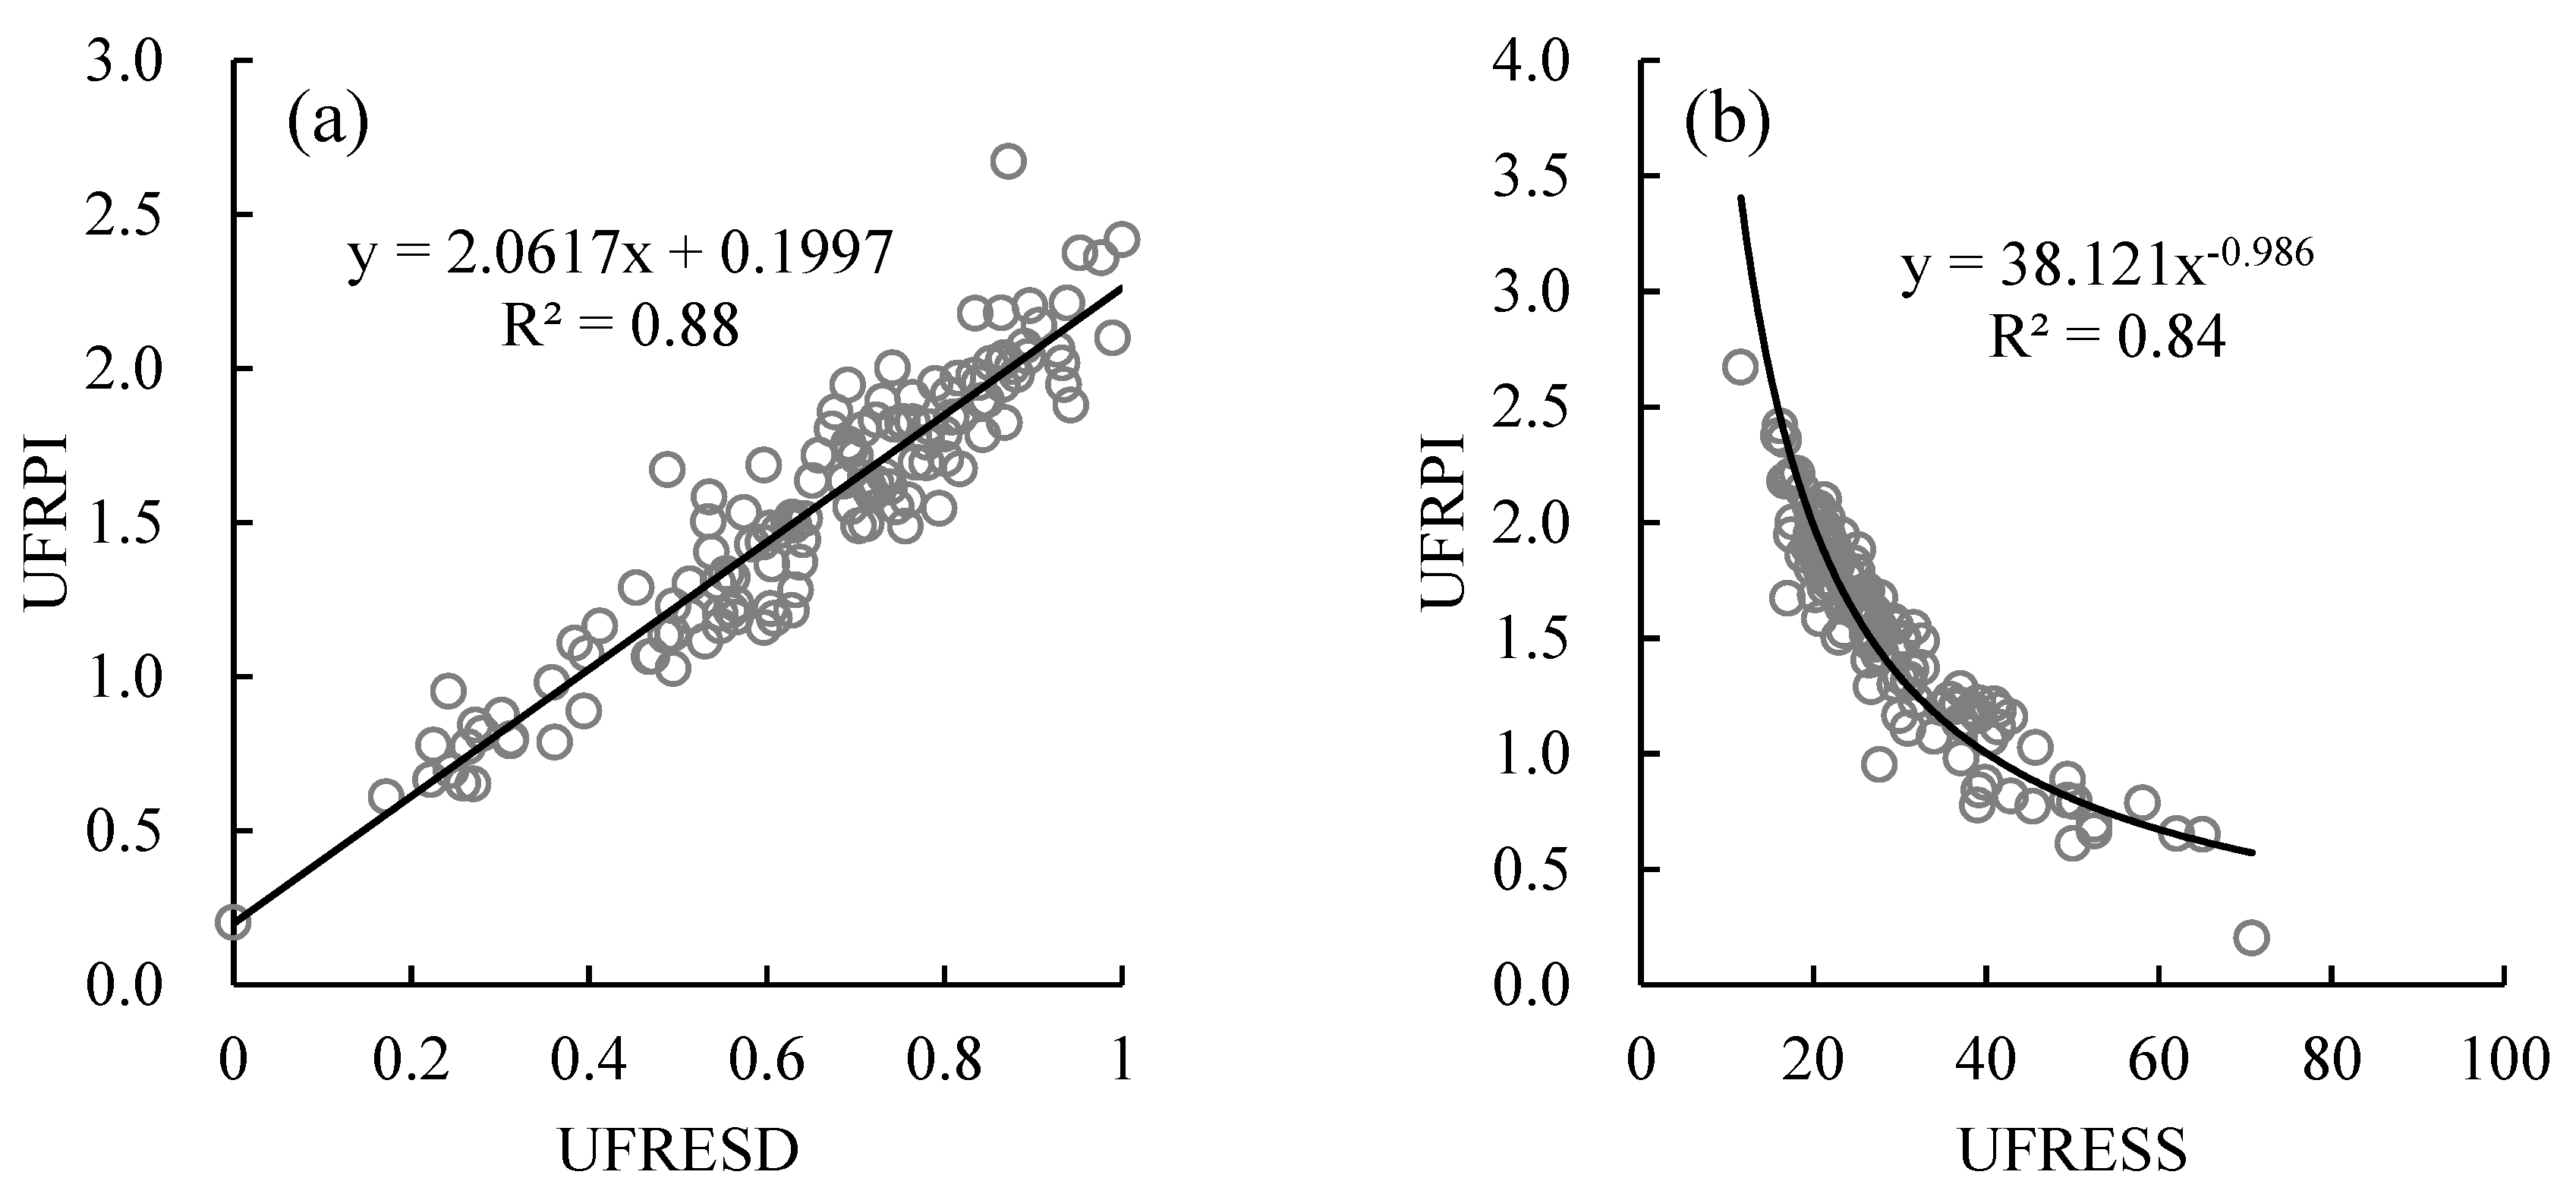
4.4. Analysis of Urban Flood Regulation Priority
5. Discussion
5.1. An Effective Approach to Identify Urban Flood Regulation Priority Areas by Integrating UFRES Supply and Demand
5.2. The Role of Urban Green Space in Urban Flood Regulation
5.3. Limitations of the Approach and Future Perspectives
6. Conclusions
Author Contributions
Funding
Acknowledgments
Conflicts of Interest
Appendix A

| Land Use/Cover Type | Economic Score |
|---|---|
| Developed, high density (aISA > 80%) | 8 |
| Developed, moderate density (50% < aISA ≤ 80%) | 7 |
| Developed, low density (20% < aISA ≤ 50%) | 6 |
| Developed, open land (aISA ≤ 20%) | 5 |
| Undesignated | 4 |
| Cropland | 3 |
| Pasture land | 2 |
| Other land use (forest, grassland, open water, etc.) | 1 |
References
- Hirabayashi, Y.; Mahendran, R.; Koirala, S.; Konoshima, L.; Yamazaki, D.; Watanabe, S.; Kim, H.; Kanae, S. Global flood risk under climate change. Nat. Clim. Chang. 2013, 3, 816–821. [Google Scholar] [CrossRef]
- Wahl, T.; Jain, S.; Bender, J.; Meyers, S.D.; Luther, M.E. Increasing risk of compound flooding from storm surge and rainfall for major US cities. Nat. Clim. Chang. 2015, 5, 1093–1097. [Google Scholar] [CrossRef]
- Buurman, J.; Babovic, V. Adaptation pathways and real options analysis: An approach to deep uncertainty in climate change adaptation policies. Policy Soc. 2016, 35, 137–150. [Google Scholar] [CrossRef] [Green Version]
- Hallegatte, S.; Green, C.; Nicholls, R.J.; Corfee-Morlot, J. Future flood losses in major coastal cities. Nat. Clim. Chang. 2013, 3, 802–806. [Google Scholar] [CrossRef]
- Hansen, R.; Pauleit, S. From multifunctionality to multiple ecosystem services? A conceptual framework for multifunctionality in green infrastructure planning for urban areas. Ambio 2014, 43, 516–529. [Google Scholar] [CrossRef] [Green Version]
- United Nations. World Urbanization Prospects: The 2011 Revision; United Nations: New York, NY, USA, 2012.
- Chen, S.Y.; Xue, Z.C.; Li, M.; Zhu, X.P. Variable sets method for urban flood vulnerability assessment. Sci. China Technol. Sc. 2013, 56, 3129–3136. [Google Scholar] [CrossRef]
- Jacobson, C.R. Identification and quantification of the hydrological impacts of imperviousness in urban catchments: A review. J. Environ. Manag. 2011, 92, 1438–1448. [Google Scholar] [CrossRef]
- Liu, Y.Z.; Bralts, V.F.; Engel, B.A. Evaluating the effectiveness of management practices on hydrology and water quality at watershed scale with a rainfall-runoff model. Sci. Total Environ. 2015, 511, 298–308. [Google Scholar] [CrossRef]
- Kuang, W.H.; Chen, L.J.; Liu, J.Y.; Xiang, W.N.; Chi, W.F.; Lu, D.S.; Yang, T.R.; Pan, T.; Liu, A.L. Remote sensing–based artificial surface cover classification in Asia and spatial pattern analysis. Sci. China Earth Sci. 2016, 59, 1720–1737. [Google Scholar] [CrossRef]
- Deng, X.J.; Xu, Y.P. Degrading flood regulation function of river systems in the urbanization process. Sci. Total Environ. 2018, 622, 1379–1390. [Google Scholar] [CrossRef]
- Fletcher, T.D.; Shuster, W.; Hunt, W.F.; Ashley, R.; Butler, D.; Arthur, S.; Trowsdale, S.; Barraud, S.; Semadeni-Davies, A.; Bertrand-Krajewski, J.L.; et al. SUDS, LID, BMPs, WSUD and more—The evolution and application of terminology surrounding urban drainage. Urban Water J. 2015, 12, 525–542. [Google Scholar] [CrossRef]
- Luederitz, C.; Brink, E.; Gralla, F.; Hermelingmeier, V.; Meyer, M.; Niven, L.; Panzer, L.; Partelow, S.; Rau, A.L.; Sasaki, R.; et al. A review of urban ecosystem services: Six key challenges for future research. Ecosyst. Serv. 2015, 14, 98–112. [Google Scholar] [CrossRef] [Green Version]
- Verburg, P.H.; Koomen, E.; Hilferink, M.; Perez-Soba, M.; Lesschen, J.P. An assessment of the impact of climate adaptation measures to reduce flood risk on ecosystem services. Landsc. Ecol. 2012, 27, 473–486. [Google Scholar] [CrossRef] [PubMed] [Green Version]
- Millennium Ecosystem Assessment. Ecosystems and Human Well-Being: Synthesis; Island Press: Washington, DC, USA, 2005. [Google Scholar]
- de Groot, R.S.; Alkemade, R.; Braat, L.; Hein, L.; Willemen, L. Challenges in integrating the concept of ecosystem services and values in landscape planning, management and decision making. Ecol. Complex 2010, 7, 260–272. [Google Scholar] [CrossRef]
- McPhearson, T.; Hamstead, Z.A.; Kremer, P. Urban ecosystem services for resilience planning and management in New York City. Ambio 2014, 43, 502–515. [Google Scholar] [CrossRef] [Green Version]
- Fu, B.; Wang, Y.K.; Xu, P.; Yan, K. Mapping the flood mitigation services of ecosystems: A case study in the Upper Yangtze River Basin. Ecol. Eng. 2013, 52, 238–246. [Google Scholar] [CrossRef]
- Kadykalo, A.N.; Findlay, C.S. The flow regulation services of wetlands. Ecosyst. Serv. 2016, 20, 91–103. [Google Scholar] [CrossRef]
- Yang, L.Y.; Zhang, L.B.; Li, Y.; Wu, S.T. Water-related ecosystem services provided by urban green space: A case study in Yixing City (China). Landsc. Urban Plan. 2015, 136, 40–51. [Google Scholar] [CrossRef]
- Zhang, B.; Xie, G.D.; Li, N.; Wang, S. Effect of urban green space changes on the role of rainwater runoff reduction in Beijing, China. Landsc. Urban Plan. 2015, 140, 8–16. [Google Scholar] [CrossRef]
- Baró, F.; Palomo, I.; Zulian, G.; Vizcaino, P.; Haase, D.; Gomez-Baggethun, E. Mapping ecosystem service capacity, flow and demand for landscape and urban planning: A case study in the Barcelona metropolitan region. Land Use Policy 2016, 57, 405–417. [Google Scholar] [CrossRef] [Green Version]
- Burkhard, B.; Kroll, F.; Nedkov, S.; Muller, F. Mapping ecosystem service supply, demand and budgets. Ecol. Indic. 2012, 21, 17–29. [Google Scholar] [CrossRef]
- Goldstein, J.H.; Caldarone, G.; Duarte, T.K.; Ennaanay, D.; Hannahs, N.; Mendoza, G.; Polasky, S.; Wolny, S.; Daily, G.C. Integrating ecosystem-service tradeoffs into land-use decisions. Proc. Natl. Acad. Sci. USA 2012, 109, 7565–7570. [Google Scholar] [CrossRef] [PubMed] [Green Version]
- Tammi, I.; Mustajarvi, K.; Rasinmaki, J. Integrating spatial valuation of ecosystem services into regional planning and development. Ecosyst. Serv. 2017, 26, 329–344. [Google Scholar] [CrossRef] [Green Version]
- Woodruff, S.C.; BenDor, T.K. yy Ecosystem services in urban planning: Comparative paradigms and guidelines for high quality plans. Landsc. Urban Plan. 2016, 152, 90–100. [Google Scholar] [CrossRef]
- Gret-Regamey, A.; Altwegg, J.; Siren, E.A.; van Strien, M.J.; Weibel, B. Integrating ecosystem services into spatial planning-A spatial decision support tool. Landsc. Urban Plan. 2017, 165, 206–219. [Google Scholar] [CrossRef] [Green Version]
- Turkelboom, F.; Leone, M.; Jacobs, S.; Kelemen, E.; Garcia-Llorente, M.; Baro, F.; Termansen, M.; Barton, D.N.; Berry, P.; Stange, E.; et al. When we cannot have it all: Ecosystem services trade-offs in the context of spatial planning. Ecosyst. Serv. 2018, 29, 566–578. [Google Scholar] [CrossRef]
- Meerow, S.; Newell, J.P. Spatial planning for multifunctional green infrastructure: Growing resilience in Detroit. Landsc. Urban Plan. 2017, 159, 62–75. [Google Scholar] [CrossRef]
- Babí Almenar, J.; Rugani, B.; Geneletti, D.; Brewer, T. Integration of ecosystem services into a conceptual spatial planning framework based on a landscape ecology perspective. Landsc. Ecol. 2018, 33, 2047–2059. [Google Scholar] [CrossRef] [Green Version]
- Bai, Y.; Wong, C.P.; Jiang, B.; Hughes, A.C.; Wang, M.; Wang, Q. Developing China’s ecological redline policy using ecosystem services assessments for land use planning. Nat. Commun. 2018, 9, 3034. [Google Scholar] [CrossRef] [Green Version]
- Snall, T.; Lehtomaki, J.; Arponen, A.; Elith, J.; Moilanen, A. Green infrastructure design based on spatial conservation prioritization and modeling of biodiversity features and ecosystem services. Environ. Manag. 2016, 57, 251–256. [Google Scholar] [CrossRef] [Green Version]
- Yao, L.; Chen, L.D.; Wei, W.; Sun, R.H. Potential reduction in urban runoff by green spaces in Beijing: A scenario analysis. Urban For. Urban Green. 2015, 14, 300–308. [Google Scholar] [CrossRef]
- Beijing Statistical Bureau. Beijing Statistical Yearbook; China Statistics Press: Beijing, China, 2019. (In Chinese)
- Hao, P.Y.; Niu, Z.; Zhan, Y.L.; Wu, Y.C.; Wang, L.; Liu, Y.H. Spatiotemporal changes of urban impervious surface area and land surface temperature in Beijing from 1990 to 2014. Gisci. Remote Sens. 2016, 53, 63–84. [Google Scholar] [CrossRef]
- Kuang, W.H.; Chi, W.F.; Lu, D.S.; Dou, Y.Y. A comparative analysis of megacity expansions in China and the U.S.: Patterns, rates and driving forces. Landsc. Urban Plan. 2014, 132, 121–135. [Google Scholar] [CrossRef]
- Kuang, W.H.; Yang, T.R.; Liu, A.L.; Zhang, C.; Lu, D.S.; Chi, W.F. An EcoCity model for regulating urban land cover structure and thermal environment: Taking Beijing as an example. Sci. China Earth Sci. 2017, 60, 1098–1109. [Google Scholar] [CrossRef]
- Sun, Y.; Zhang, X.B.; Ren, G.Y.; Zwiers, F.W.; Hu, T. Contribution of urbanization to warming in China. Nat. Clim. Chang. 2016, 6, 706. [Google Scholar] [CrossRef]
- Zhu, L.T.; Chen, Y.S.; Yan, R.R.; Shen, T.; Jiang, L.; Wang, Y. Characteristics of precipitation and temperature changes in Beijing City during 1951–2010. Resour. Sci. 2012, 34, 1287–1297. (In Chinese) [Google Scholar]
- Li, C. Ecohydrology and good urban design for urban storm water-logging in Beijing, China. Ecohydrol. Hydrobiol. 2012, 12, 287–300. (In Chinese) [Google Scholar] [CrossRef] [Green Version]
- Li, R.; Pan, X.Y.; Di, S.C.; Yang, M.Y.; Su, Y. Diagnostic analysis of the waterlogging influence factors in Beijing City: A case study of Shangqingqiao catchment. J. Nat. Resour. 2018, 33, 1940–1952. (In Chinese) [Google Scholar] [CrossRef]
- Fan, F.L.; Deng, Y.B.; Hu, X.F.; Weng, Q.H. Estimating composite curve number using an improved SCS-CN method with remotely sensed variables in Guangzhou, China. Remote Sens. 2013, 5, 1425–1438. [Google Scholar] [CrossRef] [Green Version]
- Zhang, C.; Chen, Y.L.; Lu, D.S. Detecting fractional land-cover change in arid and semiarid urban landscapes with multitemporal Landsat Thematic Mapper imagery. Gisci. Remote Sens. 2015, 52, 700–722. [Google Scholar] [CrossRef]
- Xu, H.Q. Modification of normalised difference water index (NDWI) to enhance open water features in remotely sensed imagery. Int. J. Remote Sens. 2006, 27, 3025–3033. [Google Scholar] [CrossRef]
- Lu, D.S.; Weng, Q.H. Use of impervious surface in urban land-use classification. Remote Sens. Environ. 2006, 102, 146–160. [Google Scholar] [CrossRef]
- Ning, J.; Liu, J.Y.; Kuang, W.H.; Xu, X.L.; Zhang, S.W.; Yan, C.Z.; Li, R.D.; Wu, S.X.; Hu, Y.F.; Du, G.M.; et al. Spatiotemporal patterns and characteristics of land-use change in China during 2010–2015. J. Geogr. Sci. 2018, 28, 547–562. [Google Scholar] [CrossRef] [Green Version]
- Kuang, W.H.; Liu, J.Y.; Dong, J.W.; Chi, W.F.; Zhang, C. The rapid and massive urban and industrial land expansions in China between 1990 and 2010: A CLUD-based analysis of their trajectories, patterns, and drivers. Landsc. Urban Plan. 2016, 145, 21–33. [Google Scholar] [CrossRef]
- Resource and Environment Data Cloud Platform. Available online: http://www.resdc.cn/data.aspx?DATAID=145 (accessed on 13 January 2020).
- Beijing Municipal Bureau of Statistics. Available online: http://www.beijing.gov.cn/zfxxgk/110037/pc53/2012-12/17/content_358394.shtml (accessed on 13 January 2020).
- Yao, L.; Wei, W.; Yu, Y.; Xiao, J.; Chen, L.D. Rainfall-runoff risk characteristics of urban function zones in Beijing using the SCS-CN model. J. Geogr. Sci. 2018, 28, 656–668. [Google Scholar] [CrossRef]
- Cronshey, R.; McCuen, R.H.; Miller, N.; Rawls, W.; Robbins, S.; Woodward, D. Urban Hydrology for Small Watersheds, 2nd ed.; Technical Release 55; U.S. Dept. of Agriculture, Natural Resources Conservation Service, Conservation Engineering Division: Reston, VA, USA, 1986.
- Li, C.L.; Liu, M.; Hu, Y.M.; Shi, T.; Qu, X.Q.; Walter, M.T. Effects of urbanization on direct runoff characteristics in urban functional zones. Sci. Total Environ. 2018, 643, 301–311. [Google Scholar] [CrossRef]
- Fu, S.H.; Wang, H.Y.; Wang, X.L.; Yuan, A.P.; Lu, B.J. The runoff curve number of SCS-CN method in Beijing. Geogr. Res. 2013, 32, 797–807. (In Chinese) [Google Scholar] [CrossRef]
- Shen, J.; Du, S.; Huang, Q.; Yin, J.; Zhang, M.; Wen, J.; Gao, J. Mapping the city-scale supply and demand of ecosystem flood regulation services: A case study in Shanghai. Ecol. Indic. 2019, 106. [Google Scholar] [CrossRef]
- Maragno, D.; Gaglio, M.; Robbi, M.; Appiotti, F.; Fano, E.A.; Gissi, E. Fine-scale analysis of urban flooding reduction from green infrastructure: An ecosystem services approach for the management of water flows. Ecol. Model. 2018, 386, 1–10. [Google Scholar] [CrossRef]
- Wang, Q.; Zhang, X.X.; Wei, M.J.; Zhou, Y.W.; Li, P.; Bai, G.Y. Research summary of planning and design standards for storm water system in Beijing city. Water Waste Eng. 2011, 37, 34–39. (In Chinese) [Google Scholar]
- Stürck, J.; Poortinga, A.; Verburg, P.H. Mapping ecosystem services: The supply and demand of flood regulation services in Europe. Ecol. Indic. 2014, 38, 198–211. [Google Scholar] [CrossRef]
- Dong, W.H.; Liu, Z.; Zhang, L.J.; Tang, Q.H.; Liao, H.; Li, X.E. Assessing heat health risk for sustainability in Beijing’s urban heat island. Sustainability 2014, 6, 7334–7357. [Google Scholar] [CrossRef] [Green Version]
- Zachos, L.G.; Swann, C.T.; Altinakar, M.S.; McGrath, M.Z.; Thomas, D. Flood vulnerability indices and emergency management planning in the Yazoo Basin, Mississippi. Int. J. Disast. Risk. Reduct. 2016, 18, 89–99. [Google Scholar] [CrossRef]
- Anselin, L. Local indicators of spatial association—LISA. Geogr. Anal. 1995, 27, 93–115. [Google Scholar] [CrossRef]
- Fernandez, I.C.; Wu, J.G. A GIS-based framework to identify priority areas for urban environmental inequity mitigation and its application in Santiago de Chile. Appl. Geogr. 2018, 94, 213–222. [Google Scholar] [CrossRef]
- Baró, F.; Haase, D.; Gómez-Baggethun, E.; Frantzeskaki, N. Mismatches between ecosystem services supply and demand in urban areas: A quantitative assessment in five European cities. Ecol. Indic. 2015, 55, 146–158. [Google Scholar] [CrossRef] [Green Version]
- Lovell, S.T.; Taylor, J.R. Supplying urban ecosystem services through multifunctional green infrastructure in the United States. Landsc. Ecol. 2013, 28, 1447–1463. [Google Scholar] [CrossRef]
- Kremer, P.; Hamstead, Z.A.; McPhearson, T. The value of urban ecosystem services in New York City: A spatially explicit multicriteria analysis of landscape scale valuation scenarios. Environ. Sci. Policy 2016, 62, 57–68. [Google Scholar] [CrossRef]
- Gillner, S.; Vogt, J.; Tharang, A.; Dettmann, S.; Roloff, A. Role of street trees in mitigating effects of heat and drought at highly sealed urban sites. Landsc. Urban Plan. 2015, 143, 33–42. [Google Scholar] [CrossRef]
- Grote, R.; Samson, R.; Alonso, R.; Amorim, J.H.; Carinanos, P.; Churkina, G.; Fares, S.; Le Thiec, D.; Niinemets, U.; Mikkelsen, T.N.; et al. Functional traits of urban trees: Air pollution mitigation potential. Front. Ecol. Environ. 2016, 14, 543–550. [Google Scholar] [CrossRef]
- Southon, G.E.; Jorgensen, A.; Dunnett, N.; Hoyle, H.; Evans, K.L. Biodiverse perennial meadows have aesthetic value and increase residents’ perceptions of site quality in urban green-space. Landsc. Urban Plan. 2017, 158, 105–118. [Google Scholar] [CrossRef] [Green Version]
- Davies, Z.G.; Edmondson, J.L.; Heinemeyer, A.; Leake, J.R.; Gaston, K.J. Mapping an urban ecosystem service: Quantifying above-ground carbon storage at a city-wide scale. J. Appl. Ecol. 2011, 48, 1125–1134. [Google Scholar] [CrossRef] [Green Version]


| Districts | 1-Year | 10-Year | 25-Year | 100-Year | ||||
|---|---|---|---|---|---|---|---|---|
| Mean | STD | Mean | STD | Mean | STD | Mean | STD | |
| Dongcheng | 31.22 | 6.27 | 21.62 | 5.92 | 20.01 | 6.29 | 17.96 | 5.29 |
| Xicheng | 30.12 | 4.99 | 20.89 | 4.69 | 19.29 | 5.29 | 17.53 | 4.40 |
| Chaoyang | 38.32 | 7.93 | 28.69 | 7.79 | 26.66 | 7.93 | 24.34 | 7.10 |
| Fengtai | 40.03 | 8.63 | 29.97 | 8.46 | 27.92 | 8.24 | 25.34 | 7.68 |
| Shijinshan | 47.53 | 11.33 | 38.09 | 12.53 | 35.79 | 12.26 | 33.10 | 12.02 |
| Haidian | 44.38 | 13.20 | 34.71 | 14.05 | 32.56 | 13.87 | 29.92 | 13.27 |
| Mean | 38.70 | 10.62 | 29.07 | 10.81 | 27.09 | 10.70 | 24.74 | 10.02 |
| Land Cover | CN Value | ||
|---|---|---|---|
| Impervious surface | 98 | ||
| Green space | NDVI > 0.65 | aveg ≤ 50% | 66 |
| 50% < aveg ≤ 75% | 60 | ||
| aveg > 75% | 55 | ||
| 0.57 < NDVI ≤ 0.65 | aveg ≤ 50% | 73 | |
| 50% < aveg ≤ 75% | 65 | ||
| aveg > 75% | 58 | ||
| 0.40 < NDVI ≤ 0.57 | aveg ≤ 50% | 81 | |
| aveg > 50% | 78 | ||
| NDVI ≤ 0.4 | 74 | ||
| Soil | 91 | ||
| Water | 0 | ||
© 2020 by the authors. Licensee MDPI, Basel, Switzerland. This article is an open access article distributed under the terms and conditions of the Creative Commons Attribution (CC BY) license (http://creativecommons.org/licenses/by/4.0/).
Share and Cite
Li, X.; Kuang, W.; Sun, F. Identifying Urban Flood Regulation Priority Areas in Beijing Based on an Ecosystem Services Approach. Sustainability 2020, 12, 2297. https://doi.org/10.3390/su12062297
Li X, Kuang W, Sun F. Identifying Urban Flood Regulation Priority Areas in Beijing Based on an Ecosystem Services Approach. Sustainability. 2020; 12(6):2297. https://doi.org/10.3390/su12062297
Chicago/Turabian StyleLi, Xiaoyong, Wenhui Kuang, and Fengyun Sun. 2020. "Identifying Urban Flood Regulation Priority Areas in Beijing Based on an Ecosystem Services Approach" Sustainability 12, no. 6: 2297. https://doi.org/10.3390/su12062297