Article

Development and Prospect of Food Security Cooperation in the BRICS Countries

1
Agricultural Information Institute, Chinese Academy of Agricultural Sciences, Beijing 100081, China
2
Graduate School of Chinese Academy of Agricultural Sciences, Beijing 100081, China
3
Foreign Economic Cooperation Center, Ministry of Agriculture and Rural Affairs, Beijing 100125, China
*
Author to whom correspondence should be addressed.
Sustainability 2020, 12(5), 2125; https://doi.org/10.3390/su12052125
Submission received: 14 February 2020 / Revised: 4 March 2020 / Accepted: 8 March 2020 / Published: 9 March 2020
(This article belongs to the Section Economic and Business Aspects of Sustainability)

Abstract

:
In recent years, the international status of agriculture in the BRICS countries—Brazil, Russia, India, China and South Africa—has been continuously improved. In 2018, the gross agricultural production of the BRICS countries accounted for more than 50% of the world’s total. Further strengthening the developing cooperation of the BRICS countries is of great significance for ensuring global food security. Based on the data from FAOSTAT and UN Comtrade Database, this study builds a food self-sufficiency rate and food security cooperation potential index to quantitatively analyze the food security status, cooperation effectiveness, and future trends of the BRICS countries. The study finds that the overall food security of the BRICS countries is generally showing a trend of volatility and growth, with high rates for cereals and relatively low rates for fresh products. In the future, BRICS food security cooperation should be based on their own resource endowment and socioeconomic characteristics. The BRICS countries need to constantly improve the awareness of joint cooperation and action in the future, focusing on scientific and technological cooperation, information sharing, complementary advantages in trade, and improving the global competitiveness of products. With the help of agricultural science and technology, Brazil is growing as a strong export country of food products. Russia needs to increase the introduction of agricultural science and technology and foreign capital to give full play to its resource advantages. India can improve its food self-sufficiency faster by the construction of a BRICS Agricultural Research Platform. China makes full use of BRICS resources, actively promotes agricultural enterprises to go global, and constantly optimizes the food supply structure. South Africa maintains the advantages of fruit and vegetable industry and increases the introduction and promotion of agricultural science and technology to improve the domestic food production capacity.

1. Introduction

Over the past decades, the development of breeding technology, biotechnology, and planting management technology has rapidly increased the global food supply capacity, especially in developing countries [1,2,3]. The global food security level has thus been improved. According to the data of Food Outlook [3], global food production in 2018 was estimated to be 9.751 billion tons, of which grain production reached 2.652 billion tons, an increase of 34.55% and 28.8%, respectively, compared with 7.247 billion tons and 2.059 billion tons in 2000 [4]. However, in recent years, since climate change, resource constraints, and environmental protection have had an increasing impact on food security, global food security is still facing considerable challenges [5,6,7]. According to World Food Security and Nutrition 2019 [8], the number of underfed people in the world has continued to grow since 2015, reaching 821 million in 2018, an increase of 4.61% over 2015, and the proportion of underfed people reached 10.8%, the highest in the past 4 years.
Global solutions are needed to solve food security problems. Strengthening international cooperation on food security is the key to solving world food problems [7,9,10,11]. Coordinating and mobilizing the balanced resource usage of various countries and solving the food security problem from the perspective of globalization has been widely recognized [12,13]. Lukas Kornhera and Matthias Kalkuhlb pointed out that regional food security cooperation, especially trade and inventory, is of great significance to food security [13]. At present, the United Nations is an important organization for the promotion of global food security cooperation. It has directly formulated development plans for sustainable development and Goal 2 of the Millennium Development Goals, Zero Hunger. This has involved food security-related agencies including the World Food Program, the World Bank, the Food and Agriculture Organization of the United Nations, the International Fund for Agricultural Development, etc. for promotion of a comprehensive and unified response from the international community to the challenges of achieving global food and nutrition security [14,15,16,17].
As the world’s major emerging economies, the populations of the BRICS nations account for 41.57% of the world’s total population in 2018, and the gross agricultural production of the BRICS countries accounts for more than 50% of the world’s total. Further strengthening and development of cooperation among the BRICS countries is of great significance for ensuring global food security [18,19,20]. Approaches for ensuring food security are an important aspect of the BRICS countries’ cooperation. They strive to solve food security through cooperation and sharing. Especially since the release of their Joint Statement on Global Food Security in 2009, the BRICS countries have engaged in extensive cooperation in science, technology, information, and trade, and respectively convened the BRICS Ministerial Conference on science and technology innovation, industry, communications, agriculture, and trade to jointly promote cooperation across different fields for food security. Food security issues of the BRICS countries have also attracted extensive attention from scholars. Noort pointed out that due to their unique demographic and social characteristics, the BRICS countries play a key role in the world’s fight against hunger, focusing on productivity and effective resource utilization [21]. He especially emphasized the important role of a series of BRICS cooperation plans in coping with the global food crisis. Some researchers have considered the agricultural production of the BRICS countries along with energy and environmental factors and discussed the influence of food production as well as its obstacles [22,23,24,25]. Chinese scholars have focused on agricultural cooperation in the BRICS countries from the perspective of agricultural trade and investment. These studies have found that the BRICS countries are highly complementary in the fields of agricultural resources and agricultural product trade, and cooperation has been strengthened in recent years [26,27,28,29]. In terms of food security cooperation, Zhang systematically measured the progress of BRICS cooperation in food security since the establishment of the cooperative working group in 2011 from the perspectives of science and technology information exchange platforms, agricultural trade cooperation, and global governance [20]. The research pointed out that BRICS food security cooperation should improve the cooperation mechanism, achieve mutually complementary advantages, promote cooperation in key areas, and achieve win–win development.
Overall, it is generally recognized that BRICS food security cooperation plays an important role in ensuring world food security. However, the existing research perspective is mostly focused on agricultural trade, agricultural investment, energy, environment, and other aspects. There is less research on food security cooperation involving BRICS countries and few studies on the effectiveness and potential of BRICS food security cooperation by quantitative means. Therefore, the quantitative study of BRICS food security cooperation is of great significance to the scientific evaluation of its progress, the promotion of future cooperation, and the effective guarantee of BRICS food security. This study will introduce the concept of food security and food self-sufficiency, evaluate the current food security status in BRICS, build a potential index of food security cooperation, and then examine the prospects and path of food security cooperation between the BRICS countries. Specifically, the next section covers the research methods and data sources; the third section the results and analysis; the fourth the discussion; and the fifth the conclusion.

2. Materials and Methods

2.1. Research Methods

In this study, the food self-sufficiency rate and food security cooperation potential index are mainly used to evaluate the current situation and future trend of the BRICS food security cooperation based on the objective description of the current situation of food security in the BRICS countries.

2.1.1. Food Self-Sufficiency Rate

Referring to the concept and calculation method of the United Nations’ Food and Agriculture Organization (FAO) self-sufficiency rate [30,31,32], the food self-sufficiency rate refers to the ratio of total food production to total consumption in a country or a region within one year, the calculation formula being:
R f o o d = P f o o d D f o o d × 100 % ,
where Rfood is the rate of food self-sufficiency, Pfood is the total domestic food output, and Dfood is the total domestic food consumption.
Common consumption statistics methods include quota statistical method, flow direction statistical method, and consumption statistical method [18]. (a) The quota statistics method is the most common method to estimate the consumption demand, which is simple to calculate, and is based on the product of the annual consumption per capita and the total population. (b) Flow direction statistics is an indirect method to calculate food demand. Food destination can be divided into four aspects: food consumption, food export, import, and inventory. (c)The consumption statistics method is a direct method to calculate the demand of grain. It takes all factors into account, but the calculation process is complex [18]. With comprehensive consideration of quantity availability and measurement accuracy, this study uses the flow direction statistical method, which means that the total consumption of food is equal to the total domestic food supply. The calculation formula is
D f o o d = P f o o d E f o o d Z f o o d + I f o o d ,
where Efood, Zfood, Ifood are food exports, stock increments, and imports, respectively.
The self-sufficiency rate of each type of food is measured to better analyze and grasp the food composition and self-sufficiency structure of each country while calculating the total food self-sufficiency rate. The definitions and calculation formulae refer to Formula (1) and Formula (2).

2.1.2. Potential Index of Food Security Cooperation

The importance of food security cooperation to ensure food security urgently needs to constantly improve methods, accurately judge the potential between countries, and put forward integrated development suggestions. In further method combing, it is found that the existing quantitative research on cooperation potential focused on agricultural product trade potential using index analysis [33,34], trade gravity model [35,36,37], and stochastic frontier gravity model [38,39,40]. The analysis of agricultural cooperation potential is mostly qualitative [41,42,43]. The construction of food security cooperation potential index of this research will increase the objectivity and fairness of evaluation.
Based on the space interaction theory, comparative advantage theory, resource endowment theory, international division of labor theory, great irrelevance theory [44], as well as research on the measurement of agricultural trade cooperation potential, this study proposes the potential coefficient and potential index of food security cooperation.
(1) Potential coefficient of food security cooperation.
Ullman pointed out that the premise of regional cooperation (including countries) of goods, population and labor, capital, technology, and information lies in three points: regional complementarity, interference factors, and accessibility between regions [45]. Agricultural complementarity, strategic closeness, and transportation convenience are a unified whole, which ultimately affect food security cooperation between countries. Among them, the complementarity of production resources and factors and the complementarity of food-based agricultural product trade are the most direct and fundamental factors affecting food security cooperation. Strategic closeness is the premise and guarantee of food security cooperation. Transportation convenience is a key constraint to the realization of food security cooperation. The food security cooperation potential coefficient can be calculated as follows:
C i j = A i j × S i j × T i j ,
where Cij is the potential coefficient of food security cooperation between i and j, and Aij, Sij, Tij represent the coefficient of complementarity, strategic tightness, and transportation convenience between i and j, respectively.
(a) Coefficient of complementarity (Aij): Based on comparative advantage theory, resource endowment theory, international division of labor theory, and great irrelevance theory, from three aspects of production resources and environment, food production capacity, and food-based agricultural product trade [46,47], 26 specific indicators are selected, including current situation indicators and future trend indicators. Among them, production resources and environment indicators include per capita land area, per capita agricultural land area, per capita agricultural land irrigation area, average labor cultivated area, tractor usage, harvester usage, fertilizers, adult literacy, research and technical personnel quantity, human development index, informatization development index, national innovation index, food production index. Food production capacity indicators include per capita production of grain, oil, fruit, vegetables, sugar, meat, eggs, dairy, and aquatic products. Food-based agricultural product trade indicators include per capita food imports and exports, and average annual growth rate of food exports and imports. ‘1-similarity coefficient’ is used as the measurement of complementarity coefficient [48]. That is,
A i j = 1 k = 1 n x k i x k j k = 1 n x k i 2 × k = 1 n x k j 2 ,
where xki, xkj represent the selected indicators for evaluating the complementarity between i and j. The selected indicators refer to the 26 specific indicators selected in this study for the measurement of the complementarity index, such as per capita land area, per capita agricultural land area.
(b) Strategic tightness coefficient (Sij): This paper measures the national political stability, the strength of the investment and trade environment, and the relationship between countries [49,50]. Since such indicators are difficult to quantify, we adopted the expert scoring method to determine the Sij between countries. The expert scoring method is an effective method of quantifying qualitative problems by using experts’ professional judgment. A total of 15 experts in this study were selected from the Brazilian Institute of Applied Economics, the Russian National Institute of Advanced Economics, the Indian Agricultural Research Institute, the Chinese Academy of Agricultural Sciences, the Foreign Economic Cooperation Center of the Ministry of Agricultural and Rural Affairs of China, and the South African Agricultural Research Council. Refer to Li for assignment and calculation methods [51].
(c) Transport convenience coefficient (Tij): Transport convenience includes international transport convenience and domestic transport convenience. The coefficient of transport convenience is calculated mainly by considering distance factors and infrastructure conditions. Drawing lessons from the trade gravity model and other research, this research uses the data of straight-line distance between capital cities, total railway length, and highway density by assigning a value to the transport convenience between two countries as main indicator to calculate the transport convenience coefficient [37,52,53]. In the case of the BRICS countries, the nearest distance gets 1 point, followed by 0.8, 0.6, and 0.4 points, respectively. The transport convenience coefficient is calculated by assigning the total length of railway and highway density similarly, combined with expert opinions.
(2) Food security cooperation potential index.
Based on the comprehensive potential coefficient of food security, taking the scale of food production and trade into account, the food security cooperation potential index could be obtained, so as to realize the dynamic evaluation of future food security cooperation potential. The food security cooperation potential index formula is as follows:
M i j m = C i j × Y i m + E j m ,
where Mijm is the food security cooperation potential index between i and j in m year, Yim is the product of agricultural added value and food trade volume of country i in m year (because of the lack of statistical data, agricultural added value is used instead of food added value). Ejm is the product of agricultural added value and food trade volume of country j.

2.2. Data Source

The concept of food in this study uses the definition of the FAO, including 108 varieties of foods in 9 categories, such as cereals, oilseed, fruits, vegetables, sugar, meat, eggs, milk, aquatic products, etc. [30,54]. Compared with the categories of food-based agricultural products in FAO, the trade volume of 18 agricultural products in HS code has been added as a food trade volume [55], which includes 02 (meats), 03 (fish and other aquatic animals), 04 (dairy, egg, honey, etc.), 07 (edible vegetables), 08 (edible fruits, nuts), 09 (coffee, tea, spices), 10 (cereal), 11 (milling industry products), 12 (kernel and fruit), 13 (shellac; gum, resin, etc.), 15 (animal and vegetable oil, fat, wax), 16 (meat, fish, and other aquatic animal products), 17 (sugar and confectionery), 18 (cocoa and cocoa products), 19 (cereal, flour, or dairy products; pastry), 20 (vegetables, fruits, nuts), 21 (miscellaneous food), 22 (beverage, wine, vinegar).
In terms of specific data and sources, the total food production, food import and export volume, and stock changes in 2000–2013 were obtained from Food Balance Sheets of FAOSTAT. Per capita land area, per capita agricultural land area, per capita arable land area, and labor average arable land area in 2016 were obtained from FAOSTAT. Tractor usage and harvester usage in 2008 are obtained from related research. Fertilizer usage, adult literacy rate, number of technicians, human development index, informatization development index, national innovation index, and food production index in 2016 were obtained from the World Bank database, International Statistical Yearbook, Human Development Report, etc. Data on the production of cereal, oil, fruit, vegetable, sugar, meat, egg, dairy, and aquatic products in 2018 were from FAOSTAT and Food Outlook 2019. The demographic data were from the World Bank database. The straight-line distance between countries was queried using Google Earth (earth.google.com/web/). Data on the total length of the railways and the highway density in 2016 were obtained from the World Bank database and the World Road Statistics Report. Agricultural foreign investment data were from the Ministry of Commerce and related websites. Food trade and agricultural product data were from FAOSTAT and the United Nations Commodity Trade Database (UN Comtrade Database).

3. Results

3.1. Progress in Food Security Cooperation in the BRICS Countries

3.1.1. Basic Establishment of Food Security Cooperation Framework

With the joint efforts of the BRICS countries, considerable progress has been achieved in the institutionalization of food security cooperation. This is owing to the action plan focusing on food security. The BRICS Agricultural Cooperation Action Plan (2012–2016) was adopted at the 2011 BRICS agriculture ministers’ meeting, which identified five major cooperation projects. Two major cooperation projects are directly related to food security: food security research relating to the most vulnerable in the population led by Brazil and reduction of the negative impacts of climate change on food security and promotion of agricultural adaptation to climate change led by South Africa. The seventh BRICS agriculture ministers’ meeting, held in Nanjing, China in 2017, further clarified the task and the action required. All of the countries actively carried out relevant research as well. Under the theme of ‘Promoting Climate-Smart Initiatives and Actions to Enhance the Resilience of Agriculture and Food Systems,’ the eighth BRICS agriculture ministers’ meeting was held in Skukuza, South Africa in 2018. The ninth BRICS agriculture ministers’ meeting held in September 2019 in Brasilia, Brazil had the clear theme of ‘Promoting Technological Innovation and Action, Exploring New Ways to Strengthen Food Production Systems,’ which effectively promoted cooperation and dialogue on food security. The second meeting, the Food Security Cooperation Working Group, took many initiatives to promote food security cooperation. In accordance with the working rules of the BRICS Working Group on Agriculture Cooperation 2011, a working group on agricultural cooperation was set up to provide organizational guarantee for promoting food security cooperation in the BRICS countries.

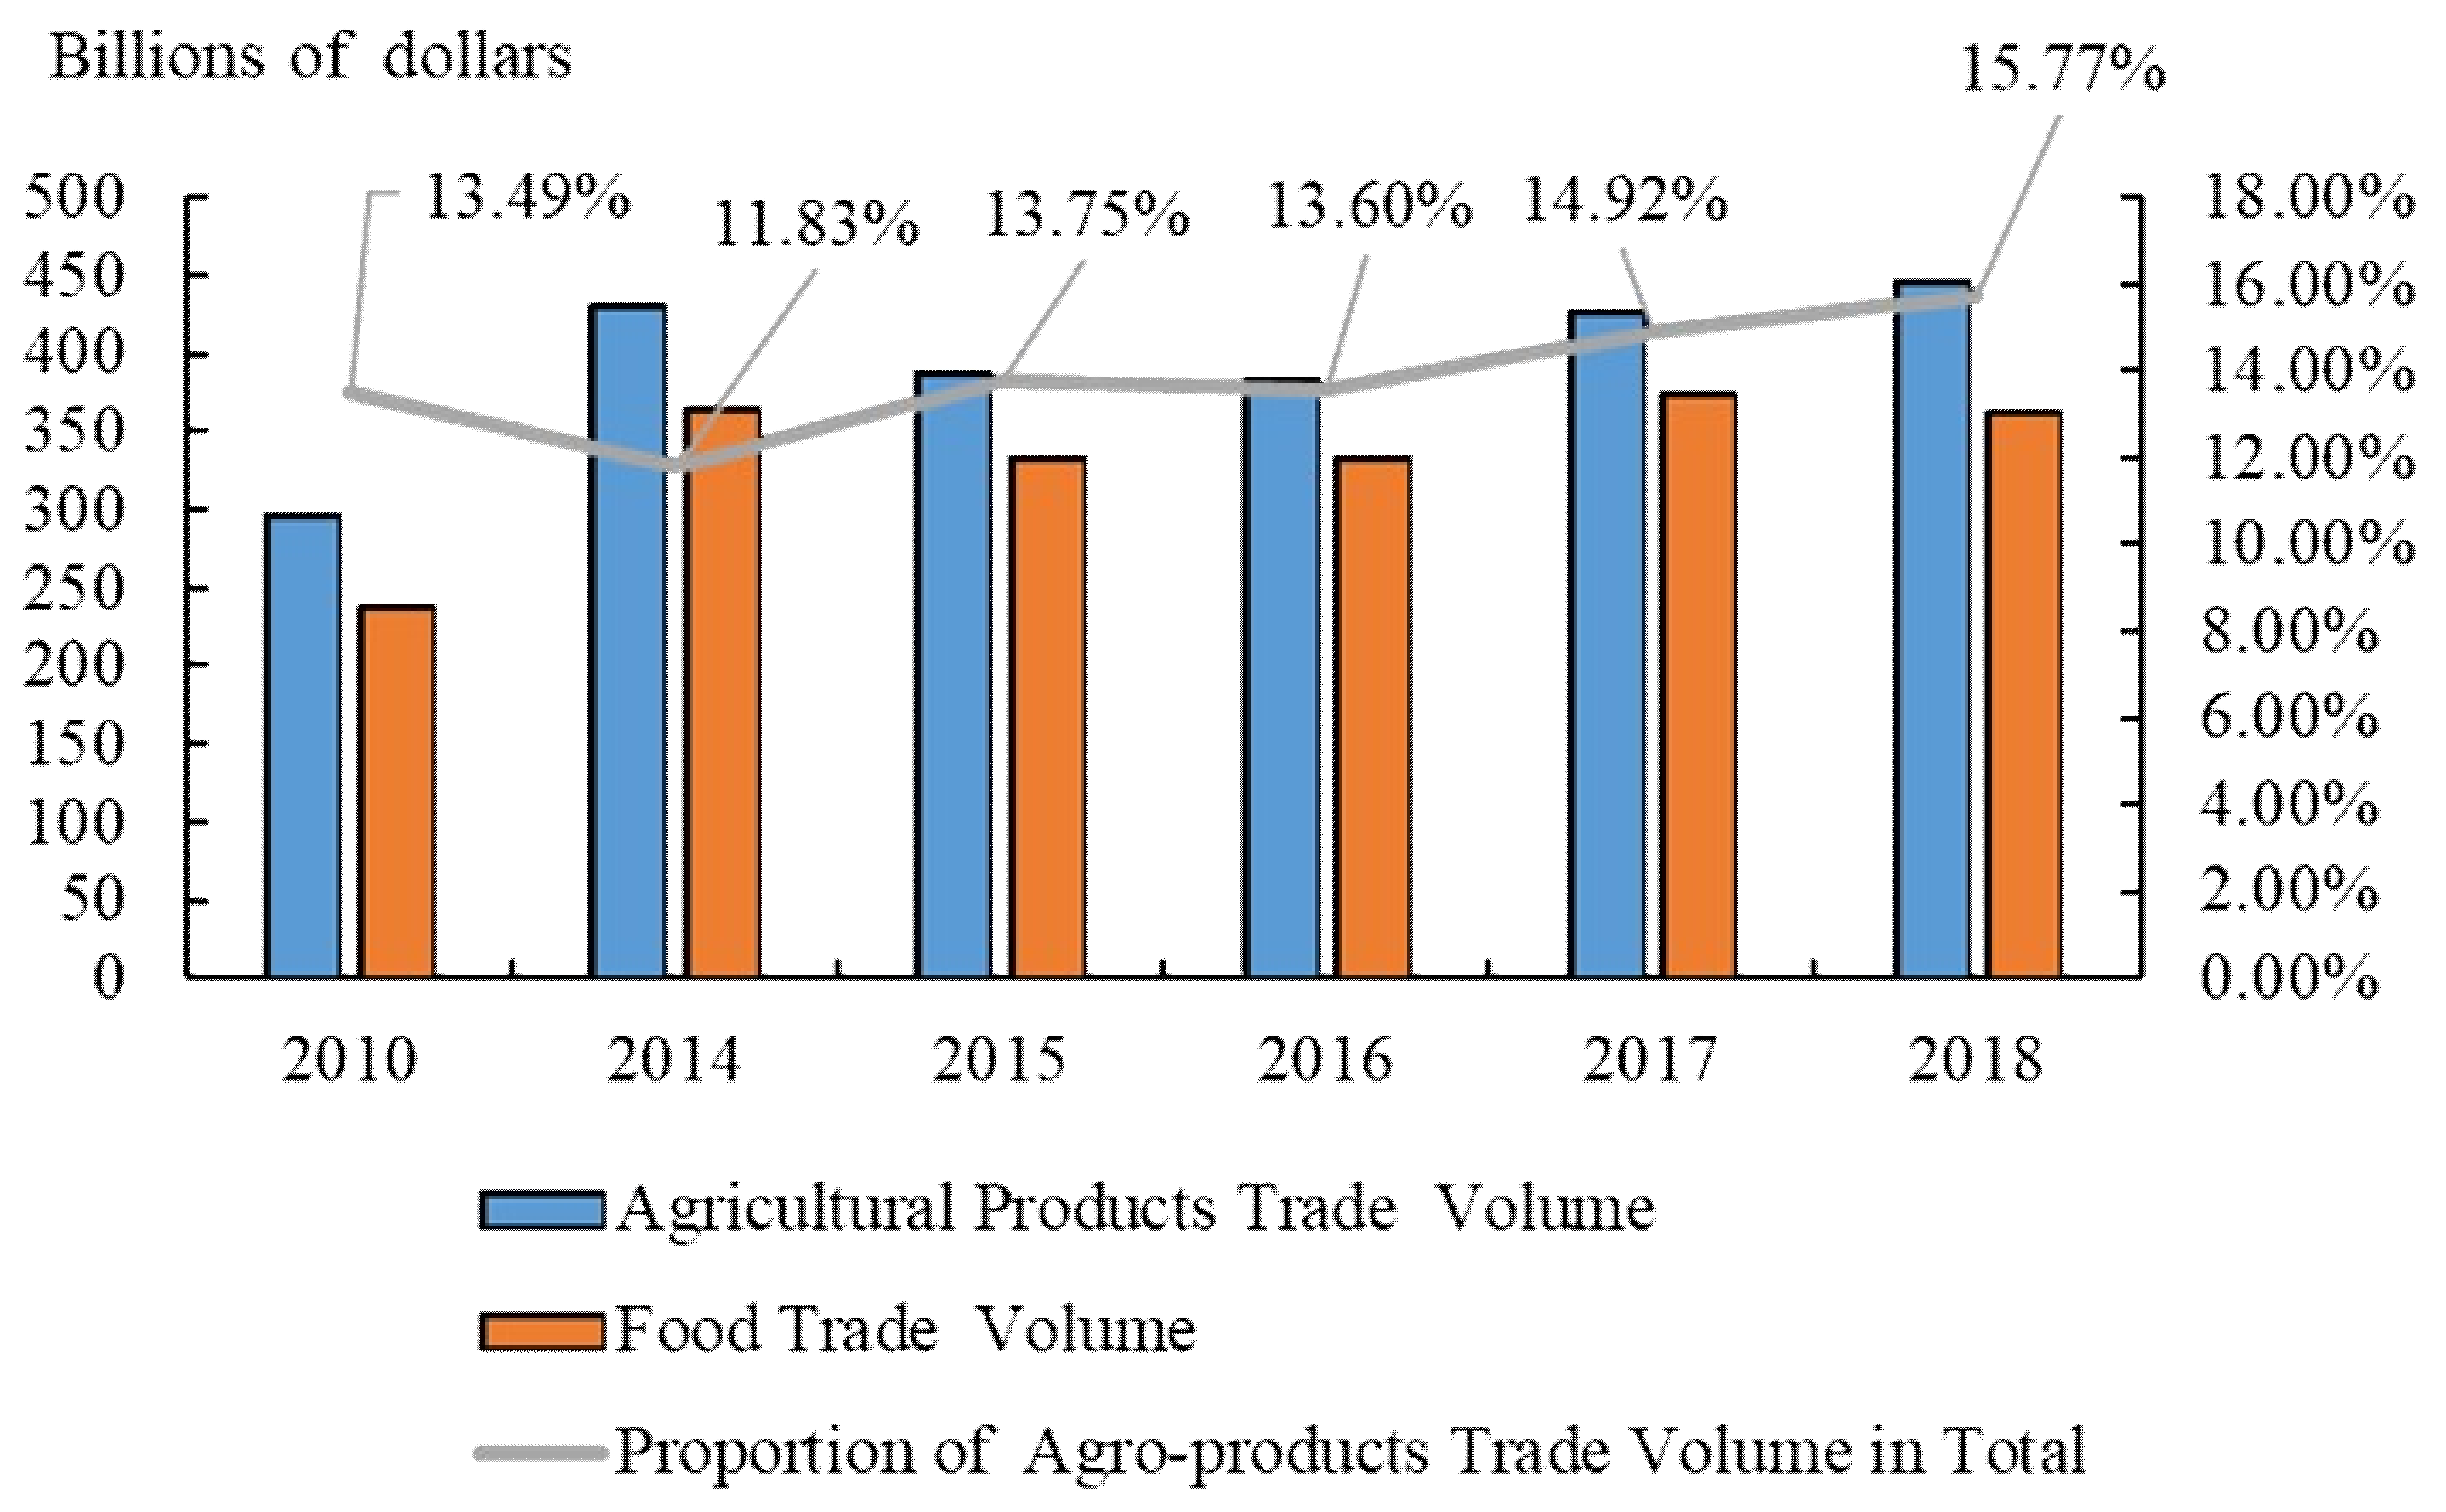
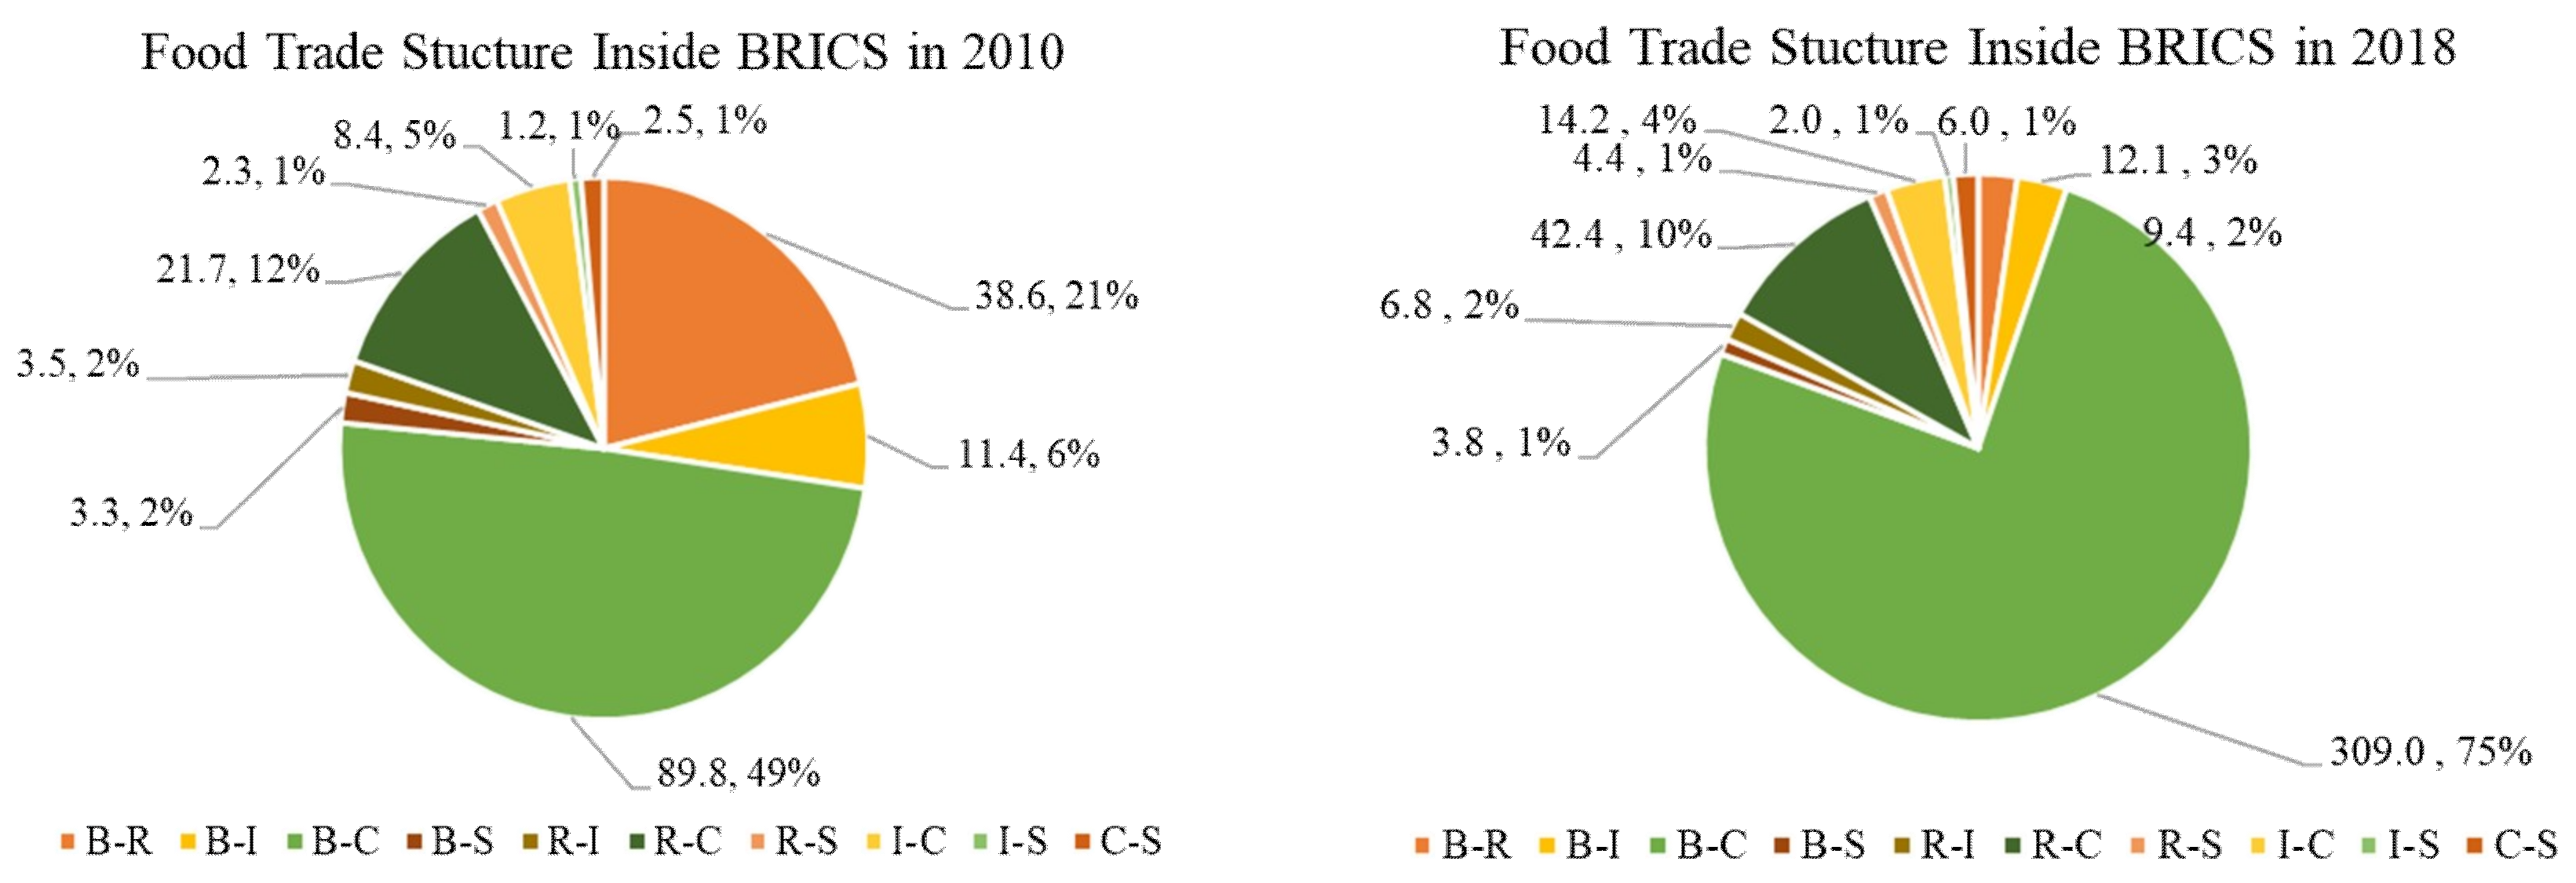
3.1.2. The Continuous Strengthening of the Food Trade

BRICS countries play an important role in global agricultural trade. In 2018, the BRICS agricultural trade volume reached US $446.5 billion, accounting for 15.77% of the world’s, having increased by 51% compared with 2010. The proportion of world agricultural product trade has increased by 2.28% (Figure 1). Among them, the food trade volume increased from US $238.3 billion in 2010 to US $363.1 billion in 2018, with an average annual growth rate of 5.41%. Further analysis finds that the food trade volume within BRICS countries from 2010 to 2018 increased from US $18.3 billion to US $41 billion, with an average annual growth rate of 10.61% (Figure 2), far higher than the growth rate of food trade between the BRICS and other countries. Food trade within the BRICS countries has been continuously strengthened. Among them, the food trade volume of Brazil and China has increased the most, reaching US $30.9 billion in 2018, accounting for 75.36% of the BRICS countries, an increase of 243.33% compared with 2010, with an average annual growth rate of 16.67%.

3.1.3. The Continuing Growth of Global Food Security Governance

With the continuous improvement of international food production capacity in the BRICS countries, their contribution to food security and voice in international food have increased. According to the data from FAOSTAT and Food Outlook (2019), the total food production of the BRICS countries in 2018 was estimated to be 4394 million tons, accounting for 45.06% of the world’s total food production, an increase of 7.22% from 4098 million tons in 2010, with an average annual growth rate of 0.88%. Second, the BRICS countries have worked together to promote their officials as institutional directors in important food security governance institutions such as the Food and Agriculture Organization of the United Nations. On 23 June, 2019, Dr. Qu Dongyu, Vice Minister of Agriculture and Rural Ministry of China, was elected as the new Director General of FAO and became the first Chinese Director General in the history of the organization. Furthermore, his predecessor was from Brazil. These points highlight the progress in the representation of the BRICS countries in national food governance.

3.2. State of Food Security in BRICS Countries

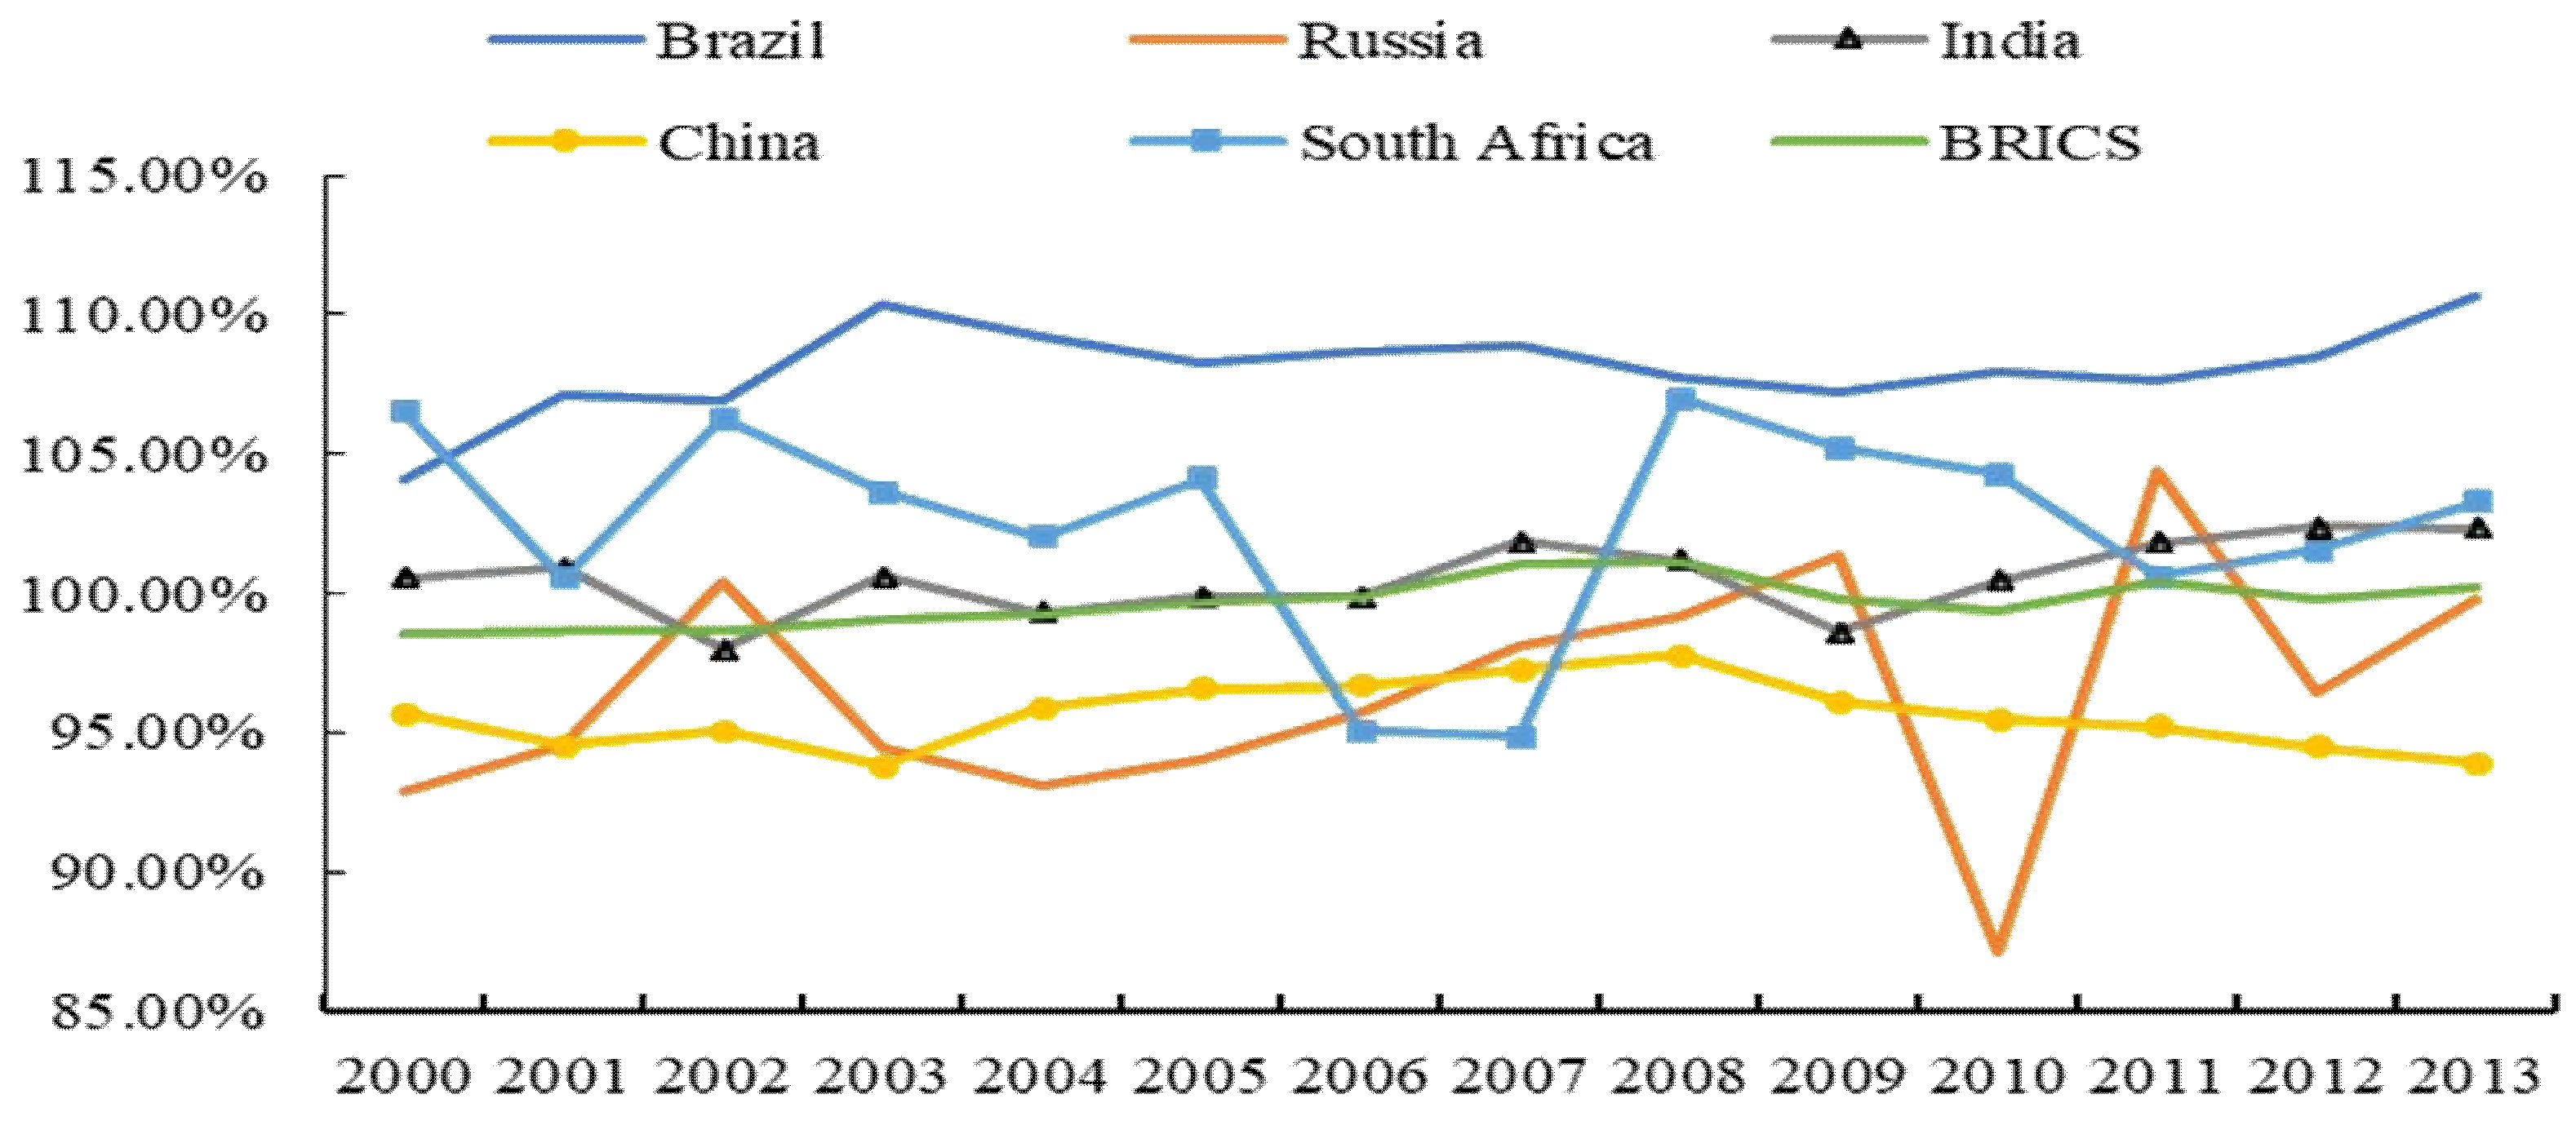
3.2.1. Discrepancy in Progress between the Countries

The analysis in this part includes two processes. First, according to the data of the Food Balance Sheets in FAOSTAT from 2000 to 2013, Formulae (1) and (2) were used to calculate the food self-sufficiency rate of the BRICS countries (Figure 3) and accurately measure their food security situation.
From 2000 to 2013, the self-sufficiency rate of food in the BRICS countries maintained a fluctuating growth trend from 98.57% to 100.26%, achieving overall food security. However, there are differences between the countries. Brazil’s food self-sufficiency rate is the highest among the BRICS members and continues to exceed 100%. In 2013, Russia’s food self-sufficiency rate was 99.82%, higher than the 95% food security minimum recommended by FAO, but it has fluctuated greatly, reaching 87.14% in 2010. The self-sufficiency rates in India and South Africa in 2013 were 102.36% and 101.56%, respectively, in a similar trend. The self-sufficiency rate of food in China was the lowest among BRICS countries, at only 93.93% in 2013. This is mainly due to China’s low oil self-sufficiency rate, which was only 45.5% in 2013, and China’s grain is highly secure with a self-sufficiency rate of 112.8%.
Second, the moving average method, the most simple and accurate method for the prediction of time series data with time lag, was used to estimate the food self-sufficiency rate from 2014 to 2018 [56,57,58,59]. The study then predicted the food self-sufficiency rates for 2025 and 2030, showing that the food in the BRICS countries will be basically safe in the future. The overall food self-sufficiency rates for 2025 and 2030 are about 100.03%. Food self-sufficiency rates in Brazil, Russia, India, and South Africa are also above 95%, with only China at less than 95% (Table 1).

3.2.2. Different Self-Sufficiency Rates of Different Food Types

As can be seen from Table 2, the self-sufficiency rate of grain has maintained a high level, remaining over 110% and maintaining steady growth after 2010. This is closely related to the food development policies of various countries. For example, China clearly plans to ensure the security of rations. The self-sufficiency rate of some perishables, mainly fresh agricultural products that are difficult to transport, such as fruits, vegetables, meat, and eggs, is also high, essentially achieving self-sufficiency and maintaining steady growth. The oil self-sufficiency rate is the lowest and maintains a low trend. In 2000, the self-sufficiency rate of oil materials in the BRICS countries was 90.94% and dropped to 72.46% in 2013. It is predicted to be below 75% in 2020 and 2030. In addition, the dairy self-sufficiency rate in the BRICS countries decreased by 7.88% in 2013 compared that with 2000, but it is predicted to reach more than 95% in 2025 and 2030.

3.3. Judgment of Cooperation Potential

From the analysis in Section 3.2, we learn that although the overall food security situation in the BRICS countries is acceptable, the differences between countries and products are obvious. Therefore, it is of paramount importance to coordinate the food security of the BRICS countries through collective efforts.

3.3.1. Analysis of Basic Conditions of Cooperation

Here we focus on comparative analysis of food development resources and modernization of the BRICS countries. The BRICS countries have rich land resources, accounting for about one third of the world’s total land area. However, the level of per capita resources varies greatly from country to country. Table 3 shows that the per capita agricultural land area in China and India is only 0.38 and 0.14 hectares per person, respectively, while Brazil, Russia, and South Africa all have more than 1 hectare per person, the highest being 1.72 hectares per person in South Africa. However, the irrigation conditions in Russia are limited, with only 0.03 hectares of irrigated agricultural land area per person.
In this study, relevant indicators are selected to compare the modernization of food production in three aspects: mechanization, informatization, and production capacity. In terms of cultivated land area per labor, China and India are the most labor-intensive countries with only 0.15 and 0.31 hectares per person under cultivation, respectively. China has relatively high levels of mechanization; the usage of tractors and harvesters per thousand hectares of arable land were 27.70 and 5.80, respectively, in 2016, followed by India with 19.90 and 3, respectively. China’s fertilizer usage is far higher than that in other BRICS countries, reaching 503.32 kg/ha in 2016. In terms of information, technology, and human development, the adult literacy rate in the BRICS countries exceeds 90% except in India. Russia has the largest number of research and technical personnel, i.e., 3620 out of every million people. The foundation of scientific and technological research on food production and processing is good. In terms of food production index, except for South Africa, which is slightly lower, there is little difference among the BRICS countries.

3.3.2. Potential Measurement Analysis

It is considered that the greater the potential coefficient value of food security cooperation, the greater the potential of food security cooperation between the two sides. It can be concluded from Table 4 that the biggest potential partner in Brazil’s food security cooperation is China due to highly complementary agricultural product trade, with a complementarity coefficient of 0.083 (Table 4). However, the biggest potential partner in Brazil’s food security cooperation is Russia, with a potential coefficient of 0.014. The biggest potential partner of Russia is China since they have a better partnership and convenient transportation between them. The biggest potential partner of India is South Africa. The biggest potential partner of South Africa is Brazil, as they have obvious advantage in strategic compactness and transportation convenience.
Table 5 shows the future food security cooperation potential index of the BRICS countries. The country that has the greatest potential for food security cooperation with Brazil in 2025 and 2030 is China. The cooperation potential index was US $33.355 billion and US $33.378 billion, respectively, an increase of about 7.9% compared with US $30.9 billion in 2018; China and Russia maintain a highly beneficial relationship with huge potential for food security cooperation in the future. The potential index of food security cooperation of the two countries in 2025 and 2030 will reach US $72.792 billion and US $72.842 billion, respectively, with an increase of more than 16 times compared with 2018. India has the highest future food security cooperation potential index with China among the BRICS countries, both being over US $10 billion. Compared with the US $14.2 billion index of 2018, it also has a large increase of over 6.5%. The country with the greatest potential for food security cooperation with South Africa is India, which also has some potential with Brazil and China.

4. Discussion

Although the overall food self-sufficiency rate of the BRICS countries is relatively high, the per capita cereal output for all the populous BRICS countries is still low. According to FAO data, India’s per capita grain production in 2018 was only 193 kg/person, which is far below the security warning line set by the FAO (400 kg/person) [30]. The per capita grain production of South Africa and China is also below the warning line. Considering that the BRICS is still a key factor in future global population growth [60], we need to be aware of the risk of future decline. As for the food self-sufficiency rate, there is a significant difference between different types of foods in the BRICS countries, and this certainly gives rise to structural food security problems. For example, although the overall food self-sufficiency rate is about 95% in China, the oil self-sufficiency rate has been basically lower than 50% since 2011, even only 45.5% in 2013. Once the international oil import market fluctuates and the domestic oil demand is not met, it may affect the food security of the whole country.
BRICS countries have different basic conditions and development conditions of food security, and there will be differences in the priorities of countries in future cooperation. Brazil has unique natural resources and advanced agricultural science and technology. It has been committed to solving the food security problem through the technology export and cooperation among BRICS countries, such as genetic technology, fuel ethanol, and biodiesel technology, which is the key point of its future cooperation. For example, Brazil’s soybean exports to China and Russia accounted for nearly 85% of its total exports in 2018.
Russia is an important importer of agricultural products in the world. In the future, it is necessary to strengthen the import of food products with China, Brazil, India, and South Africa, as well as the export of wheat and corn, so as to realize the complementarity of food products among BRICS countries. In addition, optimizing the domestic agricultural investment and trade environment to attract more agricultural direct investment is the way of food security cooperation among BRICS countries in the future.
Although India maintains a net export trend of food products to China, South Africa, and Russia with a large population, while maintaining the export of advantageous food products, India should actively promote BRICS mature technical cooperation and further stimulate its agricultural capacity potential.
In the trade cooperation of food products with other BRICS countries, China is a net importer, importing soybeans, sugar, and meat from Brazil, wheat and corn from Russia, rice and spices from India, and fruits, vegetables, and their products from South Africa. In the future, while continuing trade cooperation, China should make efforts to strengthen foreign investment of agricultural enterprises and optimize the planting and breeding structure of food products.
Compared with other BRICS countries, the overall level of agricultural development in South Africa is relatively low, especially agricultural science and technology, so technical cooperation can be a focus of cooperation between South Africa and other BRICS countries. In addition, in terms of trade cooperation of food products, South Africa should continue to play its unique advantages in fruit and vegetable planting and expand the trade of high-quality fruit and vegetable products.

5. Conclusions

With regard to the food self-sufficiency rate and the food security cooperation potential index, this study aimed to quantitatively evaluate the food security and food cooperation status of the BRICS countries and predict food security cooperation potential in the future. The results indicate that the BRICS countries have realized food security as a whole, but the self-sufficiency rate varies greatly between different countries and different types of foods. Therefore, it is necessary to be alert to structural food security risks in the future. In addition, BRICS food security cooperation is beginning to have impacts, with increasing international status and huge cooperation potential in the future. For instance, the Sino-Russian food cooperation potential index will reach US $72.842 billion in 2030.
Based on the conclusions of the research, several recommendations for strengthening food security cooperation in BRICS countries can be made. The first, further improving the BRICS food security cooperation mechanism and promoting the construction of BRICS Agricultural Information Exchange System. Second, accelerating the promotion of the BRICS Agricultural Research Platform, promoting joint research on key food safety technologies. Third, BRICS countries should make full use of their advantages and promote trade cooperation based on the complementarity of resources and food products. Fourth, BRICS countries should improve the quality, competitiveness, and adaptability of the BRICS food supply system from a global perspective. According to the direction of each country’s food security cooperation, Brazil should increase support for the export of food products and technology. Russia should constantly improve the investment environment. India should promote the construction of a science and technology platform. China should guide more agricultural science and technology and enterprises to go abroad. South Africa should improve the domestic agricultural development environment.
This study is a supplement to previous qualitative research on the BRICS countries’ international food security cooperation. However, due to data sources and space constraints, the screening process and correlation of food security cooperation index were not discussed in detail, the moving average method is also a relatively simple prediction method, and there is no in-depth analysis on the factors affecting food security or upcoming future challenges. These aspects will be focused on in subsequent research.

Author Contributions

As the first author of this paper, Y.R. participated in all aspects of the paper, mainly including conceptualization, methodology, software, validation, formal analysis, investigation, data curation, writing—original draft preparation, and writing—review and editing. Y.W. made an important contribution to data chart visualization. Z.L., as the corresponding author of this paper, has given comprehensive guidance to research methods, paper structure, writing, etc., and is the principal of the funded project. T.Z. provided help in communication with international experts and in the improvement of thesis English. All authors have read and agreed to the published version of the manuscript.

Funding

This research was funded by the International Cooperation Project of the Ministry of Agriculture and Rural Affairs, the People’s Republic of China—Research on BRICS Agricultural Information Exchange System, funding for Outstanding Talents of the Ministry of Agriculture of the People’s Republic of China and Collaborative Innovation Project of Chinese Academy of Agricultural Sciences, grant number caas-xtcx2020027.

Conflicts of Interest

The authors declare no conflict of interest.

References

  1. Findiastuti, W.; Singgih, M.L.; Anityasari, M. Sustainable Food Security Measurement: A Systemic Methodology. Mater. Sci. Eng. 2017, 2017, 193. [Google Scholar] [CrossRef] [Green Version]
  2. Cafiero, C.; Viviani, S.; Nord, M. Food security measurement in a global context: The food insecurity experience scale. Measurement 2018, 116, 146–152. [Google Scholar] [CrossRef]
  3. FAO. Food Outlook 2019. Available online: http://www.fao.org/3/ca4526en/ca4526en.pdf (accessed on 23 September 2019).
  4. FAOSTAT. Food Balance. 2019. Available online: http://www.fao.org/faostat/en/#data/FBS (accessed on 15 August 2019).
  5. Ramankutty, N.; Mehrabi, Z.; Waha, K.; Jarvis, L.; Kremen, C.; Herrero, M.; Rieseberg, L.H. Trends in Global Agricultural Land Use: Implications for Environmental Health and Food Security. Annu. Rev. Plant Biol. 2018, 69, 789–815. [Google Scholar] [CrossRef] [PubMed] [Green Version]
  6. Hansen, J.; Hellin, J.; Rosenstock, T.; Fisher, E.; Cairns, J.; Stirling, C.; Lamanna, C.; Etten, J.; Rose, A.; Campbell, B. Climate risk management and rural poverty reduction. Agric. Syst. 2019, 172, 28–46. [Google Scholar] [CrossRef]
  7. Pahl-Wostl, C. Governance of the water-energy-food security nexus: A multi-level coordination challenge. Environ. Sci. Policy 2019, 92, 356–367. [Google Scholar] [CrossRef]
  8. WHO; FAO; IFAD; UNICEF. The State of Food Security and Nutrition in the World 2019. Available online: https://www.who.int/nutrition/publications/foodsecurity/state-food-security-nutrition-2019-zh.pdf?ua=1 (accessed on 11 September 2019).
  9. Emmy, S. Harvesting Peace: Food Security, Conflict, and Cooperation. Environ. Chang. Secur. Program Rep. 2013, 14, 16–25. [Google Scholar]
  10. Stedman, S.J. Food and Security from the Evolving Sphere of Food Security; Oxford University Press: New York, NY, USA, 2014. [Google Scholar]
  11. Candel, J.J.L. Food security governance: A systematic literature review. Food Secur. 2014, 6, 585–601. [Google Scholar] [CrossRef]
  12. Yu, X.F.; Wang, M.T. Non-traditional security community: A new exploration of transnational security governance. Int. Secur. Res. 2017, 1, 5–6. [Google Scholar]
  13. Kornhera, L.; Kalkuhlb, M. The gains of coordination- When does regional cooperation for food security make sense. Glob. Food Secur. 2019, 22, 37–45. [Google Scholar] [CrossRef]
  14. WFP; DKPRI; DEPTANRI. A Food Security and Vulnerability Atlas of Indonesia. In Food Security Atlas; FAO: Rome, Italy, 2009. [Google Scholar]
  15. Jin, W.; Xu, L.; Yang, Z. Modeling a policy making framework for urban sustainability: Incorporating system dynamics into the Ecological Footprint. Ecol. Econ. 2009, 68, 2938–2949. [Google Scholar] [CrossRef]
  16. FAO. Committee on World Food Security Coming to Terms with Terminology: Food Security, Nutrition Security and Nutrition, Food and Nutrition Security; Food and Agriculture Organization: Rome, Italy, 2012. [Google Scholar]
  17. United Nations. Food. 2019. Available online: https://www.un.org/en/sections/issues-depth/food/index.html (accessed on 12 September 2019).
  18. Ozturk, I. Sustainability in the food-energy-water nexus: Evidence from BRICS (Brazil, the Russian Federation, India, China, and South Africa) countries. Energy 2015, 93, 999–1010. [Google Scholar] [CrossRef]
  19. Li, Z.H.M. Agricultural Development in BRICS Countries; China Agricultural Science and Technology Press: Beijing, China, 2017. [Google Scholar]
  20. Zhang, J.L. Evaluation and Analysis of BRICS Food Security Cooperation. Int. Secur. Res. 2018, 6, 107–129. [Google Scholar]
  21. Noort, M. Smart seeds for a sustainable future. Geospat. World 2014, 4, 78–85. [Google Scholar]
  22. Chaturvedi, S.; Saha, S.; Shaw, P. Trade in high technology products: Trends and policy imperatives for BRICS. Ris Discuss. Pap. 2016, 207, 45. [Google Scholar]
  23. Tulcheev, V.; Zhevora, S.; Gordiyenko, N. The prospects of development of a potato production sub complex of agrarian and industrial complex of the Russian Federation in the conditions of the common agrarian market of the CIS countries and BRICS. Ekonomika Upravlenie 2018, 7, 48–57. [Google Scholar]
  24. Danish Baloch, M.A.; Mahmood, N.; Zhang, J.W. Effect of natural resources, renewable energy and economic development on CO2 emissions in BRICS countries. Sci. Total Environ. 2019, 678, 632–638. [Google Scholar] [CrossRef]
  25. Balsalobre-Lorente, D.; Driha, O.M.; Bekun, F.V.; Osundina, O.A. Do agricultural activities induce carbon emissions? The BRICS experience. Environ. Sci. Pollut. Res. 2019, 26, 25218–25234. [Google Scholar] [CrossRef]
  26. Liu, H.G.; Wang, J.Y.; Chen, Y.Y. Effects of the BRICS FTA on Their Agricultural Production and Trade. Issues Agric. Econ. 2015, 12, 87–95. [Google Scholar]
  27. Yin, W.J.; Fan, Y.M. Trade characteristics of agricultural products between China and other BRICS countries: Competitiveness and complementarity. World Agric. 2016, 5, 97–109. [Google Scholar]
  28. Zhao, P.R.; Mu, Y.Y. Agricultural products trade between China and other BRICS countries and its potential. Agric. Outlook 2018, 7, 75–82. [Google Scholar]
  29. Gusarova, S. Role of China in the development of trade and FDI cooperation with BRICS countries. China Econ. Rev. 2019, 57, 101271. [Google Scholar] [CrossRef]
  30. FAO. Food Balance Sheets: A Handbook; FAO: Rome, Italy, 2001. [Google Scholar]
  31. Chen, Y.; Lu, C. A Comparative Analysis on Food Security in Bangladesh, India and Myanmar. Sustainability 2018, 10, 405. [Google Scholar] [CrossRef] [Green Version]
  32. Ferjani, A.; Mann, S.; Zimmermann, A. An evaluation of Swiss agriculture’s contribution to food security with decision support system for food security strategy. Br. Food J. 2018, 120, 2116–2128. [Google Scholar] [CrossRef]
  33. Balassa, B. Trade Liberalization and Revealed Comparative Advantage. Manch. Sch. Econ. Soc. Stud. 1965, 33, 99–123. [Google Scholar] [CrossRef]
  34. Hoen, A.R.; Oosterhaven, J. On the measurement of comparative advantage. Ann. Reg. Sci. 2006, 40, 677–691. [Google Scholar] [CrossRef] [Green Version]
  35. Tinbergen, J. Analysis of World Trade Flows; Twentieth Century Fund: New York, NY, USA, 1962; pp. 21–25. [Google Scholar]
  36. Poyhonen, P.A. Tentative Model for the Flows of Trade between Countries. Econ. Financ. Arch. 1963, 90, 93–100. [Google Scholar]
  37. Kabira, M.; Salimb, R.; Al-Mawalic, N. The gravity model and tradeflows: Recent developments in econometric modeling and empirical evidence. Econ. Anal. Policy 2017, 56, 60–71. [Google Scholar] [CrossRef]
  38. Meeusen, W.; Vand, B. Efficiency estimation from Cobb—Douglas production functions with composed error. Int. Econ. Rev. 1977, 18, 435–444. [Google Scholar] [CrossRef]
  39. Aigner, D.J.; Lovell, C.A.K.; Schmidt, P. Formulation and estimation of stochastic Frontier production function models. J. Econom. 1977, 6, 21–37. [Google Scholar] [CrossRef]
  40. Ravishankar, G.; Stack, M.M. The gravity model and trade efficiency: A stochastic frontier analysis of eastern european countries’ potential trade. World Econ. 2014, 37, 690–704. [Google Scholar] [CrossRef] [Green Version]
  41. Cedrins, R. Regional agricultural cooperation in the Baltic Sea region: Experiences and future potential—The Western perspective. AMBIO 1997, 26, 469–472. [Google Scholar]
  42. Zanella, M.A.; Milhorance, C. Cerrado meets savannah, family farmers meet peasants: The political economy of Brazil’s agricultural cooperation with Mozambique. Food Policy 2016, 58, 70–81. [Google Scholar] [CrossRef]
  43. Wang, H.M.; Zhai, X.L. Potential of agricultural cooperation between China and the five Central Asian countries. Rev. Econ. Res. 2017, 31, 43–51. [Google Scholar]
  44. Cozman, F.G. Irrelevance and Independence Axioms in Quasi-Bayesian Theory. In Proceedings of the European Conference on Symbolic and Quantitative Approaches to Reasoning and Uncertainty, London, UK, 5–9 July 1999. [Google Scholar]
  45. Ullman, E.L. American Commodity Flow; University of Washington Press: Seattle, WA, USA, 1957; pp. 60–73. [Google Scholar]
  46. De, P. Global Economic and Financial Crisis: India’s Trade Potential and Prospects, and Implications for Asian Regional Integration. J. Econ. Integr. 2010, 25, 32–68. [Google Scholar] [CrossRef] [Green Version]
  47. Erokhin, V.; Gao, T. Competitive Advantages of China’s Agricultural Exports in the Outward-Looking Belt and Road Initiative. China’s Belt Road Initiat. 2018, 5, 265–268. [Google Scholar]
  48. Chandran, S. Trade Complementarity and Similarity between India and ASEAN Countries in the Context of the RTA; MPRA Paper; University Library of Munich: Munich, Germany, 2010. [Google Scholar]
  49. Zhao, C. Impact of sino-south korean diplomatic relations on trade and economic relations in Northeast Asia. Chin. Econ. 1994, 27, 61–70. [Google Scholar]
  50. Harrison, J. The European Union and South Korea: The Legal Framework for Strengthening Trade, Economic and Political Relations; Edinburgh University Press: Edinburgh, UK, 2013. [Google Scholar]
  51. Li, H.; Yu, Y. Research on the evaluation of expert scoring method in the competitiveness of high colleges and universities of Jiangxi province. In Proceedings of the 6th International Conference on Information Management, Innovation Management and Industrial Engineering (ICIII), Xi’an, China, 23–24 November 2013. [Google Scholar]
  52. Mitiku, T.N. A Framework for a Pro-Growth, Pro-Poor Transport Strategy; Sub-Saharan Africa Transport Policy Programme; The International Bank for Reconstruction and Development/The World Bank: Washington DC, USA, 2009; p. 89. [Google Scholar]
  53. Bonsu, D. Road Transport and Agriculture: A Comparative Study of the Implications of Road Access for Subsistence Agriculture in the Northern Ghana; The University of Bergen: Bergen, Norway, 2014. [Google Scholar]
  54. FAO. The State of Food Insecurity in the World: Addressing Food Insecurity in Protracted Crises; FAO: Rome, Italy, 2010. [Google Scholar]
  55. Mary, S. Hungry for free trade? Food trade and extreme hunger in developing countries. Food Secur. 2019, 11, 461–477. [Google Scholar] [CrossRef]
  56. Armstrong, J.S.; Collopy, F. Error measures for generalizations about forecasting methods: Empirical comparisons with discussion. Int. J. Forecast. 1992, 8, 69–80. [Google Scholar] [CrossRef] [Green Version]
  57. Valeriy, Z. Types of Moving Averages; New Developments in Quantitative Trading and Investment Book Series (QTAM); Springer Nature: Berlin, Germany, 2017. [Google Scholar]
  58. Godfray, H.C.J.; Beddington, J.R.; Crute, I.R.; Haddad, L.; Lawrence, D.; Muir, J.F.; Pretty, J.; Robinson, S.; Thomas, S.M.; Toulmin, C. Food Security: The Challenge of Feeding 9 Billion People. Science 2010, 327, 812–818. [Google Scholar] [CrossRef] [Green Version]
  59. Strashnaya, A.; Maksimenkova, T.; Chub, O. Grain Yield Prediction in the Russian Federation: Use of Satellite and In-Situ Data to Improve Sustainability; Springer: Berlin/Heidelberg, Germany, 2011. [Google Scholar]
  60. United Nations. World Population Outlook. 2019. Available online: https://www.un.org/ecosoc/en/documents/publications?page=1 (accessed on 15 November 2019).
Figure 1. Agriculture products and food trade volume in BRICS countries from 2010 to 2018. Data Source: The authors arranged according to the basic data of UN Comtrade Database.
Sustainability 12 02125 g001
Figure 2. Comparison of food trade structure within BRICS in 2010 and 2018. Data Source: The authors arranged according to the basic data of UN Comtrade Database.
Sustainability 12 02125 g002
Figure 3. Food self-sufficiency rate of the BRICS countries from 2000 to 2013.
Sustainability 12 02125 g003
Table 1. Food self-sufficiency rate in the BRICS countries from 2000 to 2030.
Country and Region200020102013201820252030
Brazil104.13%107.94%110.67%109.11%108.90%108.91%
Russia92.89%87.14%99.82%98.62%98.48%98.48%
India100.53%100.44%102.31%101.79%101.77%101.77%
China95.68%95.47%93.93%94.58%94.65%94.65%
South Africa106.52%104.24%103.28%102.70%102.53%102.54%
The BRICS Countries98.57%99.37%100.26%100.05%100.03%100.03%
Note: The calculation from 2000 to 2013 is in accordance with the data of Food Balance Sheets in FAOSTAT, with estimated value from 2014 to 2018 and predicted value from 2025 to 2030 by the moving average method.
Table 2. Self-sufficiency rates of different types of food in the BRICS countries from 2000 to 2030.
YearFoodCerealOilFruitVegetableSugar MeatEggsMilkAquatic Products
200098.57%103.40%90.94%108.04%100.41%100.00%99.15%100.02%101.16%91.51%
201099.37%111.20%73.58%101.86%101.30%100.00%102.63%100.30%98.26%99.86%
2013100.26%114.86%72.46%103.62%101.38%99.77%102.41%100.09%93.28%98.21%
2018100.05%113.92%73.44%102.80%101.38%99.97%102.37%100.18%95.78%98.47%
2025100.03%113.83%73.52%102.69%101.38%100.00%102.36%100.19%96.06%98.52%
2030100.03%113.83%73.51%102.69%101.38%100.00%102.36%100.19%96.06%98.52%
Note: Calculated according to the data of Food Balance Sheets in FAOSTAT from 2000 to 2013, estimated value from 2014 to 2018, and predicted value from 2025 to 2030 by the moving average method.
Table 3. Comparison of food development resources and modernization level of the BRICS countries in 2016.
Comparison ItemsBrazil RussiaIndiaChinaSouth Africa
Land area per capita (hectare/person)4.0511.350.220.682.16
Per capita agricultural land area (hectare/person)1.381.510.140.381.72
Per capita irrigated agricultural land area (hectare/person)0.020.030.050.040.03
Average labor cultivated area (hectare/person)0.781.610.310.150.59
Tractor usage (parts/thousand hectares)12.703.0019.9027.704.30
Harvester usage (table/thousand hectares)0.900.803.005.800.70
Fertilizer application rate (kg/ha)186.1018.46165.85503.3258.51
Adult literacy rate (%)92.0599.6869.3095.1294.37
Research and technical staff (/million people)134336205341177520
Human development index0.760.820.640.750.70
Informatization development index6.127.073.035.604.96
National innovation index33.4437.9035.1853.0635.13
Food production index137147144139117
Data sources: FAOSTAT, World Bank database, UNDP Human Development Report 2017, Information Society Development 2017 of the International Telecommunication Union, Global Innovation Index 2018, and the International Statistical Yearbook of the National Bureau of Statistics of the People’s Republic of China. Due to data restrictions, the figures of tractor usage and harvester usage are from 2008 according to the Foreign Economic Cooperation Center, Ministry of Agriculture and Rural Affairs, People’s Republic of China.
Table 4. Potential coefficients of BRICS food security cooperation.
CountryBrazil RussiaIndiaChinaSouth Africa
Brazil-0.014 0.017 0.083 0.067
Russia0.014 -0.044 0.184 0.006
India0.017 0.044 -0.026 0.051
China0.083 0.184 0.026 -0.000
South Africa0.067 0.006 0.051 0.015 -
Table 5. BRICS food security cooperation potential index for 2025 and 2030. Unit: US $ billion.
20252030
CountryBrazilRussiaIndiaChinaSouth AfricaBrazilRussiaIndiaChinaSouth Africa
Brazil-1.3362.75833.3555.607-1.3392.76133.3785.617
Russia1.336-6.67072.7920.2781.339-6.67872.8420.279
India2.7586.670-10.7467.3142.7616.678-10.7537.321
China33.35572.79210.746-5.96833.37872.84210.753-5.972
South Africa5.6070.2787.3145.968-5.6170.2797.3215.972-

