Article

Geomatics and Soft Computing Techniques for Infrastructural Monitoring

1
DICEAM—Civil, Energy, Environmental and Material, Engineering Department, Mediterranean University, 89124 Reggio Calabria, Italy
2
PAU—Heritage-Architecture-Urbanism, Mediterranean University, 89124 Reggio Calabria, Italy
*
Author to whom correspondence should be addressed.
Sustainability 2020, 12(4), 1606; https://doi.org/10.3390/su12041606
Submission received: 5 December 2019 / Revised: 5 February 2020 / Accepted: 11 February 2020 / Published: 21 February 2020
(This article belongs to the Special Issue Towards Sustainable Engineering: New Technologies and Methodologies)

Abstract

:
Structural Health Monitoring (SHM) allows us to have information about the structure under investigation and thus to create analytical models for the assessment of its state or structural behavior. Exceeded a predetermined danger threshold, the possibility of an early warning would allow us, on the one hand, to suspend risky activities and, on the other, to reduce maintenance costs. The system proposed in this paper represents an integration of multiple traditional systems that integrate data of a different nature (used in the preventive phase to define the various behavior scenarios on the structural model), and then reworking them through machine learning techniques, in order to obtain values to compare with limit thresholds. The risk level depends on several variables, specifically, the paper wants to evaluate the possibility of predicting the structure behavior monitoring only displacement data, transmitted through an experimental transmission control unit. In order to monitor and to make our cities more “sustainable”, the paper describes some tests on road infrastructure, in this contest through the combination of geomatics techniques and soft computing.

1. Introduction

Our society strongly depends on several complex and interdependent critical infrastructures. Due to technological development, these transport networks became sophisticated, complex, and essential for people, businesses, and municipalities. Indeed, any deficiencies (interruption or traffic calming) of the transport network functionality can cause serious consequences for people. The transport system is, therefore, necessary for the health and functionality of modern society, which depends on it not only for people’s day to day mobility and for freight transport, but also as a lifeline system for emergency management.
The transport infrastructure assets, both in terms of the existing network and infrastructural works, are so significant that the problem of its safety and preservation is surely a priority for our country.
The expected lifecycle cost of infrastructure is an important factor that should be estimated in the design and optimal management of infrastructure. In reference to economics, this cost is associated with several factors such as hazard, inherent vulnerability and exposed asset. The uncertainty of the expected lifecycle cost depends on the potentially dangerous events and the preservation of materials constituting the infrastructural works. The optimal strategy consists of minimizing the expected lifecycle cost, preserving infrastructure safety. In this context, the issues can be dealt with a multiscale approach: Analyzing a single infrastructural work (bridge, viaduct, gallery, and geotechnical system) or assessing and managing the risk of the whole network infrastructure [1,2].
Infrastructures in Italy are in a general state of need and dislike, mainly due to a near-total lack of central risk control and monitoring mechanism.
The tendency to “economize” at the initial design stage does not consider that the post-assessment costs caused by misjudgments are much higher when compared to the potential “savings” that would be obtained by preemptively adopting a methodology capable to assess the uncertainties in the round.
Smart cities is a reality, in which there is an optimized use of all the resources that contribute to guaranteeing, in various sectors and various fields, development and growth.
The smart cities definition introduces, alongside the concept of “smart”, also that of “sustainable”: A smart and sustainable city is an urban core which uses information and communication technologies (ICT) and other technological means to improve the quality of life, the efficiency of services, and urban activity, competitiveness, respecting the needs of present and future generations since economic, social, and environmental perspective. Therefore, not only a concentration of technologies but a complex ecosystem in which citizens, municipal authorities, local companies, industries in general in addition to the different communities and interest groups must actively participate. It should be pointed out that, in this perspective, the geographical limits of a smart city transcend the narrow urban boundaries and encompass metropolitan areas or even on a regional scale.
The infrastructure for communication and data transmission is certainly the skeleton that makes the system work.
There are two aspects that must characterize the sensor adapted to the complexity of the smart city. The first is, of course, the ability to accurately and accurately detect physical data. The second, no less important, is the ability to perform some computing functions directly, perhaps using artificial intelligence techniques. This becomes essential to generate information already properly interpreted and consequently decrease the immense volume of data that could otherwise grow to such levels that it becomes manageable only with significant costs and resources. To date, where the smart city is becoming more and more established as a reality, the proposed experimentation well fits in this contest through the combination of geomatics techniques and soft computing to monitor and to make more “sustainable” our cities.
Structural monitoring, also known as structural health monitoring (SHM), is one of the newest and most interesting fields of structural engineering study. It makes it possible, taking advantage of the continuous technological development of data collection and processing tools, to assess with increasing clarity the structural characteristics and level of damage of any work, allowing its predicting progress over time.
As known, various methods of remote sensing are used for application to structural health monitoring, including radio detection and ranging (RADAR), light detection and ranging (LiDAR), photogrammetry, multispectral satellite imagery, synthetic aperture radar (SAR), infrared thermography, and image analysis methods, including digital image correlation (DIC), ground-penetrating radar (GPR), and remote acoustics [3,4,5]. Vaghefi et al. (2012) and Harris et al. (2016) compared several of the previously listed methods to investigate bridge assessment and monitoring performance. Results indicated that the techniques worked most effectively when used in conjunction with one another [6], whereas specific groupings of sensing technologies were most efficient at the identification of defects in specific locations [7].
Viaduct performance has three types of movement components: Static, semistatic, and dynamic [8,9]. The static and semistatic structure movements are measured using robotic total stations, displacement sensors techniques [10,11]. The dynamic displacement can be obtained from accelerometer measurements by integrating the measured acceleration data [12,13,14,15,16,17].
As know, to date, there are several monitoring systems all based on: A sensor system—a data processing system, (which is the kite, transmission and data efficiency)—a system of assessment of the structure’s health, including analysis techniques and algorithms (that allow to outline specific assessments of the state of the structure on the basis of the measured data).
Monitoring the health of a structure means increasing its level of safety in its different stages of life, from implementation to culling. Implementing a monitoring system, for example, makes it possible for the relevant authorities to identify critical issues and categorize them. The creation of an archive, continuously updated with the data collected, finally allows to optimize the use of resources and improve the quality of interventions to be planned.
Structural monitoring is based on the interaction of sensing techniques and FE models.
Most of the civil works currently located throughout the country have not only reached the final stage of their useful life but are even stressed by stresses many times greater than those with which it was designed.
In addition, reinforced concrete, a material widely used in today’s construction technique, initially considered eternal in the past from a temporal point of view, increasingly manifests its shortcomings in terms of durability. It is precisely in a delicate scenario like this that the benefits and potential of continuous and efficient structural monitoring can be appreciated more over time.
The increasing spread of structural monitoring systems as a supervisory and inspection tool is often limited to little more than a collection of data whose interpretation is difficult to implement in practice.
In traditional monitoring systems:
-
Data is captured by instrumentation and stored;
-
It is checked that the acquired magnitudes are within set threshold values;
-
The monitoring report is limited to the values that physical quantities have had over time
-
The interpretation of the data is given to specialist advice;
-
There is no information on the consistency between expected and measured behavior of the structure;
-
Following exceptional events, specialist advice is needed to understand whether resistant behavior has changed significantly.
In this context, the monitoring system can be a burden on the institution in the face of little benefit.
To overcome these limitations, the activities that are being carried out are aimed at testing an innovative monitoring system, using and integrating precisely techniques and methodologies of Geomatics and Soft Computing (Figure 1).
To this end, we want to finalize the use of geomatics technologies (also supplemented by the use of sensors on site) to early warning issues, and on the other hand, through soft computing techniques, we want to introduce automations in the collection and processing predicting data.
The ultimate aim is to create a real-time risk predictive system that allows to simulate various scenarios and, therefore, various infrastructure behaviors under investigation, capable of alerting those in charge, in case of imminent hazards, through the use of the proposed system that integrates data of a different nature (preventive used to define the various behavior scenarios on the structural model), and then reworking them through machine learning techniques, in order to obtain values to compare with limit thresholds. The level of risk depends on several variables. Specifically, the note wants to evaluate the possibility of predicting the behavior of the structure using only displacement data during monitoring, transmitted through the help of an experimental transmission control unit.
More specifically, the proposed integrated system is based on the integration of multiple models: A 3D model detected by drone (geometric scenario 0), a structural model at instant 0 on which multiple boundary conditions are varied in order to simulate as many scenarios (scenario n). The results are implemented in a neural network and cause that the proposed system requires only displacements (static and dynamic) in input, to output the risk levels. A 3D model is a simple tool from which we can capture data.

2. Materials and Methods

With this objective in mind, an experimental test was carried out on the “Annunziata” viaduct in Reggio Calabria (south Italy), a viaduct in reinforced concrete (Figure 2), already used as a case study in the context of other geomatic research activities conducted by the Geomatics laboratory in the context of the segmentation of the dense cloud obtained from drone photogrammetry.

2.1. The 3D Reconstrucion

Structure from Motion (SFM) as applied in geoscience and survey is more than a single technique is a workflow employing multiple algorithms developed from traditional photogrammetry, survey techniques, and three-dimensional (3D) computer vision. The full workflow is known as Structure from Motion Multi-View Stereo (SFM-MVS) to account for the Multi-View stereo algorithms used in the final stages. Many commercial SFM-MVS software packages do not detail the specific procedure applied to solve the problem. The aim of this paragraph is to understand the basic concept for 3D reconstruction starting from uncalibrated imagery, for a deep understanding of mathematical formulas the interested reader can find relevant information on. The basic process to reconstruct the 3D scene geometry from a set of images where the extrinsic and intrinsic calibration parameters are unknown, could be divided into three main steps: (1) Image analysis for matches and estimation of unknown camera parameters, (2) application of Structure from Motion (SFM) algorithm and (3) Multi-View Stereo for 3D dense cloud generation [18,19]. The detailed workflow for 3D reconstruction is summarized as follows:
(1)
Image analysis and matches:
(i)
Detect image features on key point;
(ii)
Key point correspondence between different images;
(iii)
Identify geometrically consistent matches;
(2)
Structure from Motion:
(iv)
SFM of simultaneously estimating 3D scene geometry: Camera pose and internal camera parameters through bundle adjustment;
(v)
Scaling and georeferencing the resultant scene geometry;
(vi)
Optimizing the identified parameters in the bundle adjustment using know Ground Control Points (GCP);
(3)
Multi-View Stereo:
(vii)
Clustering image sets for efficient processing;
(viii)
Apply MVS algorithms
Different photogrammetry pieces of software are available, both open source and commercial, that use this process to reconstruct a 3D scene starting from uncalibrated images (Figure 3). It should be considered that while open source software generally offers the use of greater transparency, and the use of different algorithms can vary from different software packages, commercial software does not release information on algorithms used (that can be sometimes proprietary). Moreover, the continuous evolution of computer vision techniques, and development and refinement of algorithms in the different process steps suggest that further improvements will be implemented very quickly, reducing the memory consumption increasing elaboration speed and point cloud density and accuracy.

2.2. Structural Model

Generally, in the study of bridges and viaducts, it is possible to implement a simplified Finite Element Model (FEM) using one-dimensional elements (as beams, truss and rigid links) with properties equivalent to those of the real elements. However, such a simplification results in a considerable reduction in the computational burden and in the memory required for the analysis. Obviously, such a model can only provide some information on the overall behavior of the structure, useful in the preliminary design phase. To analyze in detail the most important elements of a structure, it will be necessary to use more complex modeling. The increase in discretization improves the accuracy of the final results but increases the computational burden, and therefore, the processing times. The comparison between the results obtained from the Finite Element (FE) modeling and the experimental ones are reported in Section 3.2.
Structural monitoring of existing works is an engineering practice that, from a theoretical point of view, rediscovers the roles played by the information used in the design phase. During the design of a construction, the (static or dynamic) actions are known and the structural model is possessed, this knowledge is combined to obtain the prediction of the structural response in the various conditions of interest (state of interest service limit and last limit status). Surveys and tests (in situ or in the laboratory) that provide the structural response to certain stresses are carried out in the monitoring of an existing work [20]. In this case then, we are aware of the response and actions, while what we want to determine is the model. It could be said that in the first case we handle a direct problem, while in the second case, we deal with the reverse problem.
The main objective of monitoring is, in fact, to create a final model that can be used for example to analyze the behavior as the applied loads change.
The main problem is to be able to combine the information known a priori (of monitoring) with those that are obtained experimentally during inspections and tests on materials [21,22,23]. The first model is built on the basis of design drawings and inevitably has errors, the main uncertainties of which are related to the following parameters: 1. Discretion, 2. Boundary conditions, 3. Materials characteristic parameters. The amplification of the error due to these uncertainties, is evaluable by comparing the values taken from the field tests, with those that can be derived from the model’s predictions.
One of the solutions proposed to solve this problem is to implement the so-called type model, through the integration of the geomatics surveys results and structural monitoring (Figure 4).
In this way, we obtained a final model, that allows us to analyze the structure’s behavior at applied loads changing, moreover allowing the train of a predictive behavior structural model.
To validate the goodness of the obtained final model we compared the stresses taken with those obtained during in situ tests.
To identify an anomaly, a comparison of two system states, called baseline cases and nonconforming cases (reference state and non-compliant state), must be performed directly from the point-time comparison of 3D models.
In this paper, a finite element (FE) 3D model of the viaduct (see Figure 5a) and a structural dynamic analysis aimed at identifying in detail the characteristics of concrete bridge was performed. The spans of the viaduct, built in the 70s, in concrete of class C20/25, with a cubic resistance characteristic of 25 MPa, have a length of 28 m. The scheme of its cross-section is shown in Figure 5b. Moreover, the FE model was validated through an output-only ambient vibration test described in [20,24].
Generally, a static load test is performed to verify the actual behavior of a structure, while a dynamic test is performed in order to validate the FE model for the structure. The identification of the dynamic parameters (modal frequencies, damping ratios, mode shapes, and modal participation factors) actually provides an assessment of the global response of a system. In addition, experimental techniques for the dynamic identification provide a significant contribution in connecting assumptions and the actual behavior of a structure. In the identifying structural dynamics analyses, techniques for experimental modal analysis (EMA) or, alternatively, operational modal analysis (OMA) can be used. Traditional EMA uses excitation inputs while OMA aims to identify the modal properties of a structure excited by environmental sources. Despite its usefulness, traditional EMA has some limitations, such as the following: (i) Artificial excitation is normally conducted in order to measure frequency response functions (FRFs), or impulse response functions (IRFs). FRF or IRF would be very difficult or even impossible to measure using field tests and/or assessing large structures. (ii) Traditional EMA is normally conducted in a lab environment. This is at odds with real operational conditions in place in many industrial applications. (iii) Lab environments are generally suitable for individual component testing, instead of complete systems verification. Furthermore, boundary conditions would need to be simulated. Therefore, the OMA technique (output only) is considered as the most suitable for important structures, such as bridges or viaducts, since evaluation can be performed without closing the viaduct to traffic. Therefore, model updating was used to minimize the ‘difference’ between FEA and reference test data. In the model updating, the procedure presented in [20] was performed.
The parameters chosen for model updating were [20,22,24]:
  • Young’s Modulus of concrete;
  • span length;
  • slab thickness.
Simultaneously, we decided to insert in the FE model the experimental elastic modules of the actual materials (steel and concrete).
Table 1 shows the comparison between experimental frequencies and numerical frequencies obtained by using a commercial program. In particular, the second column of Table 1 reports the experimental frequencies, while column 3 reports numerical frequencies after some iteration of the model updating procedure. It is easy to verify the effectiveness of the FE model.
The identification of the modal parameters of the viaduct was developed using the frequency domain decomposition.
Figure 6 shows the first three vibration modes of the viaduct, with the corresponding frequencies and periods. Figure 7 shows the static behavior of viaduct subject to vehicular loads.

2.3. Built Database

From the constructed three-dimensional model, geometric information (base, beams, cross) relating to our viaduct was automatically extrapolated, through an appropriate point cloud segmentation methodology (Table 2). An example of segmentation of the span is provided in Figure 8.

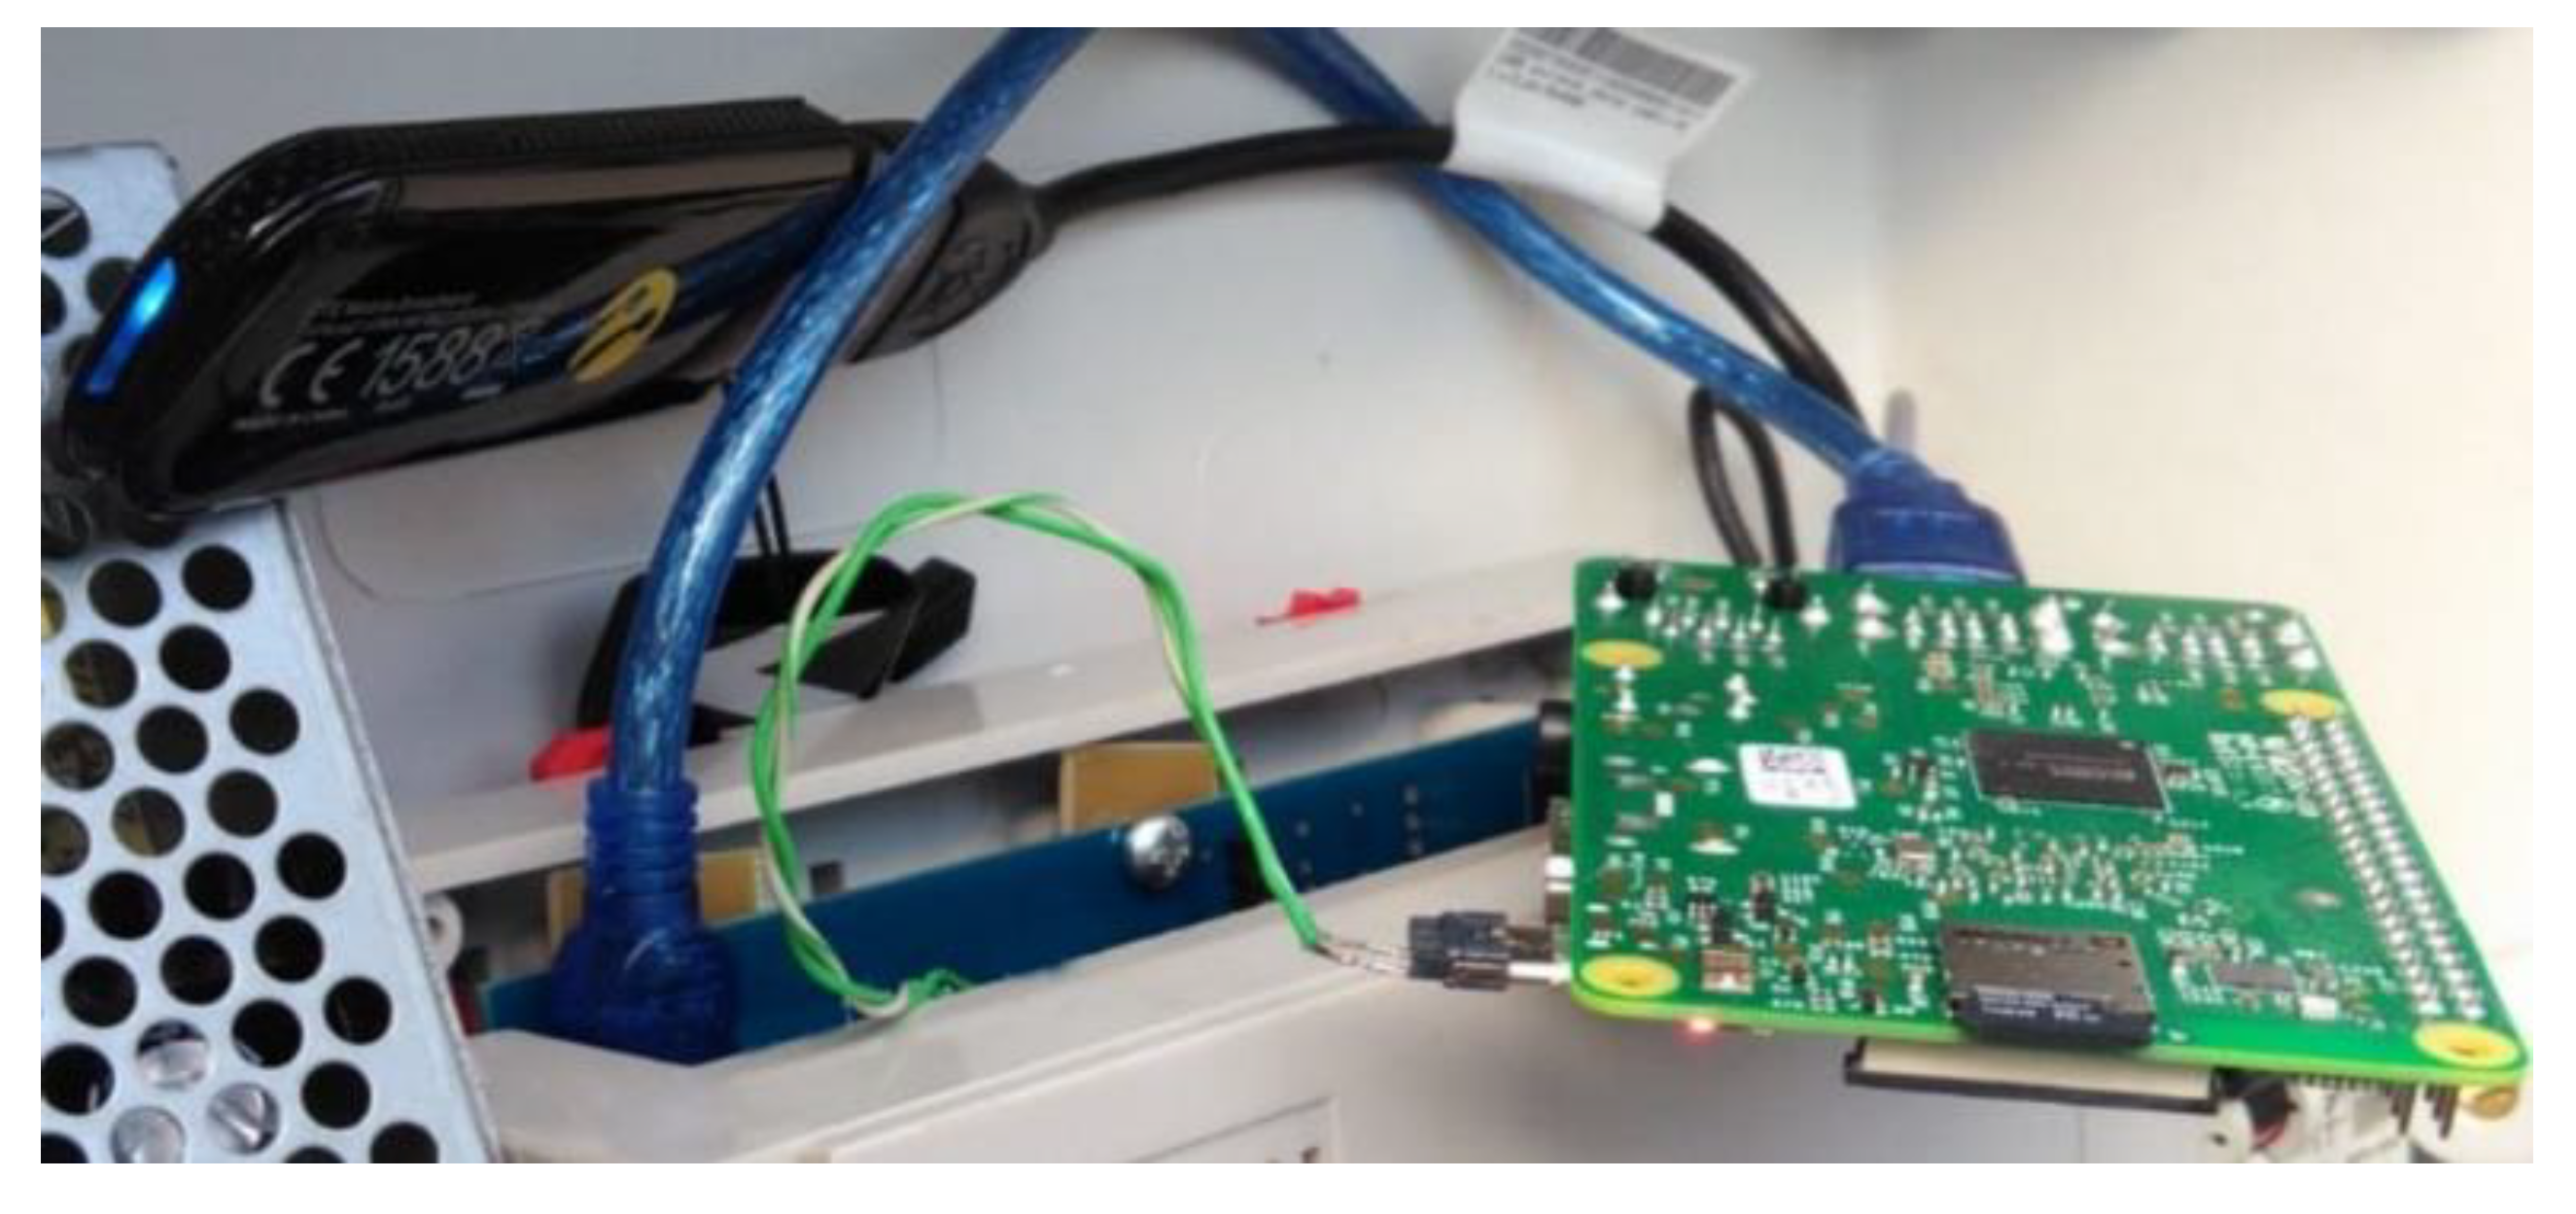
3. The Sensing System: Sensors

The sensory detection system is one of the most important elements of structural monitoring architecture. In order to be able to model analytically and numerically manage the structural behavior of an artifact, we made a sensors’ detections. Sensors were installed on pillars and beams, and they measured physical quantities, that in our case study are mainly translated into three types of parameters: 1. Load sources: Environmental (wind, seismic action)) or artificial (traffic), 2. Structural responses: Displacements, deformations, accelerations, and inclinations, 3. Environmental effects: Temperature, precipitation, humidity. Obviously, the accuracy and precision of predictions made through structural monitoring are inevitably related to the accuracy and precision of detection tools.
All these parameters were used to recreate boundary conditions in the various scenarios required for neural network training, neural network that is at the base of the predictive system [11].
For the real monitoring phase, the direct measure of the movements is of particular importance. It has been made through the two GPS (rover) receivers and one base station near the viaduct. The GPS observations are real-time kinematic (RTK) with differential GPS (DGPS) system. The receivers are LEICA-GMX902 antenna (24-channel L1/L2 code and phase, 20 Hz data rate, Smart Track technology for high precession, accuracy of 1 mm + 0.5 ppm (horz.), 2 mm + 1 ppm (ver.)) and the GPS data were preprocessed using the software LeicaSpider to improve and adjust the collected GPS data. The GPS receivers are linked via the internet to the Spider server. The raw data is streaming out from the receiver to the Spider server. The server generates RINEX-RTK corrections and they are streamed out via TCP/IP to the field. The GPS measurements were free of any obstructions of the horizon view and more than six satellites were tracked continuously. The coordinate components for each observation epoch were derived. The output of the two rovers was the time series of global coordinates of the installed receivers. Therefore, the coordinate’s data were converted to a local bridge coordinate system (BCS) for the analysis and evaluation procedures. In this coordinate system, x-axis is aligned with the traffic direction and z-axis gives the vertical direction of the viaduct.
To analyze the viaduct performance, the GPS observations were first filtered to denoise the time series of GPS receiver’s outputs after converting the coordinates into the local viaduct coordinate system [9,25,26]. Moreover, to estimate the semistatic movement of components of the pillars, the low-pass moving average (MA) filter (0.025 Hz) was applied to remove the dynamic and noise components from the data. The dynamic response can be extracted from the short period components by applying a bandpass filter (Figure 9).

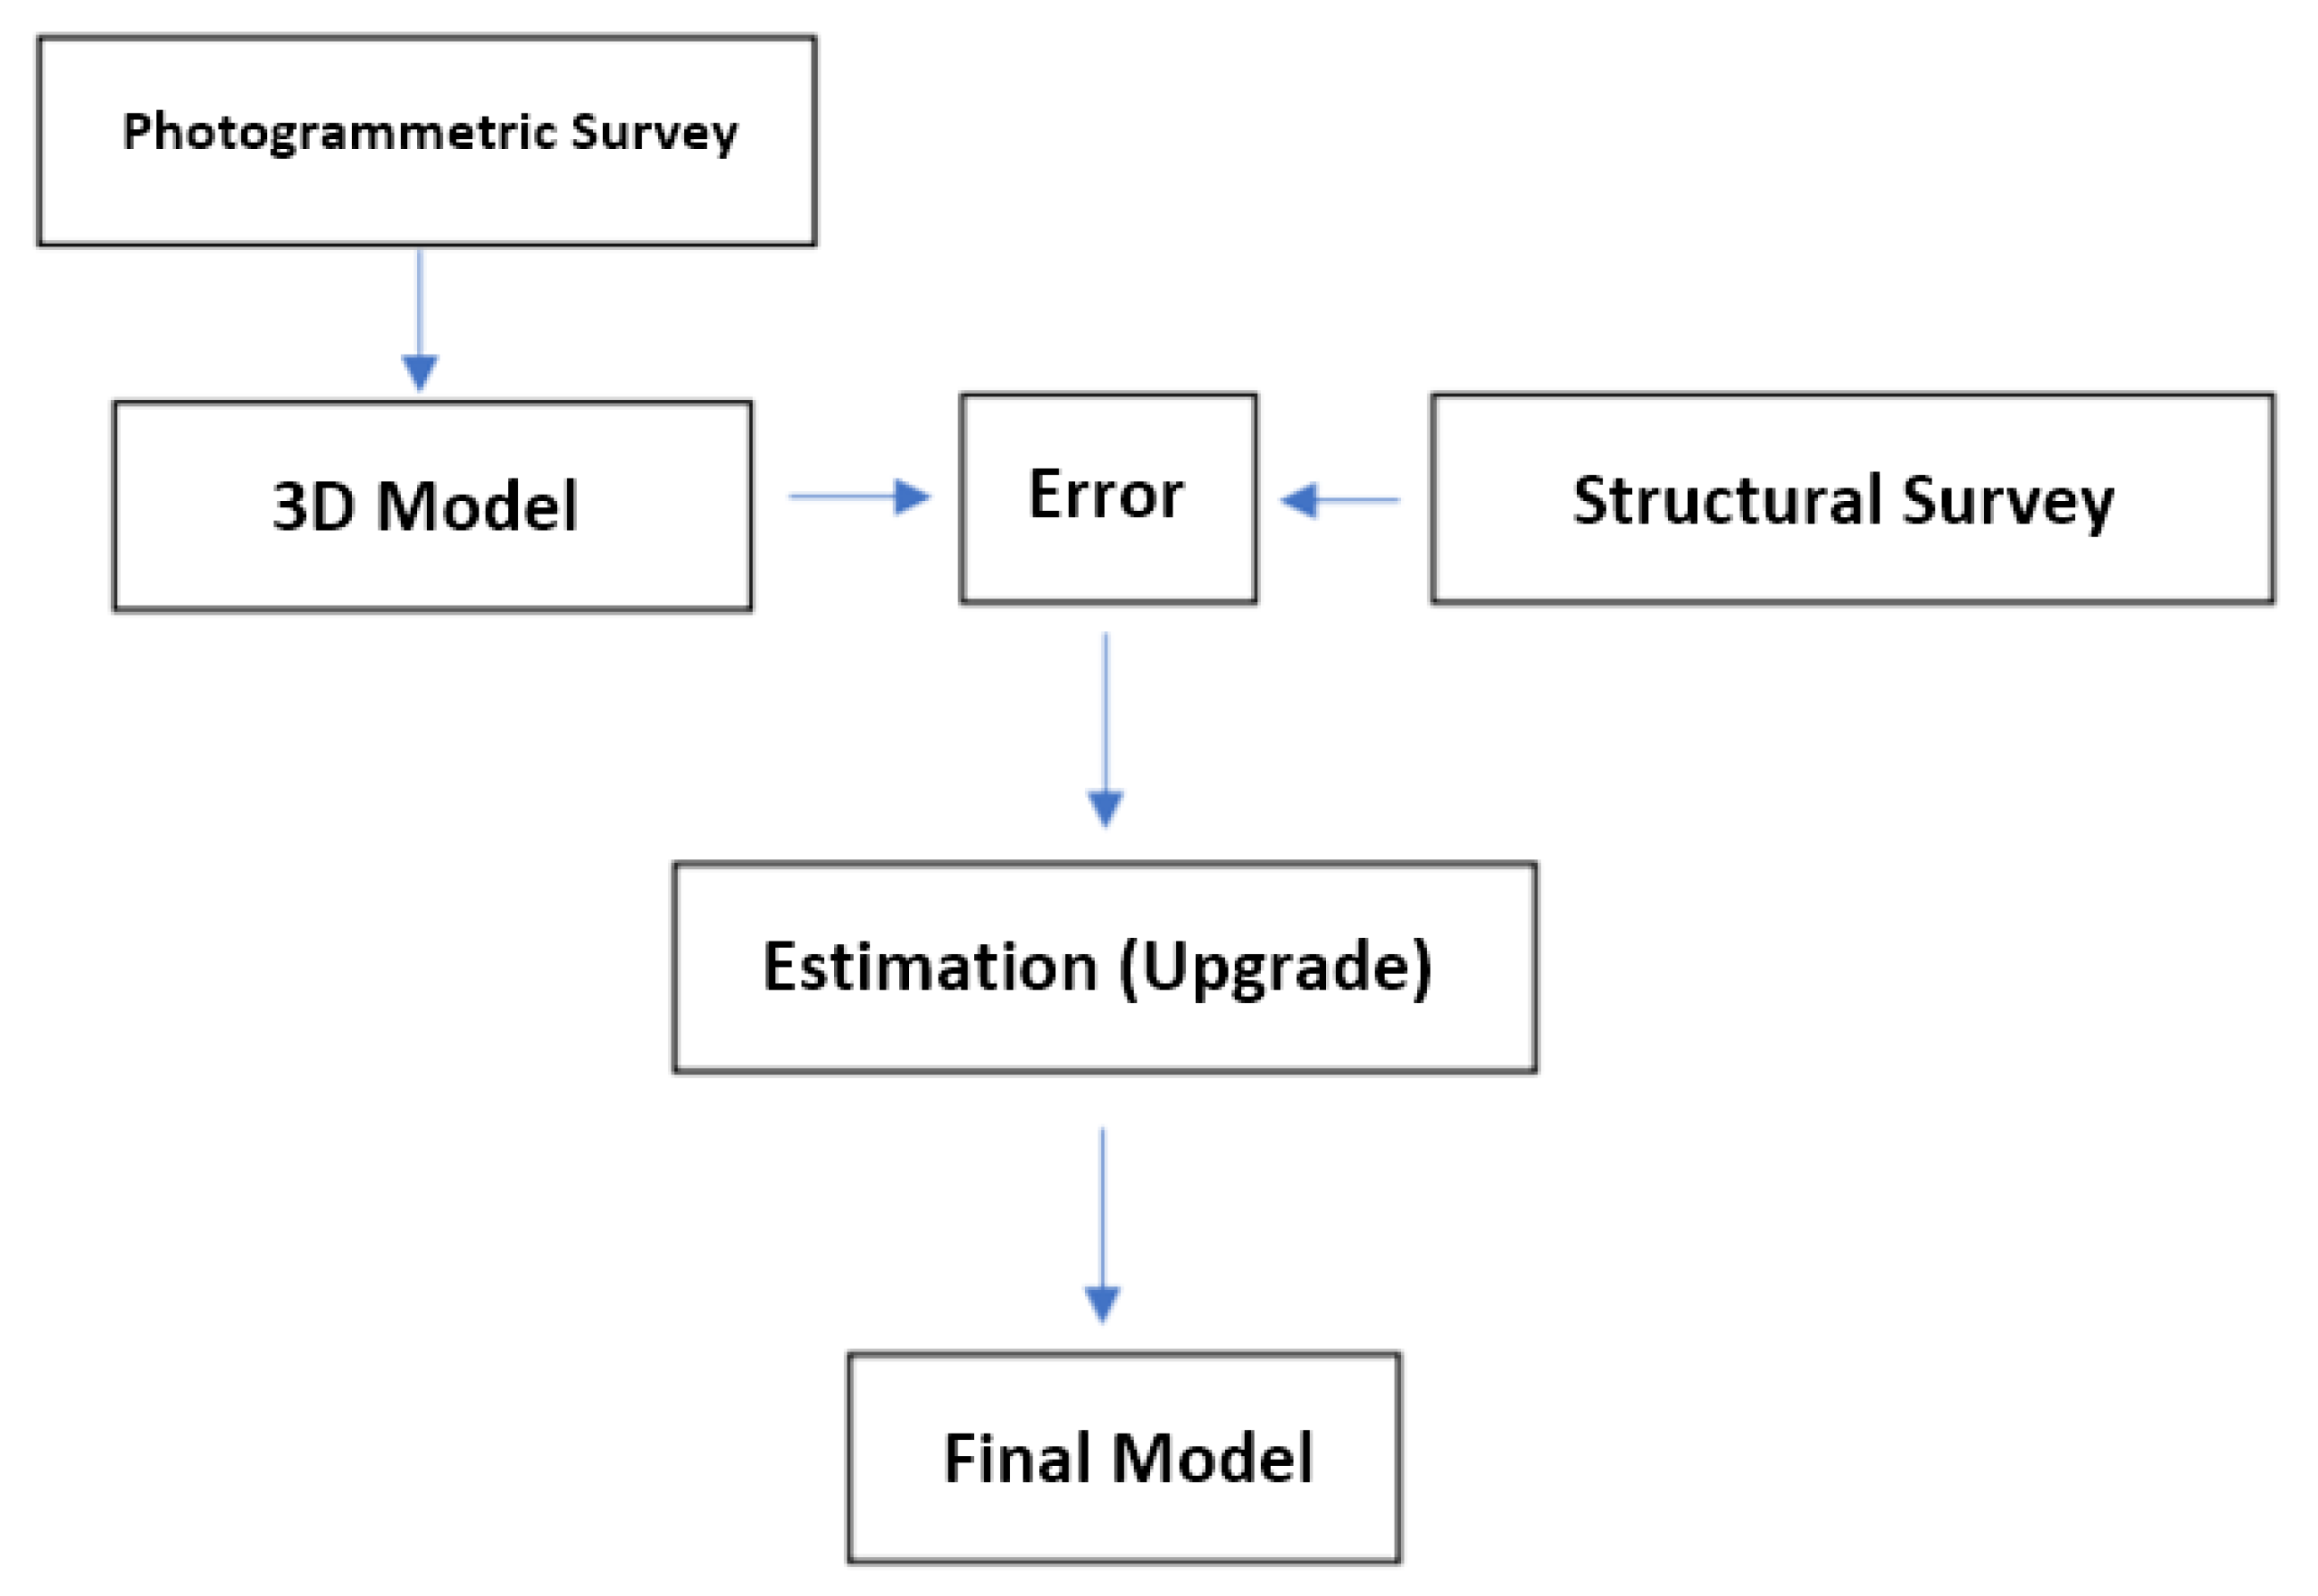
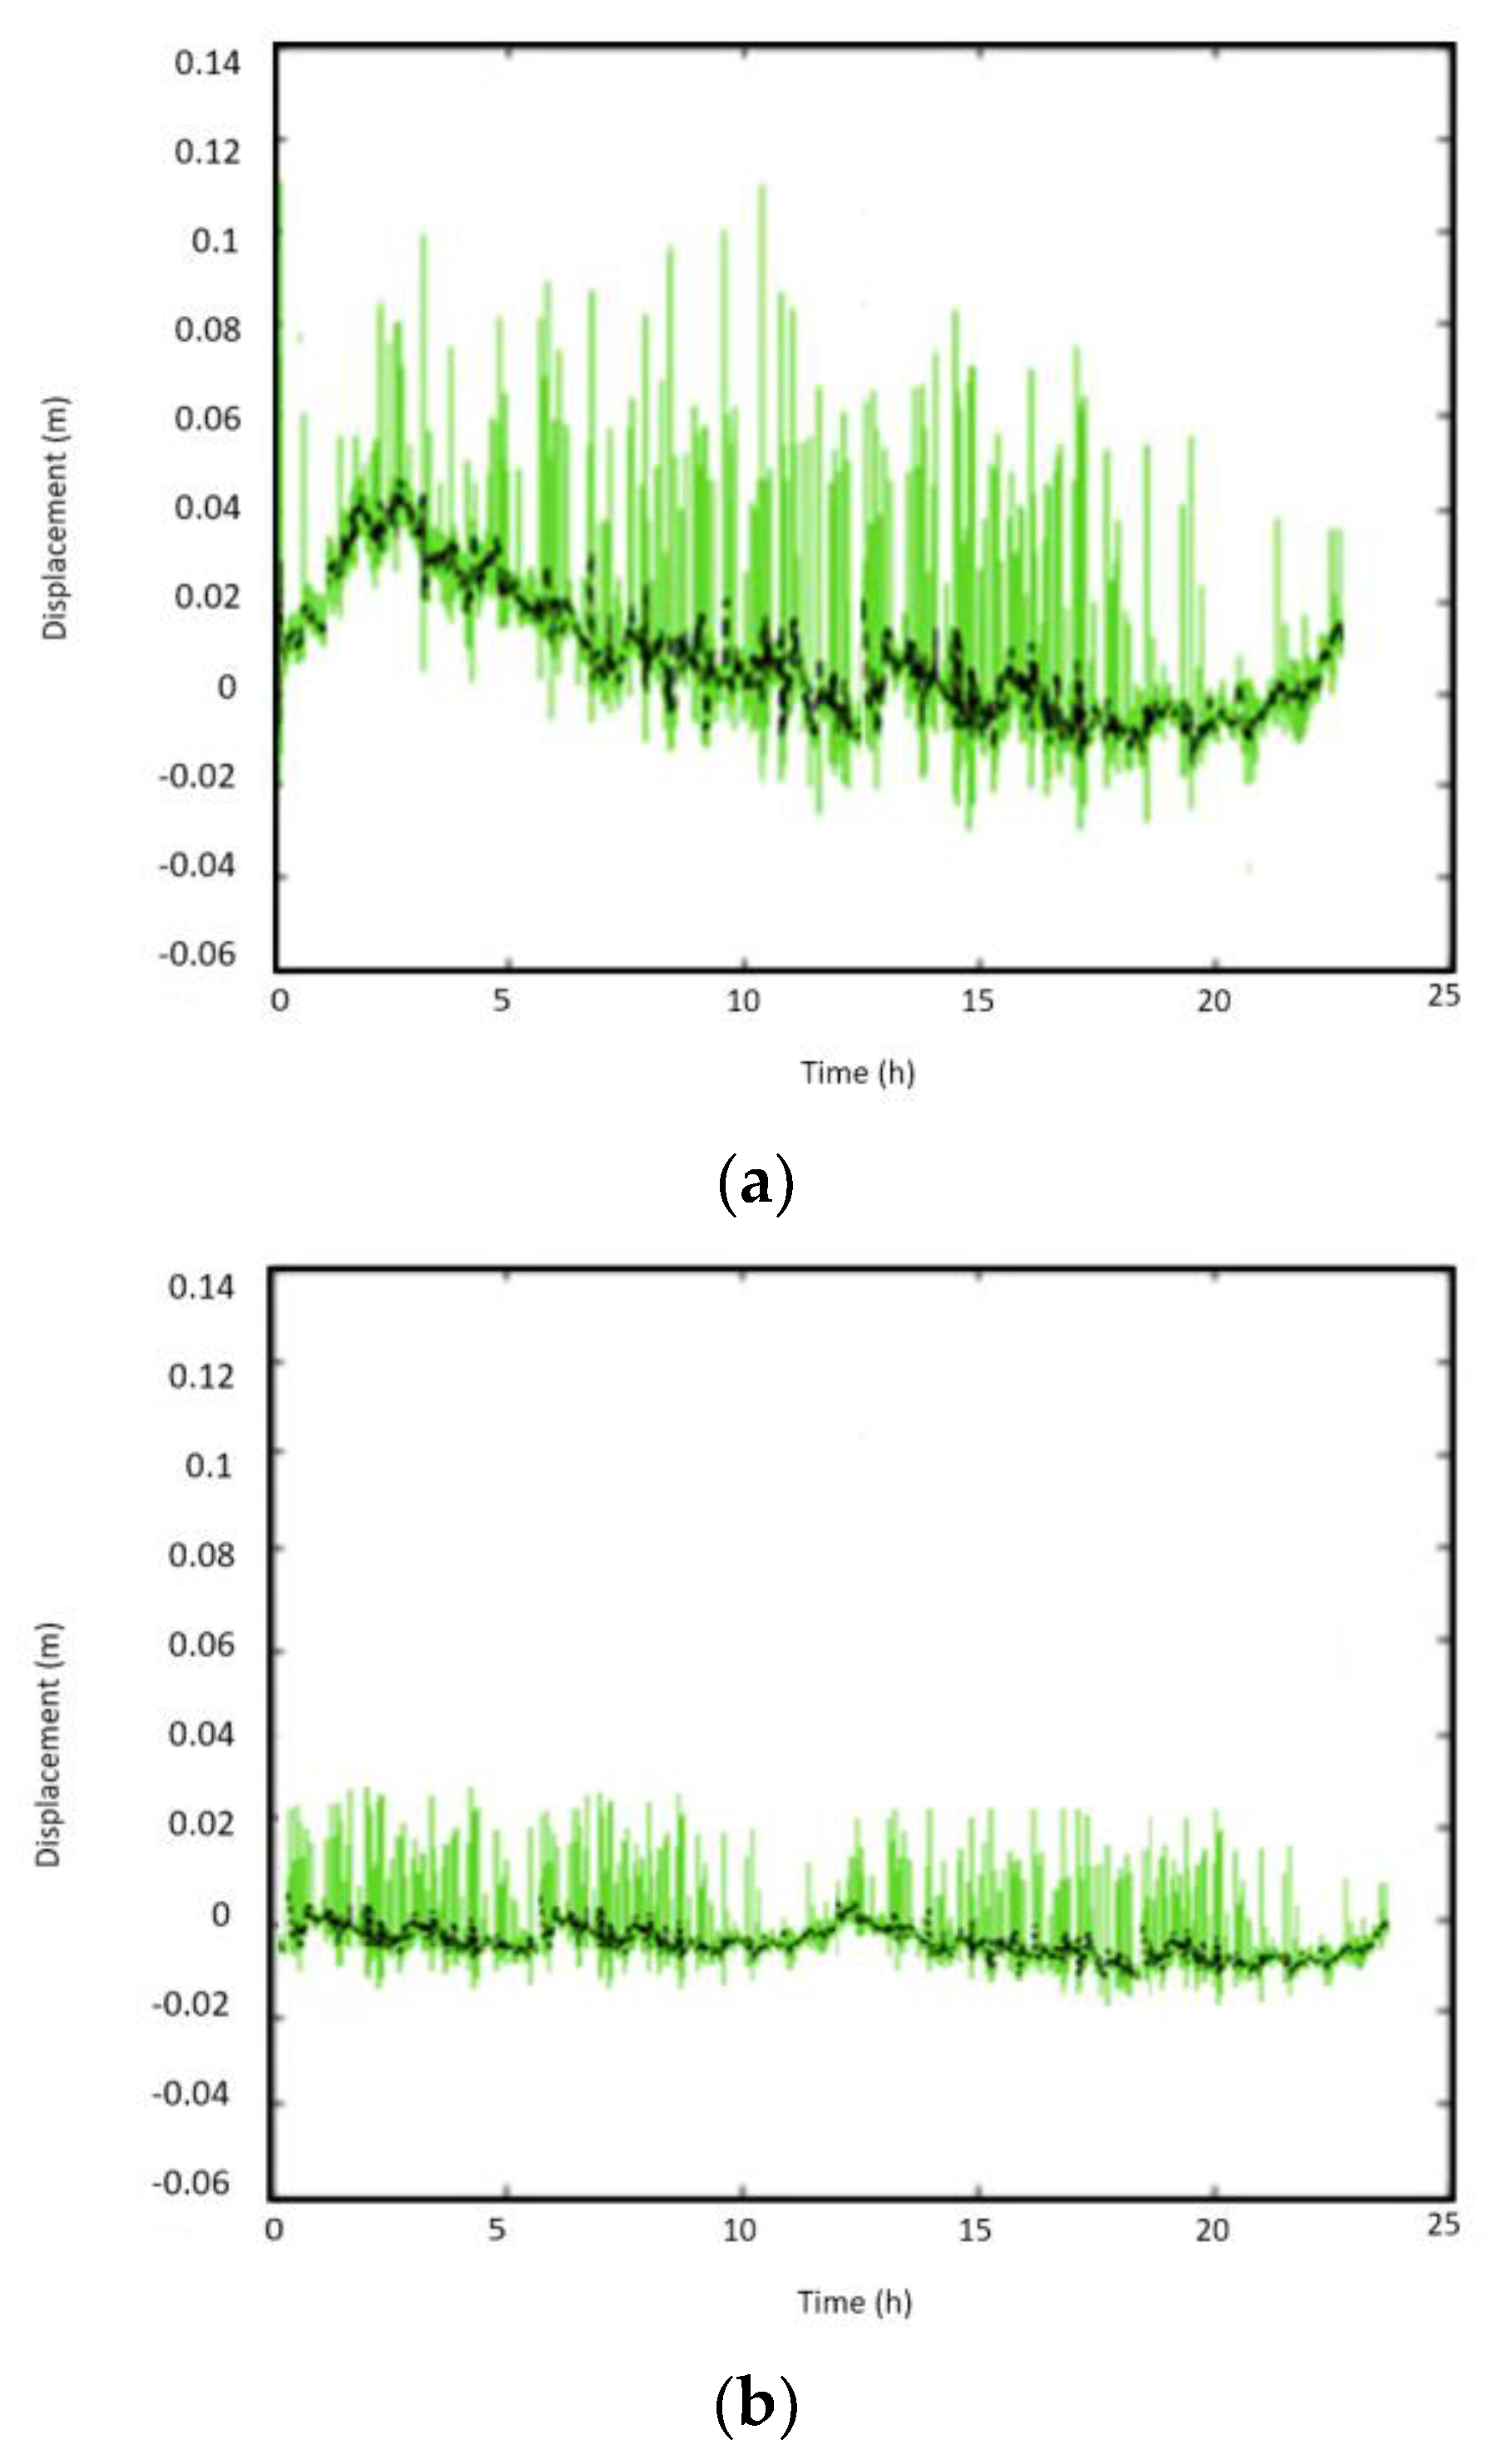
3.1. Comparison of Captured Data to Model Data

The sensor-captured data were compared (specifically, we report data acquired and calculated on the beam of the span 4) with data obtained from the model to verify the goodness of the model itself. The result attests good adaptability of the model to the real state with an average error of about 10% (see Table 3). Figure 10 shown the sensors’ positions.

3.2. The Predictive System

Therefore, we proceeded to the implementation of soft computing techniques, capable of providing an outbound forecast value related to the prediction of the loads, necessary to know in advance the behavior of the infrastructure.
In order to predict in advance the possible consumption of the system, it was thought to create a system that uses different soft computing techniques and neural network with the task of carrying out the first screening of the information components of the data base. The back-propagation algorithm was used due to its simplicity and its ability to extract useful information from examples. In fact, its ability to implicitly store information in the form of connection weights and its applicability to digitally or analogically evaluated models, the back-propagation algorithm manages to understand two phases: An early phase and a feedback phase. In the first feed-forward phase, input x (Load sources: Wind, seismic action, traffic. Structural responses: Displacements, deformations, accelerations, and inclinations. Environmental effects: Temperature, precipitation, humidity) are inserted and propagated through the multilayer network, to calculate the correct y output value for each output unit (displacement and risk level). The input variables related to environmental effects clearly, are variables that can be acquired from existing databases, as well as from daily weather forecasts. Traffic load conditions to date have been calculated through a statistics of traffic or average daily study, but work is being done to estimate this variable using a numerical counter based on an automatic or vehicle recognition system based on the Yolo neural network. The risk levels were experimentally established by the combination of loads of the different risk parameters on structural software.
The second back-propagation phase, on the other hand, involved a backward path through the network, during which the error signal was calculated and, between the desired output d and the obtained y and then propagated appropriately from the output layer to the input state, in order to update the values of the weights and bases, in fact, this error signal was carried back through all the layers of the network by simultaneously adjusting or modifying all the values of the connection between weights and bases, bringing in this way current output closest to the desired output. In particular, learning using the back-propagation algorithm takes place in the following steps: (1) Initialization of weights and bases, (2) presentation of desired input/exit pairs. At this stage, a vector with N input components was presented and the desired output vector was specified. This procedure was then repeated with the presentation of new input/output pairs for a number of iterations that depend on the shutdown condition which is typically defined based on the difference between total errors obtained in two successive iterations until obtaining the values of the weights and bases and then assigning them to the neural network (Figure 11).
The outgoing signal of the soft computing system was processed and sent, through communication channels, to a hardware system, which is responsible for recording the data to compare it with the previous ones and informing the operator of possible future developments.
The monitoring was realized by the design and subsequent implementation of an integrated software/hardware system, able to control the movements and deformations of the structure in real-time and to expect them to be at least one month. The integrated system was designed in EasyEDA® environment. The board was properly designed and integrated with components needed for data processing. Data taken in real-time and data processed using soft-computing techniques were transmitted with 4G LTE internet key to the monitoring platform. The platform was implemented in the WordPress® environment. At the same time, in order to prevent the disadvantages inherent in programming in WordPress®, SSL security protocols were integrated, which provided a fundamental level of online security, essential when transmitting sensitive information.
The final prototype produced (Figure 12) consists of a capture and processing board that receives incoming displacement signals, such signals picked up by appropriate sensors are managed by a system intelligent System On Module (SOM) or an independent electronic device capable of managing a Linux operating system and able to carry out numerical processes, even complex. The captured signals are then sent to a database that stores them and makes them available for management from an online platform.

4. Conclusions

From the experimental survey carried out, some conclusions can be drawn. The control system (still in development phase) can be used both for monitoring existing structures and as a control system in newly built buildings and bridges. In addition, the reliability of the measurements is perfectly in line with that obtained through traditional systems with the advantage of the enormous versatility of application. Therefore, the use of the monitoring system can be an effective tool for operators in the sector, in order to assess the static and dynamic consistency of existing infrastructures and also provide a powerful means of control during the useful life of new constructions.

Author Contributions

The authors contributed equally to this work. All authors have read and agreed to the published version of the manuscript.

Funding

This research received no external funding.

Conflicts of Interest

The authors declare no conflict of interest.

References

  1. Leonardi, G.; Palamara, R.; Cirianni, F. Landslide Susceptibility Mapping Using a Fuzzy Approach. Procedia Eng. 2016, 161, 380–387. [Google Scholar] [CrossRef]
  2. Barilla, D.; Leonardi, G.; Puglisi, A. Risk assessment for hazardous materials transportation. Appl. Math. Sci. 2019, 3, 2295–2309. [Google Scholar]
  3. Chen, S.-E.; Liu, W.; Dai, K.; Bian, H.; Hauser, E. Remote sensing for bridge monitoring. In Condition, Reliability, and Resilience Assessment of Tunnels and Bridges; Geotechnical Special Publication: Reston, VA, USA, 2011; Volume 214, pp. 118–125. [Google Scholar]
  4. Fukuda, Y.; Feng, M.Q.; Narita, Y.; Kaneko, S.; Tanaka, T. Vision-based displacement sensor for monitoring dynamic response using robust object search algorithm. IEEE Sens. J. 2013, 13, 4725–4732. [Google Scholar] [CrossRef] [Green Version]
  5. Gentile, C.; Cabboi, A. Vibration-based structural health monitoring of stay cables by microwave remote sensing. Smart Struct. Syst. 2015, 16, 263–280. [Google Scholar] [CrossRef]
  6. Harris, D.K.; Brooks, C.N.; Ahlborn, T.M. Synthesis of field performance of remote sensing strategies for condition assessment of inservice bridges in Michigan. J. Perform. Constr. Facil. 2016, 30, 04016027. [Google Scholar] [CrossRef]
  7. Vaghefi, K.; Oats, R.C.; Harris, D.K.; Ahlborn, T.M.; Brooks, C.N.; Endsley, K.A.; Roussi, C.; Shuchman, R.; Burns, J.W.; Dobson, R. Evaluation of commercially available remote sensors for highway bridge condition assessment. J. Bridge Eng. 2012, 17, 886–895. [Google Scholar] [CrossRef]
  8. Nakamura, S.-I. GPS measurement of wind-induced suspension bridge girder displacements. J. Struct. Eng. 2000, 126, 1413–1419. [Google Scholar] [CrossRef]
  9. Moschas, F.; Stiros, S. Measurement of the dynamic displacements and of the modal frequencies of a short-span pedestrian bridge using GPS and an accelerometer. Eng. Struct. 2011, 33, 10–17. [Google Scholar] [CrossRef]
  10. Gikas, V. Ambient vibration monitoring of slender structures by microwave interferometer remote sensing. J. Appl. Geod. 2012, 6, 167–176. [Google Scholar] [CrossRef]
  11. Kaloop, M.R.; Li, H. Multi input-single output models identification of tower bridge movements using GPS monitoring system. Measurement 2014, 47, 531–539. [Google Scholar] [CrossRef]
  12. Elnabwy, M.T.; Kaloop, M.R.; Elbeltagi, E. Talkha steel highway bridge monitoring and movement identification using RTK-GPS technique. Measurement 2013, 46, 4282–4292. [Google Scholar] [CrossRef]
  13. Voutetaki, M.E.; Papadopoulos, N.A.; Angeli, G.M.; Providakis, C.P. Investigation of a new experimental method for damage assessment of RC beams failing in shear using piezoelectric transducers. Eng. Struct. 2016, 114, 226–240. [Google Scholar] [CrossRef]
  14. Karayannis, C.G.; Voutetaki, M.E.; Chalioris, C.E.; Providakis, C.P.; Angeli, G.M. Detection of flexural damage stages for RC beams using Piezoelectric sensors (PZT). Smart Struct. Syst. 2015, 15, 997–1018. [Google Scholar] [CrossRef]
  15. Chen, Y.; Xue, X. Advances in the structural health monitoring of bridges using piezoelectric transducers. Sensors 2018, 18, 4312. [Google Scholar] [CrossRef] [PubMed] [Green Version]
  16. Liao, W.I.; Hsiao, F.P.; Chiu, C.K.; Ho, C.E. Structural health monitoring and interface damage detection for infill reinforced concrete walls in seismic retrofit of reinforced concrete frames using piezoceramic-based transducers under the cyclic loading. Appl. Sci. 2019, 9, 312. [Google Scholar] [CrossRef] [Green Version]
  17. Chalioris, C.E.; Papadopoulos, N.A.; Angeli, G.M.; Karayannis, C.G.; Liolios, A.A.; Providakis, C.P. Damage evaluation in shear-critical reinforced concrete beam using piezoelectric transducers as smart aggregates. Open Eng. 2015, 5, 373–384. [Google Scholar] [CrossRef]
  18. Barrile, V.; Candela, G.; Fotia, A. Point cloud segmentation using image processing techniques for structural analysis. ISPRS Ann. Photogramm. Remote Sens. Spat. Inf. Sci. 2019, 187–193. [Google Scholar] [CrossRef] [Green Version]
  19. Barrile, V.; Candela, G.; Fotia, A.; Bernardo, E. UAV Survey of Bridges and Viaduct: Workflow and Application. In Lecture Notes in Computer Science (Including Subseries Lecture Notes in Artificial Intelligence and Lecture Notes in Bioinformatics); Springer: Cham, Switzerland, 2019; pp. 195–199. [Google Scholar]
  20. Pucinotti, R.; Fiordaliso, G. Multi-Span Steel–Concrete Bridges with Anti-Seismic Devices: A Case Study. Front. Built Environ. 2019, 72, 1–15. [Google Scholar] [CrossRef]
  21. Cristofaro, M.T.; Pucinotti, R.; Tanganelli, M.; De Stefano, M. The dispersion of concrete compressive strength of existing buildings. Geotech. Geol. Earthq. Eng. 2015, 33, 275–285. [Google Scholar]
  22. Pucinotti, R. Reinforced concrete structure: Non destructive in situ strength assessment of concrete. Constr. Build. Mater. 2015, 75, 331–341. [Google Scholar] [CrossRef]
  23. Pucinotti, R. Assessment of in situ characteristic concrete strength. Constr. Build. Mater. 2013, 44, 63–73. [Google Scholar] [CrossRef]
  24. Bursi, O.S.; Bonelli, A.; Mammino, A.; Pucinotti, R.; Tondini, N. External post-tensioning retrofitting and modelling of steel–concrete boxgirder bridges. In Proceedings of the 7th International Conference on Steel Bridges, Guimaraes, Portugal, 4–6 June 2008; pp. 425–434. [Google Scholar]
  25. Moschasa, F.; Stiros, S. Noise characteristics of short-duration, high frequency GPS-records Advanced Mathematical and Computational Tools in Metrology and Testing. Ser. Adv. Math. Appl. Sci. 2012, 84, 284–291. [Google Scholar]
  26. Psimoulis, P.A.; Stiros, S.C. A supervised learning computer-based algorithm to derive the amplitude of oscillations of structures using noisy GPS and robotic theodolites (RTS) records. Comput. Struct. 2012, 92–93, 337–348. [Google Scholar] [CrossRef]
Figure 1. Flowchart working methodology.
Sustainability 12 01606 g001
Figure 2. Annunziata Viaduct.
Sustainability 12 01606 g002
Figure 3. 3D model of Annunziata Viaduct.
Sustainability 12 01606 g003
Figure 4. Flow chart integration of 3D model and structural survey.
Sustainability 12 01606 g004
Figure 5. (a) Scheme of cross-section and (b) FE model of the viaduct.
Sustainability 12 01606 g005
Figure 6. FE model of viaduct (a) first mode of transverse vibration, (b) second mode of transverse vibration, (c) third mode of transverse vibration.
Sustainability 12 01606 g006
Figure 7. FE model of viaduct, vertical displacement under static vehicular load.
Sustainability 12 01606 g007
Figure 8. Span.
Figure 8. Span.
Sustainability 12 01606 g008
Figure 9. GPS data collected and filtered of x direction measurement: (a) On the span, (b) on the pillar.
Sustainability 12 01606 g009
Figure 10. Sensors’ positions.
Sustainability 12 01606 g010
Figure 11. Comparison between measured displacement on survey and prediction displacement.
Sustainability 12 01606 g011
Figure 12. Final prototype produced.
Sustainability 12 01606 g012
Table 1. Comparison between experimental and numerical frequencies.
Shapefexp,i (Hz)fFE,i,Last (Hz)Variation (%)
1.001.551.709.68
2.002.152.102.32
3.003.102.7710.67
Table 2. Geometries database.
Span No.123456789
Length (m)292928.528.8292928.728.728
width (m)9.59.59.59.59.59.59.59.59.5
Basebase (m)9.59.59.59.59.59.59.59.59.5
height (m)0.80.80.80.80.80.80.80.80.8
BeamsLength (m)272727272727272727
base (m)0.40.40.40.40.40.40.40.40.4
height (m)1.51.51.51.51.51.51.51.51.5
Number444444444
CrossLength (m)6.56.56.56.56.56.56.56.56.5
base (m)0.20.20.20.20.20.20.20.20.2
height (m)1.51.51.51.51.51.51.51.51.5
Number333333333
Pier12345678
H p (m)2124222221201615
GeometryRRRRRRRR
h or D (m)2.602.602.602.602.602.602.602.60
b (m)1.501.501.501.501.501.501.501.50
c (m)0.020.020.020.020.020.020.020.02
Table 3. Displacement measured on survey on model and error.
Progressive Abscissaof the Span
(m)
Displacement Measured
(cm)
Displacement Calculated in the Model
(cm)
Error
(%)
0000.0
5−2.35−2.454.1
10−3.81−4.4414.1
14−4.82−5.217.5
18−3.93−4.4411.5
23−2.43−2.450.8
2800

