Article

A Market-Based Economic Instrument to Better Use Water in Agriculture

1
Faculty of Food Engineering, Tourism and Environmental Protection, Aurel Vlaicu University of Arad, Str. Elena Drăgoi, no 2, 310330 Arad, Romania
2
Faculty of Forestry, Stefan cel Mare University of Suceava, Str. Universitatii, 13, 720225 Suceava, Romania
3
S.C. Water Company Arad S.A., Str. Sabin Drăgoi, Nr. 2-4, 312330 Arad, Romania
4
Department of Management and Rural Development, Banat’s University of Agricultural Sciences and Veterinary Medicine, Calea Aradului 119, Timis, 300645 Timisoara, Romania
*
Author to whom correspondence should be addressed.
Sustainability 2020, 12(4), 1473; https://doi.org/10.3390/su12041473
Submission received: 22 November 2019 / Revised: 6 February 2020 / Accepted: 11 February 2020 / Published: 17 February 2020

Abstract

:
The paper presents a market-oriented system of returnable guarantees that can be combined with tradable permits to encourage farmers to use alternative sources of water instead of the regular watering network, or to steer the farming system toward environmentally-friendly systems like low tillage and/or organic farming. Factual data from real farming were bootstrapped to test whether or not a set of farms could save water and reduce chemical input due to the higher cost of maintaining the status quo. Based on interactions between water, pesticides, fertilizers, and crops, the system of returnable guarantee determines the farmers to reduce the amount of water harvested from aquifers, generates benefits for the most environmentally-friendly farmers, and stimulate conversion to organic farming.

1. Introduction

Sustainability is an appealing label attached to all sectoral economies despite the wide range of uncertainties, loopholes, and hidden side-effects that may occur in any real production system. Circular economy (CE) is probably the most provocative pathway to rethinking, redesigning [1], reducing, reusing [2], recycling [3], and recovering resources used by different sectors of the economy [4]. Reframed in this context, farming is all about managing the growth processes of plants and animals sustainably, and one mandatory input in these processes is water.
Water interacts with all human activities and its responsible use is a key factor of sustainability [5]. Sustainable farming implies, inter alia, better control of water consumption [6] on one hand, and lighter ecological load with nutrients, on the other hand [7]. Food production is largely determined by the quantity and quality of the water used across different production processes, and generates an immediate impact on the environment by waste and utilized resources. In many places, agriculture suffers from resource depletion, climate change, and soil degradation due to overexploitation, biodiversity loss, and other unforeseen side-effects of economic growth [8]. One-third of the water is being consumed to produce meat and dairy [9], but the input with the largest water footprint is corn; hence, a good governance of agriculture should prioritize responsible use of water, among other environmental issues [10].
Another study [11] concluded that the agricultural sector accounts for about 85% of global freshwater consumption and as much as 78% of the water used in agriculture is green water (rain water). At the end of the consumption chain, a part of this water will be attached to some 700 million tons of agri-food (agricultural and food) waste littered each year, just in Europe [12]. Closely related to food production and commerce is the packaging industry, where despite high rates of recycling, there is still large room for waste reduction [13]. Especially in agriculture, cascading the water utilization is equally a threat and an opportunity to pollute or feed terrestrial and aquatic ecosystems with vital nutrients. To conceive such a scheme, it is necessary to establish new standards of safe usage of water, and a possible scheme is depicted in Figure 1. Despite this, reused water has a good market in agriculture and industry, and there are many opportunities to promote it [14], particularly when more emphasis is being drawn on CE, which is the only path to increase the sustainability of the global economic system [15].
The Water Footprint Network [16] is a measure of humanity’s appropriation of fresh water in volumes by water consumed and/or polluted, but not the impacts on the run-off. It can quantify the pressure, and not the impact.
There are three categories of water footprint: green, blue, and grey. The green one comes from precipitation; the blue one is extracted from surface or groundwater resources, while the grey is the fresh water required to dilute pollutants in order to meet specific water quality standards. The International Water Association [17] recommended separating the water pathway, the material pathway, and the energy pathway within any given production system, in order to optimize water consumption, recover water wastage, and diminish water scarcity.
Rainwater harvesting could be done on a large scale in agriculture or at a smaller scale in households by collecting the water cached by rooftops [18]. With minimum changes, it could be used for many domestic utilities, despite the numerous risks [19] associated with non-point pollution [20]. On a large scale, rainwater collection could prevent flash-floods (According to Merriam Webster dictionary a flash flood is a local flood of short duration generally resulting from heavy rainfall in the immediate vicinity.) [21]; on small-scale systems (i.e., individual farms), sustainable use of water should be promoted through awareness campaigns and educational programs, as preventing scarcity is better and more cost-effective.
In this context a worthwhile concept is the so-called “virtual water”, which, in its initial denotation, is the water used to produce agricultural commodities [22]. Being so interconnected with agriculture and food security, water management has always been a provocative topic, especially in a global economy, where pollution goes along with international trade [23]. However, in the past decades, the allocation mechanisms of water have challenged numerous scholars and politicians, who have developed or adapted market-oriented instruments meant to reduce the water consumption, like WaterMove, in Australia [24] or the new Spanish law on water allocation [25,26].
An assessment of the virtual water balance of agricultural products was carried out in Croatia [27], and the authors reached the conclusion that net virtual water exporters are located in rural and sparsely populated areas, along watersheds with large agricultural areas [28]. The technology used by vegetable farms also controls water consumption, and fewer fertilizers or organic farming lead to a smaller water footprint of crops [29].
Greywater, which can result from agriculture, industry, or human settlements, is different and its composition varies from place to place. For example, greywater could be highly toxic due to sanitary substances used, and recovering it is an extremely costly endeavor. However, under certain conditions, and even though it is expensive, using as much greywater as possible will reduce the consumption of freshwater [30] and some scholars consider that water recycling is a reliable option for dense farming areas [31,32].
Irrigation systems have long-term effects, the most important ones being higher production costs due to higher prices of energy, and nutrient loss. For example, in agriculture, an important part of unwanted nutrients is found in the water table, while another loss is due to improvidence watering [33,34]. Sadly, an outlook concluded that instead of using recycled water and rainfall water, we excessively extract water from underground aquifers [35]. However, involving water into a broader circular economy may raise risks due to improper monitoring of contaminants, whose concentrations may increase due to several reusing cycles [36].
Going beyond the positive image of organic agriculture, studies have revealed that the economic profitability of organic farming closely depends on the efficiency of the entire agricultural holding. Organic farming is not always an efficient business due to market constrains, logistics, and the consumer’s willingness to pay. However, considering the environmental and social costs of industrial agriculture, the market opportunities of organic farming pay off in the long run, because more and more consumers are aware of sustainability issues [37,38].
The European Commission’s Action Plan to promote a circular economy [39,40,41] makes reference to a new legislative framework for waste management, and new legislative bills on fertilizers and water reuse are being awaited for.
Market instruments may steer farmers to adopt methods aligned to the philosophy of circular economy at the local level. Connections between different suppliers and users will be established locally to reduce bureaucracy, energy, and transportation costs. Therefore, the micro-economic model we are proposing is meant just to facilitate better coordination at the county (or watershed) level between environment protection agencies and local farmers. This coordination will eventually produce social acceptance of environmentally-friendly technologies, and a thorough involvement of all relevant stakeholders like agencies in charge with financing investments in rural area, or the ones involved in monitoring and watching the degree to which the GAEC requirements are being pursued [42]. In 2018, the European Commission adopted a proposal for water reuse, with a set of minimum requirements for water quality and monitoring and the obligation to carry out specified key risk management tasks [43].

2. The Goal of the Study

We conveyed a system of tradable permits combined with revolving bonds meant to encourage farmers to apply one or more of the following options:
  • To reduce the amount of fertilizers applied in the field;
  • To reduce the amount of pesticides;
  • To replace the water-consuming cultures with less water-demanding plants;
  • To change the blue water used for irrigation with greywater, by logistic improvements (local polders for water in excess); and
  • To encourage conversion to organic farming.

3. Materials and Methods

We modeled a system of farms assumed to go for profit under a voluntary system of tradable permits that allows for the dynamic allocation of land among different crops to reduce the costs, save water, and improve crop biodiversity. After parametrizing the model, we plugged some factual data from real farming into the model and reiterated the tradable permits system a couple of times in order to test whether or not the whole farming system goes in a certain direction: save water and/or improve biodiversity due to the higher cost of maintaining the status quo.
Having neither consistent data regarding the greywater used to irrigate croplands, nor data about the mud produced by water treatment facilities, we used only one reference farm, located in Arad county, in Romania, whose owner produces red pepper, irrigates his farm with greywater, and uses mud from the water treatment facility of Arad city as fertilizer. Having a list of real inputs, we further “bootstrapped” as many as 13 virtual farms, resembling the real one to different degrees (The Supplementary Materials provided consists of a series of spreadsheets where we simulated how the system behaves.).
Having different options for water-saving and biodiversity improvement, we had to weigh these options in a reliable manner, collecting more information from experts. We eventually conceived the whole process of weighing as an analytic network process [44].
The proposed method for the number of permissible allowances number is the hierarchical analysis process [45,46,47].

4. Main Assumptions

In order to derive a suitable economic instrument, we needed a set of assumptions based on the economic theory and the political aims that the farms located near to or in the Natura 2000 sites have to pursue, bearing in mind the new philosophy behind the Natura 2000 network: active, not passive management based on traditional cultivation rules, without or with much less chemical or mechanical input. Although the transition from regular to organic farming is not at all easy and the productivity loss is given. Hence, we assumed that:
  • The watering scheme supposedly encourages the farmers to convert more land to organic farming, instead of on regular farming;
  • Conversion to organic farming is preceded by fewer consumption of pesticides and chemical fertilizers;
  • Chemical fertilizers are replaced by mud produced by water treatment facilities or another clean organic source if the mud produced by water treatment facilities is not polluted; and
  • Farms’ competitiveness increases if the water is being consumed from greywater sources.

5. Procedure

At the beginning of each year, the Environmental Protection Authority sets up the number of permits granted (P) for every thousand cubic meters of water consumed by every farm. Furthermore, the agency collects from every farm a returnable guarantee (G) for every thousand cubic meters of water (qi) needed to steer the whole process toward responsible watering and organic farming. Every farm gets ni permits (proportional with the amount of water) and deposits gi monetary units.
g i = G · q i   for   i = 1 , , n
n i = P · q i   for   i = 1 , , n
At the end of the vegetation season, based on the water consumption, pollutants used along the vegetation season, (pesticides and chemical nutrients) and the share of conventional crops, the total number of permits saved ( n i s ) is given by Equation (3).
n i s = n i [ 1 j = 1 m w j e i , j q i ]
where ei,j is the amount of pollutant j released by farm i and wj is the relative importance (weight) of the j pollutant. The share of the guarantee paid by the ith to the farm that manages to make the best of the water used is given by Equation (4)
s i = 1   n i s max i N s
Finally, the ith farm will go into the next year with a guarantee saved from the previous year ( g i + ) given by
g i + = g i p i
where g i is the guarantee paid for the current year and p i is the share of the guarantee paid by the ith farm to the best performing one, as given by Equation (6)
p i = { g i · s i   i f   r e v e r s e   r a n k ( N s ) k g i   i f   r e v e r s e   r a n k ( N s ) > k
where k is a discriminatory threshold that tells the extent to which the winner takes all or just parts of the guarantees from the lower performing farms. If k = 1, the winner takes all the guarantees deposed by the rest of the farmers; if k equals the number of farms, the winner takes just part of the guarantees, proportional to the difference between the permits saved by the winner and the permits saved by each of the other farmers.
Assuming that all players on the market make rational choices, the money collected by the winner (the most environmentally-friendly farmer) is used to convert regular farming to organic farming, any farmer will do their best to seize the comparative advantage gained, or, if there is no comparative advantage, those farmers will reduce the irrigation to minimize the additional cost (share of guarantee lost) once the system is in place. Without fewer fertilizers and herbicides, we may assume that for the “losers”, regular farming will be more expensive and, sooner or later, they will reduce their conventional throughput (water first, second the other two inputs, i.e., fertilizers and herbicides).
In the next section, we simulated how the system works given different discriminatory thresholds, assuming that farms do not behave in a mechanistic way, thus allowing some randomness, which is embedded into only the water consumption, and which may vary from farm to farm due to the various water requirements of cultivated plants, soil, and climate conditions. We added the following assumptions meant to reduce the gap between the real farmers’ behavior and the feed-back loops embedded in the model:
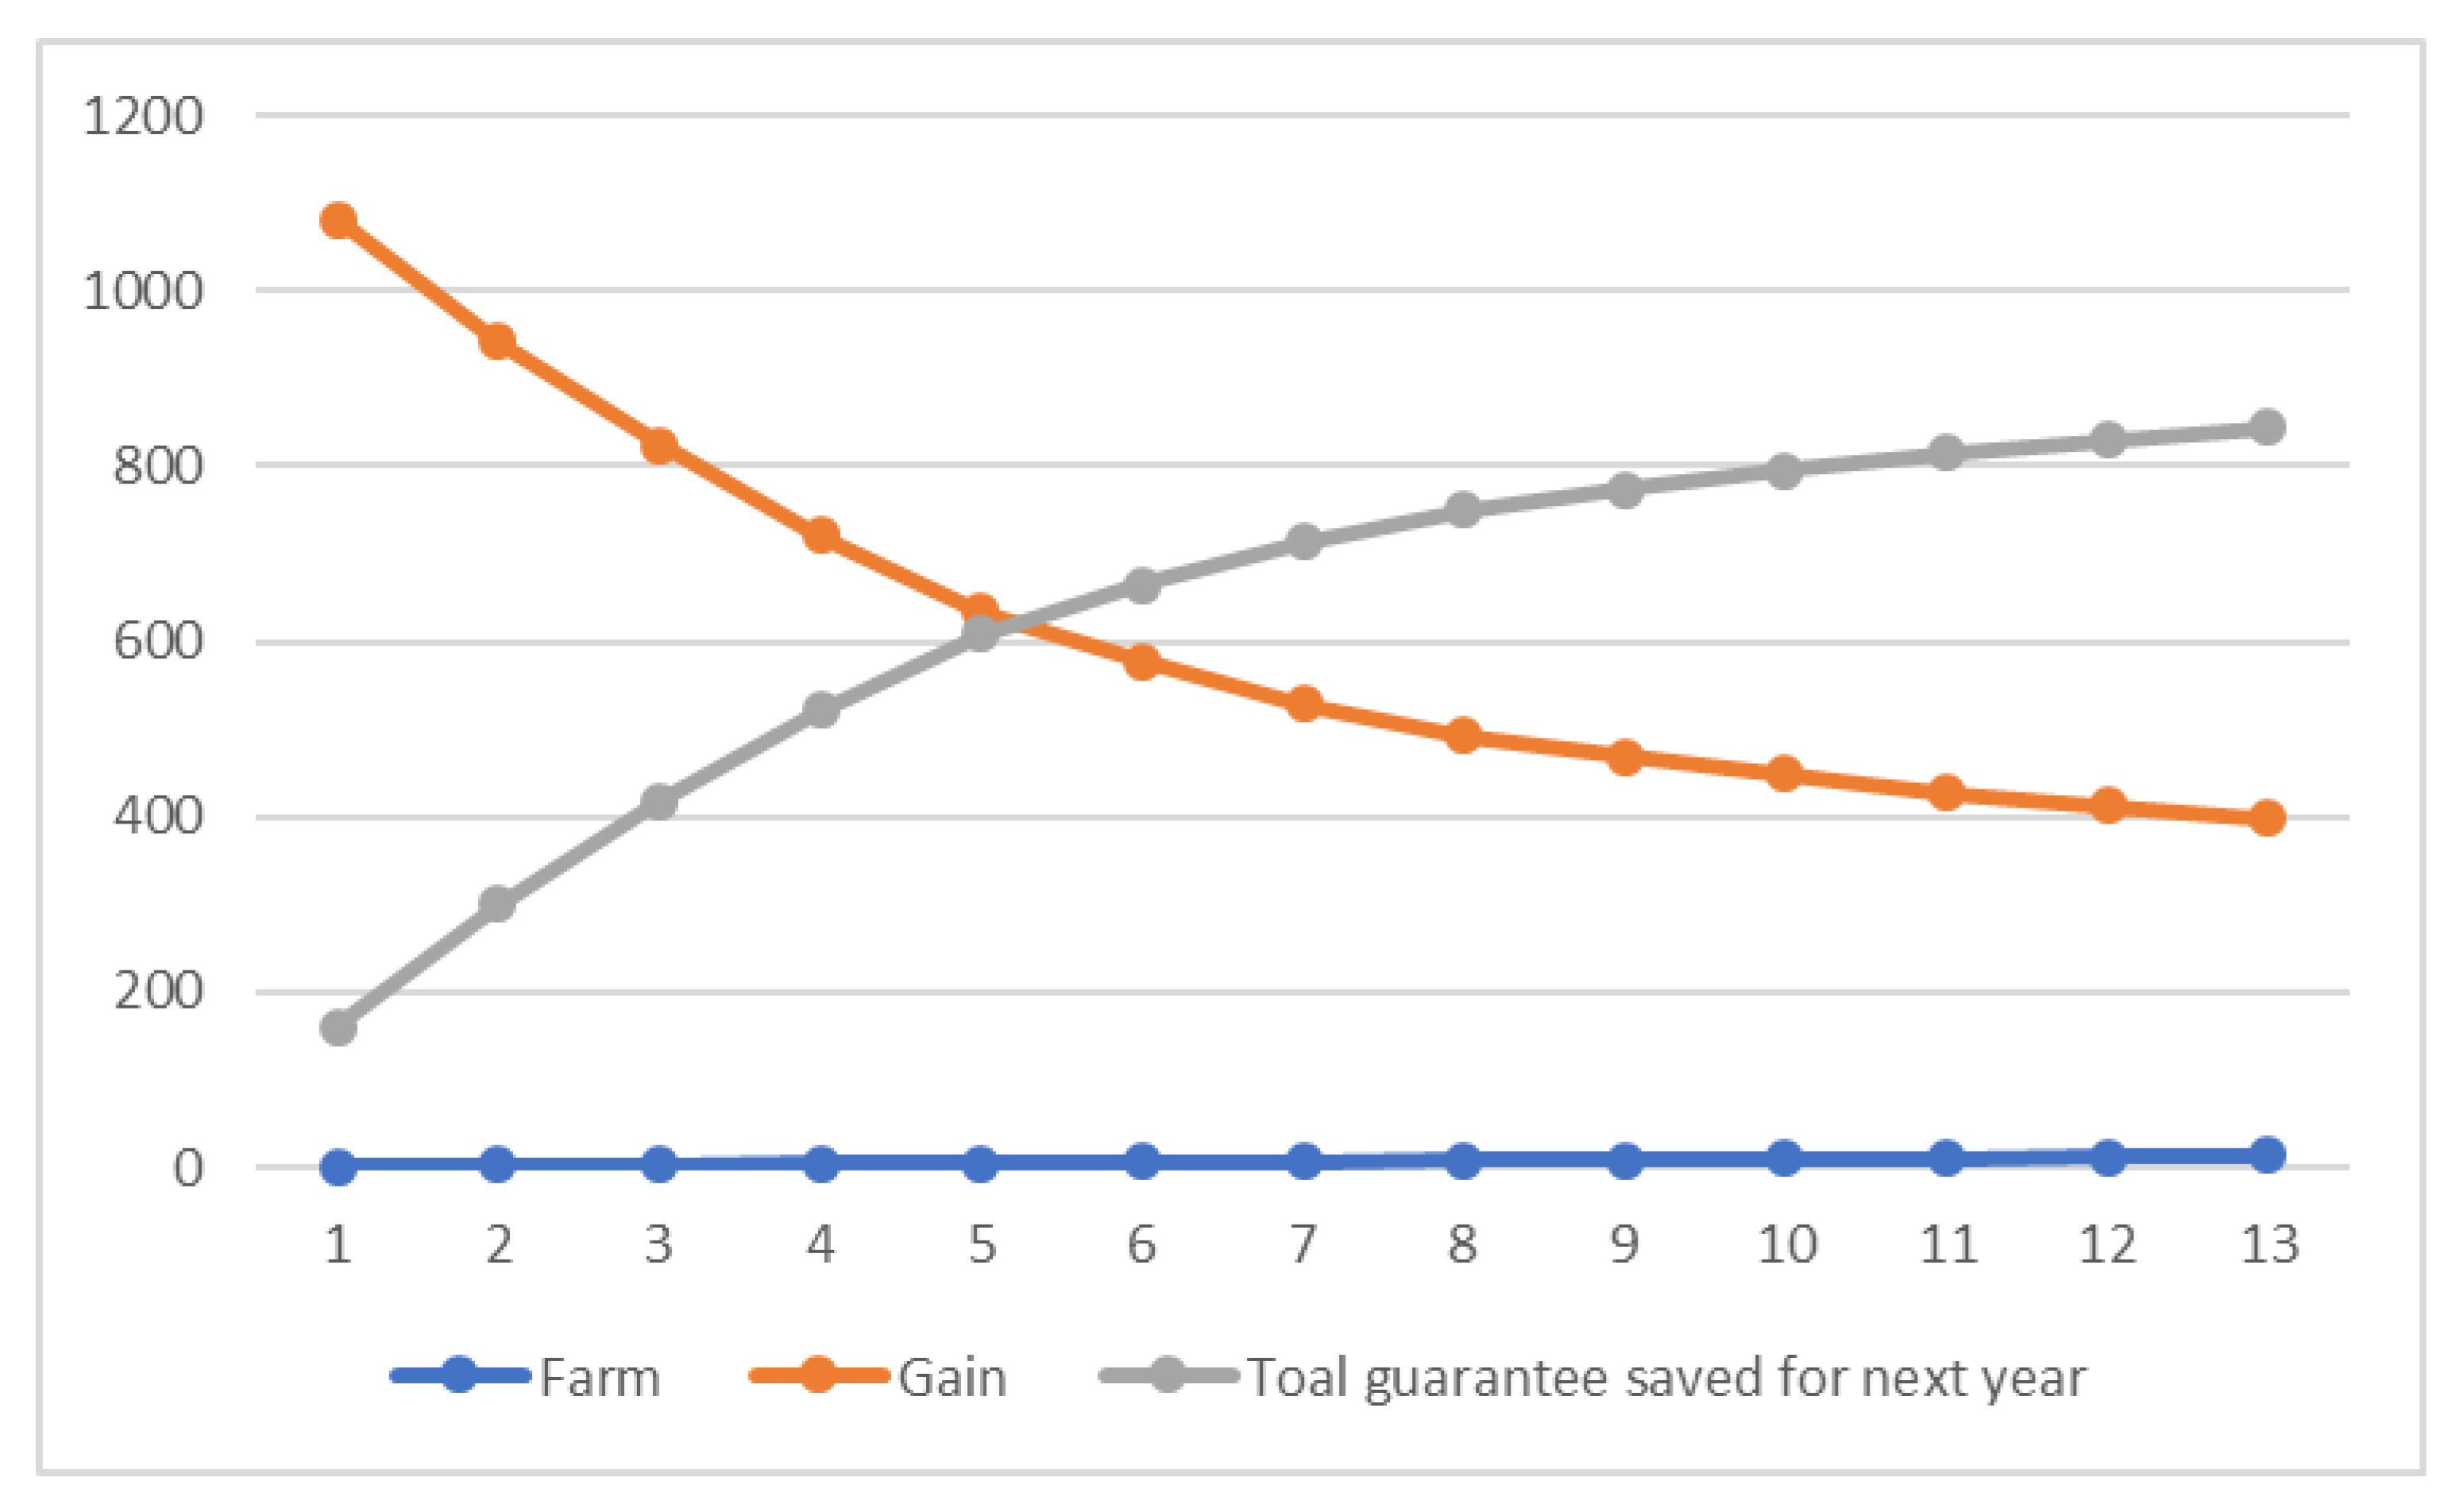
  • each thousand Euros gain turns into 10% fewer fertilizers and herbicides;
  • every two years of gains turn into 10% more organic farming (correspondingly, 10% less regular farming);
  • each thousand Euros loss turns into a 5% increase in fertilizers and pesticides, needed to compensate for the loss with higher production but regular farming and 10% less water for irrigation.
By default, we assumed that all farmers in a watershed were more or less interested in converting their cropland from regular to organic because the management plans of Natura 2000 protected sites require, explicitly or implicitly, conversion to organic farming or, at least, lower nitrogen loads and less chemicals for weed control, for the sake of honey-bees and biodiversity preservation [48]. Another reason for assuming this rational behavior of farmers, in the sense that every Euro gained for conversion goes to conversion and nowhere else is the economic synergy with subsidies paid for organic farming [49]. We also assumed that organic farming requires more water in order to compensate for lower levels of the other two inputs (fertilizers and pesticides).

6. Results

Based on factual data collected from the real world, we assumed that every thousands of Euros gained would be used to gradually convert conventional farming to organic farming in three steps: fewer fertilizers (replaced with mud from water treatment facilities), followed by fewer pesticides, and finally by less conventional farming (columns 5–7, Table 1). The greywater consumption is being reported per year and hectare (second column) and the total guarantee each farmer deposits per year is shown in the third column (returnable guarantee per cubic meter times the amount of water). We did not make any differentiation between fertilizers or pesticides for the sake of simplicity.
As shown in Table 1, the last but one farm (labeled with “L”) managed to save most of the permits issued at the beginning of the simulation period, and its guarantee passed entirely to the next year. As expected, five out of 13 farms managed to save the entirety or parts of the initial guarantee (ninth column, Table 1).
Based on this set of data, we simulated how this market would behave, assuming that greywater consumption was affected by a degree of randomness. This assumption makes sense because the rainfall may vary from year to year.
Ceteris paribus, the comparative advantage gained by the most environmentally-friendly farm (the ‘winner’) was tested against different water consumption levels, obeying a simple rule: during the same year, all farms will consume more or less greywater, but the tendency will be the same for all farms, compared to the previous year.
Running the simulation 50 times and considering that greywater consumption goes randomly around the initial figures presented in column 2, Table 1, we estimated the annual average income of the most environmental-friendly farms at € 500 per year, while the average unwanted inputs (fertilizers and pesticides) dropped by 25–30% on average after three years, paving the pathway to organic farming.
The first notable result was the optimal discrimination threshold (i.e., the number of farms whose guarantee are not entirely collected by the winner (Figure 2)). Plotting the gain of the best farm, on one hand, and the guarantees saved by the rest of the farms for the next year, we found that given the number of farms and the guarantee per cubic meter of water, the discrimination threshold that was socially optimal was five. A low discrimination threshold conveys high revenues for the winning farm (faster conversion organic farming), but a higher competitive pressure over the farms, who must pay more for the next year’s guarantees, having less savings from the current year. Higher threshold (more farms indulged for not being quite competitive) means lesser gains for the environmentally-friendly farm, which may slow down conversion to organic farming.
We assumed that farmers ranked above the discriminant threshold could afford to buy 20–30% more water, while the rest of the farms would have bought 15–20% less water.
The next step was to allow some randomness for water consumption and running the model ten times for five scenarios (higher water consumption from the first to the fifth environmentally-friendly farms). According to the first scenario, only the highest ranked farm could afford to buy more water; according to the second scenario, the first and the second ranked farms bought more water and so forth.
In so doing, we estimated the extent to which the farms ranked above the threshold were able to buy more greywater, while the farms ranked below the threshold were forced to buy less water, assuming that they kept the costs under control (paying more guarantees, year after year, these farms are assumed to buy less greywater).
The results are summarized in Table 2. As expected, after two years, some acreage is being converted to organic farming, but not too much. There was no difference between the five scenarios after three years, but after four years, the conversion rate increased because we assumed that more water would replace less fertilizers, and this presumed effect was captured in the reduction rates of the two aforementioned inputs. The tendency was not linear because, as we have already stated, some randomness was taken into consideration when we assigned different amounts of water to the non-performing farms.

7. Discussion

The model we came up with in this study is quite simplistic and unrealistic to some extent, given that it assumes all farmers will freely join in this scheme and will report precisely on all of the key inputs (water fertilizers and pesticides). However, considering all the nationwide agencies in charge of monitoring the different issues that the subsidies are dependent on, more or less, we may consider the scheme feasible in the long run. The main advantage of the model relies on its flexibility and its impact on competitiveness. In this respect, the key issue is the discriminatory threshold k, (see Equation (6)): the higher this discrimination threshold, the less effective is the model in collecting enough money to convert traditional farming to organic farming, and the allocation scheme runs randomly. The lower k is, the more money is being collected in a single shot and the more environmentally friendly farm gains a comparative advantage that lasts longer. Hence, the balance between these two extreme situations depends to a large degree on the total physical area covered by the scheme (in hectares), on the number of farmers involved, and the pace at which conversion to organic farming is being carried out.
Due to its scale, impact, and major ecological roles, reshaping agriculture is like giving a new start for an economic system. Agriculture could be a part of the sought-after win–win solutions within or near protected areas, Natura 2000 sites being good examples in this respect.
Transition to CE is quite difficult to initiate, given spare transferable knowledge [50,51] and lack of effective economic instruments able to stimulate farmers to adopt environmentally-friendly solutions. This simple model just reveals how necessity is a better coordination between the business models, governmental policies [52], and the natural systems, given the involvement of different stakeholders [53,54].
In light of a new water legislative framework, research was done focusing particularly on the impact on enterprise budgets [55]. For example, greywater reuse in a circular layout is cost saving and environmentally friendly technology [56]. With a reliable mature treatment technology, sewer mining is an opportunity for enterprises to be an active part of the water market [57]. Wastewater treatment plants play a role in this water market, at different quality requirements and costs [58].
When talking about agricultural implications, benefits may occur for both farmers and waste-water treatment plants, assuming that the mud produced by water treatment plants does not contain heavy metals or pesticide, but only supplementary nutrients. Our model also relies on a constant water supply [59], but this assumption is quite realistic in many parts of Europe.
First of all, the market mechanism we came up with is flawed by the quite low price of water, a price that caps the guarantee on which the system relies. Therefore, the only way to speed up the conversion process is to enlarge the reference area, which means including a much larger area, that is, more farms, in this economic scheme. Assuming a much higher (unrealistic) guarantee, say, 2 €/m3, the conversion process would go much faster (20% in the third year) because the additional gain of the best farm would have been substantial.
Second, the results shown in Table 2 suggest some inelastic conversion process and inelastic decline of chemical inputs after 2 years, explicable by the fact that farms ranked after the first position took shortly over the first position, affording to buy more water. We correctly assumed they use more water once they manage to save their guarantees and is more profitable for larger farms. However, in real terms, less inputs means low pressure over the water table, even though the process won’t be finalized with a higher ratio of organic farming across the whole watershed, which, as we already have mentioned, is extremely simplified in terms in different interactions between water, fertilizers and crops.
We considered just three factors (water, fertilizers and pesticides) whose combinations, steered to rich a desired goal–more organic farming–may require different metrics than the ones used by our model: area watered in each farm, different crops, different rainfall patterns might be also incorporated into a more complicated model. But, for the time being, we tried to test to which extent the basic assumptions are consistent with the existent subsides schemes for organic farming and the interest in applying new economic instruments in Natura 2000 sites, created to maintain and improve the favorable state of conservation of species [60].

8. Conclusions

Implementing a returnable guarantees system (which might be combined with tradable permits) could be a valuable economic instrument applicable to watering systems, providing that all farmers willingly enter a new market meant to stimulate organic farming and/or graywater usage, even though this second option is not feasible in many cases.
For farms located in Natura 2000 sites, a slight reduction of chemical pesticides has always been welcome and this system allows for this reduction, even though the way in which money is allocated may look heretic for short periods of time (this is the reason why the progress indicators were unexpectedly low).
From a purely economic perspective, this model tried to create a negative feed-back loop able to gradually reduce the amount of fertilizers and pesticides spread out through existing watering schemes. This mechanism, even though far from a perfect solution, is better than nothing (i.e., status quo), and environmental agencies could try to apply it in a pilot area, along with regional offices of the national water company.
Another important aspect that arose while testing and adding hypotheses to the initial model was the procedure to set the socially accepted discrimination threshold, that is, the number of less performing farmers whose returnable guarantees are not entirely taken by the most performing farmer, but partially saved for the next year. As a matter of fact, this is the most important theoretical contribution to improving the social acceptance of such an economic instrument, which otherwise would deepen the social inequality between rich and poor farmers.

Supplementary Materials

The following are available online at https://www.mdpi.com/2071-1050/12/4/1473/s1.

Author Contributions

All authors contributed equally to this paper. All authors have read and agreed to the published version of the manuscript.

Funding

This research received no external funding.

Conflicts of Interest

The authors declare no conflict of interest.

References

  1. Sihvonen, S.; Partanen, J. Eco-design practices with a focus on quantitative environmental targets: An exploratory content analysis within ICT sector. J. Cleaner Prod. 2017, 143, 769–783. [Google Scholar] [CrossRef]
  2. Kay, M.; Domen, J.K.; Stringfellow, W.T.; Camarillo, M.K.; Domen, J.K.; Stringfellow, W.T. Physical-chemical evaluation of hydraulic fracturing chemicals in the context of produced water treatment. J. Environ. Manag. 2016, 183, 164–174. [Google Scholar] [CrossRef] [Green Version]
  3. Kim, M.H.; Song, H.B. Analysis of the global warming potential for wood waste recycling systems. J. Cleaner Prod. 2014, 69, 199–207. [Google Scholar] [CrossRef]
  4. Geissdoerfer, M.; Savaget, P.; Bocken, N.M.P.; Hultink, E.J. The Circular Economy—A new sustainability paradigm? J. Cleaner Prod. 2017, 143, 757–768. [Google Scholar] [CrossRef] [Green Version]
  5. Peltier, G.L.; Karunakara, U.K.; Wright, A.E. Assessment of Progress in Meeting the UN Millennium Development Goals. In Water and Sanitation-Related Diseases and the Environment: Challenges, Interventions, and Preventive Measures; Wiley-Blackwell: Hoboken, NJ, USA, 2011; pp. 463–474. [Google Scholar] [CrossRef]
  6. Aboyeji, O.S.; Eigbokhan, S.F. Evaluations of groundwater contamination by leachates around Olusosun open dumpsite in Lagos metropolis, southwest Nigeria. J. Environ. Manag. 2016, 183, 333–341. [Google Scholar] [CrossRef]
  7. Van Geer, F.C.; Kronvang, B.; Broers, H.P. High-resolution monitoring of nutrients in groundwater and surface waters: Process understanding, quantification of loads and concentrations, and management applications. Hydrol. Earth Syst. Sci. 2016, 20, 3619–3629. [Google Scholar] [CrossRef] [Green Version]
  8. Panagos, P.; Borrelli, P.; Poesen, J.; Ballabio, C.; Lugato, E.; Meusburger, K.; Montanarella, L.; Alewell, C. The new assessment of soil loss by water erosion in Europe. Environ. Sci. Policy 2015, 54, 438–447. [Google Scholar] [CrossRef]
  9. Mekonnen, M.M.; Hoekstra, A.Y. The water footprint of poultry, pork and beef: A comparative study in different countries and production systems. Water Res. Ind. 2013, 1–2, 25–36. [Google Scholar] [CrossRef] [Green Version]
  10. Dumont, A.; Salmoral, G.; Llamas, M.R. The water footprint of a river basin with a special focus on groundwater: The case of Guadalquivir basin (Spain). Water Res. Ind. 2013, 1–2, 60–76. [Google Scholar] [CrossRef] [Green Version]
  11. Mekonnen, M.M.; Hoekstra, A.Y. The green, blue and greywater footprint of crops and derived crop products. Hydrol. Earth Sys. Sci. 2011, 15, 1577–1600. [Google Scholar] [CrossRef] [Green Version]
  12. Toop, T.A.; Ward, S.; Oldfield, T.; Hull, M.; Kirby, M.E.; Theodorou, M.K. AgroCycle—Developing a Circular Economy in Agriculture. Energy Procedia 2017, 123, 76–80. [Google Scholar] [CrossRef]
  13. Geueke, B.; Groh, K.; Muncke, J. Food packaging in the circular economy: Overview of chemical safety aspects for commonly used materials. J. Cleaner Prod. 2018, 193, 491–505. [Google Scholar] [CrossRef]
  14. Petit-Boix, A.; Leipold, S. Circular Economy in cities: Reviewing how environmental research aligns with local practices. J. Cleaner Prod. 2018, 195, 1270–1281. [Google Scholar] [CrossRef]
  15. Elia, V.; Gnoni, M.; Tornese, F. Measuring Circular Economy strategies through index methods: A critical analysis. J. Cleaner Prod. 2015, 142, 2741–2751. [Google Scholar] [CrossRef]
  16. Hoekstra, A.Y.; Chapagain, A.K.; Mekonnen, M.M.; Aldaya, M.M. The Water Footprint Assessment Manual Setting the Global Standard, Water Footprint Network. 2011. Available online: http://waterfootprint.org/media/downloads/TheWaterFootprintAssessmentManual_2.pdf (accessed on 9 April 2019).
  17. International Water Association. Water Utility Pathways in a Circular Economy. 2016. Available online: http://www.iwa-network.org/publications/water-utilities-circular-economy/ (accessed on 9 April 2019).
  18. Helmreich, B.; Horn, H. Opportunities in rainwater harvesting. Desalination 2009, 248, 118–124. [Google Scholar] [CrossRef]
  19. Efe, S.I. Quality of rainwater harvesting for rural communities of Delta State, Nigeria. Environmentalist 2006, 26, 175–181. [Google Scholar] [CrossRef]
  20. Chang, M.; McBroom, M.W.; Scott Beasley, R. Roofing as a source of nonpoint water pollution. J. Environ. Manag. 2004, 73, 307–315. [Google Scholar] [CrossRef]
  21. Hall, J.; Arheimer, B.; Borga, M.; Brázdil, R.; Claps, P.; Kiss, A.; Kjeldsen, T.R.; Kriauciuniene, J.; Kundzewicz, Z.W.; Lang, M.; et al. Understanding flood regime changes in Europe: A state-of-the-art assessment. Hydrol. Earth Syst. Sci. 2014, 18, 2735–2772. [Google Scholar] [CrossRef] [Green Version]
  22. Merrett, S.; Allan, J.A.; Lant, C. Virtual water—The water, food, and trade nexus useful concept or misleading metaphor? Water Int. 2003, 28, 106–113. [Google Scholar]
  23. O’Bannon, C.; Carr, J.; Seekell, D.A.; D’Odorico, P. Globalization of agricultural pollution due to international trade. Hydrol. Earth Syst. Sci. 2014, 18, 503–510. [Google Scholar]
  24. Brooks, R.; Harris, E. Efficiency gains from water markets: Empirical analysis of Watermove in Australia. Agric. Water Manag. 2008, 95, 391–399. [Google Scholar] [CrossRef]
  25. García-Gallego, A.; Georgantzís, N.; Hernán-González, R.; Kujal, P. How do Markets Manage Water Resources? An Experiment. Environ. Resour. Econ. 2012, 53, 1–23. [Google Scholar] [CrossRef] [Green Version]
  26. Garrido, A. Water markets design and evidence from experimental economics. Environ. Res. Econ. 2007, 38, 311–330. [Google Scholar] [CrossRef]
  27. Vanham, D. An assessment of the virtual water balance for agricultural products in EU river basins. Water Res. Ind. 2013, 1–2, 49–59. [Google Scholar] [CrossRef]
  28. Ruini, L.; Marino, M.; Pignatelli, S.; Laio, F.; Ridolfi, L. Water footprint of a large-sized food company: The case of Barilla pasta production. Water Res. Ind. 2013, 1–2, 7–24. [Google Scholar] [CrossRef] [Green Version]
  29. Francke, I.C.M.; Castro, J.F.W. Carbon and water footprint analysis of a soap bar produced in Brazil by Natura Cosmetics. Water Res. Ind. 2013, 1–2, 37–48. [Google Scholar] [CrossRef] [Green Version]
  30. Jefferson, B.; Laine, A.; Parsons, S.; Stephenson, T.; Judd, S. Technologies for domestic wastewater recycling. Urban Water 2000, 1, 285–292. [Google Scholar] [CrossRef]
  31. Karandish, F. Applying greywater footprint assessment to achieve environmental sustainability within a nation under intensive agriculture: A high-resolution assessment for common agrochemicals and crops. Environ. Earth Sci. 2019, 78, 200. [Google Scholar] [CrossRef]
  32. Odeh, A.J. Greywater reuse: Towards sustainable water management. Desalination 2003, 156, 181–192. [Google Scholar] [CrossRef]
  33. Hendel, M. Pavement-Watering in Cities for Urban Heat Island Mitigation and Climate Change in Paris L’arrosage Urbain Comme Moye. Ph.D. Thesis, Universite de Paris, Paris, France, 2016. [Google Scholar]
  34. Xu, J.; Wei, Q.; Yang, S.; Liao, L.; Qi, Z.; Wang, W. Soil degassing during watering: An overlooked soil N2O emission process. Environ. Pollut. 2018, 242, 257–263. [Google Scholar] [CrossRef]
  35. Oki, T.; Kanae, S. Global hydrological cycles and world water resources. Science 2006, 313, 1068–1072. [Google Scholar] [CrossRef] [PubMed] [Green Version]
  36. Voulvoulis, N. Water reuse from a circular economy perspective and potential risks from an unregulated approach. Cur. Opin. Environ. Sci. Health 2018, 2, 32–45. [Google Scholar] [CrossRef]
  37. Lockie, S.; Halpin, D. The ‘Conventionalisation’ Thesis Reconsidered: Structural and Ideological Transformation of Australian Organic Agriculture. Sociol. Rural. 2005, 4594, 284–307. [Google Scholar] [CrossRef]
  38. Pechrova, M. The determinants of the farmers’ conversion to organic agriculture: Evidence from Czech panel data. In Proceedings of the 8th International Days of Statistics and Economics, Prague, Czech Republic, 11–13 September 2014; pp. 1126–1133. [Google Scholar]
  39. EC. Directive 2008/98/EC of the European Parliament and of the Council of 19 November 2008 on Waste and Repealing Certain Directives. 2008. Available online: http://eur-lex.europa.eu/legal-content/EN/TXT/PDF/?uri=CELEX:32008L0098&from=EN (accessed on 9 April 2019).
  40. EC. Closing the Loop: Commission Adopts Ambitious New Circular Economy Package to Boost Competitiveness, Create Jobs and Generate Sustainable Growth; European Commission: Brussels, Belgium, 2015; Available online: http://europa.eu/rapid/press-release_IP-15-6203_en.htm (accessed on 9 April 2019).
  41. EC. Circular Economy Strategy; European Commission: Brussels, Belgium, 2015; Available online: http://ec.europa.eu/environment/circular-economy/index_en.htm (accessed on 9 April 2019).
  42. Regulation (EU) No 1306/2013 of the European Parliament and of the Council of 17 December 2013 on the financing, management and monitoring of the common agricultural policy and repealing Council Regulations (EEC) No 352/78, (EC) No 165/94, (EC) No 2799/98, (EC) No 814/2000, (EC) No 1290/2005 and (EC) No 485/2008. Available online: https://eur-lex.europa.eu/eli/reg/2013/1306/oj (accessed on 19 June 2019).
  43. EC. Proposal for a Regulation of the European Parliament and of the Council on Minimum Requirements for Water, Brussels, 28.5.2018, COM(2018) 337 final2018/0169 (COD)reuse. Available online: https://data.consilium.europa.eu/doc/document/ST-9498-2018-INIT/en/pdf (accessed on 11 November 2019).
  44. Saaty, T.L. The Analytic Hierarchy Process. Planning, Priority Setting, Resource Allocation; McGraw-Hill: New York, NY, USA, 1980; p. 283. [Google Scholar]
  45. Winston, W.L. Operations Research. Application and Algorithms, 3rd ed.; Duxbury Press: Pacific Grove, CA, USA, 1994; p. 1277. [Google Scholar]
  46. Drăgoi, M. Tradable permits in logging operations. J. Forest Sci. 2002, 48, 38–48. [Google Scholar] [CrossRef]
  47. Andersson, F. Small Pollution Markets: Tradable Permits versus Revelation Mechanisms. J. Environ. Econ. Manag. 1997, 32, 38–50. [Google Scholar] [CrossRef]
  48. Walters, S.A.; Bradley, H.T. Effects of honey bee pollination on pumpkin fruit and seed yield. HortScience 2006, 41, 370–373. [Google Scholar] [CrossRef] [Green Version]
  49. Gyarmat, G. The Role of Organic Farming in the CAP, the Rural Development Programme, with Particular Regard to Subsidies. In The CAP and National Priorities within the EU Budget after 2020; Wigier, M., Kowalski, A., Eds.; AFE-NRI: Warsaw, Poland, 2018. [Google Scholar]
  50. Brears, R.C. The circular economy and the water-food nexus. Future Food-J. Food Agric. Soc. 2016, 3, 53–59. [Google Scholar]
  51. Eneng, R.; Lulofs, K.; Asdak, C. Towards a water balanced utilization through circular economy. Manage. Res. Rev. 2018, 41, 572–585. [Google Scholar] [CrossRef]
  52. Scheepens, A.E.; Vogtlander, J.G.; Brezet, J.C. Two life cycle assessment (LCA) based methods to analyse and design complex (regional) circular economy systems. Case: Making water tourism more sustainable. J. Cleaner Prod. 2016, 114, 257–268. [Google Scholar] [CrossRef]
  53. Ziegler, R. Viewpoint–Water Innovation for a Circular Economy: The Contribution of Grassroots Actors. Water Alter. Interdiscip. J. Water Pol. Dev. 2019, 12, 774–787. [Google Scholar]
  54. Ignacio, J.J.; Malenab, R.A.; Pausta, C.M.; Beltran, A.; Belo, L.; Tanhueco, R.M.; Promentilla, M.A.; Orbecido, A. Perception Study of an Integrated Water System Project in a Water Scarce Community in the Philippines. Water 2019, 11, 1593. [Google Scholar] [CrossRef] [Green Version]
  55. Lorek, E.; Lorek, A. Circular economy in sustainable water management—Theory and practice. Ekonomia i Srodowisko-Econ. Environ. 2018, 4, 50–59. [Google Scholar]
  56. Dominguez, S.; Laso, J.; Margallo, M.; Aldaco, R.; Rivero, M.J.; Irabien, A.; Ortiz, I. LCA of greywater management within a water circular economy restorative thinking framework. Sci. Total Environ. 2018, 621, 1047–1056. [Google Scholar] [CrossRef] [PubMed]
  57. Makropoulos, C.; Rozos, E.; Tsoukalas, I.; Plevri, A.; Karakatsanis, G.; Karagiannidis, L.; Makri, E.; Lioumis, C.; Noutsopoulos, C.; Mamais, D.; et al. Sewer-mining: A water reuse option supporting circular economy, public service provision and entrepreneurship. J. Environ. Manag. 2018, 216, 285–298. [Google Scholar] [CrossRef] [PubMed]
  58. Somoza-Tomos, A.; Rives-Jimenez, M.; Espuna, A.; Graells, M. A circular economy approach to the design of a water network targeting the use of regenerated water. In Proceedings of the 9th International Conference on Foundations of Computer-Aided Process Design, Frisco, CO, USA, 14–16 July 2019. [Google Scholar] [CrossRef]
  59. Hagenvoort, J.; Ortega-Reig, M.; Botella, S.; Garcia, C.; de Luis, A.; Palau-Salvador, G. Reusing Treated Waste-Water from a Circular Economy Perspective-The Case of the Real Acequia de Moncada in Valencia (Spain). Water 2019, 11, 1830. [Google Scholar] [CrossRef] [Green Version]
  60. Neblea, M.; Marian, M. Studies Concerning Cormoflora of the Screes of Thlaspietea Rotundifolii Br.-Bl. 1948 CLASS FROM MERIDIONAL CARPATHIANS (ROMANIA). Cur. Trends Nat. Sci. 2018, 7, 138–148. [Google Scholar]
Figure 1. Water circuit though a Circular Economy model.
Sustainability 12 01473 g001
Figure 2. Socially-optimal discriminant threshold of the farmers whose guarantees are not entirely transferred to the most environmentally-friendly farmer’s account.
Sustainability 12 01473 g002
Table 1. Input data needed to demonstrate how the system works (returnable guarantee: € 0.2 m−3, 2 permits m−3).
FarmGreywater Consumption (m3 ha−1year−1)Total Guarantee (€/year)Total Permits per YearFertilizers (kg/ha) w = 0.15Pesticides (kg/ha) w = 0.25Regular Farming (%) w = 0.6Saved PermitsGuarantee Saved for the Next Year (€)
12345678
A800€ 16016004022401529126
B300€ 60600171150529.4 0
C400€ 80800453065693.5 0
D600€ 12012001233601107.969
E300€ 60600121434548.6 0
F300€ 60600191512572.4 0
G240€ 4848012745418.9 0
H480€ 96960463134889.9 0
I690€ 13813803033431302.993
J250€ 50500362312463.3 0
K450€ 90900195023841.7 0
L750€ 15015002335341434.8200
M650€ 13013002921561213.682
Table 2. Expected consequences of implementing the returnable guarantee system based on input data presented in Table 1.
ScenarioAfter 1 YearAfter 2 YearsAfter 3 YearsAfter 4 Years
Share of land converted to organic farming (%)
First0088
1 to 20088
1 to 300810
1 to 400810
1 to 500810
Reduction of average chemical pest control (kg/ha)
First8.48.57.79
1 to 28.38.58.610
1 to 38.38.68.610
1 to 48.48.78.611
1 to 58.58.78.811
Reduction of average chemical fertilizers (kg/ha)
First7.47.58.79
1 to 27.388.28.48.5
1 to 37.48.38.59
1 to 47.48.48.69
1 to 57.68.48.69

