Analyzing Consumer Loyalty through Service Experience and Service Convenience: Differences between Instructor Fitness Classes and Virtual Fitness Classes

 ,
,
Abstract
:1. Introduction
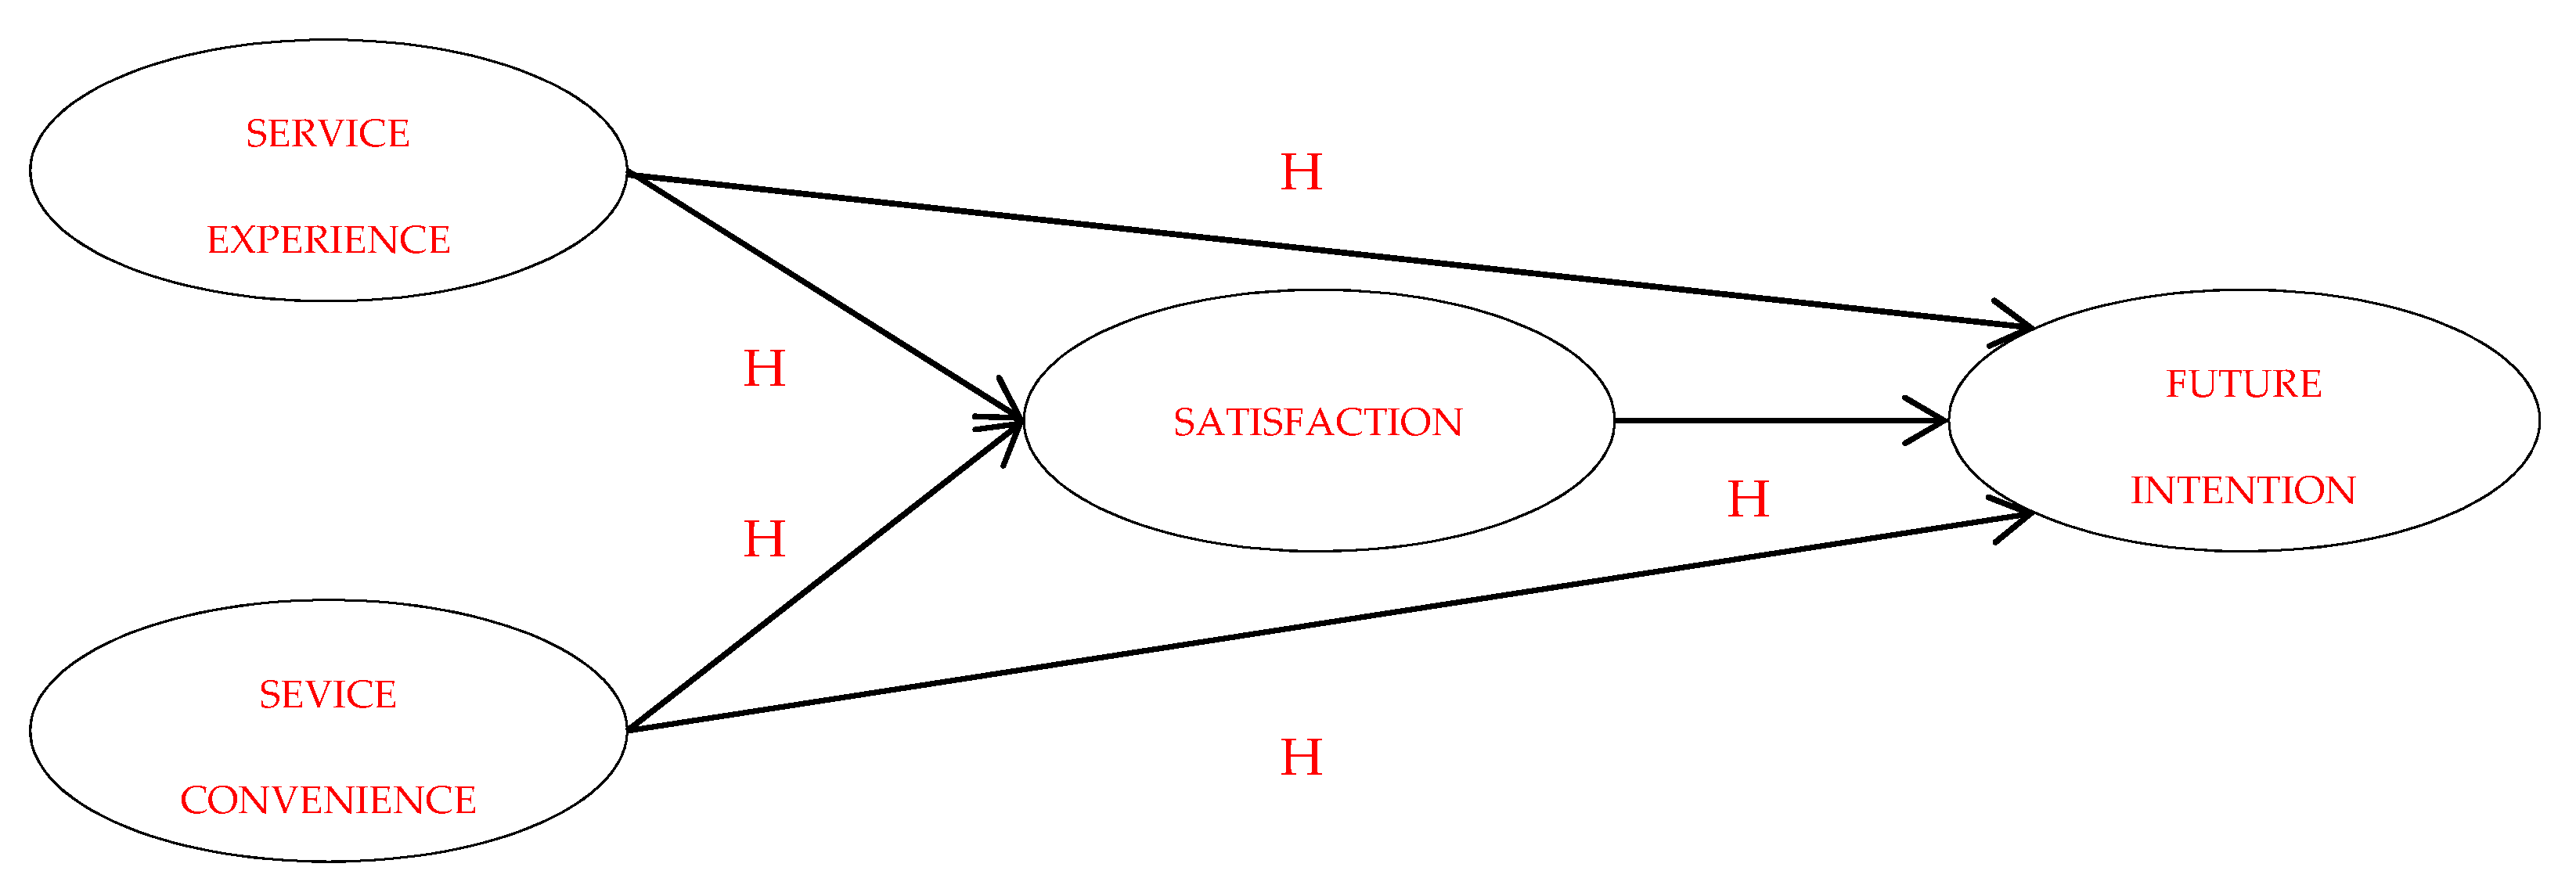
2. Theoretical Foundation and Hypothesis Development
2.1. Virtual Activities and Technology in the Fitness and Health Industry
2.2. Relationship between Service Experiences, Satisfaction and Future Intentions
2.3. Relationship between Service Convenience and Satisfaction and Future Intentions
3. Materials and Methods
3.1. Participants
3.2. Measures
3.3. Procedure
3.4. Data Analysis
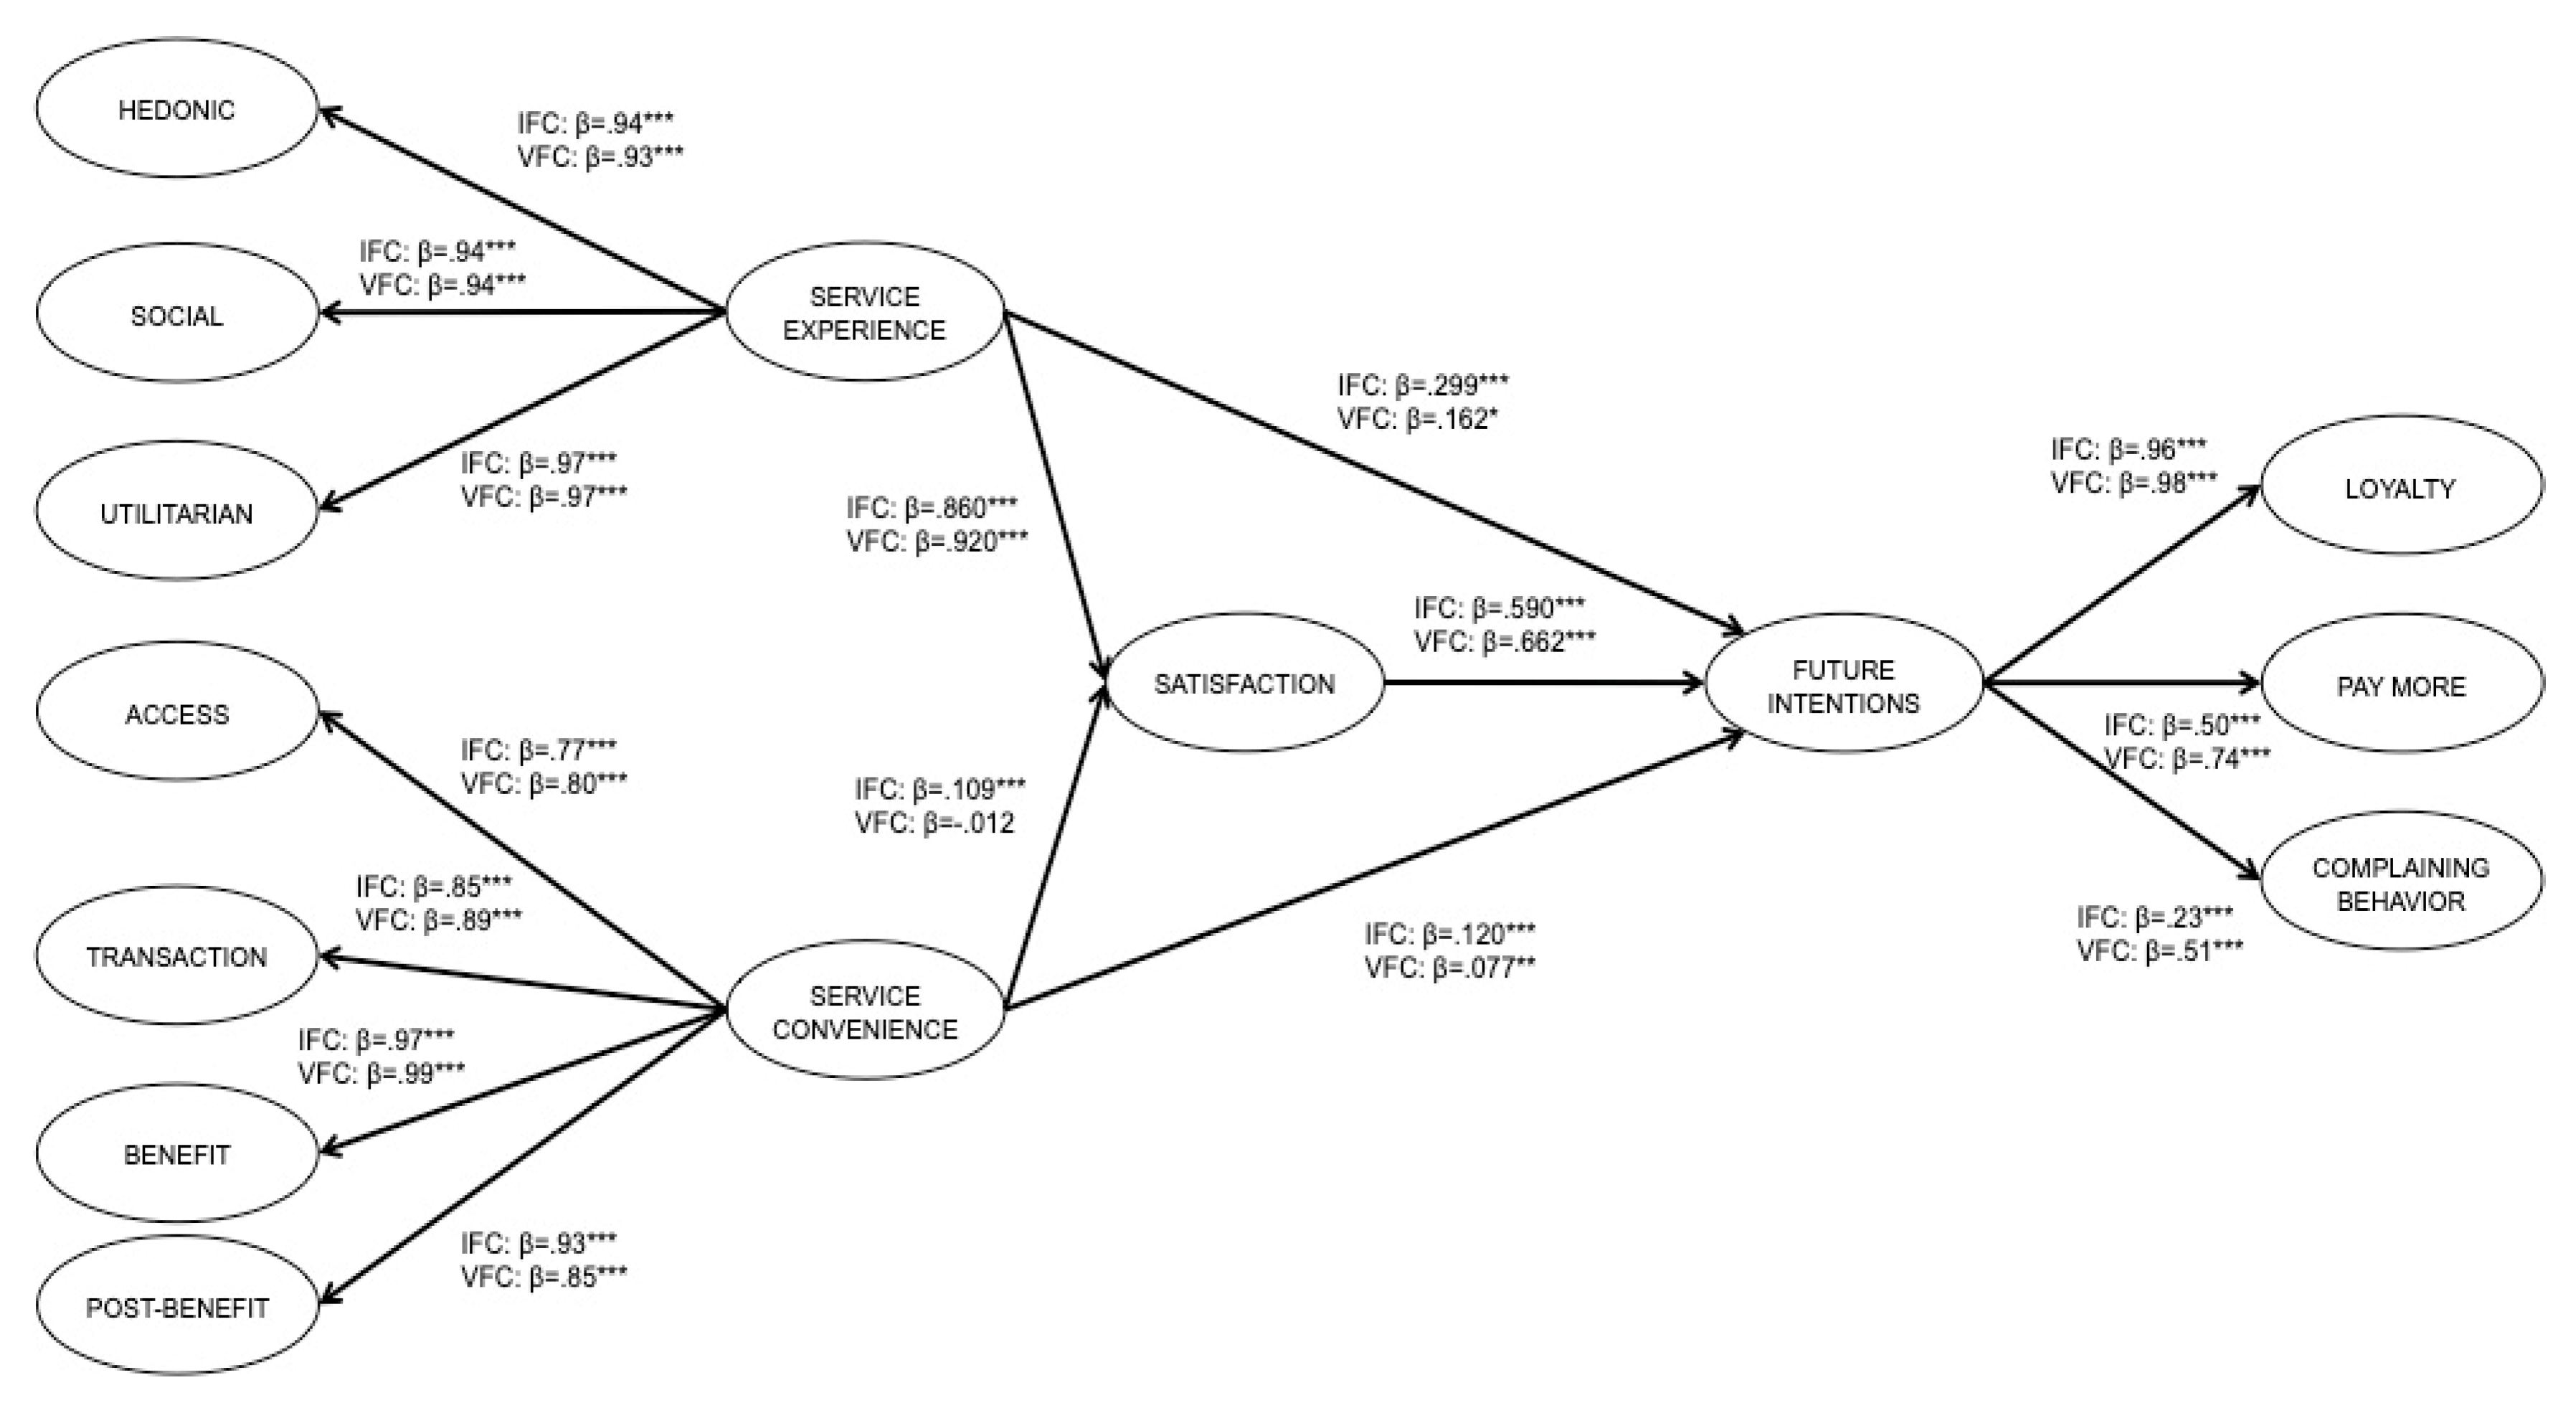
4. Results
5. Discussion
5.1. Managerial Implications
5.2. Limitations and Future Investigations
6. Conclusions
Author Contributions
Funding
Conflicts of Interest
References
- Foroughi, B.; Iranmanesh, M.; Gholipour, H.F.; Trading, C. Examining relationships among process quality, outcome quality, delight, satisfaction and behavioural intentions in fitness centres in Malaysia. Int. J. Sport. Mark. Spons. 2019. [Google Scholar] [CrossRef]
- Porter, M.E. Competitive Advantage; Free Press: New Yok, NY, USA, 1985. [Google Scholar]
- Algar, R. 2011 Global Low-Cost Gym Sector Report: A Strategic Investigation into a Disruptive New Segment. 2011. Available online: https://www.precor.com/sites/default/files/global-low-cost-gym-sector-report.pdf (accessed on 21 January 2020).
- García-Fernández, J.; Gálvez-Ruiz, P.; Vélez-Colon, L.; Ortega-Gutiérrez, J.; Fernández-Gavira, J. Exploring fitness centre consumer loyalty: Differences of non-profit and low-cost business models in Spain. Econ. Res. Istraživanja 2018, 31, 1042–1058. [Google Scholar]
- García-Fernández, J.; Gálvez-Ruiz, P.; Sánchez-Oliver, A.J.; Fernández-Gavira, J.; Pitts, B.G.; Grimaldi-Puyana, M. An analysis of new social fitness activities: Loyalty in female and male CrossFit users. Sport Soc. 2019, 1–28. [Google Scholar] [CrossRef]
- Hambrick, M.E. Riding into the future: A financial examination of SoulCycle and the indoor cycling studio trend. Case Stud. Sport Manag. 2007, 6, 86–94. [Google Scholar] [CrossRef]
- Mun, W.; Endean, M. Elucidating the aesthetic and operational characteristics of UK boutique hotels. Int. J. Contemp. Hosp. Manag. 2009, 21, 38–51. [Google Scholar]
- EuropeActive & Deloitte. The European Fitness Market. at a Glance. 2019. Available online: http://www2.deloitte.com/content/dam/Deloitte/es/Documents/acerca-de-deloitte/Deloitte-ES-TMT_European-Health-Fitness-Market-2019.pdf (accessed on 16 December 2019).
- García-Fernández, J.; Gálvez-Ruiz, P.; Velez-Colon, L.; Bernal-Garcia, A. Service convenience, perceived value, satisfaction, and loyalty: A study of consumers from low-cost fitness centers in Spain. J. Phys. Educ. Sport 2016, 16, 1146–1152. [Google Scholar]
- Woolf, J. Competitive Advantage in the Health and Fitness Industry: Developing Service Bundles. Sport Manag. Rev. 2008, 11, 51–75. [Google Scholar] [CrossRef]
- Tsitskari, E.; Quick, S.; Tsakiraki, A. Measuring Exercise Involvement Among Fitness Centers’ Members: Is It Related With Their Satisfaction? Serv. Mark. Q. 2014, 35, 372–389. [Google Scholar] [CrossRef]
- Armada-Ros, E.; Martínez-Gallego, F.; Segarra-Vicens, E.; Díaz-Suárez, A.; Armada, E. La satisfacción del usuario como indicador de calidad en el servicio municipal de deportes: Percepción, análisis y evolución. Sport Rev. Euroam. Cienc. Del Deport. 2016, 5, 119–122. [Google Scholar]
- Pastor-Barceló, A.; Alguacil, M. Influencia de la calidad, satisfacción, valor percibido e imagen corporativa en la confianza en la marca en el servicio fitness. Rev. Psicol. del Deport. 2016, 25, 77–80. [Google Scholar]
- Clavel San Emeterio, I.; Iglesias-Soler, E.; Gallardo, L.; Rodriguez-Cañamero, S.; García-Unanue, J. A prediction model of retention in a Spanish fitness centre. Manag. Sport Leis. 2016, 21, 300–318. [Google Scholar] [CrossRef]
- Cho, H.; Sohng, K.Y. The effect of a virtual reality exercise program on physical fitness, Body composition, And fatigue in hemodialysis patients. J. Phys. Sci. 2014, 26, 1661–1665. [Google Scholar] [CrossRef] [PubMed] [Green Version]
- Koh, B.; Hur, J. A Study of the Relationship of Customer Orientation, Customer Satisfaction, Customer Trust and Loyalty of Fitness Center. J. Korea Converg. Soc. 2019, 10, 247–254. [Google Scholar]
- Yusof, A.; Popa, A. Perception of Service Quality among Malaysian University Recreational Fitness Center Users. Int. J. Acad. Res. Bus. Soc. Sci. 2018, 8, 823–833. [Google Scholar] [CrossRef]
- Schroeder, J.; Donlin, A. 2013 IDEA Fitness Programs & Equipment Trends Report. IDEA Fit. J. 2013, 10, 34–35. [Google Scholar]
- Baena-Arroyo, M.J.; Gálvez-Ruiz, P.; Sánchez-Oliver, A.J.; Bernal-García, A. The relationship among service experience, perceived value and behavioural intentions of customers in a group fitness class. J. Sport Psychol. 2016, 25, 89–92. [Google Scholar]
- IHRSA. The IHRSA Global Report 2013; International Health, Racquet & Sportsclub Association: Boston, MA, USA, 2014. [Google Scholar]
- Kassim, M.; Said, M.N.H.M. Data analytics on interactive indoor cycling exercises with virtual reality video games. In Proceedings of the Proceedings-2018 4th International Conference on Control, Automation and Robotics (ICCAR 2018), Auckland, New Zealand, 20–23 April 2018; pp. 321–326. [Google Scholar]
- Shei, R.J. Competitive influences of running applications on training habits. Phys. Sport 2018, 46, 414–415. [Google Scholar] [CrossRef] [PubMed] [Green Version]
- Schwarz, A.; DeSmet, A.; Cardon, G.; Chastin, S.; Costa, R.; Grilo, A.; Ferri, J.; Domenech, J.; Stragier, J. Mobile exergaming in adolescents’ everyday life-contextual design of where, when, with whom, and how: The smartlife case. Int. J. Environ. Res. Public. Heal. 2018, 15, 835. [Google Scholar] [CrossRef] [Green Version]
- Markolefas, F.; Moirogiorgou, K.; Giakos, G.; Zervakis, M. Virtual video synthesis for personalized training. In Proceedings of the 2018 IEEE International Conference on Imaging Systems and Techniques (IST), Krakow, Poland, 16–18 October 2018; pp. 1–6. [Google Scholar]
- Sheehy, L.; Taillon-Hobson, A.; Sveistrup, H.; Bilodeau, M.; Yang, C.; Welch, V.; Hossain, A.; Finestone, H. Home-based virtual reality training after discharge from hospital-based stroke rehabilitation: A parallel randomized feasibility trial. Trials 2019, 20, 1–9. [Google Scholar] [CrossRef]
- Eisapour, M.; Cao, S.; Domenicucci, L.; Boger, J. Virtual Reality Exergames for People Living with Dementia Based on Exercise Therapy Best Practices. Proc. Hum. Factors Erg. Soc. Annu. Meet. 2018, 62, 528–532. [Google Scholar] [CrossRef]
- De Melo, G.E.L.; Kleiner, A.F.R.; Lopes, J.B.P.; Dumont, A.J.L.; Lazzari, R.D.; Galli, M.; Oliveira, C.S. Effect of virtual reality training on walking distance and physical fitness in individuals with Parkinson’s disease. NeuroRehabilitation 2018, 42, 473–480. [Google Scholar] [CrossRef] [PubMed]
- Nikitina, S.; Didino, D.; Baez, M.; Casati, F. Feasibility of Virtual Tablet-Based Group Exercise Among Older Adults in Siberia: Findings From Two Pilot Trials. JMIR mHealth uHealth 2018, 6, e40. [Google Scholar] [CrossRef] [PubMed]
- Radhakrishnan, K.; Baranowski, T.; Julien, C.; Thomaz, E.; Kim, M. Role of Digital Games in Self-Management of Cardiovascular Diseases: A Scoping Review. Games Health J. 2019, 8, 65–73. [Google Scholar] [CrossRef] [PubMed]
- Laver, K.E.; Lange, B.; George, S.; Deutsch, J.E.; Saposnik, G.; Crotty, M. Virtual reality for stroke rehabilitation. Cochrane database of systematic reviews. Cochrane Database Syst. Rev. 2017, 11, 57–62. [Google Scholar]
- Darekar, A.; McFadyen, B.J.; Lamontagne, A.; Fung, J. Efficacy of virtual reality-based intervention on balance and mobility disorders post-stroke: A scoping review. J. Neuroeng. Rehabil. 2015, 12, 1–14. [Google Scholar] [CrossRef] [PubMed] [Green Version]
- Saposnik, G.; Levin, M. Virtual reality in stroke rehabilitation: A meta-analysis and implications for clinicians. Stroke 2011, 42, 1380–1386. [Google Scholar] [CrossRef] [PubMed]
- Calabuig, F.; Núñez-Pomar, J.; Prado-Gascó, V.; Añó, V. Effect of price increases on future intentions of sport consumers. J. Bus. Res. 2014, 67, 729–733. [Google Scholar] [CrossRef]
- Cepeda-Carrión, I.; Cepeda-Carrion, G. How public sport centers can improve the sport consumer experience. Int. J. Sports Mark. Spons. 2018, 19, 350–367. [Google Scholar] [CrossRef]
- Funk, D.C. Introducing a Sport Experience Design (SX) framework for sport consumer behaviour research. Sport Manag. Rev. 2017, 20, 145–158. [Google Scholar] [CrossRef]
- Cronin, J.J.; Brady, M.K.; Hult, G.T.M. Assessing the effects of quality, value, and customer satisfaction on consumer behavioral intentions in service environments. J. Retail. 2000, 76, 193–218. [Google Scholar] [CrossRef]
- Gil-Saura, I.; González-Gallarza, M. La investigación del valor percivido desde el marketing. Innovar. Rev. Cienc. Adm. Y Soc. 2008, 18, 9–17. [Google Scholar]
- Bodet, G. Investigating Customer Satisfaction in a Health Club Context by an Application of the Tetraclasse Model. Eur. Sport Manag. Q. 2006, 6, 149–165. [Google Scholar] [CrossRef]
- Kim, Y.H.; Kim, D.J.; Wachter, K. A study of mobile user engagement (MoEN): Engagement motivations, perceived value, satisfaction, and continued engagement intention. Decis. Support. Syst. 2013, 56, 361–370. [Google Scholar] [CrossRef]
- Greenwell, T.C.; Fink, J.S.; Pastore, D.L. Assessing the Influence of the Physical Sports Facility on Customer Satisfaction within the Context of the Service Experience. Sport Manag. Rev. 2002, 5, 129–148. [Google Scholar] [CrossRef]
- Colmenares, O.; Saavedra, J. Aproximación teórica de la lealtad de marca: Enfoques y valoraciones Theoretical review of the brand loyalty: Approaches and valuations. Cuad. Gestión. 2007, 7, 69–81. [Google Scholar]
- Kleinberger, H.; Badgett, M.; Boyce, M.S. Turning Shoppers into Advocates. The Customer Focused Retail Enterprise; IBM Blobal Services: New York, NY, USA, 2006. [Google Scholar]
- Zomerdijk, L.G.; Voss, C.A. Service Design for Experience-Centric Services. J. Serv. Res. 2009, 13, 67–82. [Google Scholar] [CrossRef]
- García-Fernández, J.; Gálvez-Ruiz, P.; Fernández-Gavira, J.; Vélez-Colón, L.; Pitts, B.; Bernal-García, A. The effects of service convenience and perceived quality on perceived value, satisfaction and loyalty in low-cost fitness centers. Sport Manag. Rev. 2018, 21, 250–262. [Google Scholar] [CrossRef]
- Berry, L.L.; Seiders, K.; Grewal, D. Understanding service convenience. J. Mark. 2002, 66, 1–17. [Google Scholar] [CrossRef]
- Trail, G.T.; Anderson, D.F.; Fink, J.S. Consumer Satisfaction and Identity Theory: A Model of Sport Spectator Conative Loyalty. Sport Mark. Q. 2005, 14, 98–111. [Google Scholar]
- Zeithaml, V.A.; Bitner, M.J. Marketing de Servicios: Un Enfoque de Integración del Cliente a la Empresa; México, D.F., Ed.; McGraw Hill: New York, NY, USA, 2000. [Google Scholar]
- Chang, Y.-W.; Polonsky, M.J. The influence of multiple types of service convenience on behavioral intentions: The mediating role of consumer satisfaction in a Taiwanese leisure setting. Int. J. Hosp. Manag. 2012, 31, 107–118. [Google Scholar] [CrossRef]
- Geissler, G.L.; Rucks, C.T.; Edison, S.W. Understanding the Role of Service Convenience in Art Museum Marketing: An Exploratory Study. J. Hosp. Leis. Mark. 2006, 14, 69–87. [Google Scholar] [CrossRef]
- Colwell, S.R.; Aung, M.; Kanetkar, V.; Holden, A.L. Toward a measure of service convenience: Multiple-item scale development and empirical test. J. Serv. Mark. 2008, 22, 160–169. [Google Scholar] [CrossRef]
- Dai, H. Service Convenience, Trust and Exchange Relationship in Electronic Mediated Environment (EME): An Empirical Study of Chinese Consumers. Int. J. Dependable Trust. Inf. Syst. 2010, 1, 1–24. [Google Scholar] [CrossRef]
- Mathur, T.; Das, G.; Paul, U.K. Convenience, Satisfaction, and Post-Purchase Behavior in India’s Health Insurance Market. J. Glob. Mark. 2016, 29, 218–232. [Google Scholar] [CrossRef]
- Khan, M.A.; Khan, S. Service Convenience and Post-Purchase Behaviour of Online Buyers: An Empirical Study. J. Serv. Sci. Res. 2018, 10, 167–188. [Google Scholar] [CrossRef]
- Clemes, M.D.; Brush, G.J.; Collins, M.J. Analysing the professional sport experience: A hierarchical approach. Sport Manag. Rev. 2011, 14, 370–388. [Google Scholar] [CrossRef]
- Howat, G.; Crilley, G.; Mikilewicz, S.; Edgecombe, S.; March, H.; Murray, D.; Bell, B. Service Quality, Customer Satisfaction and Behavioural Intentions of Australian Aquatic Centre Customers, 1999–2001. Ann. Leis. Res. 2002, 5, 51–64. [Google Scholar] [CrossRef]
- Baker, D.A.; Crompton, J.L. Quality, satisfaction and behavioral intentions. Ann. Tour. Res. 2000, 27, 785–804. [Google Scholar] [CrossRef]
- Thrane, C. Music Quality, Satisfaction, and Behavioral Intentions Within a Jazz Festival Context. Event Manag. 2014, 7, 143–150. [Google Scholar] [CrossRef]
- Tian-Cole, S.H.U.; Cromption, J. A conceptualization of the relationships between service quality and visitor satisfaction, and their links to destination selection. Leis. Stud. 2003, 22, 65–80. [Google Scholar] [CrossRef]
- Murray, D.; Howat, G. The Relationships among Service Quality, Value, Satisfaction, and Future Intentions of Customers at an Australian Sports and Leisure Centre. Sport Manag. Rev. 2002, 5, 25–43. [Google Scholar] [CrossRef]
- Kouthouris, C.; Alexandris, K. Can service quality predict customer satisfaction and behavioral intentions in the sport tourism industry? An application of the SERVQUAL model in an outdoors setting. J. Sport Tour. 2005, 10, 101–111. [Google Scholar] [CrossRef]
- Kim, H.-B.; Jung, H.-C.; Song, J.-K.; Chai, J.-H.; Lee, E.-J. A follow-up study on the physique, body composition, physical fitness, and isokinetic strength of female collegiate Taekwondo athletes. J. Exerc. Rehabil. 2015, 11, 57–64. [Google Scholar] [CrossRef] [PubMed]
- Orsingher, C.; Marzocchi, G.L. Hierarchical representation of satisfactory consumer service experience. Int. J. Serv. Ind. Manag. 2003, 14, 200–216. [Google Scholar] [CrossRef]
- Otto, J.E.; Ritchie, J.R.B. The service experience in tourism. Tour. Manag. 1996, 17, 165–174. [Google Scholar] [CrossRef]
- García-Fernandez, J. La Fidelidad de Clientes en Centros de Fitness Privados Españoles: La Cadena de Creación y Percepción de Valor; Universidad de Sevilla: Sevilla, España, 2012. [Google Scholar]
- Oliver, R.L. Whence Consumer Loyalty? J. Mark. 1999, 63, 33–44. [Google Scholar] [CrossRef]
- Avourdiadou, S.; Theodorakis, N.D. The development of loyalty among novice and experienced customers of sport and fitness centres. Sport Manag. Rev. 2014, 17, 419–431. [Google Scholar] [CrossRef]
- Duque, E. Del servicio y sus modelos de medición. Rev. Innovar 2005, 15, 64–80. [Google Scholar]
- Setó-Pàmies, D. La fidelidad del cliente en el ámbito de los servicios: Un análisis de la escala “intenciones de comportamiento”. Investig. Eur. Dir. Y Econ. La Empres. 2003, 9, 189–204. [Google Scholar]
- Bentler, P. EQS 6 Structural Equations Program. Manual; Multivaria: Encino, CA, USA, 2002. [Google Scholar]
- Hair, J.F.; Ringle, C.M.; Sarstedt, M. PLS-SEM: Indeed a Silver Bullet. J. Mark. Theory Pract. 2011, 19, 139–152. [Google Scholar] [CrossRef]
- Worthington, R.L.; Whittaker, T.A. Scale Development Research: A Content Analysis and Recommendations for Best Practices. Couns. Psychol. 2006, 34, 806–838. [Google Scholar] [CrossRef]
- Arbuckle, J. Amos18 Reference Guide (Version 18); Statistica: Chicago, IL, USA, 2009. [Google Scholar]
- Blunch, N.J. Introduction to Structural Equation Modeling Using SPSS and AMOS; SAGE: Thousand Oaks, CA, USA, 2008. [Google Scholar]
- Timithy, A. Confirmatory Factor Analysis for Applied; Guilford: New York, NY, USA, 2006. [Google Scholar]
- Byrne, B.M. Structural Equation Modeling With AMOS, EQS, and LISREL: Comparative Approaches to Testing for the Factorial Validity of a Measuring Instrument. Int. J. Test. 2001, 1, 55–86. [Google Scholar] [CrossRef]
- Wang, J.; Wang, X. Structural Equation Modeling Applications Using Mplus; John Wiley & Sons Ltd: Chichester, UK, 2012. [Google Scholar]
- Bagozzi, R.P.; Yi, T. On the evaluation of structural equation models. J. Acad. Mark. Sci. 1988, 16, 74–94. [Google Scholar] [CrossRef]
- Hair, J.F.; Black, W.C.; Babin, B.J.; Anderson, R.E. Multivariate Data Analyses, 7th ed.; Prentice Hall: New York, NY, USA, 2009. [Google Scholar]
- Fornell, C.; Larcker, D.F. Evaluating Structural Equation Models with Unobservable Variables and Measurement Error. J. Mark. Res. 1981, 18, 39–50. [Google Scholar] [CrossRef]
- Gálvez-Ruiz, P.; Conde-Pascual, E.; Estrella-Andrade, A.; García-Fernández, J.; Romero-Galisteo, R.P.; Vélez-Colón, L.; Pitts, B.G. Testing factorial invariance of the questionnaire of evaluation of the quality perceived in sports services in Spanish. Curr. Psychol. 2018. [Google Scholar] [CrossRef]
- Yanni, A. Customers’ expectations of service in Greek fitness centers. Manag. Serv. Qual. Int. J. 2005, 15, 245–258. [Google Scholar]
- García-Ferrando, M.; Llopis-Goig, R. Encuesta Sobre los Hábitos Deportivos en España. Ideal Democrático y Bienestar Personal; Consejo Superior de Deportes y Centro de Investigaciones Sociológicas: Madrid, España, 2011. [Google Scholar]
- Muyor, J.M.; Águila, C.; Sicilia, A.; Orta, A. Assessing user’s motivation in sport centers. Rev. Int. Med. Y Cienc. La Act. Física Y El Deport. 2009, 9, 67–80. [Google Scholar]
- Barros, C.; Gonçalves, L. Investigating individual satisfaction in health and fitness training centres. Int. J. Sport Man. Mark. 2009, 5, 384–395. [Google Scholar] [CrossRef]
- Nuviala-Nuviala, A.; Tamayo-Fajardo, J.; Iranzo-Llopis, J.; Falcón-Miguel, D. Creación, diseño, validación y puesta en práctica de un instrumento de medición de la satisfacción de usuarios de organizaciones que prestan servicios deportivos. Retos: Nuevas Tend. En Educ. FísicaDeport. Y Recreación 2008, 2008, 10–16. [Google Scholar]
- Baena-Arroyo, J.; García-Fernández, J.; Bernal-García, A.; Lara-Bocanegra, A.; Gálvez-Ruiz, P. El valor percibido y la satisfacción del cliente en actividades dirigidas virtuales y con técnico en centros de fitness. Rev. Psicol. Del Deport. 2016, 25, 219–227. [Google Scholar]
- Theodorakis, N.D.; Howat, G.; Ko, Y.J.; Avourdiadou, S. A comparison of service evaluation models in the context of sport and fitness centres in Greece. Manag. Leis. 2014, 19, 18–35. [Google Scholar] [CrossRef]
- Silla-Merchán, A.; Calabuig-Moreno, F.; Añó-Sanz, V. Emociones, satisfacción e intenciones futuras de los usuarios de actividades dirigidas de un centro deportivo. J. Sports Econ. Manag. 2014, 4, 22–38. [Google Scholar]
- Calabuig, F.; Burillo, P.; Crespo, J.; Mundina, J.J.; Gallardo, L. Satisfacción, calidad y valor percibido en espectadores de atletismo. Rev. Int. Med. Y Cienc. La Act. Física Y Del Deport. 2010, 10, 577–593. [Google Scholar]
- González-Gallarza, M.; Gil-Saura, I. Desarrollo de una escala multidimensional para medir el valor percibido de una experiencia de servicio. Rev. Española Investig. Mark. 2006, 10, 25–60. [Google Scholar]
- Hightower, R.; Brady, M.K.; Baker, T.L. Investigating the role of the physical environment in hedonic service consumption: An exploratory study of sporting events. J. Bus. Res. 2002, 55, 697–707. [Google Scholar] [CrossRef]


| IFC | VFC | TOTAL | ||||
|---|---|---|---|---|---|---|
| N | % | N | % | N | % | |
| Male | 251 | 22.0 | 368 | 46.0 | 619 | 31.9 |
| Female | 892 | 78.0 | 432 | 54.0 | 1324 | 68.1 |
| Between 16–18 years old | 42 | 3.7 | 66 | 8.3 | 108 | 5.6 |
| 19–30 years old | 391 | 34.2 | 269 | 33.6 | 660 | 34.0 |
| 31–40 years old | 306 | 26.8 | 236 | 29.5 | 542 | 27.9 |
| 41–50 years old | 254 | 22.2 | 143 | 17.9 | 397 | 20.4 |
| 51–60 years old | 110 | 9.6 | 63 | 7.9 | 173 | 8.9 |
| More 60 years old | 40 | 3.5 | 23 | 2.9 | 63 | 3.2 |
| Service experience |
| Hedonic |
| This activity produces a pleasant feeling of wellbeing in me (Hed_1) |
| The activity contributes to alleviating my problems (Hed_2) |
| This activity covers my needs (Hed_3) |
| In this activity I relax from tension (Hed_4) |
| In this activity my privacy/safety are guaranteed (Hed_5) |
| Social |
| Doing this activity is an unforgettable and/or stimulating experience (Soc_6) |
| Doing this activity is a new and different experience (Soc_7) |
| Doing this activity is an escape from routine (Soc_8) |
| By doing this activity I socialize with other people (Soc_9) |
| Doing this activity contributes to improving my personal happiness (Soc_10) |
| Utilitarian |
| By doing this activity I feel part of the service provision process (Util_11) |
| During time doing the activity, I try to collaborate so that the experience of the service is more satisfactory (Util_12) |
| The staff inform me of everything necessary during my time doing the activity (Util_13) |
| I feel that the result of the service provision is under my control (Util_14) |
| I was right to do this activity. The service received corresponds to what I expect from a good directed activity (Util_15) |
| I really enjoy doing this activity (Util_16) |
| Service convenience |
| Access |
| It did not take much time to reach this fitness center (Acc_1) |
| I can easily figure out the location of this fitness center (Acc_2) |
| Transaction |
| The method of payment provided by this fitness center is convenient (Trans_3) |
| I was able to complete my purchase quickly in this fitness center (Trans_4) |
| Benefit |
| I could easily obtain benefits from the services provided in this fitness center (Ben_5) |
| The speed of providing services in this fitness center met my requirements (Ben_6) |
| Post-benefit |
| When I had a problem, this fitness center resolved my problem quickly (PBen_7) |
| This fitness center enabled me to arrange my next exercise programs/plans with minimal effort (PBen_8) |
| Satisfaction |
| I’m satisfied with this activity (Sat_1) |
| In general, I’m delighted when I do this activity (Sat_2) |
| I have a satisfactory experience doing this activity (Sat_3) |
| My decision to choose this activity was right (Sat_4) |
| In general, I’m satisfied with this activity (Sat_5) |
| I think I did what was right when I decided to do this activity (Sat_6) |
| Future intentions |
| Loyalty |
| I’ll convey positive aspects about the activity to other people (Loy_1) |
| I’ll recommend the activity to anyone who seeks my advice (Loy_2) |
| I’ll encourage my friends and family to practice this type of activity (Loy_3) |
| For any activity I want to do, I’ll consider this type of activity as the first option (Loy_4) |
| In the coming years, I’ll do more sports activities of this kind (Loy_5) |
| In the coming years, I’ll do less sports activities of this kind (Loy_6) |
| I may do another type of sports activities in my sports center (Loy_7) |
| Pay more |
| Although the prices are somewhat higher for this type of activity I’ll remain in this sports center (PM_8) |
| I’m willing to pay a higher price to do this type of activity (PM_9) |
| Complaining Behavior |
| I’ll change to other activities if I have a problem during the service (CBeh_10) |
| If I have a negative experience with the activity, I’ll tell other customers/people about it (CBeh_11) |
| If I have a problem with the type of activity, I’ll complain to external organizations such as the Association of Consumers and Users (CBeh_12) |
| If I have a problem with the activity, I’ll complain to the directors of the sports center (CBeh_13) |
| Scales and Dimensions | Cronbach’s Alpha | CR | AVE | Item | Standardized Factor Loading (λ) | Regression Weights | |
|---|---|---|---|---|---|---|---|
| N-Stand | Stand | ||||||
| Service experience | |||||||
| Hedonic | 0.92 | 0.92 | 0.71 | Hed_1 | 0.889 | 1.00 | 0.89 |
| Hed_2 | 0.804 | 0.97 | 0.80 | ||||
| Hed_3 | 0.878 | 1.04 | 0.88 | ||||
| Hed_4 | 0.883 | 1.01 | 0.88 | ||||
| Hed_5 | 0.740 | 0.89 | 0.74 | ||||
| Social | 0.89 | 0.90 | 0.63 | Soc_6 | 0.868 | 1.00 | 0.86 |
| Soc_7 | 0.736 | 0.87 | 0.74 | ||||
| Soc_8 | 0.813 | 0.91 | 0.81 | ||||
| Soc_9 | 0.694 | 0.95 | 0.70 | ||||
| Soc_10 | 0.854 | 1.00 | 0.85 | ||||
| Utilitarian | 0.91 | 0.92 | 0.70 | Util_11 | 0.773 | 1.00 | 0.77 |
| Util_13 | 0.774 | 1.08 | 0.77 | ||||
| Util_14 | 0.764 | 0.91 | 0.76 | ||||
| Util_15 | 0.921 | 1.12 | 0.92 | ||||
| Util_16 | 0.932 | 1.09 | 0.93 | ||||
| Service convenience | |||||||
| Access | 0.77 | 0.79 | 0.66 | Acc_1 | 0.739 | 1.00 | 0.76 |
| Acc_2 | 0.878 | 0.99 | 0.86 | ||||
| Transaction | 0.81 | 0.82 | 0.69 | Trans_3 | 0.809 | 1.00 | 0.80 |
| Trans_4 | 0.850 | 1.04 | 0.86 | ||||
| Benefit | 0.87 | 0.88 | 0.78 | Ben_5 | 0.850 | 1.00 | 0.86 |
| Ben_6 | 0.914 | 1.02 | 0.91 | ||||
| Post-benefit | 0.78 | 0.79 | 0.65 | PBen_7 | 0.834 | 1.00 | 0.83 |
| PBen_8 | 0.780 | 0.86 | 0.79 | ||||
| Satisfaction | 0.98 | 0.98 | 0.90 | ||||
| Sat_1 | 0.923 | 1.00 | 0.95 | ||||
| Sat_2 | 0.936 | 1.02 | 0.96 | ||||
| Sat_3 | 0.9 | 1.02 | 0.96 | ||||
| Sat_4 | 0.958 | 0.98 | 0.95 | ||||
| Sat_5 | 0.964 | 0.99 | 0.94 | ||||
| Sat_6 | 0.953 | 1.00 | 0.92 | ||||
| Future Intentions | |||||||
| Loyalty | 0.91 | 0.93 | 0.75 | Loy_1 | 0.925 | 1.00 | 0.93 |
| Loy_2 | 0.946 | 1.05 | 0.95 | ||||
| Loy_3 | 0.940 | 1.05 | 0.94 | ||||
| Loy_4 | 0.838 | 1.01 | 0.84 | ||||
| Loy_5 | 0.626 | 0.99 | 0.63 | ||||
| Pay more | 0.70 | 0.73 | 0.58 | PM_8 | 0.610 | 1.00 | 0.93 |
| PM_9 | 0.889 | 0.66 | 0.56 | ||||
| Complaining | 0.76 | 0.81 | 0.51 | CBeh_10 | 0.695 | 1.00 | 0.58 |
| Behavior | CBeh_11 | 0.690 | 1.21 | 0.69 | |||
| CBeh_12 | 0.781 | 1.57 | 0.79 | ||||
| CBeh_13 | 0.690 | 1.23 | 0.69 | ||||
| Variables | HED | SOC | UTIL | ACC | TRANS | BEN | PBEN | SAT | LOY | PM | CBEH |
|---|---|---|---|---|---|---|---|---|---|---|---|
| HED | 0.71 | ||||||||||
| SOC | 0.61 | 0.63 | |||||||||
| UTILIT | 0.66 | 0.60 | 0.70 | ||||||||
| ACC | 0.28 | 0.21 | 0.26 | 0.66 | |||||||
| TRANS | 0.26 | 0.24 | 0.28 | 0.62 | 0.69 | ||||||
| BENEF | 0.37 | 0.34 | 0.39 | 0.54 | 0.65 | 0.78 | |||||
| PBENEF | 0.31 | 0.31 | 0.35 | 0.33 | 0.61 | 0.62 | 0.65 | ||||
| SATISF | 0.70 | 0.61 | 0.68 | 0.26 | 0.28 | 0.38 | 0.33 | 0.90 | |||
| LOYAL | 0.68 | 0.60 | 0.70 | 0.26 | 0.27 | 0.37 | 0.30 | 0.70 | 0.75 | ||
| PMORE | 0.19 | 0.21 | 0.23 | 0.11 | 0.16 | 0.23 | 0.25 | 0.24 | 0.31 | 0.58 | |
| CBEHAV | 0.08 | 0.06 | 0.06 | 0.08 | 0.05 | 0.03 | 0.04 | 0.07 | 0.11 | 0.09 | 0.51 |
© 2020 by the authors. Licensee MDPI, Basel, Switzerland. This article is an open access article distributed under the terms and conditions of the Creative Commons Attribution (CC BY) license (http://creativecommons.org/licenses/by/4.0/).
Share and Cite
Baena-Arroyo, M.J.; García-Fernández, J.; Gálvez-Ruiz, P.; Grimaldi-Puyana, M. Analyzing Consumer Loyalty through Service Experience and Service Convenience: Differences between Instructor Fitness Classes and Virtual Fitness Classes. Sustainability 2020, 12, 828. https://doi.org/10.3390/su12030828
Baena-Arroyo MJ, García-Fernández J, Gálvez-Ruiz P, Grimaldi-Puyana M. Analyzing Consumer Loyalty through Service Experience and Service Convenience: Differences between Instructor Fitness Classes and Virtual Fitness Classes. Sustainability. 2020; 12(3):828. https://doi.org/10.3390/su12030828
Chicago/Turabian StyleBaena-Arroyo, Manuel Jesús, Jerónimo García-Fernández, Pablo Gálvez-Ruiz, and Moisés Grimaldi-Puyana. 2020. "Analyzing Consumer Loyalty through Service Experience and Service Convenience: Differences between Instructor Fitness Classes and Virtual Fitness Classes" Sustainability 12, no. 3: 828. https://doi.org/10.3390/su12030828